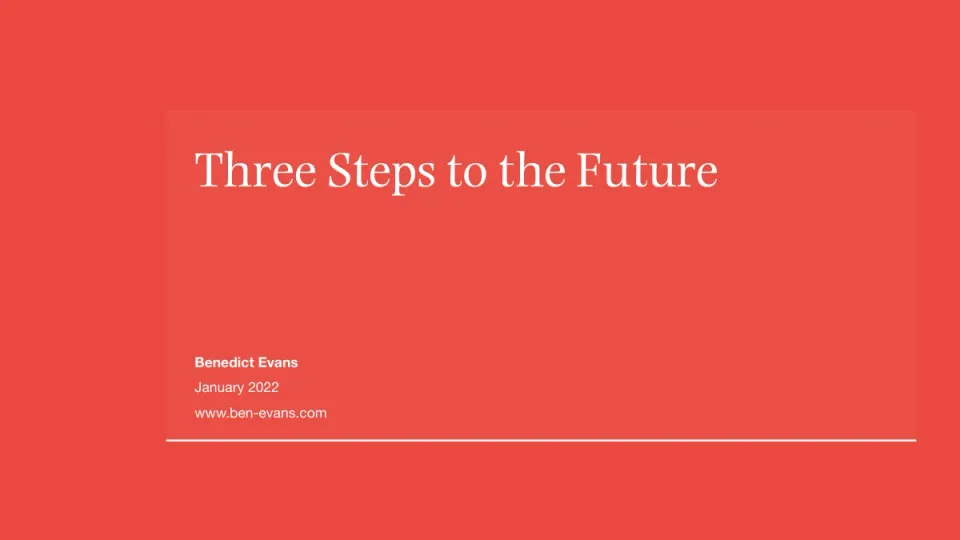
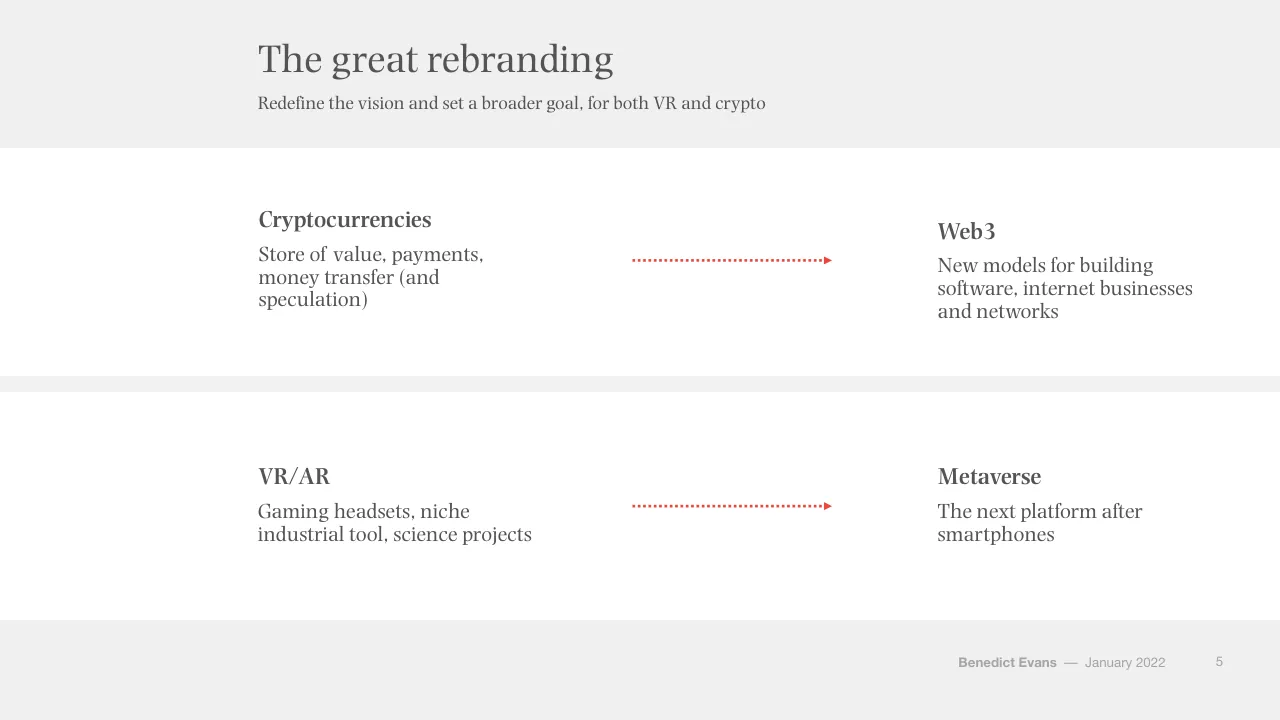
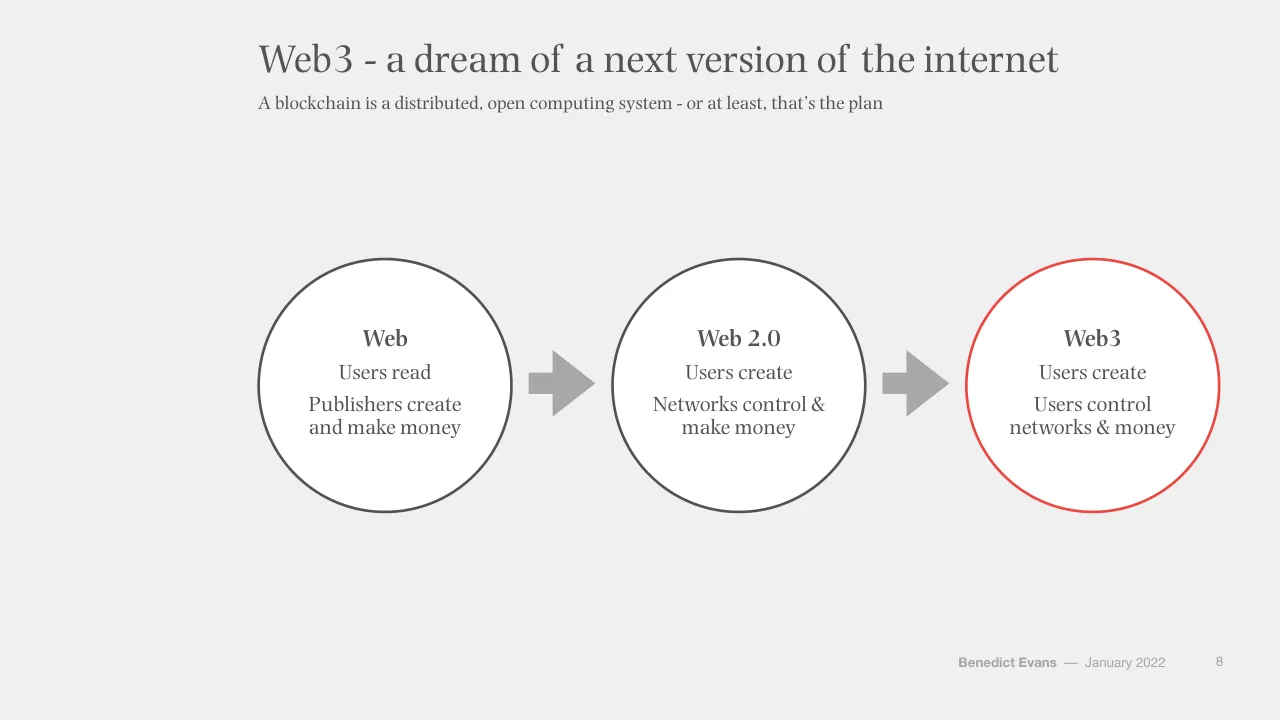
The deck opens with a title slide and a three-part framing: future, present and past, shown as three circles. It then moves through the future section on tech visions for 2030, covering the Web3 and metaverse narratives, and tests them against market data and history. The present section looks at what startups and enterprises are deploying, with a focus on cloud, SaaS and workflow software. The past section traces how the internet has disrupted older industries, using music, television, retail and newspapers as cases. The closing section ties the three parts together and reflects on the scale of tech investment. Slides worth studying include the 'great rebranding' slide, which uses a simple two-column layout to recast crypto and VR, and the Web3 evolution diagram on slide 8, which places three stages on one arrow. The deck relies heavily on sourced line and bar charts with short headline titles and a subtitle that carries the argument, and it uses a restrained palette of red accents on grey.
Slides worth studying
Questions about this deck
How many slides does the Benedict Evans presentation deck have, and how is it structured?
The deck has 94 slides. Slide 2 divides it into three parts shown as circles: Future (tech visions for 2030), Present (startups deploying the ideas of the 2010s) and Past (the old economy disrupted by ideas from the 2000s).
What does the Benedict Evans deck say about how far the move to cloud has gone?
Slide 38, titled 'The move to cloud is still just beginning', states that only 10-15% of enterprise IT spending has moved to the cloud so far. The same slide's subtitle adds a figure of 20-30% for workflows.
What does the Benedict Evans deck say about VR traction so far?
Slide 23 says there is growing interest and that Oculus Quest 2 sold 10m units in 12 months, but it did not surge in lockdown. The slide's source is Google Trends.
What does the Benedict Evans deck say about Web3 compared with Web 2.0?
Slide 8, titled 'Web3 - a dream of a next version of the internet', places Web 2.0, where users read and publishers create and make money, beside Web3, where users create and users control networks and money. The slide states that a blockchain is a distributed, open computing system, or at least that is the plan.
Details
- Company: Benedict Evans
- Year: 2022
- Type: Strategy presentation
- Industry: Technology
- Pages: 94
More from Benedict Evans
- Benedict Evans conference talk, 2026
- Benedict Evans conference talk, Autumn 2025
- Benedict Evans conference talk, Spring 2025
- Benedict Evans conference talk, 2023
- Benedict Evans conference talk, 2023
- Benedict Evans conference talk, 2021
All Benedict Evans decks in the library
Review score: 8 out of 10, Strong
Presentation quality, judged with the SlideDeck Co review heuristic. Ask, evidence and idea merit are not rated here.
The deck has a clear three-part route (future, present, past) set up on slide 2 and signposted by dark divider slides at 3, 35 and 49. Each content slide has a short title with a subtitle that carries the point, and the sourced charts (11, 26, 38, 54, 62) are cleanly drawn with red used to mark the series that matters. The restrained red-on-grey identity, consistent footer and mix of diagrams, charts and product screenshots keep the rhythm steady across a long deck. Weaknesses are small text in subtitles, footers and chart axes, sparse or empty divider and quote slides, and some repetitive three-circle diagrams that add little beyond a bullet list.
Worth keeping: Keep the title-plus-argument-subtitle pattern, the red highlight on the key series in charts, and the two-column before/after layouts such as slide 5.
Most useful repair: Enlarge subtitle, axis, legend and source text, and put the legends closer to the data on slides 11, 24 and 42.
What would change the score: Replace the repeated three-circle diagrams (slides 13, 18, 21, 30, 48) with more varied or more informative visuals, and trim the near-empty divider slides.
Confidence medium. 72 of 94 pages inspected on contact sheets, 4 at readable size. Reviewed 2026-11-08. Model-assisted review (claude-sonnet-5-5).
Full text of the slides (94 slides)
Every slide's words and a description of its charts and images, so the deck can be searched and rebuilt. Also available as Markdown.
Slide 1
Three Steps to the Future / Benedict Evans / January 2022 / www.ben-evans.com / Benedict Evans –– December 2020
Slide 2
Three steps to the future / Three trends in 2021 - visions versus deployment and disruption / Future / Tech visions / for 2030 / Present / Startups deploy / the ideas of the / 2010s / Past / Old economy / disrupted by ideas / from the 2000s / Benedict Evans –– January 2022 / 2
Visuals: Three identical white circles with thin red outlines, arranged left to right in a row. Each circle contains a bold heading (Future, Present, Past) and a short centred text line below it. No photographs, charts or icons.
Slide 3
Future
Benedict Evans —— January 2022
3
Slide 4
Tech visions for 2030
What do tech people think about for the next decade?
Web3
Metaverse
Everything else
LEO satellites, plant-based meat,
AI, ESG, quantum, robotics,
ASICs, 3D printing, China, edge
computing, neural interfaces,
computational biology, vertical
farming, autonomous cars,
drones, EVs,…
Benedict Evans — January 2022
4
Visuals: Two solid red circles of equal size (diameter about 12.1% of slide width) side by side, centred vertically in the content area. Left circle labelled 'Web3' in white, right circle labelled 'Metaverse' in white. A vertical dotted line in red runs from about y 17.5% to 78% of slide height at x about 56% of slide width, dotted with small square dashes and roughly 0.4% of slide width thick. No photographs, charts or logos.
Slide 5
The great rebranding
Redefine the vision and set a broader goal, for both VR and crypto
Cryptocurrencies
Store of value, payments, / money transfer (and / speculation)
Web3
New models for building / software, internet businesses / and networks
VR/AR
Gaming headsets, niche / industrial tool, science projects
Metaverse
The next platform after / smartphones
Benedict Evans — January 2022
5
Visuals: Two red dotted horizontal arrows, each with a solid triangular arrowhead pointing right. Arrow 1 runs from about 49.4% to 65.0% of slide width at about 36% of slide height, connecting the Cryptocurrencies block on the left to the Web3 block on the right. Arrow 2 runs from about 49.4% to 65.0% of slide width at about 70% of slide height, connecting the VR/AR block to the Metaverse block. Dotted line of small evenly spaced red dashes, approximately 0.6% of slide height thick, colour about #E84A3F. No photographs, charts, logos or icons.
Slide 6
Web3 / Benedict Evans –– January 2022 / 6
Slide 7
“The Holy Roman Empire is neither holy, nor / Roman, nor an empire” - Voltaire / ‘Cryptocurrency’ is neither secret nor (only) a currency, / ‘blockchain’ or ‘DLT’ are not databases… / Benedict Evans –– January 2022 / 7
Slide 8
Web3 - a dream of a next version of the internet
A blockchain is a distributed, open computing system - or at least, that’s the plan
Web
Users read
Publishers create
and make money
Web 2.0
Users create
Networks control &
make money
Web3
Users create
Users control
networks & money
Benedict Evans
–– January 2022
8
Visuals: Three white circles of equal size (about 21.7% of slide width each) with thin dark grey outlines, connected left to right by two solid grey block arrows. Circle 1 (left) and circle 2 (centre) have dark grey #545454 outlines of about 0.3% of slide height; circle 3 (right) has a red #E74C3C outline of the same weight, highlighting it. Each circle holds three stacked centred text lines: a bold heading, then two body lines. Left circle: Web / Users read / Publishers create and make money. Centre circle: Web 2.0 / Users create / Networks control & make money. Right circle: Web3 / Users create / Users control networks & money. Arrow 1 is a block arrow with a rectangular shaft and triangular head pointing right, fill #A7A7A7, between circles 1 and 2. Arrow 2 is identical, between circles 2 and 3. No photographs, logos or charts.
Slide 9
Web3 = Open Source 2 / Open source changed how code is written - Web3 tries to change where it runs / Open Source / Open, distributed code creation / No direct revenue / Web & SaaS / Mostly powered by Open Source / But controlled, run & sold centrally / Web3 / Open code / Open & distributed execution / Integrated revenue / Benedict Evans — January 2022 / 9
Visuals: Three white circles of equal size in a horizontal row, each with a text stack inside, joined left to right by two solid light-grey block arrows. Circle 1 (Open Source) has a solid dark grey outline. Circle 2 (Web & SaaS) has a dotted dark grey outline. Circle 3 (Web3) has a solid red outline. Arrow 1 sits between circles 1 and 2 and arrow 2 sits between circles 2 and 3; both point right. No photographs, logos or charts.
Slide 10
A messianic vision for tech
Like open source and the internet in their early days, a tech movement with a strong dose of religion
Closed and centralised
Open and decentralised
Companies make money
Users make money
All the old problems
All the old problems, in
exciting new ways
Benedict Evans
–– January 2022
10
Visuals: Three red dotted arrows, one in each white row, horizontally oriented, pointing right from the left phrase toward the right phrase. Each arrow runs from about x 49.4% to 65.0% of slide width, with a small solid triangular arrowhead at the right end. Arrow colour is about #E8474A (red), with a dot pattern of small evenly spaced round dots, approximately 0.5% of slide height in diameter. No photographs, charts, logos or icons.
Slide 11
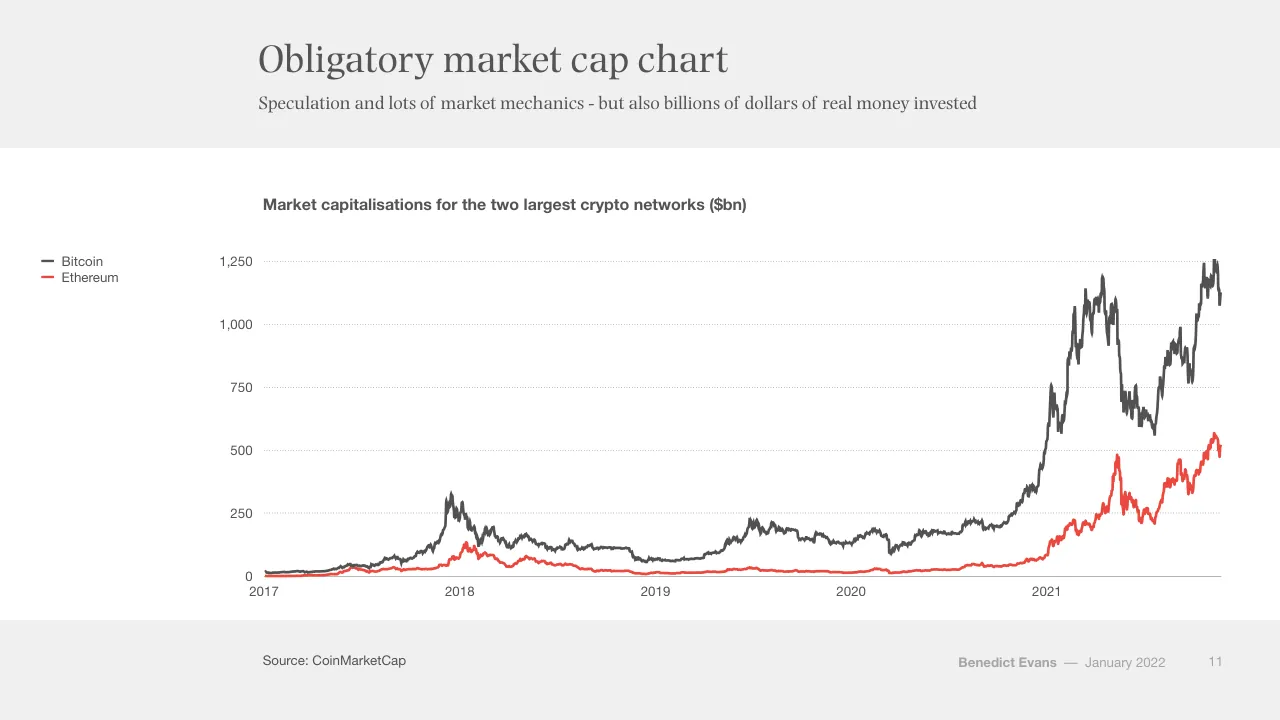
Obligatory market cap chart / Speculation and lots of market mechanics - but also billions of dollars of real money invested / Market capitalisations for the two largest crypto networks ($bn) / Bitcoin / Ethereum / 1,250 / 1,000 / 750 / 500 / 250 / 0 / 2017 / 2018 / 2019 / 2020 / 2021 / Source: CoinMarketCap / Benedict Evans / –– January 2022 / 11
Visuals: Line chart titled 'Market capitalisations for the two largest crypto networks ($bn)'. Y axis: market capitalisation in $bn, range 0 to 1,250 with gridlines at 250, 500, 750, 1,000 and 1,250 (dotted light grey horizontal lines). X axis: years 2017, 2018, 2019, 2020, 2021 with the time series running from 2017 to late 2021/early 2022. Series 1 Bitcoin: dark grey (#545454) line; about 15 in early 2017, about 330 near late 2017 peak around early 2018 (about 320 peak), about 60-150 through 2018-2020, rising to about 1,250 peak at the far right with about 1,100 at the end, peaking near 1,200 mid-2021 and a dip to about 550 in mid-late 2021. Series 2 Ethereum: red (#E84C3D-like) line; near 0 in 2017, about 130 peak early 2018, about 30 through 2019, about 50 in 2020, about 480 peak mid-2021, about 570 peak late 2021 and about 500 at the end. Legend at left: dark grey line marker labelled Bitcoin, red line marker labelled Ethereum. No individual points are highlighted. Chart sits on white.
Slide 12
The ‘store of value’ use case
Digital assets as a store of value are now taken somewhat seriously in financial markets
Current asset value, 2021 ($tr)
100
75
50
25
0
Crypto assets
Fed balance sheet
All above-ground gold
US M2 Money Supply
Corporate bonds
Government bonds
Source: CoinMarketCap, US Federal Reserve, World Gold Council, Bloomberg
Benedict Evans — January 2022
12
Visuals: Bar chart, vertical, titled 'Current asset value, 2021 ($tr)'. Y-axis labelled in $tr with ticks 0, 25, 50, 75, 100 (range 0 to 100, dotted light grey gridlines at each tick). X-axis categories, left to right: Crypto assets, Fed balance sheet, All above-ground gold, US M2 Money Supply, Corporate bonds, Government bonds. Values are not printed; estimates: Crypto assets about 2.5, Fed balance sheet about 8, All above-ground gold about 12, US M2 Money Supply about 20, Corporate bonds about 41, Government bonds about 87. One series, bars dark grey #535353 except the Crypto assets bar, which is red (about #E8453C) and highlighted. Bars are evenly spaced, of equal width, rising from a thin grey baseline. No legend.
Slide 13
Traction for software use cases?
Behind the speculation and market caps, what’s the traction for applications?
3-4m addresses & $60-70bn linked to DeFi apps (?)
10m+ Metamask MAUs
200k OpenSea accounts
450k ENS domains
Source: Dune Analytics @rchen8, DeFi Pulse, Companies
Benedict Evans
–– January 2022
13
Visuals: Four solid red filled circles of identical size (each about 16.2% of slide width by 28.8% of slide height, so visually circular), in a row. Circle 1 at x 19.4%, y 39.1%; circle 2 at x 39.6%, y 39.1%; circle 3 at x 59.7%, y 39.1%; circle 4 at x 79.8%, y 39.1%. Fill #EB483F, flat, no outline, no shadow, no gradient. Each circle holds centred white serif text giving one figure and label: '3-4m addresses & $60-70bn linked to DeFi apps (?)', '10m+ Metamask MAUs', '200k OpenSea accounts', '450k ENS domains'. No charts, photographs, logos or icons.
Slide 14
NFTs, today’s white-hot idea
Explosion of interest and quoted value
‘Cultural value’ versus ‘intrinsic value’ is not a problematic / concept - ask Supreme
But tiny absolute numbers of people so far - by design! - and / lots of noise and circularity
Interesting as experiments in digital property…
But also a tech building block with broader use cases
Source: OpenSea
Benedict Evans — January 2022
14
Visuals: One photograph-style screenshot of a web browser window showing the OpenSea 'Top NFTs' page, placed at x 58.1%, y 13.1%, w 34.8%, h 73.8% (669 by 797 px). Browser chrome is light grey (#E8E8E8) with three grey traffic-light dots at top left and a rounded address bar reading 'opensea.io' with a padlock and reload icon. Below: OpenSea logo (blue circle #2081E2 with white sail mark, wordmark 'OpenSea' in bold black) at left, a rounded search field with magnifier icon and placeholder 'Search items, collections, and accounts', and a hamburger menu icon at right. Heading 'Top NFTs' in large bold black sans-serif, centred; subtitle 'The top NFTs on OpenSea, ranked by volume, floor price and other statistics.' in grey. Three white rounded filter dropdowns with grey borders: 'Last 7 days', 'Art' with a blue icon, 'All chains' with a link icon, each with a chevron. Ranked list row 1: '1' then circular avatar of Bored Ape Yacht Club, bold name 'Bored Ape Yacht Club', subtext '- Less', price '7,377.98' with ETH diamond icon and '-3.54%' in red; stats row with labels '7d %' value '-70.58%' (red), 'Floor Price' value '44.89' with ETH icon, 'Owners' value '5.9K', 'Items' value '10.0K'. Row 2: '2' then circular avatar of CryptoPunks (teal background with pixel character), bold name 'CryptoPunks', subtext '+ More', price '6,482.77' with ETH icon and '+100.79%' in green. Footer pagination: left button '< 1 - 100' greyed, right button '101 - 201 >' outlined. Screenshot has a soft drop shadow and no crop; it is shown fully, boxed within the white panel. Lighting is flat, even, and dominant colours are white, light grey, black, and blue #2081E2 accent with red #E5484D and green #00C46A figures.
Slide 15
New incentive structures
Helium is a distributed network of low power, low
bandwidth, IoT radio access points
Decentralised incentives, tracking and payment
Source: Helium
Benedict Evans
–– January 2022
15
Visuals: Full-bleed dark map of the San Francisco Bay Area (right half, x 47.1 to 100, full height) in a dark slate-blue street-map style with place labels in small pale text including Novato, Vallejo, Antioch, Concord, Richmond, San Ramon, Pleasanton, San Francisco, South San Francisco, Princeton-by-the-Sea, Fremont, Milpitas-area label Stanford (partly visible as 'Stanford'), Lobitos, San Jose and Woodville. Overlaid are hexagonal coverage cells clustered along the bay shoreline and corridors: green hexagons indicate sparser coverage in the north and east, and orange-to-red hexagons indicate denser coverage concentrated around San Francisco, the East Bay corridor and the peninsula down to San Jose. The map is not cropped in a box; it is full-bleed to the right and top and bottom edges. Dominant colours: dark navy-slate #1E2D4A base with green #00B050-like and orange-red #D9703A-like hexagons. No chart axes or legend are printed.
Slide 16
A nice adoption curve / Helium proposes a scalable incentive and payment model for a public wireless network / Active Helium hotspots / 350,000 / 300,000 / 250,000 / 200,000 / 150,000 / 100,000 / 50,000 / 0 / September 2019 / March 2020 / September 2020 / March 2021 / September 2021 / Source: Helium / Benedict Evans —— January 2022 / 16
Visuals: Line chart titled 'Active Helium hotspots'. Type: single smoothed line series in red (about #E8453C), stroke about 2 px wide, no markers. Y-axis: number of active hotspots, range 0 to 350,000, labelled gridlines at 0, 50,000, 100,000, 150,000, 200,000, 250,000, 300,000, 350,000; light grey dotted horizontal gridlines (about #BFBFBF) at each labelled value. X-axis: time, labelled at September 2019, March 2020, September 2020, March 2021, September 2021; thin grey baseline at 0. Series shape: starts near 0 in September 2019, rises slowly to roughly 5,000 by late 2020 (about), climbs to roughly 20,000 by March 2021 (about), then rises steeply to about 320,000 at the right end near September 2021 to January 2022 (about). No legend; no highlighted points; no data labels.
Slide 17
What are we looking at?
Massive noise, hype and irrational criticism from all directions
Market caps?
A share price is an opinion of the future; / operating metrics are data about the / present
A token price is neither, and both
So - is speculation validation?
Ponzi schemes?
Currencies, art and social networks are / based on collective adoption
And early adopters benefit most…
But this is also true of Ponzi schemes
Benedict Evans –– January 2022
17
Visuals: A vertical dotted red line (kind of line, stroke about #E8443A, dotted with small square dots, roughly 0.3% of slide width) at x about 62.9%, running from y about 31.0% to y about 78.0%, dividing the two text columns. No photographs, charts, logos or icons.
Slide 18
Early (still!), exciting, unclear
Looks much like the early consumer internet, or open source (but also like lots of other things that never worked)
Deep technical / understanding / still needed
Fragmented & / complex
Massive creative / energy, but also / huge uncertainty
Benedict Evans —— January 2022
18
Visuals: Three filled circles of equal size (about 22.1% of slide width by 39.3% of slide height, rendered as perfect circles). Left circle: dark grey #535353, text 'Deep technical understanding still needed'. Middle circle: dark grey #535353, text 'Fragmented & complex'. Right circle: red-coral #EB483F, text 'Massive creative energy, but also huge uncertainty'. Flat fills, no outline, no shadow, no gradient. No photographs, charts or icons.
Slide 19
Is an iPhone open or closed? / Yes
The iPhone is full of open source software… / And yet it’s closed… / And yet there are millions of apps and billions of / app installs / So what do open or decentralised mean? Where, / and how, at what layers?
Source: Apple
Benedict Evans
–– January 2022
19
Visuals: One photograph, not a chart or table. It shows a first-generation iPhone, front and back, on a plain white background. The front face is angled toward the viewer, showing a black bezel, a glossy black screen with a status bar reading AT&T, signal and wifi icons, 9:42 AM and a battery icon. The home screen shows a 4-by-3 grid of app icons: Text, Calendar (Tuesday 9), Photos, Camera; YouTube, Stocks, Maps, Weather (73°); Clock, Calculator, Notes, Settings. A dock along the bottom of the screen holds Phone, Mail, Safari and iPod. A round black home button sits below the screen. The back of the device is visible to the right in brushed silver with a black lower band and a white Apple logo near the centre-right. Lighting is soft and even, studio style, with subtle highlights on the metal edges. Dominant colours are silver grey, black and white, with coloured app icons (green, blue, orange, yellow). The image is not cropped, is not full-bleed, and is placed as a boxed rectangle with no border or overlay, framed in the right half of the slide.
Slide 20
Metaverse / Benedict Evans — January 2022 / 20
Slide 21
The metaverse thesis / A vision of a universal screen / VR & AR as the next universal device after smartphones / Games break out / VR & AR expand far beyond games / Self-expression, place, identity, pop culture / Benedict Evans —— January 2022 / 21
Visuals: Three filled circles of equal size in a horizontal row. Circle 1 (left) dark grey #535353 with white text 'VR & AR as the next universal device after smartphones'. Circle 2 (centre) dark grey #535353 with white text 'Games break out' above 'VR & AR expand far beyond games'. Circle 3 (right) red #EB483F, the only accent, with white text 'Self-expression, place, identity, pop culture'. No photographs, icons or charts. Circles are flat with no shadow, outline or gradient.
Slide 22
Mood boards for the future?
Many of these words will probably mean something - but not necessarily like that
1994: “Information Superhighway”
Multimedia, GUIs, CD-ROM, interactive
TV, convergence, broadband networks,
voice recognition, digital… and VR
Disney, AT&T, Bertelsmann, Viacom
2021: “Metaverse”
VR and AR, plus games, creator
economy, Roblox, digital self, spatial
internet & place… (and web3)
Facebook?
Benedict Evans
— January 2022
22
Visuals: Visual elements: none apart from one red dotted vertical rule. The rule is a line about 0.3% of slide width, dotted, in red #E84B3C, running from about y 31.6% to 78.0% at x 56.3%, centred between the two text columns. No photographs, charts, icons, logos or illustrations.
Slide 23
VR traction so far?
Growing interest, and Oculus Quest 2 sold 10m units in 12 months, but it didn’t surge in lockdown
Relative search interest, USA
VR
100
Oculus
75
50
25
0
2010
2015
2020
Source: Google Trends
Benedict Evans
–– January 2022
23
Visuals: One line chart, titled Relative search interest, USA. Type: time-series line chart with two series, VR (light grey) and Oculus (red). Y axis: relative search interest, unitless index 0 to 100, labelled 0, 25, 50, 75, 100, with dotted horizontal gridlines at each of those values. X axis: time, labelled 2010, 2015 and 2020, with a solid grey baseline at 0; the series run from 2010 to about early 2022, monthly points. Legend at the left of the chart: a short light grey line segment labelled VR above a short red line segment labelled Oculus. VR series values (estimates, no values printed): about 5 to 6 from 2010 to 2012, about 4 in 2012 to 2013, about 3 to 4 in 2014, rising to about 15 to 20 in 2016, a peak of about 100 around early 2017 (highlighted as the chart maximum), about 35 to 50 in 2017 to 2018, a secondary peak of about 62 in late 2017, about 49 in 2019, about 49 in 2020, about 68 is not VR; VR peaks about 48 to 50 in early 2021, and ends about 40 in early 2022. Oculus series values (estimates): about 2 at its start in late 2012, about 5 to 7 in 2013 to 2014, a spike of about 35 in 2014, about 10 to 17 in 2015, about 8 to 15 in 2016 to 2018, about 43 in late 2019, about 20 to 17 in 2020, a peak of about 68 in early 2021 (highlighted as the highest Oculus point), about 33 in mid 2021, and about 38 at the end of the series in early 2022. Series colours: VR light grey, Oculus red #E8402A. Lines are about 2 px thick with no markers.
Slide 24
Small beginnings
So far, Roblox is a far bigger story (and Apple is keeping quiet)
Relative search interest, USA
VR
Oculus
Roblox
100
75
50
25
0
2010
2015
2020
Source: Google Trends
Benedict Evans — January 2022
24
Visuals: Line chart titled 'Relative search interest, USA'. Y axis: relative search interest, unitless index from 0 to 100, with dotted horizontal gridlines and labels at 0, 25, 50, 75 and 100. X axis: time from 2010 to about 2022, labelled 2010, 2015 and 2020, with a solid grey baseline at 0. Three series, with no printed values, so values are estimates. VR (light grey line): about 2 in 2010, about 1 to 3 through 2014, a spike to about 40 near 2017, then about 10 to 25 through 2018 to 2022, ending about 15. Oculus (red line): starts about 1 in late 2012, a spike to about 14 near 2014.5, mostly 2 to 8 from 2015 to 2019, rising to about 16 near 2020, peaking about 27 near 2021, ending about 15. Roblox (dark grey line): about 5 in 2010, rising slowly to about 15 by 2014, about 30 to 45 in 2016 to 2018, about 35 to 45 in 2019, a sharp rise to about 100 near 2020.5, then about 60 to 90 through 2021 to 2022, ending about 68. Legend: three entries stacked vertically at upper left of the chart, each with a short horizontal line swatch: VR light grey #D9D9D9, Oculus red #E8453C, Roblox dark grey #4D4D4D. No highlighted points are marked. Line weight is about 2 px, with no markers.
Slide 25
Roblox as a model for the future?
A platform for social and for creating games and experiences, not just the latest hit game
Changing ‘games’
Self-expression &
social, beyond 1p
shooting games
Ecosystem
Thousands of
apps and devs
with real use &
revenue
Platform value?
Can this last for a
decade, instead of
fading like hit
games?
Benedict Evans
—
January 2022
25
Visuals: Three white circles with thin outlines, each about 21.7% of slide width and 38.5% of slide height, with the same vertical centre. The first and second circles have dark grey outlines (#545454) and the third has a red outline (about #E74C3C). Between circles one and two, and between two and three, sits a solid right-pointing block arrow in #A7A7A7 (about 5.2% wide and 9.3% high) with a rectangular shaft and triangular head. Each circle holds a bold heading above a regular body text block, centred. No photographs, logos or charts.
Slide 26
Games are still relatively small / There are probably 250-350m active ‘core gamers’ - the same size as Snap and a fraction of the 1bn+ iPhone users / Global daily active users*, 2021 (m) / 350 / 300 / 250 / 200 / 150 / 100 / 50 / 0 / XBox & PS MAU / Steam / Oculus Quest 2 / unit sales / Free Fire / Honor of Kings / Roblox / Fortnite / Snap / Source: Companies / * Except Consoles and Oculus, as stated / Benedict Evans / –– January 2022 / 26
Visuals: Vertical bar chart titled 'Global daily active users*, 2021 (m)'. Y-axis: 'm' users, scale 0 to 350 with labelled ticks every 50 (0, 50, 100, 150, 200, 250, 300, 350), faint dotted horizontal gridlines at each tick. X-axis: categorical, labelled XBox & PS MAU, Steam, Oculus Quest 2 unit sales, Free Fire, Honor of Kings, Roblox, Fortnite, Snap; solid grey baseline at 0. Single series, eight bars, values about: XBox & PS MAU about 210 (dark grey #535353), Steam about 63 (dark grey #535353), Oculus Quest 2 unit sales about 10 (dark grey #535353), Free Fire about 150 (mid grey #A7A7A7), Honor of Kings about 100 (mid grey #A7A7A7), Roblox about 43 (mid grey #A7A7A7), Fortnite about 25 (mid grey #A7A7A7), Snap about 293 (red #EB483F, the only highlighted point). No legend. Bars are flat-filled rectangles with no outline, no shadow, equal width of about 3.8% of slide width, evenly spaced.
Slide 27
Though mobile has changed the games TAM
Popular estimates of market size show dramatic growth in mobile
Global games revenue estimates ($bn)
Mobile
PC
Console
200
150
100
50
0
2012
2013
2014
2015
2016
2017
2018
2019
2020
Source: NewZoo
Benedict Evans
–– January 2022
27
Visuals: Stacked column chart, titled 'Global games revenue estimates ($bn)'. Y-axis: $bn, 0 to 200, labelled at 0, 50, 100, 150, 200, with light dotted horizontal gridlines at each label. X-axis: years 2012 to 2020, one column per year. Three stacked series from bottom to top: Console (dark grey #545454), PC (light grey #A6A6A6), Mobile (red #EB483F). Values are not printed on the slide; estimates: Console about 32, 30, 30, 30, 32, 33, 34, 36, 38; PC top about 58, 59, 60, 61, 64, 66, 68, 70, 73; Mobile top about 71, 76, 84, 93, 106, 122, 138, 152, 167 (in $bn, cumulative). Legend at upper left of chart, listed top to bottom: Mobile (red square), PC (grey square), Console (dark grey square). No highlighted points. Columns are about 3.3% of slide width with even spacing; no data labels.
Slide 28
How universal do VR & AR become?
Moore’s Law took ‘mobile internet’ to everyone - but only took games consoles to a 200m unit installed base
The technology can
always get better…
But that doesn’t
guarantee universal
appeal
Benedict Evans
—— January 2022
28
Visuals: Four photographs in two rows, each pair linked by a red dotted arrow. Row 1: left, a Nokia-style candy-bar mobile phone, olive-grey body with a black keypad and silver face, angled about 20 degrees, standing upright; right, an early iPhone shown front and back, front with black bezel and a grid of app icons, back in silver and black, facing right. Row 2: left, a Nintendo Entertainment System console, light grey top with dark grey and black trim and two grey controllers with red buttons in front; right, a PlayStation 5 console standing upright, white body with a black stripe and a blue light edge. Arrows: four red dotted lines with solid triangular arrowheads pointing right, each spanning from the left object to the right object at the object's mid-height, about 1.2 times the arrow thickness in red #E0443A. Photographs are unboxed, on white and grey, with no overlay or tint and no cropping.
Slide 29
2030
Benedict Evans — January 2022
29
Slide 30
“This is amazing - it must be part of the future”
Tech determinism - for both VR and ‘crypto’ the tech is great, so it must be useful, but how?
Internet, web, / open source, / smartphones
But also drones, / 3D printing, / games consoles…
And now web3 / and metaverse
Benedict Evans —— January 2022 30
Visuals: Three filled circles arranged left to right as a row of equal-size flat shapes; no photographs, charts or logos. Circle 1 (left) is dark charcoal #535353 with white text 'Internet, web, / open source, / smartphones'. Circle 2 (centre) is dark charcoal #535353 with white text 'But also drones, / 3D printing, / games consoles…'. Circle 3 (right) is coral red #EB483F with white text 'And now web3 / and metaverse'. All circles are solid fills with no outline, no shadow and no gradient, each about 22.1% of slide width and 39.3% of slide height, perfectly round.
Slide 31
The future can take a very long time / Mobile data didn’t take off outside Japan until a decade after the dream began / Smartphone unit sales (m) / Proto-smartphones* / iPhone & Android / 1,500 / 1,250 / 1,000 / 750 / 500 / 250 / 0 / 2000 / 2005 / 2010 / 2015 / Benedict Evans —— January 2022 / 31 / Source: IDC, Companies / * S60, Palm, RIM, Windows Phone
Visuals: One line chart. Title: Smartphone unit sales (m), bold sans-serif above the plot. Y-axis: unit sales in millions, range 0 to 1,500, labelled ticks at 0, 250, 500, 750, 1,000, 1,250 and 1,500, with light grey dotted horizontal gridlines at each labelled tick. X-axis: years 2000 to 2015, labelled ticks at 2000, 2005, 2010 and 2015, with a thin grey baseline at 0. Legend at upper left of the plot: dark grey line marked Proto-smartphones* and red line marked iPhone & Android. Series 1, Proto-smartphones* (dark grey #545454, solid, about 3 px stroke, smoothed): starts at about 0 in 2001, about 10 in 2003, about 50 in 2005, about 70 in 2007, about 100 in 2009, peaks at about 150 around 2010, about 130 in 2011, about 50 in 2012 and ends at about 25 in 2013. Series 2, iPhone & Android (red #E8453C, solid, about 3 px stroke, smoothed): starts at about 5 in 2007, about 25 in 2009, about 100 in 2010, about 250 in 2011, about 500 in 2012, about 950 in 2013, about 1,250 in 2014 and ends at about 1,420 in 2015. No values are printed on the chart, so all series values are estimates. No highlighted points. The two series cross at about 2010 to 2011.
Slide 32
And you can have a winter (or two) on the way
Both AI and VR went through prolonged ‘Winters’ as the tech lagged behind early enthusiasm
Term frequency in English-language books
Artificial Intelligence
Virtual Reality
1950
1960
1970
1980
1990
2000
2010
2019
Source: Google Ngram
Benedict Evans — January 2022
32
Visuals: Line chart titled 'Term frequency in English-language books', with no units printed on the y-axis and no y-axis labels. X-axis runs 1950 to 2019 with labels every 10 years (1950, 1960, 1970, 1980, 1990, 2000, 2010, 2019). Y-axis is unlabelled; faint dotted horizontal gridlines at about four levels above the baseline. Series 1, Artificial Intelligence, dark grey line (#545454) about 2 units near 1950-1958, rising gradually to about 15% of plot height by 1980, peaking at about 90% of plot height around 1987, falling to about 35% by 2000, about 25% near 2010, rising to about 95% at 2019. Series 2, Virtual Reality, red line (about #E84C3D) near zero until about 1988, rising sharply to a peak of about 35% of plot height around 1996, dipping to about 20% near 2007, then rising to about 60% at 2019. No values are printed on the slide, so all values are estimates. Legend at far left with a short dark grey dash labelled Artificial Intelligence and a short red dash labelled Virtual Reality. No highlighted points. Source line reads Source: Google Ngram.
Slide 33
No-one knows anything / In 1995, the future shape of the ‘internet’ still looked very unclear / Is it just the internet, or will there / still be lots of other networks? / How will FTP, Gopher, Telnet, / WAIS and Web interact? / How will the web work? Should / the browser be an editor? A / server? Should it have images? / Source: Telegeography / Benedict Evans –– January 2022 / 33
Visuals: A bordered black-and-white reproduction of a figure titled 'Figure 5. Network Gateways: A Cyberspace Divided' with a caption paragraph, a TeleGeography, Inc. 1995 copyright mark, and a network diagram of irregular blob-shaped outlines with labels: 'Other Nets' containing 'private' and 'secure'; 'The Matrix' (large blob) containing 'Usenet' (diamond), 'UUCP' (blob), 'Minitel' (blob), 'Private Nets' (blob), 'FidoNet' (blob), 'Internet' containing 'Telnet space', 'FTP space', 'Gopher space', 'Web space', 'WAIS space'; 'BITNET' (blob); 'Commercial Services' containing 'America Online', 'Delphi', 'Prodigy', 'GEnie', 'Compuserve'. Dashed double-headed arrows with small triangular gateway symbols connect the blobs; a legend at bottom left shows a double-headed arrow with a triangle and the label 'Network Gateway'. Figure has a thin black border with black corner marks at top left and bottom right, sits on a white card with a faint drop shadow. Monochrome, black on white, no tint.
Slide 34
But some things do seem universal / How do we take ownership of digital? / New ways to make software, networks and ownership? / Identify, self-expression, place and self / New ways to make screens immersive and universal? / Benedict Evans —— January 2022 / 34
Visuals: Three filled circles arranged left to right: a dark grey circle (#535353) on the left reading 'New ways to make software, networks and ownership?', a red circle (#EB483F) in the centre reading 'Identify, self-expression, place and self', and a dark grey circle (#535353) on the right reading 'New ways to make screens immersive and universal?'. Between the circles are two grey (#A7A7A7) block arrows: the left one points right (from left circle to centre), the right one points left (from right circle to centre), so both arrows converge on the red centre circle. No photographs, charts or logos.
Slide 35
Present
Benedict Evans —— January 2022
35
Slide 36
Deployment
What are companies building today?
Deploying all the great ideas / from the last decade
SaaS, cloud, machine learning, / digital transformation, workflows, / automation, image recognition, / fintech, voice, video, live / streaming…
Web3, Metaverse… / and everything else
Benedict Evans — January 2022
36
Visuals: One vertical dotted line in red (about #E8453C) running from about y 31.5% to y 78% at x≈49.1%, dots roughly 0.3% of slide width, evenly spaced, no arrowheads. No photographs, charts, icons or logos.
Slide 37
‘Digital transformation’
Sounds like a parody of marketing gibberish - but describes a generational change in enterprise tech
Mainframes
Client server,
PCs, Oracle,
Microsoft
Cloud, SaaS,
machine learning
Benedict Evans
–– January 2022
37
Visuals: Diagram: three filled circles of equal size (each about 22.1% wide by 39.3% high) in a left-to-right row, connected by two right-pointing block arrows. Circle 1 is dark grey #535353 and contains the label 'Mainframes'. Circle 2 is dark grey #535353 and contains the label 'Client server, PCs, Oracle, Microsoft' on four lines. Circle 3 is red #EB483F and contains 'Cloud, SaaS, machine learning' on two lines. Two block arrows, fill #A7A7A7, flat, no outline, sit in the gaps between circles at about x 41.3% and 68.9%, each about 5.2% wide and 9.3% high, pointing right. No photographs, logos or icons.
Slide 38
The move to cloud is still just beginning
Only 10-15% of enterprise IT spending has moved to the cloud so far, and 20-30% of workflows
Global enterprise IT spending ($bn)
On-prem
Cloud
800
700
600
500
400
300
200
100
0
2017
2018
2019
2020
2021e
Source: Gartner
Benedict Evans –– January 2022
38
Visuals: One chart: stacked vertical column chart, titled 'Global enterprise IT spending ($bn)' (bold, top-left of chart area). Y-axis: 0 to 800 in steps of 100, unit $bn, labels at left of plot, horizontal dotted light-grey gridlines at every 100. X-axis: categories 2017, 2018, 2019, 2020, 2021e (the 2021 value marked 'e' for estimate), with a thin grey baseline at 0. Series 1 'On-prem' (dark grey #535353, top segment of each column). Series 2 'Cloud' (red, bottom segment of each column). Printed values: none; values are estimates from the plot as follows. On-prem totals about: 2017 about 605, 2018 about 680, 2019 about 715, 2020 about 672, 2021e about 718. Cloud segments about: 2017 about 42, 2018 about 58, 2019 about 75, 2020 about 85, 2021e about 112. Legend at left: square swatch dark grey labelled 'On-prem' above square swatch red labelled 'Cloud'. No highlighted points. Columns are flat-topped rectangles with no rounded corners, about 6% of slide width each, separated by white hairline borders between segments.
Slide 39
Old paradigms have a long half-life / Mainframes are still out there, decades after the rest of tech moved on to bigger things / IBM Mainframe installed computing capacity (million MIPS) / 75 / 50 / 25 / 0 / 1995 / 2000 / 2005 / 2010 / 2015 / 2020 / Source: IBM / Benedict Evans — January 2022 / 39
Visuals: Line chart with circular markers, titled 'IBM Mainframe installed computing capacity (million MIPS)'. X axis: calendar years 1995 to 2020, one point per year (26 points), labelled every five years, no unit stated. Y axis: 0 to about 75 (labelled 0, 25, 50, 75; top gridline at 75), units million MIPS, no unit label beyond the chart title. Series: one series, values about: 1995 1.5, 1996 1.8, 1997 2.0, 1998 2.7, 1999 3.2, 2000 4.0, 2001 5.0, 2002 5.9, 2003 6.9, 2004 8.1, 2005 9.7, 2006 11.1, 2007 12.5, 2008 15.0, 2009 17.0, 2010 19.8, 2011 23.2, 2012 26.4, 2013 29.4, 2014 32.8, 2015 36.8, 2016 40.6, 2017 45.6, 2018 52.0, 2019 58.3, 2020 65.2 (all values estimated as 'about' since no values are printed). Line and markers are red (about #EE4B3F), line width about 3 px, marker diameter about 14 px. Horizontal dotted grey gridlines at 25, 50 and 75 (about #B0B0B0). A thin solid grey baseline (about #8C8C8C) sits at 0. No legend. No highlighted points. The chart is a native plot, not a photograph; no data labels are printed.
Slide 40
Rise of the ‘hyperscalers’
Alphabet and Microsoft alone are spending over $40bn this year on cloud infrastructure
Annual capex ($bn)
Meta
Amazon*
Microsoft
Alphabet
150
125
100
75
50
25
0
2010
2011
2012
2013
2014
2015
2016
2017
2018
2019
2020
Sept 21 TTM
Source: Companies
Benedict Evans
–– January 2022
40
* Includes both data centres and delivery fulfilment. Cash capex and lease obligations
Visuals: One stacked column chart titled 'Annual capex ($bn)' (bold sans, dark grey). Y axis: 0 to 150 in steps of 25, labelled values 0, 25, 50, 75, 100, 125, 150, no unit suffix on tick labels (unit given in chart title as $bn), faint dotted horizontal gridlines at each step. X axis: categories 2010, 2011, 2012, 2013, 2014, 2015, 2016, 2017, 2018, 2019, 2020, Sept 21 TTM, with a thin solid grey baseline at 0. Four stacked series, bottom to top: Alphabet (red), Microsoft (pale pink), Amazon* (dark grey), Meta (light grey). No values are printed on the bars; the following totals and segment heights are estimates marked about: 2010 about 4 Alphabet, about 1 Microsoft, about 2 Amazon, about 0 Meta (total about 7); 2011 about 3, about 3, about 3, about 0 (total about 9); 2012 about 3, about 2, about 5, about 1 (total about 11); 2013 about 7, about 4, about 6, about 2 (total about 19); 2014 about 11, about 5, about 9, about 2 (total about 27); 2015 about 10, about 6, about 9, about 3 (total about 28); 2016 about 10, about 8, about 14, about 4 (total about 36); 2017 about 13, about 8, about 23, about 7 (total about 51); 2018 about 25, about 11, about 26, about 14 (total about 76); 2019 about 24, about 14, about 27, about 15 (total about 80); 2020 about 22, about 16, about 49, about 15 (total about 102); Sept 21 TTM about 24, about 19, about 65, about 17 (total about 125). Legend at upper left with four swatches in top-to-bottom order Meta, Amazon*, Microsoft, Alphabet. No highlighted points. Source and footnote are beneath the chart; no photograph, logo or icon.
Slide 41
How much software?
SaaS / cloud deployment model plus expansion of industry and capabilities means a step change in the opportunity
Mainframes
IBM supplies you / with a hardware/ / software system
Client server
Dozens of / applications in / your data centre
SaaS
Hundreds of / applications (that / you know about)
Benedict Evans –– January 2022 41
Visuals: Three white circles of equal size (each about 21.7 percent of slide width and 38.5 percent of slide height) with thin dark grey outlines, the first two outlined in dark grey #545454 and the third outlined in red #E84B3C; each circle contains a bold heading and centred body text. Two solid grey #A7A7A7 right-pointing block arrows sit in the gaps between circles, pointing from the first circle to the second and from the second to the third. No photographs, charts or logos.
Slide 42
SaaS means far more software
SaaS operating model has meant a structural change in the amount of software companies can use
Average number of SaaS applications per Okta customer, by industry
2020
2019
2018
2017
175
150
125
100
75
50
25
0
Tech
Media
Retail
Professional
Services
Finance
Manufacturing Healthcare
Construction
Govt
Energy
Source: Okta
Benedict Evans
–– January 2022
42
Visuals: Dot-plot chart (scatter of categorical dots), titled 'Average number of SaaS applications per Okta customer, by industry'. Y-axis: 'Average number of SaaS applications' is not printed; tick labels run 0 to 175 in steps of 25, with faint dotted horizontal gridlines at each tick. X-axis: categories Tech, Media, Retail, Professional Services, Finance, Manufacturing, Healthcare, Construction, Govt, Energy, with a solid thin grey baseline at 0. Four series, each one dot per category: 2020 red #EE4035, 2019 dark grey #4D4D4D, 2018 mid grey #A6A6A6, 2017 light grey #D9D9D9. No values are printed on the dots; approximate values read from positions: Tech 2020 about 155, 2019 about 133, 2018 about 122, 2017 about 99; Media 2020 about 133, 2019 about 124, 2018 about 114, 2017 about 110; Retail 2020 about 120, 2019 about 112, 2018 about 96, 2017 about 76; Professional Services 2020 about 116, 2019 about 85, 2018 about 67, 2017 about 64; Finance 2020 about 104, 2019 about 88, 2018 about 73, 2017 about 70; Manufacturing 2020 about 98, 2019 about 96, 2018 about 93, 2017 about 92; Healthcare 2020 about 96, 2019 about 81, 2018 about 66, 2017 about 56; Construction 2020 about 83, 2019 about 72, 2018 about 66, 2017 about 64; Govt 2020 about 76, 2019 about 55, 2018 about 45, 2017 about 33; Energy 2020 about 54, 2019 about 51, 2018 about 48, 2017 about 41. Legend at left: red dot 2020, dark grey dot 2019, mid grey dot 2018, light grey dot 2017, listed top to bottom. Highlighted points: none; the 2020 series is the only red series and is drawn on top of the others. Dots overlap where values are close (e.g. Manufacturing, Energy).
Slide 43
Even within teams
SaaS operating model has meant a structural change in the amount of software companies can use
Average number of SaaS applications per team
2021
2020
2019
80
70
60
50
40
30
20
10
0
Security
Engineering
Product
Infotech
Customer
Marketing
Finance
Sales
Ops
HR
success
Source: Productiv
Data includes both SaaS SSO and proprietary analysis
Benedict Evans
–– January 2022
43
Visuals: One chart: dot plot (scatter of single values per category, no connecting lines). Chart title: 'Average number of SaaS applications per team'. Y-axis: numeric scale 0 to 80, labelled at 10-unit intervals, unit is number of SaaS applications per team (axis title not printed), faint dotted horizontal gridlines at each 10 units. X-axis: categories Security, Engineering, Product, Infotech, Customer success, Marketing, Finance, Sales, Ops, HR; solid thin grey baseline at 0. Three series with circular markers about 1.8% of slide width in diameter: 2021 red markers, 2020 dark grey markers, 2019 light grey markers. No values are printed on the chart, so values are estimates marked about: Security 2021 about 73, 2020 about 63, 2019 about 55; Engineering 2021 about 70, 2020 about 62, 2019 about 47; Product 2021 about 65, 2020 about 63, 2019 about 40; Infotech 2021 about 61, 2020 about 59, 2019 about 49; Customer success 2021 about 57, 2020 about 52, 2019 about 39; Marketing 2021 about 52, 2020 about 48, 2019 about 37; Finance 2021 about 51, 2020 about 46, 2019 about 39; Sales 2021 about 50, 2020 about 49, 2019 about 45; Ops 2021 about 50, 2020 about 49, 2019 about 46; HR 2021 about 49, 2020 about 47, 2019 about 38. Legend at left: red dot 2021, dark grey dot 2020, light grey dot 2019, stacked vertically. No highlighted points. Markers overlap where values are close, with red drawn on top of dark grey and dark grey on top of light grey.
Slide 44
The cloud means workflows, not better file shares
Don’t put your spreadsheet on the web - find a better way to do the job
Benedict Evans
–– January 2022
44
Visuals: Three brand logos in a left-to-right flow connected by two grey block arrows. Left: Microsoft Excel icon, green (#1D7145 approx.) rounded spreadsheet grid with a dark green X panel, about 17.5% wide, placed at x 41.3%? no: placed at x 20.1%, y 36.8%, 17.5% by 31.1% (337 by 337 px image). Centre: Google Sheets document icon, bright green (#23A566 approx.) page with folded top-right corner (pale green #8FD6AD) and white table grid, placed at x 41.3%, y 54.0%, 32.4% by 32.0% region (577 by 320 px image) as a full-colour logo. Right: Figma logo, five-part rounded stack in red-orange #F24E1E, coral #FF7262, purple #A259FF, blue #1ABCFE and green #0ACF83, placed at x 77.9%, y 39.7%, 10.6% by 28.2%. Between Excel and Sheets is a grey (#A7A7A7) block arrow pointing down-right at x 42.1%, y 57.3%, 5.0% by 8.2%. Between Sheets and Figma is a second grey (#A7A7A7) block arrow pointing up-right at about x 61.5%, y 57.3%. No charts, photos or text inside visuals.
Slide 45
Frame.io
Workflow for professional video
Replaces email, Slack, file share, Google sheets and lots more email
Machine learning everywhere - but invisible
Source: Frame.io
Benedict Evans —— January 2022
45
Visuals: One photograph/illustration of a tablet and phone mockup. Tablet (large, black bezel, front camera at top centre, status bar showing 12:51 Tue Jan 27th and 100% battery) shows a video editing screen: a purple and cyan fantasy canyon scene with a rocky cliff, a glowing pink-magenta stairway and a bridge structure; a teal/cyan arrow annotation points diagonally down-right toward a red circle drawn around the bridge. Below the frame are a timeline with small coloured avatar markers, a play button with timecode 00:10 / 00:30, a filmstrip of purple scene thumbnails, the filename Zero_Gravity_Room.mp4 with 'John · 1 day ago', four avatar icons, tabs 'Comments' (active, underlined) and 'File info', and two comments: Megan 45s ago 'Can we brighten up the color on the rail here?' and Scott Timber 1h 'This shot is really cool, can we push it to the beginning?' each with Reply and a thumbs-up. A phone overlaps the tablet's lower-right corner showing the Yambo app: header 'Yambo', 'Recently updated' with thumbnails Zero_Gravity.mp4 (37 items), Apple Music Commercial Swift (37 items), and a partially visible third thumbnail; 'Updated assets' / 'Today' with rows blast_off.mov (v2, 05:10, Design Feedback 1h, 2 comments) and Rays of Light.mov (v2, 01:30, Design Feedback 1h, 2 comments). Lighting is dark-mode with neon magenta, violet and cyan glows; dominant colours near-black #111318, violet #6A3FD8, magenta #E0389A, cyan #3FD6E0, teal arrow #3ED8C3, red circle #E0463A. Full composition, not cropped, the tablet is unboxed with rounded corners and no frame; no overlay on the photograph.
Slide 46
Frame.io - welcome to 2005
15-year-old concept (‘Google Docs for video!’) but the tech
and the market are finally ready
Source: Frame.io
Benedict Evans
–– January 2022
46
Visuals: Photograph-style composite illustration of a tablet and a phone showing a video-editing app. Tablet (large, portrait, dark bezel with front camera at top centre, status bar reading 12:51 Tue Jan 27th and 100% battery): the screen shows a video frame of a surreal rocky canyon with a narrow stone stair and a glowing pink/magenta walkway, lit in cyan, violet and magenta, with a stylised thick teal arrow pointing down-right onto the scene and a thin red-orange circle around a small glowing structure. Below the frame is a timeline strip of small coloured avatar markers joined by thin pink and green lines, a play button in a dark circle, timecode '00:10 / 00:30', a row of filmstrip thumbnails of the same canyon, the file name Zero_Gravity_Room.mp4, the line 'John · 1 day ago', a row of four small circular avatars, the tabs Comments (underlined) and File info, and two comments: Megan, 45s ago, 'Can we brighten up the color on the rail here?' with a blue dot, Reply and a thumbs-up; Scott Timber, 1h, 'This shot is really cool, can we push it to the beginning?' with Reply and a thumbs-up. Phone (smaller, overlapping the tablet's lower-right corner, black bezel with notch, status bar 12:51): dark app screen showing the Yambo logo and wordmark, a search icon and avatar at top, 'Recently updated' with three thumbnail cards (Zero_Gravity.mp4, Apple Music, a partly visible third card), 'Updated assets' with 'Today' and two list rows: blast_off.mov (05:10, Design feedback, 1h, 2 comments) and Rays of Light.mov (01:20, Design feedback). Composition: the devices are shown straight-on, unrotated, full object visible, not cropped, boxed on white with no shadow visible. Lighting: even, screen-lit. Dominant colours: near-black device bodies, violet #3B2A6B, magenta #E0289A, cyan #2EC4D6, teal arrow #3FD6D0, red-orange circle #E0463A, dark UI panels #1C1D27.
Slide 47
Remaking companies / Vodafone had 2.6m invoices, 40k queries & 1k payments FTEs - how would you change that? / Applying digital: Purchase to Pay process / 2.6m invoices a year / €38bn payments / 40K queries / Process / Traditional approach / Digital / Mix of e-invoices + paper invoices / Manual paper invoice processing / Mix of e-invoices + paper invoices / Intelligent OCR and robotics / Automatic invoice processing / 2.6m invoices a year / Before: > 1,000 FTEs managed supplier payments worldwide / Now: 400 FTEs in Shared Services / Target: <100 next year / C2 General / 6 / Source: Vodafone (2019) / Benedict Evans / January 2022 / 47
Visuals: An embedded screenshot of a Vodafone slide, full rectangle with a soft drop shadow, not cropped. Top band white with the heading 'Applying digital: Purchase to Pay process' in red, 'Applying digital:' bold and 'Purchase to Pay process' regular. Second band light grey with a faint stippled wave pattern containing three icon-and-label stats: an envelope with a red badge icon with '2.6m invoices a year', a stack of coins with a dollar symbol icon with '€38bn payments', and two speech bubbles with a red queries icon with '40K queries'. Below, a three-column process diagram: Process column with a black document-with-pencil icon and red '2.6m' above 'invoices a year' text; Traditional approach column with a red circle containing a white envelope, a red chevron arrow pointing right, and a group of people icon, followed by two white boxes 'Mix of e-invoices + paper invoices' and 'Manual paper invoice processing' with a red arrow beneath pointing right; Digital column with a red circle containing a white envelope, a red chevron, and a robot icon, followed by three white boxes 'Mix of e-invoices + paper invoices', 'Intelligent OCR and robotics' and 'Automatic invoice processing' with a red arrow beneath pointing right. Each column has a bold black heading with a thin red underline. A right-hand white panel with a red top and bottom rule holds three red-bulleted statements. Colours: red #E60000, white, black #1A1A1A, light grey #F1F1F1 with stipple #D9D9D9. Vodafone red logo bottom-right of the screenshot and a small 'C2 General' label bottom-left, with page number 6 beside the logo.
Slide 48
Mass deployment / Thousands more companies deploying everything we learned in the last decade, in ever more places / Platforms / SaaS, cloud, mobile / Building blocks / Networks, / marketplaces, / workflows, / machine learning / Creation / So many more / companies to / build / Benedict Evans –– January 2022 / 48
Visuals: Three identical-sized outlined circles in a row, each about 21.7% wide and 38.5% tall, with white fill. The first two circles have a dark grey stroke (#545454, about 2 px). The third circle, on the right, has a red stroke (about #E8453C, about 2 px) to highlight it. Circle 1 contains the heading Platforms and the line SaaS, cloud, mobile. Circle 2 contains the heading Building blocks and the lines Networks, marketplaces, workflows, machine learning. Circle 3 contains the heading Creation and the lines So many more, companies to, build. No photographs, charts, or logos.
Slide 49
Past
Benedict Evans — January 2022
49
Slide 50
Everything the internet did to music or / newspapers is now happening to everyone else / Benedict Evans — January 2022 / 50
Slide 51
When do the atoms stop mattering?
As the internet removes physical barriers to entry, one industry after another is disrupted
Decline from peak, USA (indexed)
Pay TV subs
Book store revenue
Newspaper ad revenue
100
75
50
25
0
2000
2005
2010
2015
2020
Source: BLS, US Census, Companies
Benedict Evans
–– January 2022
51
Visuals: Line chart titled 'Decline from peak, USA (indexed)'. Type: line chart with three smoothed series. Y axis: 0 to 100, indexed value, gridlines and labels at 0, 25, 50, 75 and 100, no unit beyond index. X axis: years 2000 to 2020, labels at 2000, 2005, 2010, 2015 and 2020. Series: Pay TV subs, light grey line about #A6A6A6, starts at about 100 in 2009 and stays near 100 to about 2011, about 96 in 2014, about 87 in 2017, about 76 in 2019, ends about 68 in 2020. Book store revenue, mid grey line about #545454, starts about 100 in 2007, about 92 in 2009, about 81 in 2011, about 67 in 2013, about 62 in 2015, about 55 in 2019, ends about 38 in 2020. Newspaper ad revenue, black line about #000000, starts at 100 in 2000, about 91 in 2001, about 89 in 2003, about 91 in 2004, about 90 in 2006, about 71 in 2008, about 54 in 2009, about 42 in 2012, about 32 in 2014, about 25 in 2017, ends about 18 in 2020. Legend at far left in order Pay TV subs, Book store revenue, Newspaper ad revenue, each with a short line swatch in its series colour. No highlighted points. Gridlines are thin dotted light grey lines at each labelled value; the zero baseline is a solid thin grey line.
Slides 52 to 94 continue in the full text file.
Download this deck
The hosted PDF of every library deck is free for readers of the SlideDeck Co newsletter. Join with your email and the viewer and download appear here.
Preparing a strategy presentation of your own? The SlideDeck Co Consulting Deck is a slide library with a statement of work and a worked client case.