

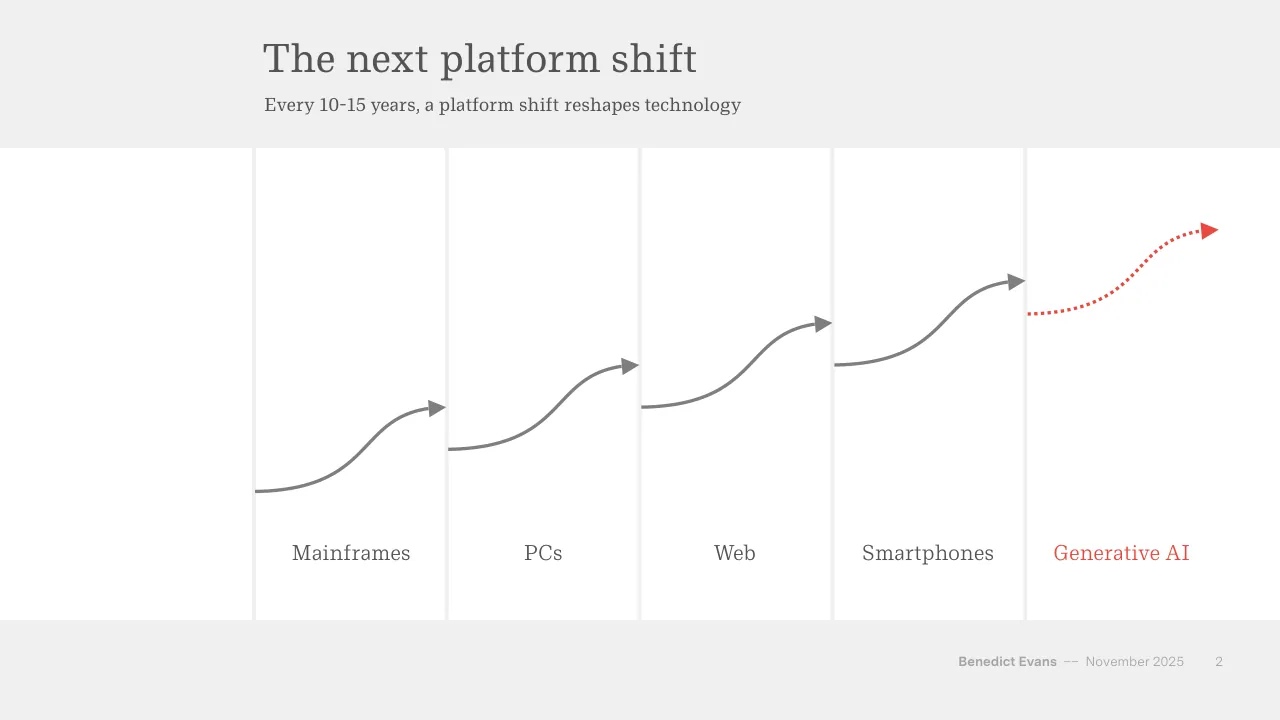
The deck opens with a title slide and frames generative AI as the next platform shift, following earlier shifts from mainframes through PCs, the web and smartphones. It argues that leaders often lose dominance, that early hype and bubbles recur, and that the outcome of a platform shift is hard to predict. The middle sections split the topic into two parts. Inside tech covers large capital spending by Big Tech, data centre build-out, chip supply, circular financing among AI firms, model convergence and user adoption. Outside tech covers how businesses absorb AI for obvious use cases, the role of human oversight, the Jevons paradox, advertising and the question of where value will be captured. The deck closes with historical examples of automation, a quote on AI as whatever machines cannot yet do, a thank-you slide and a short biography of the speaker.
Slides worth studying
Questions about this deck
How many slides does the Benedict Evans deck have?
The Benedict Evans deck is listed as having 90 pages. Slide 1 is the title slide, and the deck closes with a thank-you slide and a short speaker biography.
What does the Benedict Evans deck say about Nvidia's cash flow and chip supply?
Slide 32 states that Nvidia has $77bn of TTM FCF and that TSMC can't keep up with demand. Slide 21 adds that TSMC is unwilling or unable to expand capacity fast enough to meet Nvidia's book.
What does Benedict Evans say about Big Tech capex in 2025?
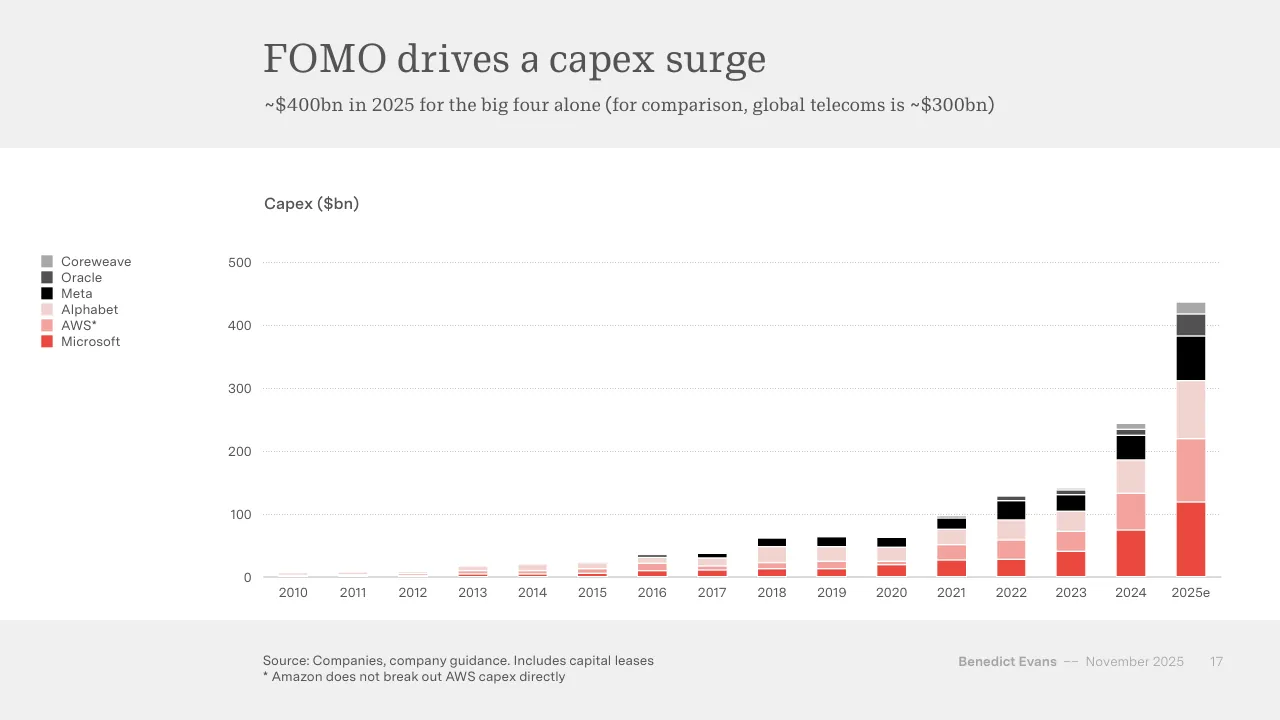
Slide 17 says there is about $400bn of capex in 2025 for the big four alone, and notes that global telecoms is about $300bn for comparison. Slide 18 gives the same comparison with a planned 2025 figure of about $350bn for the big four.
How is the Benedict Evans deck structured?
Slide 3 frames the deck around three parts: The New Thing, Inside tech and Outside tech. Slide 14 is the Inside tech divider, and the deck closes with a thank-you slide and a speaker biography.
Details
- Company: Benedict Evans
- Year: 2025
- Type: Conference talk
- Industry: Technology analysis
- Pages: 90
More from Benedict Evans
- Benedict Evans conference talk, 2026
- Benedict Evans conference talk, Spring 2025
- Benedict Evans conference talk, 2023
- Benedict Evans conference talk, 2023
- Benedict Evans strategy presentation, 2022
- Benedict Evans conference talk, 2021
All Benedict Evans decks in the library
Review score: 8 out of 10, Strong
Presentation quality, judged with the SlideDeck Co review heuristic. Ask, evidence and idea merit are not rated here.
The deck makes one argument and builds it in order: platform shifts (2-12), then inside tech (14-48), then outside tech (49-72), with section dividers and a consistent system of action titles, subtitles, sources and restrained red-and-grey colour. Charts are mostly clean and direct, such as the capex stack on 17, the Nvidia revenue lines on 20-21 and the model-convergence bars on 35, and the circle-chain diagrams repeat a recognisable logic. Weaknesses are consequential: footer text is very faint, the legends on several charts sit small and far from the data (17), some stacked charts use similar tints that are hard to separate (38, 55), and several slides are bare quotes on a white box (15, 23, 63) or screenshot collages with small unreadable text (7, 29, 31, 70). Some slides also leave an unused empty left column (2, 12), and a few near-duplicate slides (12 against 2, 20 against 21) depend on the speaker to carry the build.
Worth keeping: Keep the three-part route, the full-sentence titles with explanatory subtitles, the consistent red highlight for the key series or answer, and the sourced single-message charts.
Most useful repair: Enlarge legends, footers and source lines, separate the pale tints in the stacked charts, and crop or annotate screenshot slides so the one relevant headline is readable.
What would change the score: I would replace the empty left margin on slides 2 and 12 with usable space, shrink the quote-only slides' white boxes, and add direct labels or takeaways on the busiest multi-series charts.
Confidence medium. 72 of 90 pages inspected on contact sheets, 4 at readable size. Reviewed 2026-11-08. Model-assisted review (claude-sonnet-5-5).
Full text of the slides (90 slides)
Every slide's words and a description of its charts and images, so the deck can be searched and rebuilt. Also available as Markdown.
Slide 1
AI eats the world
Benedict Evans
November 2025
www.ben-evans.com
Benedict Evans
–– December 2020
Visuals: none. The only non-text marks are a faint white panel at 4 percent opacity and a thin white horizontal rule along its bottom edge.
Slide 2
The next platform shift / Every 10-15 years, a platform shift reshapes technology / Mainframes / PCs / Web / Smartphones / Generative AI / Benedict Evans / –– November 2025 / 2
Visuals: Five curved arrows rising left to right across the white columns, each an S-shaped curve ending in a filled triangular arrowhead. Four are solid grey lines: Mainframes curve from about (20.0%, 68.3%) to an arrowhead at about (34.8%, 56.6%); PCs curve from about (35.0%, 62.4%) to an arrowhead at about (49.9%, 50.7%); Web curve from about (50.1%, 56.5%) to an arrowhead at about (65.0%, 44.9%); Smartphones curve from about (65.2%, 50.7%) to an arrowhead at about (80.1%, 38.9%). The fifth, Generative AI, is a red dotted curve from about (80.3%, 43.6%) to a red arrowhead at about (95.2%, 31.8%), continuing the progression. No numeric values, axes or legend are printed. Each curve is a stroked line with a grey or red triangular head; no photographs or icons.
Slide 3
What happens in a platform shift? / Who is affected, and how much? / The New Thing! / All tech innovation, / investment and / company creation / switches over / Inside tech / New gatekeepers, / new value capture / New and bigger / markers / Outside tech / Is this a new tool, / new revenue, or an / existential threat? / Benedict Evans / –– November 2025 / 3
Visuals: Three white circles connected left to right by two grey right-pointing triangular arrowheads (no connecting lines). Circle 1 'The New Thing!' with dark grey outline; circle 2 'Inside tech' with dark grey outline; circle 3 'Outside tech' with red outline, the only highlighted element. Arrow 1 sits between circle 1 and circle 2, Arrow 2 between circle 2 and circle 3. No photographs, charts or logos.
Slide 4
Dominance is won and lost / Microsoft dominated the PC era, but when the centre of gravity shifted to smartphones it became irrelevant / Microsoft OS share of global computer unit sales / 100% / 75% / 50% / 25% / 0% / 1975 / 1980 / 1985 / 1990 / 1995 / 2000 / 2005 / 2010 / 2015 / 2020 / 2025 / Source: Apple, Google, Gartner / Benedict Evans / –– November 2025 / 4
Visuals: Chart: line chart titled 'Microsoft OS share of global computer unit sales'. Y axis: percent from 0% to 100%, labels at 0%, 25%, 50%, 75%, 100%, with light dotted horizontal gridlines at each labelled value and a solid grey baseline at 0%. X axis: years 1975 to 2025, labels every five years (1975, 1980, ... 2025), with a thin grey baseline. Single series, a smooth red line about 3 px wide with no markers, starting at 1980 at about 0% and ending at 2025 at about 12%. Values are not printed on the slide; the following are estimates marked about: 1981 about 2%, 1982 about 9%, 1983 about 26%, 1984 about 31%, 1985 about 49%, 1987 about 65%, 1988 about 79%, 1990 about 84%, 1991 about 77%, 1992 about 84%, 1995 about 91%, 1998 about 97%, 2000 about 97%, 2004 about 97%, 2006 about 96%, 2008 about 90%, 2010 about 69%, 2011 about 48%, 2013 about 20%, 2016 about 11%, 2018 about 12%, 2021 about 16%, 2023 about 13%, 2025 about 12%. Legend: none. Highlighted points: none. Line colour red approximately #E8473F. No photographs, logos or icons.
Slide 5
Early leaders often disappear
The ‘first’ was not the winner in PCs, browsers, search, social or smartphones
Global PC unit sales share
IBM-compatible
All others
Apple
100%
75%
50%
25%
0%
1975
1980
1985
1990
1995
2000
Source: Gartner
Benedict Evans
–– November 2025
5
Visuals: One chart: a 100% stacked column chart titled Global PC unit sales share. Columns are annual, one per year from 1975 to 2000, with no gaps between columns but thin white separators. Vertical axis: 0% to 100% share of global PC unit sales, labelled at 0%, 25%, 50%, 75% and 100%. Horizontal axis: years 1975 to 2000, labelled every five years. Series stacked bottom to top: Apple in red (#E74C3C approx.), All others in light pink (#F8DBD8), IBM-compatible in dark grey (#535353). Estimated values, read from the image without printed data labels: 1975 Apple 0%, All others about 100%. 1979 Apple about 9%, All others about 91%. 1981 Apple about 14%, All others about 84%, IBM-compatible about 2%. 1983 Apple about 11%, All others about 54%, IBM-compatible about 35%. 1984 Apple about 29%, All others about 29%, IBM-compatible about 42%. 1985 Apple about 21%, All others about 10%, IBM-compatible about 69%. 1990 Apple about 7%, All others about 7%, IBM-compatible about 86%. 1995 Apple about 9%, All others about 1%, IBM-compatible about 90%. 2000 Apple about 3%, All others about 0%, IBM-compatible about 97%. Legend: a vertical list at top-left of the plot with small square swatches in dark grey, light pink and red, reading IBM-compatible, All others, Apple from top to bottom. No highlighted points.
Slide 6
How will the new thing work? We don’t know
For every new platform, we forget how many ideas failed and how unclear everything was
Internet
AOL, Yahoo,
Pointcast, Flash,
plugins, portals…
Sun? Netscape?
Mobile internet
i-mode, J2ME, WAP,
mesh, DVB-H,
keyboards…
Nokia? RIM?
Generative AI?
Browsers? Agentic?
Voice? MCP?
Wearables? GEO?
Benedict Evans
–– November 2025
6
Visuals: Three circles (ellipses with equal size, about 21.7% wide and 38.5% high each, filled white #FFFFFF). Circle 1 (left) and circle 2 (middle) have a dark grey #545454 outline about 0.3% of slide height thick; circle 3 (right) has a red #E84C3D outline of the same thickness, the only highlighted element. Each circle holds a bold heading and light body lines centred inside it: circle 1 'Internet' with 'AOL, Yahoo, / Pointcast, Flash, / plugins, portals…' and 'Sun? Netscape?'; circle 2 'Mobile internet' with 'i-mode, J2ME, WAP, / mesh, DVB-H, / keyboards…' and 'Nokia? RIM?'; circle 3 'Generative AI?' with 'Browsers? Agentic? / Voice? MCP? / Wearables? GEO?'. Two solid right-pointing isosceles triangles in light grey #A6A6A6, each about 1.9% wide and 6.9% high, sit vertically centred between circles at x about 43.2% and 70.7% (y about 50.0% to 57.0%), acting as sequence arrows from left to right. No photographs, logos or icons.
Slide 7
Noise, hype, anti-hype
When things are exciting, people get excited
FORTUNE
Subscr
NEWSLETTERS· CFO DAILY
MIT report: 95% of generative AI pilots at companies are failing
BY SHERYL ESTRADA
August 18, 2025 at 6:54 AM EDT
fortune.com
BUSINESS INSIDER
SLA +0.1%
DOW JONES +0.52%
NASDAQ +0.65%
S&P 500 +0.53%
AAP
AI
Anthropic's CEO says that in 3 to 6 months, AI will be writing 90% of the code software developers were in charge of
By Kwan Wei Kevin Tan
+ Follow
WORLD ECONOMIC FORUM
businessinsider.com
cnbc.com
make it
INVESTING
's a '10% to 20% chance' that AI placeplace humans completely, says ather' of the technology
ue, Jun 17 2025•2:54 PM EDT
n Jackson
Huddleston Jr.
Benedict Evans –– November 2025 7
Visuals: Three screenshot mock-ups of news web pages, each in a macOS-style browser window with red, yellow and green traffic-light buttons at top-left, a grey rounded address bar with a reload icon, and a soft drop shadow. Back to front: CNBC Make It window (right, top edge about y 18.7%, cut off on its left by the Business Insider window), Fortune window (left, top edge about y 16.2%, its right side covered by the Business Insider window), and Business Insider window (centre, front-most, top edge about y 18.7%). Fortune window: white page with a red Subscribe button, black condensed FORTUNE wordmark and hamburger icon; a red headline kicker; a serif headline; below it a photograph of hands typing on a laptop keyboard with glowing blue holographic icons, robot heads and a large glowing 'Ai' cube, blue-toned, cropped at the window bottom. Business Insider window: white page with black BUSINESS INSIDER wordmark and black circular hamburger button, a grey-green stock ticker strip, a small AI label, a large black sans headline, a blue byline link and outlined Follow pill; below is a photograph of a man in a dark navy suit and light blue shirt with glasses and curly hair, gesturing with one hand and speaking into a microphone, set against a royal-blue World Economic Forum backdrop with repeated white logo text, eye-level medium shot, cropped at the window bottom. CNBC Make It window: white page with a small CNBC peacock logo and bold 'make it' wordmark, a dark rule under the header, a purple INVESTING kicker, a large dark slate headline, a date line, author names, and red X, LinkedIn and email share icons; below is a photograph of an older man with grey hair in a light checked shirt in profile facing left, lit by a vivid magenta and green backdrop of grid panels, cropped by a teal-green rectangular frame offset to the right and bottom of the image.
Slide 8
This often brings bubbles
People draw straight lines on log scale charts
They forget that exponential growth is
generally an exponential curve
And always say “this is different”
The trouble is, they’re generally right - every
bubble is different! But it can still be a bubble
Benedict Evans –– November 2025 8
Visuals: One photograph-style illustration: the cover of the book “This Time Is Different” by Carmen M. Reinhart and Kenneth S. Rogoff, shown as a portrait book cover (about 410 by 635 px, aspect roughly 0.65) placed at x 61.6, y 8.0, w 26.9, h 74.1 with a soft grey drop shadow beneath it (a larger 579 by 862 px image at x 59.9, y 5.3, w 30.1, h 79.8 supplies the shadow). The cover is not cropped, not full-bleed, and is boxed with square corners. Cover subject: a flat vector illustration of a black-suited businessman in mid-fall with arms outspread, legs bent, a white shirt and dark tie, plus a dark briefcase and white papers tumbling from the upper right. A large white torn-looking sheet sits in the upper left carrying the title. Lighting is flat and even with a faint vignette darker toward the edges and bottom. Dominant colours: olive khaki gradient background about #A7A578 lightening to #B5B48A at the top, white sheet #FFFFFF, black figure #1A1A1A and grey shading #555555. Overlay: none. Cover text: “NEW YORK TIMES BESTSELLER” in white serif capitals with the first words italic; “Winner of the 2010 TIAA-CREF Paul A. Samuelson Award” in small white serif; “THIS TIME IS DIFFERENT” in large black condensed sans capitals on the white sheet; “Eight Centuries of Financial Folly” in italic serif; “CARMEN M. REINHART & KENNETH S. ROGOFF” in black condensed sans capitals; and “‘A masterpiece.’ —Martin Wolf, Financial Times” in small white serif at lower left.
Slide 9
But when the dust settles, the world has changed
The internet has gone from the New Thing to a basic part of daily life
US heterosexual couples who met online, by year of meeting
60%
50%
40%
30%
20%
10%
0%
1995
2000
2005
2010
2015
2020
Source: Rosenfeld HCMST
Benedict Evans
–– November 2025
9
Visuals: One line chart. Type: line chart with a single smooth red series. Title: 'US heterosexual couples who met online, by year of meeting'. Y axis: percentage, 0% to 60%, gridlines and labels every 10%. X axis: years, labelled 1995, 2000, 2005, 2010, 2015 and 2020, with the line running from 1995 to about 2022. No values are printed, so estimates are marked 'about': the series starts at about 2% in 1995, is about 10% in 2000, about 19% in 2005, about 20% in 2010, about 32% in 2015, about 48% in 2020, and ends at about 59% around 2022. Legend: none. Highlighted points: none. Series line is red (#E8473B) about 3 px thick with no markers.
Slide 10
New platforms mean new tools (and new revenue)
SaaS means the typical large enterprise in the USA now uses 4-500 apps
Mainframes
One app
PCs
Dozens of apps
SaaS
4-500 apps*
LLMs
What can we automate next?
*Source: Productiv
Benedict Evans –– November 2025 10
Visuals: Four filled circles in a left-to-right process flow, with three grey right-pointing triangle arrows between them. Circle 1 (dark grey) reads Mainframes / One app. Circle 2 (dark grey) reads PCs / Dozens of apps. Circle 3 (dark grey) reads SaaS / 4-500 apps*. Circle 4 (red) reads LLMs / What can we automate next?. Each arrow is a solid isosceles triangle pointing right, about 2% of slide width and 7% of slide height, placed in the gap between adjacent circles at about 50% to 57% of slide height. No photographs, charts or logos.
Slide 11
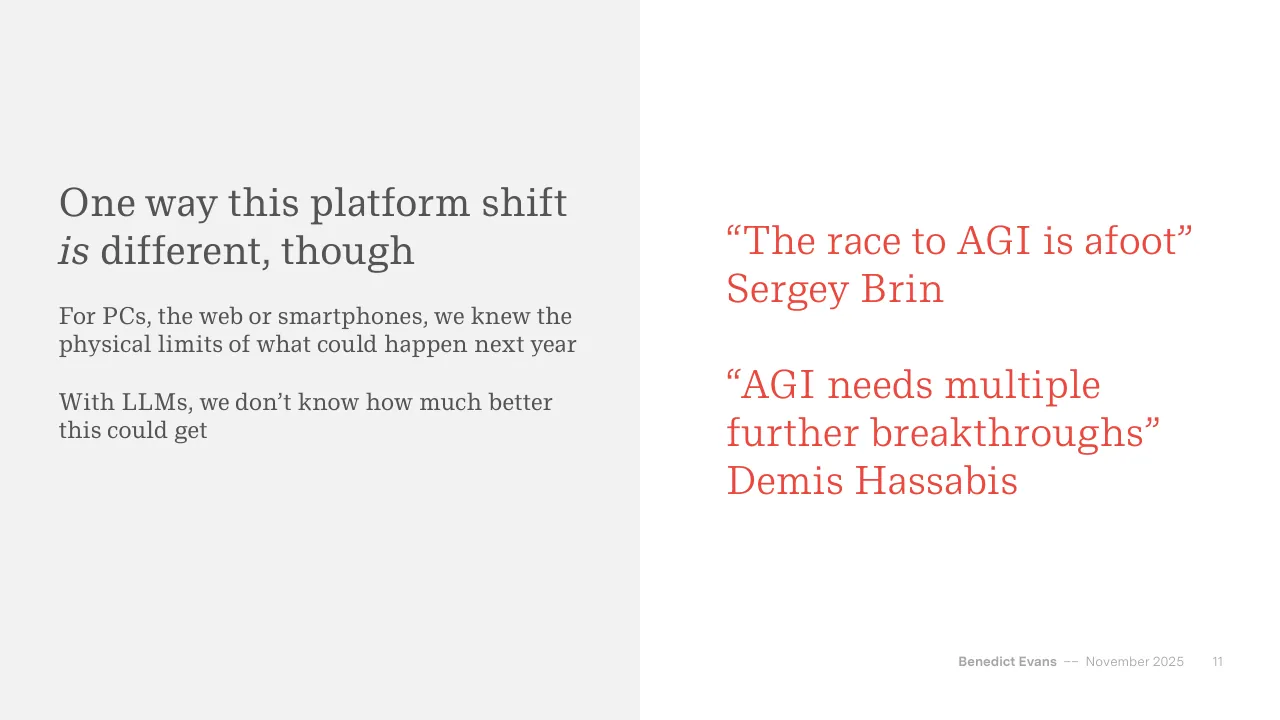
One way this platform shift is different, though / For PCs, the web or smartphones, we knew the / physical limits of what could happen next year / With LLMs, we don’t know how much better / this could get / “The race to AGI is afoot” / Sergey Brin / “AGI needs multiple / further breakthroughs” / Demis Hassabis / Benedict Evans –– November 2025 11
Slide 12
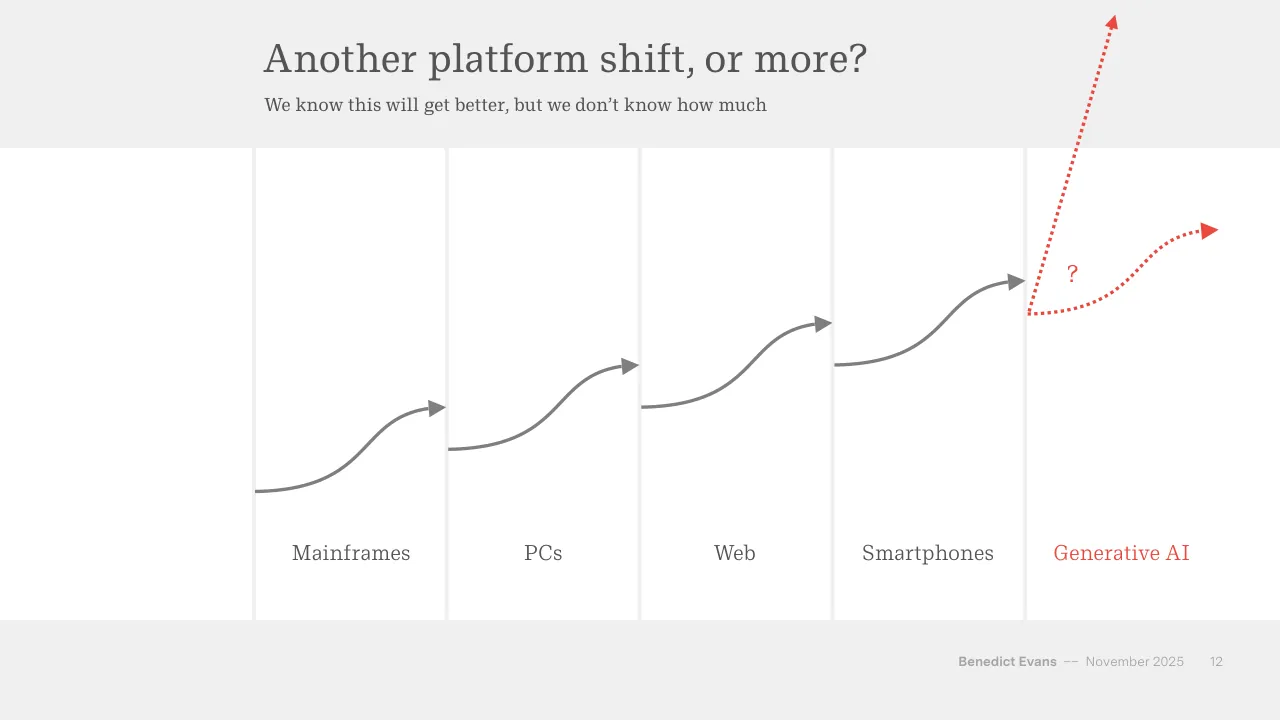
Another platform shift, or more?
We know this will get better, but we don’t know how much
?
Mainframes
PCs
Web
Smartphones
Generative AI
Benedict Evans
–– November 2025
12
Visuals: Five grey curved arrows (stroke #808080, about 0.4% of slide height, arrowheads filled #808080) step upward from left to right, one per platform: Mainframes curve from about (20.0%, 68.3%) rising to an arrowhead at about (34.8%, 56.6%); PCs curve from about (35.1%, 62.5%) to an arrowhead at about (49.8%, 50.7%); Web curve from about (50.1%, 56.5%) to an arrowhead at about (64.9%, 44.8%); Smartphones curve from about (65.2%, 50.7%) to an arrowhead at about (80.0%, 38.9%). Each curve is an S-shaped bezier, flattening at its start and end. In the Generative AI column, a red (#EB483F) dotted arrow rises steeply from about (80.4%, 43.6%) to an arrowhead at about (80.9%, 2.0%), leaving the top edge of the slide; a second red dotted arrow leaves the same origin, runs gently right and up in an S-curve to an arrowhead at about (95.1%, 31.7%). A red question mark sits between the two red arrows at about (83.3%, 36.5%). No photographs, logos or icons.
Slide 13
So how will the new thing turn out? / If this is ‘only’ as big as mobile or the internet, that seems like enough / How will this work? / How will this be useful? / Where is the / distribution, / value capture, / and value / destruction? / Benedict Evans / –– November 2025 / 13
Visuals: Three identical solid red circles, each about 22.1% of slide width and 39.3% of slide height, filled #EB483F with no outline, no shadow. Each circle holds centred white serif text: left circle 'How will this / work?', middle circle 'How will this / be useful?', right circle 'Where is the / distribution, / value capture, / and value / destruction?'. No photographs, charts, logos or icons.
Slide 14
Inside tech
Benedict Evans –– November 2025
14
Slide 15
“The risk of under-investing / is significantly greater than / the risk of over-investing” / Sundar Pichai, Q2 2024 / “The very worst case would / be that we have just pre- / built for a couple of years” / Mark Zuckerberg, Q3 2025 / Benedict Evans –– November 2025 / 15
Slide 16
Three years of FOMO in Big Tech
“This is a huge new market, a huge threat to all our existing businesses, and we can’t miss it”
“This is a huge / opportunity and / threat / We can’t miss it”
“It keeps / getting better / with more / capex”
How much / better? / How much / capex?
Benedict Evans –– November 2025 16
Visuals: Three filled circles connected left to right by two small grey right-pointing triangular chevrons. Circle 1 is dark grey #535353 containing the white serif text “This is a huge opportunity and threat / We can’t miss it”. Circle 2 is dark grey #535353 containing the white serif text “It keeps getting better with more capex”. Circle 3 is red #EB483F containing the white serif text “How much better? / How much capex?”. Each chevron is a solid light grey #A6A6A6 isosceles triangle pointing right, positioned in the gap between circles, vertically centred on the circles. Circles are equal in size, about 22.1% of slide width and 39.3% of slide height, with no shadows, gradients or outlines. No photographs, charts or logos.
Slide 17
FOMO drives a capex surge
~$400bn in 2025 for the big four alone (for comparison, global telecoms is ~$300bn)
Capex ($bn)
Coreweave
Oracle
Meta
Alphabet
AWS*
Microsoft
500
400
300
200
100
0
2010 2011 2012 2013 2014 2015 2016 2017 2018 2019 2020 2021 2022 2023 2024 2025e
Source: Companies, company guidance. Includes capital leases
* Amazon does not break out AWS capex directly
Benedict Evans –– November 2025 17
Visuals: Chart: stacked vertical bar chart, one bar per year, 2010 to 2024 plus 2025e (estimate). Title printed above the axis: Capex ($bn). Y-axis runs from 0 to 500 in steps of 100 with light grey dotted horizontal gridlines at each step; the 500 gridline is at about 500 and the top of the plot is about 550. X-axis labels are the years 2010, 2011, 2012, 2013, 2014, 2015, 2016, 2017, 2018, 2019, 2020, 2021, 2022, 2023, 2024, 2025e. Six stacked series, from bottom to top: Microsoft (red #EE4B3E), AWS* (salmon #F4A29C), Alphabet (pale pink #F2D6D2), Meta (black #000000), Oracle (dark grey #4F4F4F), Coreweave (mid grey #A6A6A6). Thin white separators sit between segments. No data values are printed on the bars. Approximate totals: 2010 about 5, 2011 about 6, 2012 about 8, 2013 about 17, 2014 about 20, 2015 about 22, 2016 about 35, 2017 about 38, 2018 about 62, 2019 about 64, 2020 about 63, 2021 about 97, 2022 about 128, 2023 about 140, 2024 about 245, 2025e about 438. Estimated 2025e segments: Microsoft about 118, AWS* about 102, Alphabet about 92, Meta about 73, Oracle about 32, Coreweave about 19. Estimated 2024 segments: Microsoft about 76, AWS* about 57, Alphabet about 55, Meta about 37, Oracle about 10, Coreweave about 10. Legend (top to bottom, square swatches): Coreweave, Oracle, Meta, Alphabet, AWS*, Microsoft. No bars are highlighted; the 2025e bar is the tallest and is the last bar at the right.
Slide 18
Planned 2025 growth almost doubled - in 2025
~$350bn in 2025 for the big four alone (for comparison, global telecoms is ~$300bn)
Capex ($bn)
Coreweave
Oracle
Meta
AWS*
Alphabet
Microsoft
500
400
300
200
100
0
2010
2011
2012
2013
2014
2015
2016
2017
2018
2019
2020
2021
2022
2023
2024
2025e
Jan est
for 2025
Source: Companies, company guidance. Includes capital leases
* Amazon does not break out AWS capex but reports it as ‘the majority’
Benedict Evans
–– November 2025
18
Visuals: Stacked vertical bar chart titled 'Capex ($bn)'. Y axis: capex in $bn, linear scale from 0 to 500 with labelled gridlines at 0, 100, 200, 300, 400 and 500, drawn as thin dotted light grey horizontal lines. X axis: categories 2010, 2011, 2012, 2013, 2014, 2015, 2016, 2017, 2018, 2019, 2020, 2021, 2022, 2023, 2024, 2025e, Jan est for 2025, with a thin grey baseline at 0. Series stacked bottom to top: Microsoft (red #EE4B3E), Alphabet (salmon #F4A29E), AWS* (pale pink #F2D4D2), Meta (black #000000), Oracle (dark grey #545454), Coreweave (mid grey #A6A6A6). Approximate stacked totals (about, no values printed): 2010 about 5; 2011 about 7; 2012 about 8; 2013 about 17; 2014 about 20; 2015 about 22; 2016 about 35; 2017 about 38; 2018 about 62; 2019 about 65; 2020 about 63; 2021 about 97; 2022 about 128; 2023 about 140; 2024 about 244; 2025e about 437; Jan est for 2025 about 325. Microsoft segment about: 2021 about 27; 2022 about 28; 2023 about 41; 2024 about 76; 2025e about 118; Jan est about 87. Legend at left, top to bottom: Coreweave, Oracle, Meta, AWS*, Alphabet, Microsoft, each with a small filled square. No highlighted points; bars have thin white separators between segments.
Slide 19
A new investment cycle
US data centre construction overtaking offices
US construction value (2025 $bn, seasonally adjusted annual rate)
Offices
125
Retail
Warehouses *
Data centres**
100
75
50
25
0
Jan 1995
Jan 2000
Jan 2005
Jan 2010
Jan 2015
Jan 2020
Jan 2025
Source: US Census. * Excludes mini-storage ** Excludes compute
Benedict Evans
–– November 2025
19
NB: data after July 2025 delayed by US government shutdown
Visuals: Chart: multi-series line chart, titled 'US construction value (2025 $bn, seasonally adjusted annual rate)'. Y axis: 0 to 125 in $bn, labelled ticks at 0, 25, 50, 75, 100, 125, with thin dotted horizontal gridlines at each labelled tick. X axis: monthly time series from Jan 1995 to Jan 2025, with tick labels at Jan 1995, Jan 2000, Jan 2005, Jan 2010, Jan 2015, Jan 2020, Jan 2025; a thin solid grey baseline at 0. Series (no printed values, estimates marked about): Offices (dark charcoal #4D4D4D, solid 2 px line): starts about 53 in 1995, peaks about 116 in early 2000, falls to about 34 around 2010, rises to about 95 around 2019, ends about 47 in Jan 2025. Retail (mid grey #AAAAAA): starts about 45, about 58 in 2001, peaks about 85 around 2007, falls to about 20 in 2021, ends about 23. Warehouses * (light salmon #F4A6A6): starts about 17, peaks about 31 around 2001, about 9 around 2010, rises to about 84 around 2023, ends about 49. Data centres ** (red #E8362D, thicker line): begins about 2 in early 2014, about 12 in 2020, rises steeply to about 42 by Jan 2025. Legend: four entries at top-left of the plot, each a short coloured line sample followed by its label: Offices (charcoal), Retail (grey), Warehouses * (salmon), Data centres ** (red). No highlighted points or annotations.
Slide 20
Nvidia can’t keep up
Trying to build a new Sun Microsystems (though China and hyperscalers’ own chips are coming up behind)
Quarterly revenue ($bn)
Intel
Nvidia
60
50
40
30
20
10
0
2000
2005
2010
2015
2020
2025
Source: Companies
Benedict Evans –– November 2025 20
Visuals: Line chart titled Quarterly revenue ($bn). Y axis: quarterly revenue in US$ billions, linear scale from 0 to 60, gridlines and labels every 10 (0, 10, 20, 30, 40, 50, 60), light dotted grey gridlines, baseline at 0 drawn as a thin solid grey line. X axis: time in years, labels 2000, 2005, 2010, 2015, 2020, 2025, quarterly data points from 2000 to about the end of 2025. Series 1, Intel, dark grey line about 2 px wide: about 8 in 2000, dips to about 6.5 in 2001 to 2003, about 10 in 2006, about 14 in 2008, about 7 in 2009, about 11 in 2011, about 14 to 15 in 2014 to 2015, about 20 peak around 2019 to 2020, about 20 in 2021, about 20.5 peak around early 2022, falls to about 15 in 2022, about 12 low in early 2023, about 13 to 15 in 2023 to 2025, about 13 at the end. Series 2, Nvidia, red line about 2 px wide: about 0.2 in 2000 to 2002, about 1 in 2008, about 1 in 2010, about 2 in 2015, about 3 in 2018, about 2.5 in 2019, about 3 in 2020, about 5 in 2021, about 8.5 peak in early 2022, falls to about 6 in 2022, about 7 in early 2023, then rises steeply to about 19 in early 2024, about 30 mid-2024, about 44 late 2024, about 47 in early 2025, and about 57 at the last point in late 2025. Legend: at upper left outside the plot, Intel with short dark grey line sample, Nvidia with short red line sample, stacked vertically. No highlighted points or annotations. No values are printed on the data lines other than the axis labels.
Slide 21
Nvidia can’t keep up (neither can TSMC) / TSMC unwilling/unable to expand capacity fast enough to meet Nvidia’s book / Quarterly revenue ($bn) / Intel / Nvidia / TSMC / 60 / 50 / 40 / 30 / 20 / 10 / 0 / 2000 / 2005 / 2010 / 2015 / 2020 / 2025 / Source: Companies / Benedict Evans / –– November 2025 / 21
Visuals: One line chart titled Quarterly revenue ($bn), with no chart title inside the plot beyond that label. Type: multi-series line chart with solid and dashed lines, no markers. Y axis: linear, $bn, range 0 to 60, labelled ticks 0, 10, 20, 30, 40, 50, 60, with light grey dotted horizontal gridlines at each tick and a solid thin grey baseline at 0. X axis: time, quarterly, 2000 to about 2025, labelled every 5 years (2000, 2005, 2010, 2015, 2020, 2025), no axis title. Series: Intel, dark grey (#545454) solid line, about 8 in 2000, about 6.5 in 2001, about 7 in 2002, about 10 in 2005, about 10.5 in 2008, about 7.5 in 2009, about 10 in 2010, about 13 in 2011, about 13.5 in 2014, about 19 in 2018, about 20 in 2020, about 20.5 peak in 2022, about 15 in 2023, about 12 low in late 2023, about 13 in 2024, about 15.5 in 2024, about 13 at end 2025. Nvidia, red (#E8473F approx.) solid line, about 0.3 in 2000 rising slowly to about 1 in 2010, about 2 in 2016, about 3 in 2018, about 3 in 2020, about 5 in 2021, about 8.5 in 2022, about 6 low in 2023, about 7 in 2023, rising steeply to about 57 at the far right end in 2025, with about 47 just before. TSMC, red (#E8473F approx.) dashed line, about 1 in 2000, about 2 in 2001, about 3 in 2008, about 1 in 2009, about 4 in 2011, about 5 in 2013, about 7 in 2015, about 10 in 2019, about 12.5 in 2021, about 15 in 2022, about 20 peak in 2023, about 16 in 2023 trough, about 20 in 2024, about 27 in 2025, about 30 at the far right end. No legend box; legend is a list of three line-sample keys at left. No highlighted points or annotations.
Slide 22
US power backlogs becoming a major issue
US power demand growth is ~2%, and AI might add 1% that’s hard to build fast (this is not an issue in China)
Main constraints to data centre construction, USA (February 2025)
Somewhat significant
Very significant
Extremely significant
100%
75%
50%
25%
0%
Utility power
Access to chips
Fibre
Permitting
Water
availability
Access to
natural gas
Land
Public
opposition
Source: Schneider Electric industry survey
Benedict Evans
–– November 2025
22
Visuals: One stacked vertical bar chart, titled 'Main constraints to data centre construction, USA (February 2025)'. Eight categories on the x-axis, left to right: Utility power, Access to chips, Fibre, Permitting, Water availability, Access to natural gas, Land, Public opposition. Y-axis: percentage of respondents, 0% to 100%, gridlines (dotted, light grey) at 25%, 50%, 75% and 100%. Three stacked series, bottom to top: Extremely significant (red #EB483F), Very significant (pale pink #FBDAD9), Somewhat significant (grey #7F7F7F). Values are not printed; estimates marked about from bar heights: Utility power about 40 / 33 / 19 (total about 92); Access to chips about 32 / 34 / 15 (total about 81); Fibre about 26 / 33 / 26 (total about 85); Permitting about 26 / 30 / 30 (total about 86); Water availability about 21 / 20 / 32 (total about 73); Access to natural gas about 19 / 23 / 34 (total about 76); Land about 17 / 30 / 27 (total about 74); Public opposition about 16 / 25 / 33 (total about 74). Legend at upper left of chart, stacked vertically in order top to bottom: Somewhat significant, Very significant, Extremely significant, each with a small solid square swatch. No highlighted points. Bars are evenly spaced, about 6.2% of slide width wide, with thin white separators between segments. Source: Schneider Electric industry survey.
Slide 23
“It’s been almost impossible to build / capacity fast enough since ChatGPT / launched” / Kevin Scott, Microsoft CTO / Benedict Evans –– November 2025 / 23
Slide 24
“We now expect the FY26 growth rate to be / higher than FY25” - Microsoft
“Capex dollar growth will be notably larger in / 2026” - Meta
“We expect a significant increase in 2026” - / Alphabet
Benedict Evans –– November 2025 24
Slide 25
Data centre capacity triples? For $3tr? $5tr? More? / Some very large numbers (although some of the ‘bragawatts’ may be more performative than real) / Global data centre capacity estimates, H1 2025 (GW) / Current / Est. of 2030 plans / 300 / 200 / 100 / 0 / Omdia/IEA / Bloomberg BNEF / Goldman Sachs / Morgan Stanley / Bain / BCG / McKinsey / Source: Companies / Benedict Evans / –– November 2025 / 25
Visuals: Chart: clustered column chart titled 'Global data centre capacity estimates, H1 2025 (GW)'. Y axis: capacity in GW, linear, range 0 to 300, labelled ticks at 0, 100, 200, 300, faint dotted horizontal gridlines at each labelled tick. X axis: seven categories, labels Omdia/IEA, Bloomberg BNEF, Goldman Sachs, Morgan Stanley, Bain, BCG, McKinsey, shown with a thin grey baseline at 0. Two series per category: 'Current' as dark grey (#535353) columns and 'Est. of 2030 plans' as red (#EB483F) columns; no values are printed on the bars, so values are estimates marked about. Current (about): Omdia/IEA about 97, Bloomberg BNEF about 79, Goldman Sachs about 74, Morgan Stanley about 84, Bain about 69, BCG about 80, McKinsey about 81. Est. of 2030 plans (about): Omdia/IEA about 195, Bloomberg BNEF about 221, Goldman Sachs about 149, Morgan Stanley about 250, Bain about 163, BCG about 169, McKinsey about 218. Legend at upper left of chart: dark grey square 'Current' above red square 'Est. of 2030 plans'. No highlighted points.
Slide 26
“Three trillion dollars!”
Annualised AI capex aspirations are a similar magnitude to mature global capital-intensive industries
Global
telecoms
~$300bn
Oil & gas
‘upstream’
~$540bn
US private
sector
~$20.1tr
GenAI
$500-750bn
annual?
Source: ITU, IEA, ONS
Benedict Evans
–– November 2025
26
Visuals: Four filled circles, each about 16.2% of slide width and 28.8% of slide height, arranged in a row. Circle 1 (dark grey #535353) reads 'Global telecoms ~$300bn'. Circle 2 (dark grey #535353) reads 'Oil & gas ‘upstream’ ~$540bn'. Circle 3 (dark grey #535353) reads 'US private sector ~$20.1tr'. Circle 4 (red #EB483F) reads 'GenAI $500-750bn annual?' and is the only highlighted point. No chart, photograph, logo or icon. Each circle is a flat fill with no outline, shadow or gradient, and the text is centred in each circle.
Slide 27
The hyperscalers can afford it…
Big Tech cashflow has surged since the Pandemic, and most of that growth is going on AI capex
Annual Capex and Free Cash Flow, 2010 to 2025e ($bn)
Cash capex
200
FCF
150
100
50
0
-50
Alphabet
Amazon
Meta
Microsoft
Source: Companies, consensus estimates. Calendar year.
Benedict Evans
–– November 2025
27
Visuals: Chart: clustered-stacked column chart titled 'Annual Capex and Free Cash Flow, 2010 to 2025e ($bn)'. Four company groups along the x-axis, left to right: Alphabet, Amazon, Meta, Microsoft, each with about 16 annual columns (2010 to 2025e, calendar years, oldest at left). Each column is a stacked pair: grey FCF segment at the bottom and red Cash capex segment on top. Y-axis in $bn, labelled 200, 150, 100, 50, 0, -50, dotted gridlines at 200, 150, 100 and 50, a solid baseline at -50 and a faint dotted zero line; scale approx 1.97 px per $bn. Legend: red square 'Cash capex', dark grey square 'FCF', stacked top-left of the plot. Values are estimates, as the slide prints no bar values. Alphabet: final (2025e) column about 161 total, FCF about 69, capex about 92; earlier columns rise from about 10 total in 2010 to about 91 by 2023. Amazon: early columns near 0 to 10; a dip with FCF about -20 in the two columns before the final years (about 2022 and 2023); final column about 135 total with FCF about 10 and capex about 125. Meta: columns rise from near 0 to a final column about 128 total, FCF about 60, capex about 68. Microsoft: columns rise from about 25 to a final column about 155 total, FCF about 74, capex about 81. No highlighted points. Flat design, no shadows or gradients.
Slide 28
The hyperscalers can afford it… up to a point / Capital leases are not new, but they’ve got a lot bigger / Annual Capex and Free Cash Flow, 2010 to 2025e ($bn) / Leases / Cash capex / FCF / 200 / 150 / 100 / 50 / 0 / -50 / Alphabet / Amazon / Meta / Microsoft / Source: Companies, consensus estimates. Calendar year. / Benedict Evans / –– November 2025 / 28
Visuals: Chart: stacked column chart titled Annual Capex and Free Cash Flow, 2010 to 2025e ($bn). Y axis labelled in $bn with gridlines (dotted, light grey) at 200, 150, 100, 50, 0 and -50, range about -50 to 200; a solid grey zero baseline sits at 0 with a darker axis line at the bottom at -50. X axis groups by company: Alphabet, Amazon, Meta, Microsoft, each group a run of thin adjacent columns representing successive calendar years from 2010 to 2025e. Each column is stacked: dark grey FCF at the bottom, mid grey Cash capex above it, red Leases on top where present; columns are separated by thin white gaps. Alphabet columns rise from about 10 in early years to about 160 total in the last column (about 69 FCF, about 91 cash capex on top, leases none). Amazon columns rise from near 0 to about 135 total in the last column (about 10 FCF, about 125 cash capex), with negative FCF bars below zero of about -20 in two years. Meta columns rise from near 0 to about 128 total in the last column (about 60 FCF, about 68 cash capex). Microsoft columns rise from about 25 to about 194 total in the last column (about 74 FCF, about 81 cash capex, about 39 leases in red at the top); the Microsoft leases segments are visible from about 2023 onward, with the last few columns showing red segments of roughly 5 to 39. Legend at upper left of chart: red square Leases, mid grey square Cash capex, dark grey square FCF, stacked vertically. No highlighted points beyond the red lease segments. Values other than the printed axis ticks are estimates marked about.
Slide 29
Up to a point / Hyperscalers add leases and debt, while some analysts suggest Oracle’s cloud capex might be >100% of revenue / ft.com / FINANCIAL TIMES / © FT montage/The Washington Post/Ge / Big Tech / + Add to myFT / ‘Absolutely immense’: the companies on the hook for the $3tn AI building boom / Private capital joins Big Tech in seeking to capture rewards fro / historic expansion of data centres / wsj.com / WSJ / Oracle Isn’t Answering the Hardest Questions About Its AI Plans / Software giant boosts long-term targets, but paying for an artificial-intelligence build-out will stretch its resources / By Dan Gallagher Follow / Oct. 17, 2025 at 5:30 am ET / reuters.com / Reuters / My News / Meta taps PIMCO, Blue Owl for $29 billion data center expansion project, source says / By Chandni Shah and Surbhi Misra / August 7, 2025 11:10 PM EDT · Updated August 7, 2025 / Aa / A Meta logo is pictured at a trade fair in Hannover Messe, in Hanover, Germany, April 22, 2024. / Benedict Evans –– November 2025 / 29
Visuals: Three screenshot mockups of news websites in browser-window frames, each with red, yellow and green traffic-light dots at top left, a grey rounded address bar with a reload icon, and a white or tinted page beneath. Left, ft.com: a peach-coloured Financial Times masthead with a hamburger icon and the FINANCIAL TIMES wordmark in serif capitals; below, a black-and-white photograph of a chain-link fence with a field of earth mounds and a digger behind it, with red diagonal lines overlaid across the image and the credit line '© FT montage/The Washington Post/Getty Images' partly cropped by the WSJ window; the photo is cropped at the window edge. Then 'Big Tech' in red, an outlined pill button '+ Add to myFT', a bold serif headline in three lines, a short black rule, and a sans-serif standfirst; the peach panel is a pale salmon tone. Middle, wsj.com: a white window with a hamburger icon and the WSJ serif wordmark centred; bold serif headline in two lines, a grey sans standfirst, a blue italic byline 'Dan Gallagher' with an outlined 'Follow' button, grey italic dateline, and a row of five grey line icons (share, bookmark, text size 'AA', comment bubble, headphones). Below is a photograph of a man with light hair in a dark navy sweater sitting in a dark armchair on a stage, gesturing with one hand, with a small green side table bearing a plant and water bottle at left; behind him is a large red ring-shaped stage backdrop on a deep magenta-purple background; lighting is warm stage light, the image is full-width within the window and cropped at the bottom edge. Right, reuters.com: a white window with the orange dotted Reuters logo and wordmark at left, 'My News' text, a magnifier icon and hamburger icon at right; bold sans headline in two lines, grey byline with names in bold, grey dateline, three outlined icon buttons (bookmark, 'Aa', share), and below a photograph of the Meta logo: a blue infinity-loop symbol and black 'Meta' lettering on a pale beige wall, shallow depth of field, lit softly from the front; the photo is cropped at the window bottom. An orange-red circular floating button with a white sparkle icon overlaps the lower-left corner of the photo, and a small grey caption sits beneath the photo. No logos other than the Reuters, WSJ, FT and Meta marks.
Slide 30
OpenAI joins the club
Announced commitments for 30GW+ of
capacity at $1.4tr
Aspiration for 1GW/week of new construction
at $20bn/GW = ~$1tr annually...
Equivalent to 2/3 of total current global base,
every year
Source: OpenAI, October 28 2025
Benedict Evans
–– November 2025
30
TECHNOLOGY
OpenAI Unveils Plans for
Seemingly Limitless Expansion of
Computing Power
In Texas prairie, startup showcases ground zero of AI boom and
its plans to shepherd $1 trillion in infrastructure spending
By Berber Jin Follow
Updated Sept. 23, 2025 at 7:13 pm ET
EXPLORE OUR BRANDS
DJIA Futures 46429.00 0.10%
S&P 500 Futures 6711.00 0.13%
Nasdaq Futures
wsj.com
WSJ
Visuals: A screenshot mockup of a Wall Street Journal web article inside a browser window with rounded corners and a soft drop shadow, occupying about x 57.1-92.8%, y 11-89%. Browser chrome: three circular traffic-light dots (red, yellow, green) at top-left, a grey rounded address bar reading 'wsj.com' with a reload icon, white background. Below is a black bar reading 'EXPLORE OUR BRANDS' with a chevron, then a ticker strip with 'DJIA Futures 46429.00 0.10%' with green up arrow, 'S&P 500 Futures 6711.00 0.13%' with green up arrow, and 'Nasdaq Futures' cut off at the edge. Then a hamburger menu icon at left, the 'WSJ' masthead logo centred, and a thin rule. Article content: blue 'TECHNOLOGY' kicker, large black serif headline, grey dek, byline 'By Berber Jin' in italic serif with a blue 'Follow' outlined button, 'Updated Sept. 23, 2025 at 7:13 pm ET' in grey italic, a row of line icons (share, bookmark, text size AA, comment bubble, headphones). Bottom of the mockup shows a photograph, cropped at the frame edge: a group of about six men seated/standing in front of a dark backdrop with large illuminated 'ORACLE' letters in white/blue neon; a man in the centre wearing a grey sweater holds a black microphone; men at left wear dark blue jackets and a checked blazer; men at right wear a navy jacket and a white patterned shirt with grey hair. Lighting is even stage lighting, dominant colours are dark charcoal, white and neon blue.
Slide 31
“Circular revenue”
Without its own cashflows, OpenAI partners with Nvidia, Oracle, Softbank, petrodollars…
OpenAI is buying Nvidia chips with Nvidia’s cashflow…
Which comes from the hyperscalers…
and using Nvidia’s cash to turn AMD into an Nvidia competitor, and pay Broadcom to make its own chips…
Benedict Evans
–– November 2025
31
ft.com
FINANCIAL TIMES
The circle of AI: how capital… / Customer / Repurchase agreeme… / Investor / Vendor financing/fav… / $TBD / $36bn / Oracle / $0.75bn / AMD / Sources: Company data; Morgan Stanley resea… / © FT / This is just one of the f… / visited on the markets / preliminary agreement… / $100bn in equity in 10… / placing orders for 1GW… / confirmed last month t…
bloomberg.com
Bloomberg
The AI Race: Bubble Fears / AGI Explained / Circular Deals / Regulators Struggle / US Versus C…
How Nvidia and OpenAI Fuel the AI Money Machine
Hardware or Software / Investment / Services / Venture Capital
Circles sized by market value
Microsoft $3.9T / Ambience Healthcare / Harvey AI / Nebius / CoreWeave / Anysphere / OpenAI $500B / Intel / Nvidia agrees to invest up to $100 billion in OpenAI. / OpenAI to deploy 6 gigawatts of AMD GPUs. AMD gives OpenAI option to buy up to 160 million shares. / Nvidia $4.5T / OpenAI inks a $300 billion cloud deal with Oracle. / AMD / Oracle spends tens of billions on Nvidia chips. / Nscale / Mistral / Figure AI / xAI / Oracle
Visuals: Two overlapping browser-window screenshots on the right half, both in macOS-style windows with red, yellow and green window dots and a rounded address bar. Back window: Financial Times web page at ft.com, cream/peach page background (about #FBE9D7), black serif FINANCIAL TIMES masthead, a blue-line diagram titled 'The circle of AI: how capital...' with legend (Customer solid blue arrow, Investor dashed blue arrow, Repurchase agreement, Vendor financing/favour); boxes in dark blue #1F5C99 with white labels Oracle and AMD, a dotted blue arrow labelled $36bn, a solid blue loop arrow labelled $TBD at top and $0.75bn beside a vertical arrow; partly hidden by the front window, with a body-text fragment and a source line beneath. Front window (overlapping lower right, bottom edge at about 91% of height): Bloomberg page at bloomberg.com with solid black header bar (#000000) holding white Bloomberg wordmark and menu icon, a sub-nav row in black text on white, and a chart titled 'How Nvidia and OpenAI Fuel the AI Money Machine' drawn as a network diagram on a light grey (#F2F2F2) field. Nodes are grey circles (#D9D9D9) sized by market value, with labels: Microsoft $3.9T (top), Nebius (small node), CoreWeave, Intel (right), Ambience Healthcare and Harvey AI and Anysphere (small nodes at left), OpenAI $500B (large circle, upper left, bold), Nvidia $4.5T (centre-lower, bold), AMD (large circle, left), Nscale, Mistral, Figure AI (small nodes lower left), xAI (bottom), Oracle (large circle, bottom right). Arrows are coloured by category: magenta for hardware or software, cyan for investment, blue for services, green for venture capital, with arrowheads, and short annotations (OpenAI to deploy 6 gigawatts of AMD GPUs; Nvidia agrees to invest up to $100 billion in OpenAI; OpenAI inks a $300 billion cloud deal with Oracle; Oracle spends tens of billions on Nvidia chips). Legend at top of chart. Both screenshots are boxed with soft drop shadows; the Bloomberg window is cropped at the bottom edge.
Slide 32
Rational actors?
What would you do if your company was sitting on a bubble?
Nvidia has $77bn of TTM
FCF* and TSMC can’t keep
up with demand
Use your excess cash to
buy demand, FOMO and
platform lock-in
OpenAI has mindshare
and expensive stock, but
no platform, infra or moat
Swap your paper for hard
assets and market position
Oracle is a cash-generative
legacy business losing share
to cloud and now to AI
Gear up and burn your
way into the new thing?
*Source: Nvidia
Benedict Evans
–– November 2025
32
Visuals: Three identical horizontal red dotted arrows, one in each white band, vertically centred on each statement pair. Each arrow is a dotted line of small round dots running from about x 49.4% to x 65.0% of slide width, ending in a small solid filled triangular arrowhead pointing right. Arrow 1 at about y 30.3%, arrow 2 at about y 53.1%, arrow 3 at about y 75.7%. Dot colour and arrowhead colour approximately #E8453C red. No photographs, charts, tables, logos or icons.
Slide 33
Yes, but where has all this money got us? / After three years, lots more science and engineering, but no real clarity on the shape of the market / Models still / improving / Far more models, / China, OSS / Lots of new / acronyms / No apparent / moats / No clarity on / product or value / capture / Benedict Evans / –– November 2025 / 33
Visuals: Two filled circles and a dotted divider line, arranged as a simple left-versus-right comparison with no arrows or labels other than the text inside the circles. Left circle: solid dark grey #535353 disc, about 22.1% of slide width and 39.3% of slide height, centred at about x 35.5%, y 53.6%, containing three centred white statements. Right circle: solid red #EB483F disc of the same size, centred at about x 70.5%, y 53.6%, containing two centred white statements. Between them: a vertical dotted line in red #EB483F, about 0.3% wide, running from about y 31.6% to y 78.0% at about x 53.0%, with round dots. No photographs, icons or logos.
Slide 34
Far more models
Every week - new models, new (problematic, gamed, saturated) benchmarks, new acronyms
Models by aggregate benchmark score
OpenAI
All other
75
50
25
0
Nov 2022
Nov 2023
Nov 2024
Nov 2025
Source: ArtificialAnalysis
Benedict Evans
–– November 2025
34
Visuals: Chart: scatter plot titled 'Models by aggregate benchmark score'. Y axis: aggregate benchmark score, unitless, range 0 to about 80 with labelled ticks at 0, 25, 50 and 75; dotted light grey horizontal gridlines at 25, 50 and 75 and a thin solid grey baseline at 0. X axis: date, labelled ticks at Nov 2022, Nov 2023, Nov 2024 and Nov 2025 with the plot running from Nov 2022 to Nov 2025; small tick marks at the Nov 2023 and Nov 2024 positions. Series 1, 'OpenAI', red circles (about 15 px diameter, white thin outline). Series 2, 'All other', dark grey circles of the same size with white outline. No values are printed; estimates: the lowest OpenAI point is about 9 in Nov 2022; about 22 near early 2023; about 24 near Nov 2023; about 26 near mid 2024; about 29 near late 2023; about 45 and 40 near late 2023; about 47 and 49 around early-mid 2024; about 51 to 69 across late 2024 and 2025 with the highest OpenAI points about 69 and 67 in late 2025. Most non-OpenAI points lie between about 5 and 60, with the densest cluster between about 25 and 50 in 2025. Legend: two entries at top left of the plot, a red dot labelled OpenAI above a dark grey dot labelled All other. Highlighted points: none beyond the colour coding of OpenAI models.
Slide 35
Models converge and leaders change weekly
Dozens of (saturated) benchmarks to choose from, but on the most general, the leaders are very close
Best scoring model relative to leader, October 2025
Anthropic
OpenAI
Other: China
Other: Western
100%
95%
NB truncated axis
90%
LMArena Text
MMLU-Pro
Source: LMArena, Artificial Analysis
Benedict Evans
–– November 2025
35
Visuals: Two clustered vertical bar charts sharing one truncated y-axis, with no axis title. Chart title: 'Best scoring model relative to leader, October 2025'. Y-axis: 90% to 100% of leader, labelled 90%, 95% and 100% (the 90% baseline is marked 'NB truncated axis'); gridlines dotted at 100% and 95%; no units beyond percent. Left chart category label 'LMArena Text' with 10 bars, left to right, colour and estimated value: Anthropic red #EB483F about 100%; Google black #000000 about 99.9%; OpenAI grey #7F7F7F about 99.2%; Other: China light grey #DDDDDD about 98.7%; Other: China about 98.2%; Other: Western salmon #F5A39F about 98.0%; Other: China about 97.6%; Other: China about 97.5%; Other: Western about 97.0%; Other: Western about 95.8%. Right chart category label 'MMLU-Pro' with 10 bars: Anthropic #EB483F about 100%; OpenAI #7F7F7F about 99.0%; Other: Western #F5A39F about 98.4%; Google #000000 about 97.9%; Other: China about 96.6%; Other: China about 95.9%; Other: China about 94.3%; Other: China about 93.0%; Other: Western about 92.3%; Other: Western about 91.8%. No data labels are printed on the bars. Legend at top-left of the chart area, vertical list of five square swatches with labels: Anthropic (red #EB483F), Google (black #000000), OpenAI (mid grey #7F7F7F), Other: China (light grey #DDDDDD), Other: Western (salmon #F5A39F). No highlighted points; bars have thin white separators between them.
Slide 36
Tech versus brand versus distribution?
The models may be close to commodities (especially for general use), but market position is not, so far
Weekly active users of generative AI tools as share of the population, June 2025
ChatGPT
Google Gemini
Meta AI
Microsoft Copilot
Grok
Claude
30%
20%
10%
0%
USA
UK
France
Denmark
Japan
Source: Reuters Institute
Benedict Evans
–– November 2025
36
Visuals: Clustered vertical bar chart. Title above the plot: 'Weekly active users of generative AI tools as share of the population, June 2025'. Y-axis: percentage of population, 0% to 30%, gridlines (dotted, light grey) at 10%, 20% and 30%, solid baseline at 0%. X-axis: five country categories, USA, UK, France, Denmark, Japan. Each category has six bars in legend order, values read as about: USA: ChatGPT about 22%, Google Gemini about 15%, Meta AI about 11%, Microsoft Copilot about 8%, Grok about 4%, Claude about 2%. UK: ChatGPT about 17%, Google Gemini about 6%, Meta AI about 8%, Microsoft Copilot about 6%, Grok about 1%, Claude about 1%. France: ChatGPT about 18%, Google Gemini about 8%, Meta AI about 4%, Microsoft Copilot about 5%, Grok about 1%, Claude about 1%. Denmark: ChatGPT about 28%, Google Gemini about 7%, Meta AI about 3%, Microsoft Copilot about 6%, Grok about 1%, Claude about 0%. Japan: ChatGPT about 16%, Google Gemini about 13%, Meta AI about 4%, Microsoft Copilot about 7%, Grok about 3%, Claude about 2%. Bars are flat-filled with no outlines, thin white gaps between adjacent bars. Legend (top-left, vertical, square swatches): ChatGPT red, Google Gemini black, Meta AI dark grey, Microsoft Copilot mid grey, Grok light grey, Claude pale pink. No highlighted points. No photographs or logos.
Slide 37
“Everyone is already using this!”
800m weekly users, but apparently only 5% are paying - and why announce WAU and not DAU?
ChatGPT global weekly active users (m)
1,000
750
500
250
0
Dec 2022
Jun 2023
Dec 2023
Jun 2024
Dec 2024
Jun 2025
Dec 2025
Source: OpenAI. NB: round numbers reported at scheduled events
Benedict Evans
–– November 2025
37
Visuals: One line chart with red markers, rendered as a smoothed line. Chart type: line chart with markers, no bars. Chart title: ChatGPT global weekly active users (m). Y-axis: unit millions of users (m), range 0 to 1,000, labelled at 0, 250, 500, 750 and 1,000 with dotted horizontal gridlines at each label. X-axis: time from Dec 2022 to Dec 2025, labelled every six months at Dec 2022, Jun 2023, Dec 2023, Jun 2024, Dec 2024, Jun 2025 and Dec 2025, with a thin grey baseline. Series: one series, weekly active users. No values are printed on the slide, so the estimated values are: Dec 2022 about 0 (marked start point); about Nov 2023 about 100; about Aug 2024 about 200; about Dec 2024 about 300; about Mar 2025 about 400; about Jun 2025 about 700; about Sep 2025 about 800. Highlighted points: every data point is shown as a filled red circle marker, with the last point at about 800 at the top right. No legend. The chart is a placed raster image of 1412 by 423 pixels with a transparent background, sitting on the white band with no box or border.
Slide 38
Still more experimentation than daily use
So far, many more people use chatbots occasionally than make them part of their daily lives
Consumer generative AI chatbot use: USA
Consumer generative AI chatbot use: UK
Monthly
Weekly
Daily
60%
50%
40%
30%
20%
10%
0%
2023
2024
2025
2023
2024
2025
Source: Deloitte. Surveys conducted in June.
Defined as “Use of a purpose-built GenAI tool, like ChatGPT, Microsoft Copilot, Google Gemini, etc”
Benedict Evans
–– November 2025
38
Visuals: Two vertical stacked bar charts, both titled in sans-serif text above their plot areas: left 'Consumer generative AI chatbot use: USA' and right 'Consumer generative AI chatbot use: UK'. Each has a y-axis from 0% to 60% in 10% steps with light dotted horizontal gridlines at each 10% step, and a solid baseline at 0%; no axis title. Each has three categories on the x-axis: 2023, 2024, 2025. Series stacked bottom to top: Daily (red), Weekly (dark grey), Monthly (mid grey). No data labels are printed; values are estimates. USA: 2023 about Daily 2%, Weekly 1%, Monthly 13% (total about 16%); 2024 about Daily 4.6%, Weekly 4.1%, Monthly 26.9% (total about 35.6%); 2025 about Daily 10.2%, Weekly 7.6%, Monthly 33.2% (total about 51%). UK: 2023 about Daily 2%, Weekly 7%, Monthly 9% (total about 18%); 2024 about Daily 4%, Weekly 9%, Monthly 13% (total about 26%); 2025 about Daily 6%, Weekly 15%, Monthly 15% (total about 36%). Each segment has a thin white separator line at its top edge. Legend at left, top to bottom: grey square Monthly, dark grey square Weekly, red square Daily, with labels in sans-serif text. No highlighted points; the red Daily series is the only saturated colour on the slide.
Slide 39
Most data shows the same picture / Surveys are early, scattered and inconsistent, but an engagement gap seems clear / How many people use generative AI chatbots in the USA? / Weekly active / Daily active / 50% / 40% / 30% / 20% / 10% / 0% / Pew, Aug 2024 / CCIA, Nov 2024 / Blick et al RPS, Nov 2024 / Bain, Dec 2024 / Hartley et al, Dec 2024 / YouGov, Mar 2025 / Hartley et al, Jun 2025 / Reuters Inst., Jun 2025 / Deloitte, Jun 2025 / Bain, Sep 2025 / Source: Consumer surveys conducted as of date shown / Benedict Evans / –– November 2025 / 39
Visuals: Chart: stacked vertical bar chart, two series, titled 'How many people use generative AI chatbots in the USA?'. Y axis: percentage of people, 0% to 50%, gridlines every 10% (dotted, light grey). X axis: ten survey sources labelled with publisher and date, not a numeric axis. Series 1 'Weekly active' (dark grey #535353, stacked on top). Series 2 'Daily active' (red #EB483F, bottom of stack). Values (measured where the file gives a box, otherwise about): Pew Aug 2024 daily about 11%, weekly total about 26% (weekly segment about 15%); CCIA Nov 2024 daily about 13%, total about 29%; Blick et al RPS Nov 2024 daily about 9%, total about 38%; Bain Dec 2024 daily about 12%, total about 31%; Hartley et al Dec 2024 daily about 9%, total about 29%; YouGov Mar 2025 daily about 12%, total about 28%; Hartley et al Jun 2025 daily about 15%, total about 46%; Reuters Inst. Jun 2025 no daily segment, weekly total about 36%; Deloitte Jun 2025 daily about 10%, total about 18%; Bain Sep 2025 daily about 18%, total about 44%. Segments separated by thin white lines. Legend at upper left: dark grey square 'Weekly active' above red square 'Daily active'. No highlighted points.
Slides 40 to 90 continue in the full text file.
Download this deck
The hosted PDF of every library deck is free for readers of the SlideDeck Co newsletter. Join with your email and the viewer and download appear here.
Building a deck of your own? The SlideDeck Co Standard Deck is a slide library for business presentations: reviews, updates and plans.







