

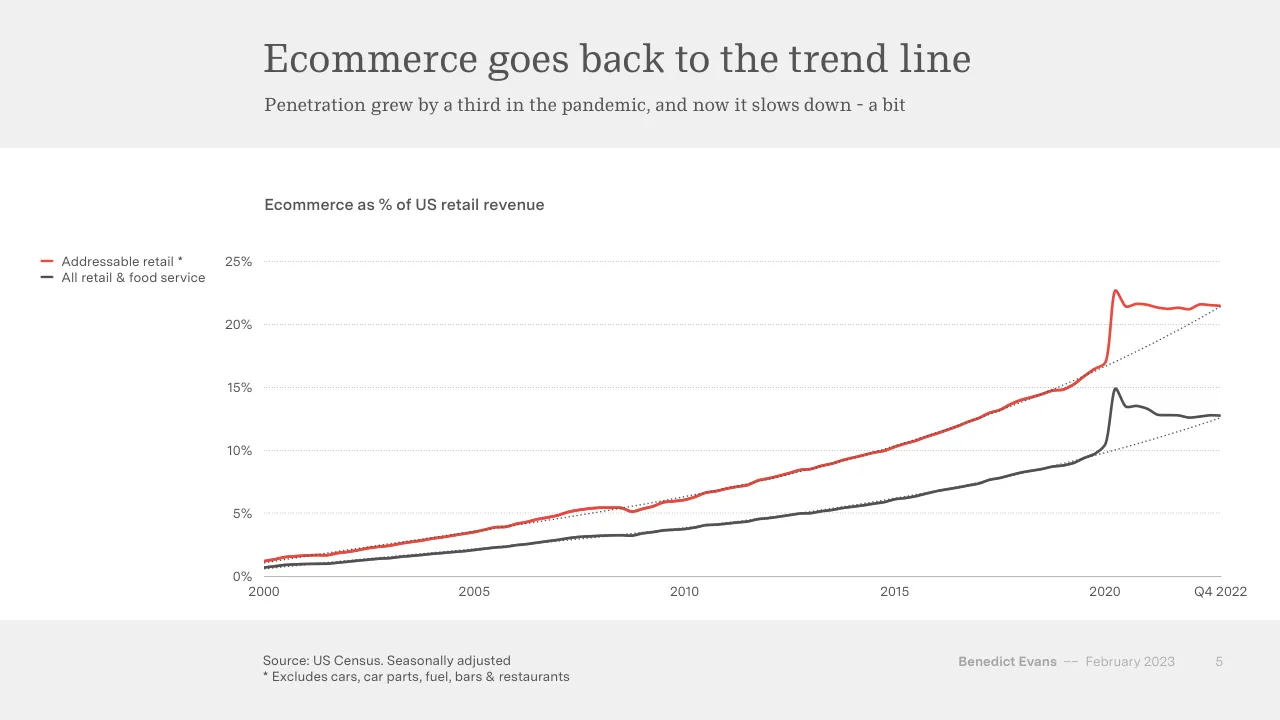
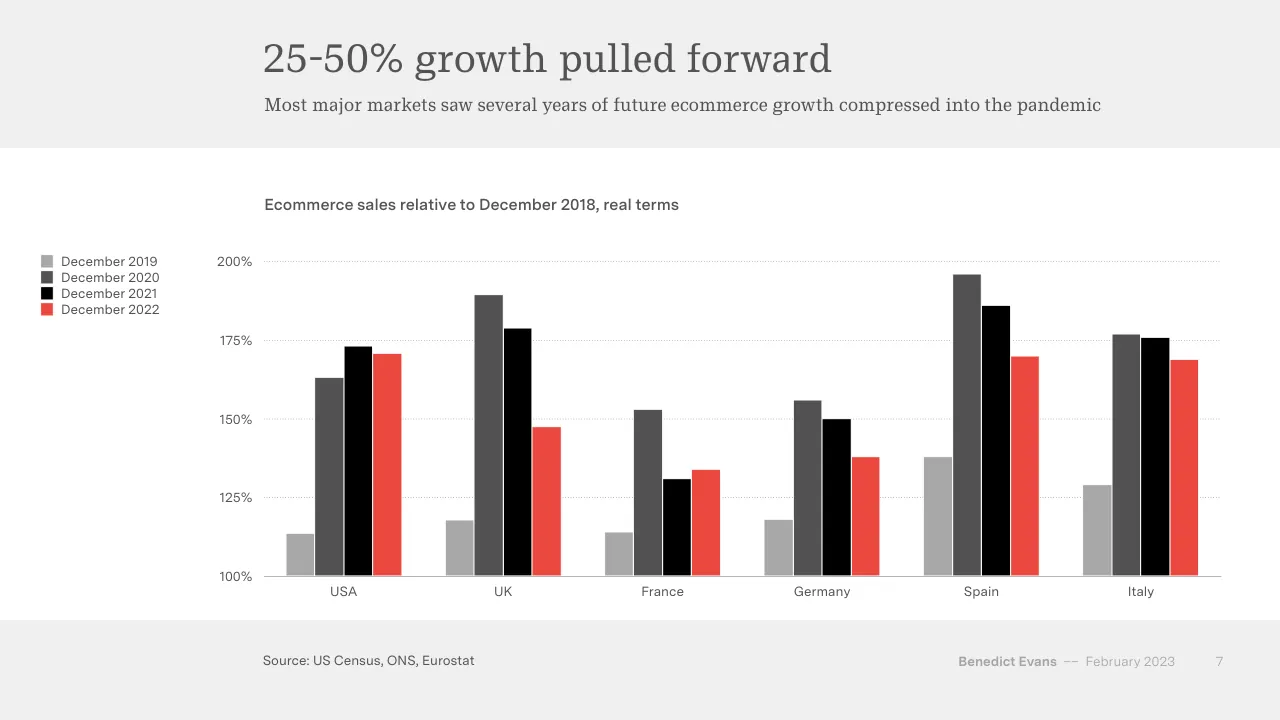
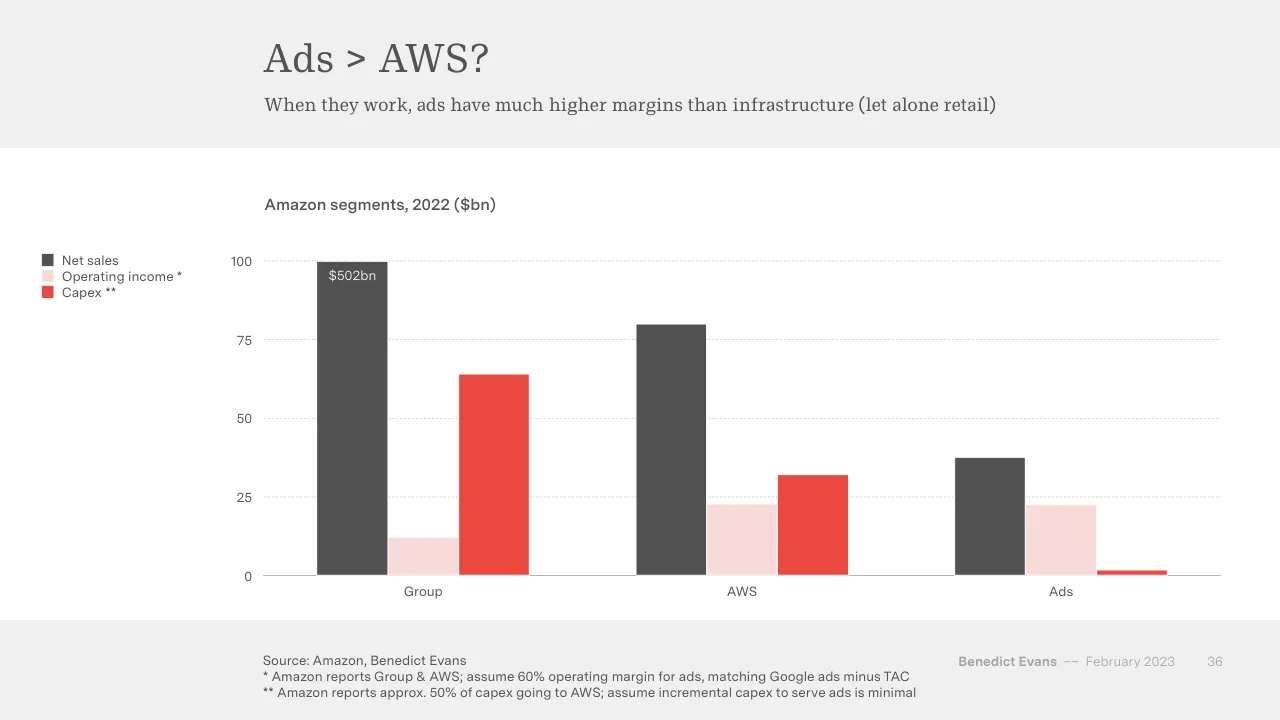
The deck opens with a title slide and an agenda of three parts: the end of free money, the new gatekeepers, and dreams for the future. The first section tests what the macro shift from near-zero rates means for tech, using charts of interest rates, ecommerce penetration, ad revenue, market capitalisation, venture investment and layoffs. The middle section argues that retail, advertising, media and fashion are being unbundled as new channels and platforms replace old gatekeepers, with Amazon, Walmart, Shein and Netflix as recurring examples. The final section looks ahead, weighing the hype cycle from the metaverse and crypto to generative AI, and ends with a conclusion listing open questions, a short About slide and a thank-you page. Most slides pair a single headline-style title with one chart or quote and a source line, so the argument is carried by data and sequence rather than dense text. Slides worth studying include the ecommerce trend-line comparison, the pair of slides on how digital pulled growth forward, and the advertising-versus-AWS margin chart.
Slides worth studying
Questions about this deck
How many slides does the Benedict Evans presentation deck have?
The deck has 103 pages. Slide 2 lays out its agenda in three parts: The end of free money, The New Gatekeepers, and Dreams for the future.
What does the Benedict Evans deck say about ecommerce penetration?
Slide 5 is titled Ecommerce goes back to the trend line and says penetration grew by a third in the pandemic, and now it slows down a bit. Its chart shows ecommerce as a percentage of US retail revenue, with source US Census and seasonally adjusted data.
What does the Benedict Evans deck say about advertising margins compared with AWS?
Slide 35, titled Ads > AWS?, states that when they work, ads have much higher margins than infrastructure (let alone retail). Slide 36 quotes Walmart CEO Doug McMillon saying he cannot remember a business with the margin structure of the advertising business.
What does the Benedict Evans deck say about tech layoffs?
Slide 13, titled And all of this brings layoffs, says at least 250k tech layoffs were announced in the last 12 months, with 85k in January. Its chart shows tech layoffs announced in thousands of employees from Jan-22 to Jan-23, with source layoffs.fyi.
Details
- Company: Benedict Evans
- Year: 2023
- Type: Conference talk
- Industry: Technology analysis
- Pages: 103
More from Benedict Evans
- Benedict Evans conference talk, 2026
- Benedict Evans conference talk, Autumn 2025
- Benedict Evans conference talk, Spring 2025
- Benedict Evans conference talk, 2023
- Benedict Evans strategy presentation, 2022
- Benedict Evans conference talk, 2021
All Benedict Evans decks in the library
Review score: 8 out of 10, Strong
Presentation quality, judged with the SlideDeck Co review heuristic. Ask, evidence and idea merit are not rated here.
Each slide has one assertion title, a subtitle that states the takeaway, and one clean chart with a source line (slides 5, 7, 35), so the audience can follow the argument from the data. The route is clear: an agenda on slide 2, section dividers on 3, 18 and 71, and a steady chain of unbundling examples through retail, advertising, TV and fashion. Weaknesses are the pale, small chart text and footers, many near-identical chart pages with repeated titles and similar subtitles (slides 22 to 25, 55 to 57), and the odd mix of data-scale labelling on slide 35, where the $502bn label sits on a bar capped at 100. Judgement of the full deck is partly assumed, since only 72 of 103 pages were visible.
Worth keeping: Keep the assertion-plus-takeaway title structure, the restrained grey, red and charcoal palette that highlights the key series, and the consistent source footers.
Most useful repair: Enlarge axis, legend and footer text and add direct labels or callouts on the key data point of each chart, such as the spike on slide 5 or the margin gap on slide 35.
What would change the score: Cut or merge repeated chart pages and fix slide 35 so the bars read in a common scale and the margin point is stated on the chart.
Confidence medium. 72 of 103 pages inspected on contact sheets, 4 at readable size. Reviewed 2026-11-08. Model-assisted review (claude-sonnet-5-5).
Full text of the slides (103 slides)
Every slide's words and a description of its charts and images, so the deck can be searched and rebuilt. Also available as Markdown.
Slide 1
The New Gatekeepers / Benedict Evans / February 2023 / www.ben-evans.com / Benedict Evans / –– December 2020
Slide 2
The New Gatekeepers / Tech trends for 2023 / The end of free money / What does the macro shift do to tech? / The New Gatekeepers / How do we remake commerce? / Dreams for the future / The hype cycle turns, and now Generative ML is everything / Benedict Evans / –– February 2023 / 2
Visuals: Three identical circles, each a white filled ellipse with a red outline (about 0.3% of slide height stroke), each about 21.7% wide by 38.5% tall, with centres at about x 30.5%, 58.0% and 85.4% and centre y about 53.5%. Each circle holds a bold serif heading and a regular serif statement, centred. No photographs, charts, logos or icons.
Slide 3
The End of Free Money / Benedict Evans / –– February 2023 / 3
Visuals: none (the panel and the white horizontal rule are non-text shapes, described under elements).
Slide 4
The end of free money / This is not a macro-economic presentation, but macro matters to tech for the first time in a decade / Bank of England interest rates / 20% / 15% / 10% / 5% / 0% / 1700 / 1800 / 1900 / 2000 / 2022 / Source: Bank of England / Benedict Evans / –– February 2023 / 4
Visuals: Line chart titled 'Bank of England interest rates'. Y axis: interest rate in percent, range 0% to 20%, labelled and gridlined at 0%, 5%, 10%, 15%, 20%, with fine dotted light grey gridlines. X axis: calendar year, range 1700 to 2022, labelled 1700, 1800, 1900, 2000, 2022; no unit label shown. One series drawn as a single red line about 3 px thick (about #E84C3D) with no markers and no legend. Values are not printed; approximate readings: about 4.5% from 1700 to 1716, about 4% and 5% around 1716 to 1718, about 5% flat from 1718 to 1820, dipping to about 4% around 1822 to 1837, fluctuating between about 2% and 8% from 1837 to 1900 with peaks near 8% around 1858, about 2% from about 1925 to 1950, fluctuating between about 2% and 7% from 1950 to 1990 with a peak near 7% around 1969, rising to about 17% peak near 1979, falling to about 15% near 1981, around 8% to 10% in 1985 to 1990, about 5% to 7% in 1992 to 1995 and about 1% to 2% from 2009 to 2021, ending near 3% in 2022. Solid thin grey horizontal axis baseline at 0%. No highlighted points.
Slide 5
Ecommerce goes back to the trend line / Penetration grew by a third in the pandemic, and now it slows down - a bit / Ecommerce as % of US retail revenue / Addressable retail * / 25% / All retail & food service / 20% / 15% / 10% / 5% / 0% / 2000 / 2005 / 2010 / 2015 / 2020 / Q4 2022 / Source: US Census. Seasonally adjusted / * Excludes cars, car parts, fuel, bars & restaurants / Benedict Evans / –– February 2023 / 5
Visuals: One line chart. Title: Ecommerce as % of US retail revenue. Y axis: percent of US retail revenue, 0% to 25%, gridlines every 5%, labels 0%, 5%, 10%, 15%, 20%, 25%, with light dotted horizontal gridlines. X axis: years from 2000 to Q4 2022, labelled 2000, 2005, 2010, 2015, 2020, Q4 2022; quarterly data, seasonally adjusted. Series 1, Addressable retail * (red line, about #E8453C): about 1% in 2000, about 5.5% in 2008, about 10% in 2015, about 16.5% at 2019, spikes to about 22.7% around Q2 2020, then falls to about 21.5% and stays near 21.5% to Q4 2022. Series 2, All retail & food service (dark grey line, about #4D4D4D): about 0.7% in 2000, about 3.3% in 2008, about 6% in 2015, about 10.5% at 2020 before spiking to about 15% in Q2 2020, then about 13.5%, falling to about 12.8% at Q4 2022. Both series have a thin dotted grey trend line drawn across them, rising to about 21.5% (addressable) and about 12.7% (all retail) at Q4 2022. Legend at top-left of the chart: red short line with Addressable retail *, dark grey short line with All retail & food service. No values are printed on the data points; all values above are estimates. No highlighted points beyond the peaks.
Slide 6
Ecommerce goes back to the trend line? / Which trend line? Which penetration? What about inflation? / US ecommerce revenue ($bn) / 2022 dollars / Nominal / September 2022 dollars / Nominal / 300 / 250 / 200 / 150 / 100 / 50 / 0 / 2000 / 2005 / 2010 / 2015 / 2020 / Q4 2022 / Source: US Census, BLS. Seasonally adjusted / Benedict Evans / –– February 2023 / 6
Visuals: Line chart. Title above the plot: 'US ecommerce revenue ($bn)'. Y-axis: $bn, linear, 0 to 300, with labelled ticks at 0, 50, 100, 150, 200, 250, 300 and light dotted horizontal gridlines at each tick. X-axis: years 2000 to Q4 2022, with labelled ticks at 2000, 2005, 2010, 2015, 2020 and Q4 2022; the axis is a thin grey baseline. Series 1, '2022 dollars': dark grey (#545454) solid line; about 10 in 2000, about 50 in 2008, a dip to about 47 in 2009, about 65 in 2012, about 130 in 2017, about 165 in 2019, a steep rise to about 240 in early 2020, about 262 in 2021 to 2022 and about 262 at Q4 2022. Series 2, 'Nominal': red (#E8483F approx.) solid line; about 6 in 2000, about 37 in 2008, about 65 in 2012, about 110 in 2017, about 135 in 2019, about 160 in early 2020, a jump to about 210 mid-2020, about 240 in 2021, about 258 at Q4 2022. Two dotted dark grey trend lines (fitted curves) run from about 3 in 2000 to about 245 and about 215 at Q4 2022 respectively, with the upper one close to the 2022 dollars line. Legend at top left: dark grey dash for '2022 dollars', red dash for 'Nominal'. No highlighted points.
Slide 7
25-50% growth pulled forward
Most major markets saw several years of future ecommerce growth compressed into the pandemic
Ecommerce sales relative to December 2018, real terms
December 2019
December 2020
December 2021
December 2022
200%
175%
150%
125%
100%
USA
UK
France
Germany
Spain
Italy
Source: US Census, ONS, Eurostat
Benedict Evans
–– February 2023
7
Visuals: One clustered vertical bar chart. Title printed above the plot: 'Ecommerce sales relative to December 2018, real terms'. Y-axis: percentage scale from 100% to 200%, with labels 100%, 125%, 150%, 175%, 200%, and light dotted horizontal gridlines at each label. Values are index levels relative to December 2018 (100% = base). X-axis: six categories, left to right, USA, UK, France, Germany, Spain, Italy; the x-axis baseline is a thin grey line at 100%. Each category has four bars in order: December 2019 (light grey #A6A6A6), December 2020 (dark grey #535353), December 2021 (black #000000), December 2022 (red #EB483F). No values are printed on the bars, so values are estimates marked about: USA about 113% (2019), about 163% (2020), about 173% (2021), about 171% (2022). UK about 118%, about 189%, about 179%, about 147%. France about 114%, about 153%, about 131%, about 134%. Germany about 118%, about 156%, about 150%, about 138%. Spain about 138%, about 196%, about 186%, about 170%. Italy about 129%, about 177%, about 176%, about 169%. Legend at upper left, vertical list with square swatches: December 2019 light grey, December 2020 dark grey, December 2021 black, December 2022 red. No highlighted points.
Slide 8
Ad revenue slows for the giants / The end of 20% annual revenue growth? / Advertising revenue ($bn, 2022 dollars) / Alphabet / Meta / 250 / 200 / 150 / 100 / 50 / 0 / 2000 / 2005 / 2010 / 2015 / 2020 / 2022 / Source: Alphabet, Meta, BLS / Benedict Evans / –– February 2023 / 8
Visuals: Line chart (two smoothed curved series, no markers). Chart title: Advertising revenue ($bn, 2022 dollars). X axis: years 2000 to 2022, labelled at 2000, 2005, 2010, 2015, 2020 and 2022, no unit label. Y axis: advertising revenue in $bn (2022 dollars), range 0 to 250, labelled at 0, 50, 100, 150, 200 and 250, with light dotted horizontal gridlines at each labelled value and a solid thin grey baseline at 0. Series 1, Alphabet, red line (#E8473A), no values printed, estimates: 2000 about 0, 2005 about 9, 2010 about 38, 2015 about 83, 2020 about 165, about 228 at its 2021 peak, about 224 in 2022. Series 2, Meta, dark grey line (#4D4D4D), starts in 2010, no values printed, estimates: 2010 about 3, 2015 about 21, 2020 about 96, about 124 at its 2021 peak, about 113 in 2022. No highlighted points. Legend at upper left of the chart area: short red line segment followed by Alphabet, short dark grey line segment followed by Meta, stacked vertically with Alphabet above Meta. Line width is about 2 to 3 pixels on the 2000 pixel-wide slide. No photographs, logos or icons.
Slide 9
The Covid rotation… rotates
And a lot of exuberant valuations fade away
Market capitalisation ($bn)
Exxon
Zoom
600
500
400
300
200
100
0
Dec-15
Dec-16
Dec-17
Dec-18
Dec-19
Dec-20
Dec-21
Dec-22
Source: Bloomberg
Benedict Evans
–– February 2023
9
Visuals: Line chart titled 'Market capitalisation ($bn)'. Y axis: 0 to 600 in steps of 100, unit $bn, faint dotted horizontal gridlines at each step. X axis: monthly dates from Dec-15 to Dec-22 with labels every 12 months (Dec-15, Dec-16, Dec-17, Dec-18, Dec-19, Dec-20, Dec-21, Dec-22), solid grey baseline at 0. Series 1 'Exxon' (dark grey #545454, about 3 pt smoothed line): starts about 310 in Dec-15, peaks about 410 in mid-2016, about 270 in early 2018, a trough about 110 in early 2020, about 180 at late 2020, about 280 to 300 through 2021, a peak about 555 near late 2022, ending about 495 at Dec-22. Series 2 'Zoom' (red #E8473A, about 3 pt smoothed line): starts about 25 in mid-2018, about 15 in late 2019, peaks about 145 in late 2019 and about 135 in mid-2020, falling to about 20 by late 2022. Legend at left: dark grey short line swatch with 'Exxon' and red short line swatch with 'Zoom'. No highlighted points.
Slide 10
Flow-through to venture
Venture investment surged dramatically in the pandemic. Now…
US venture investment ($bn)
Rounds for >$50m
Rounds for <$50m
100
75
50
25
0
Mar-10 / Mar-11 / Mar-12 / Mar-13 / Mar-14 / Mar-15 / Mar-16 / Mar-17 / Mar-18 / Mar-19 / Mar-20 / Mar-21 / Mar-22
Source: NVCA
Benedict Evans –– February 2023 10
Visuals: Stacked column chart titled US venture investment ($bn). Y-axis runs from 0 to 100 in steps of 25, with light dotted horizontal gridlines at 25, 50, 75 and 100 and labels at the left of the plot. X-axis is labelled at every twelfth bar with Mar-10 to Mar-22; there are about 50 quarterly columns, each stacked with a red segment (Rounds for <$50m) at the bottom and a dark grey segment (Rounds for >$50m) on top. Estimated totals (about): Mar-10 about 8 (red about 6); Mar-11 about 13; Mar-13 about 12; Mar-14 about 22 (red about 12); Mar-16 about 27 (red about 12); Mar-18 about 30 (red about 15); Mar-19 about 48 (red about 16); Mar-20 about 38 (red about 17); Mar-21 about 79 (red about 23); Mar-22 about 94 (red about 28); the last columns fall to about 47 and about 36 (red about 20 and about 15). No printed values are shown on the bars. Legend at top-left of the chart: dark grey square for Rounds for >$50m and red square for Rounds for <$50m. No highlighted points.
Slide 11
Back to the trend line? / But based on reality rather than promise… / US tech venture investing ($bn, 2022 dollars) / 350 / 300 / 250 / 200 / 150 / 100 / 50 / 0 / 1980 / 1985 / 1990 / 1995 / 2000 / 2005 / 2010 / 2015 / 2020 / Source: Capital IQ, Jay Ritter, University of Florida, NVCA, a16z, BLS / Benedict Evans / –– February 2023 / 11
Visuals: Line chart titled 'US tech venture investing ($bn, 2022 dollars)'. Y-axis: $bn, 0 to 350, gridlines and labels at 0, 50, 100, 150, 200, 250, 300, 350; dotted light grey horizontal gridlines. X-axis: years 1980 to 2022, labels every five years from 1980 to 2020, baseline solid grey. Single smoothed series in red line (about #E8453C), stroke about 0.3% of slide height. Values read approximately (about): 1980 about 1; 1983 about 6; 1990 about 3; 1995 about 6; 1998 about 19; 2000 about 111 (peak); 2001 about 41; 2002 about 21; 2003 about 17; 2004 about 19; 2007 about 25; 2009 about 17; 2010 about 25; 2011 about 37; 2012 about 27; 2013 about 32; 2014 about 56; 2016 about 64; 2017 about 76; 2018 about 123; 2019 about 117; 2020 about 137; 2021 about 302 (peak); 2022 about 205. No legend, no highlighted points, no data labels beyond axis labels.
Slide 12
The end of
free money
Source: @njashanmal
Benedict Evans
–– February 2023
12
Visuals: One photograph of a London bus shelter (black metal frame, glass side panels, red bench seat) on a pavement beside a road, with a tree trunk and dense green hedges behind. Two backlit advertising panels are mounted in the shelter, both branded JCDecaux. Left panel: a blue advertisement for Zapp with yellow headline 'Out of Milk?' and white 'Zapp Delivers.', small text 'Thousands of essentials to your door in minutes, 24/7.', a bunch of bananas, a milk carton, a small blue carton, a box of tea or coffee, a red apple, a box of eggs, a loaf of sliced brown bread, App Store and Google Play badges, a QR code, 'www.tryzapp.com' and the white Zapp wordmark with motion lines at bottom right. Right panel: a purple-to-yellow advertisement with the yellow 'getir' logotype at top, white 'groceries in minutes', yellow '£15 off first order', and a phone mockup showing a map, a 'getir' header, a 'Home' address bar, an '8min' delivery badge and a grid of category icons (Fruit & Veg, Dairy, Alcohol, Drinks, Baby, Pet). A London Buses roundel and the code '0120 0098' appear on the shelter roof. Lighting is soft daylight with the ad panels glowing. Dominant colours: green foliage, black shelter frame, bright blue #1E8BE0 and yellow #F5B82E on the Zapp panel, navy-purple #2E2A8C and yellow #F5B82E on the getir panel, red #D62B2B bench. Composition is a wide, eye-level shot, cropped at the left and right of the frame, full-bleed on the right three-quarters of the slide with no overlay or tint.
Slide 13
And all of this brings layoffs
At least 250k tech layoffs were announced in the last 12 months - 85k in January
Tech layoffs announced (000 employees)
100
75
50
25
0
Jan-22
Feb-22
Mar-22
Apr-22
May-22
Jun-22
Jul-22
Aug-22
Sep-22
Oct-22
Nov-22
Dec-22
Jan-23
Source: layoffs.fyi
Benedict Evans
–– February 2023
13
Visuals: Chart: vertical bar chart, single series, red bars. Chart title: 'Tech layoffs announced (000 employees)'. Y-axis: 0 to 100, labelled at 0, 25, 50, 75, 100 (unit: thousands of employees, per the chart title); dotted light grey horizontal gridlines at 25, 50, 75, 100 and a solid grey baseline at 0. X-axis: monthly categories Jan-22 through Jan-23 (13 categories), labelled in the order Jan-22, Feb-22, Mar-22, Apr-22, May-22, Jun-22, Jul-22, Aug-22, Sep-22, Oct-22, Nov-22, Dec-22, Jan-23. Values printed on the slide: none for the bars; only Nov-22 (about 52) and Jan-23 (about 85) are estimated from the axis, and the subtitle states 85k in January. Estimated values about: Jan-22 1, Feb-22 4, Mar-22 6, Apr-22 4, May-22 13, Jun-22 18, Jul-22 16, Aug-22 13, Sep-22 6, Oct-22 17, Nov-22 52, Dec-22 10, Jan-23 85. Legend: none. Highlighted points: none; all bars are the same red #EB483F. Bars are about 2.3% of slide width wide, evenly spaced. Gridline and bar positions are as given in the measured elements.
Slide 14
Some perspective, though / Meta laid off 11,000 people in November 2022, but had hired over 15,000 since January / Employees (000) / 2010 / 250 / 2020 / 2022 / 2022/23 Layoffs / 200 / 150 / 100 / 50 / 0 / Microsoft / Alphabet / Apple / Meta / Source: Companies / Benedict Evans / –– February 2023 / 14
Visuals: Grouped vertical bar chart titled 'Employees (000)' (title placed above the y-axis at top-left of the plot). Y axis: employees in thousands, linear scale from 0 to 250, gridlines and labels at 0, 50, 100, 150, 200, 250, drawn as dotted light grey lines. X axis: four categories, Microsoft, Alphabet, Apple, Meta, with a thin solid grey baseline at 0; the plot has room for a fifth empty category slot on the right. Series (legend order 2010, 2020, 2022, 2022/23 Layoffs): 2010 in light grey #A7A7A7, 2020 in dark grey #535353, 2022 in black #000000, 2022/23 Layoffs in red #E8473B. No values are printed on the bars, so values are estimates marked about: Microsoft 2010 about 89, 2020 about 171, 2022 about 221, layoffs about 10; Alphabet 2010 about 25, 2020 about 135, 2022 about 186, layoffs about 12; Apple 2010 about 49, 2020 about 147, 2022 about 164, no layoffs bar visible; Meta 2010 about 2, 2020 about 58, 2022 about 86, layoffs about 11. Bars are adjacent within each group with thin white gaps between them. Legend at left: four square swatches (about 2% wide) with labels stacked vertically. No highlighted points.
Slide 15
Some perspective
Tech companies have hired at huge scale in the last decade
Employees (000)
2010
2020
2022
2022/23 Layoffs
1,750
1,500
1,250
1,000
750
500
250
0
Microsoft
Alphabet
Apple
Meta
Amazon
Source: Companies
Benedict Evans
–– February 2023
15
Visuals: Chart: clustered vertical bar chart. Chart title printed above the plot: 'Employees (000)'. Y axis: numeric labels 0, 250, 500, 750, 1,000, 1,250, 1,500, 1,750 (range 0 to 1,750, units thousands of employees, label printed as '(000)'), with faint dotted horizontal gridlines at each label. X axis: categories Microsoft, Alphabet, Apple, Meta, Amazon, baseline drawn as a thin grey line. Four series per company, in order left to right: 2010 (light grey), 2020 (dark grey), 2022 (black), 2022/23 Layoffs (red). No values are printed on the bars; estimates: Microsoft 2010 about 90, 2020 about 170, 2022 about 220, layoffs about 10; Alphabet 2010 about 20, 2020 about 135, 2022 about 190, layoffs about 10; Apple 2010 about 50, 2020 about 145, 2022 about 165, layoffs about 0 (not visible); Meta 2010 about 0 (not visible), 2020 about 55, 2022 about 85, layoffs about 10; Amazon 2010 about 30, 2020 about 1,290, 2022 about 1,540, layoffs about 15. Legend: vertical list at upper left of the chart with square swatches and labels 2010, 2020, 2022, 2022/23 Layoffs in that order. No highlighted points. Bars have thin white separators between them. No photographs, logos or icons.
Slide 16
Glass half-empty, glass half-full / How optimistic do you want to feel? / Half-empty / Over-investment and loss of discipline in the last 24 months / Uncertain macro-economic outlook / (Uncertain geo-political outlook) / Half-full / 5bn people have a smartphone now / The pandemic broke every offline habit / Every market and value chain is being remade around the internet / Benedict Evans –– February 2023 / 16
Visuals: One non-text element: a vertical dotted line in red (about #E84A3F) at about x 56.3% of the slide width, running from about y 31.6% to y 78% of the slide height, roughly 0.3% wide, drawn as small square dots with even spacing. It is a divider between the two columns. No photographs, charts, logos or icons.
Slide 17
The real trend line
From exciting to universal
Global computer users (bn)
5
4
3
2
1
Dotcom
bubble
Apple
Netscape
Macintosh
0
1980
1990
2000
2010
2020
Source: Gartner, ITU, Apple, Google, CNNIC, Benedict Evans
Benedict Evans
–– February 2023
17
Visuals: Line chart titled 'Global computer users (bn)', placed above the plot area at the top left of the chart. Y axis: 0 to 5, unit bn (billions), labelled at 0, 1, 2, 3, 4, 5, with dotted light-grey horizontal gridlines at each whole unit; no axis line on the left. X axis: 1980 to about 2021, labelled 1980, 1990, 2000, 2010, 2020, with a thin solid grey baseline at 0. Single series: a smooth red line starting at about 0 in 1980, about 0.03 at Apple Macintosh (about 1984), about 0.13 at Netscape (about 1994), about 0.42 at the Dotcom bubble (about 1999), about 0.9 at Facebook (about 2004), and rising to about 4.7 at the right edge (about 2021). No values are printed on the line; all values are estimates. Legend: none. Highlighted points: four solid red dots on the line at Apple Macintosh, Netscape, Dotcom bubble and Facebook, each with a dark grey text label above it (labels: Apple Macintosh, Netscape, Dotcom bubble, Facebook). No other images, logos or icons.
Slide 18
The New Gatekeepers / Benedict Evans –– February 2023 / 18
Slide 19
The decline of old gatekeepers
Department stores dominated retail for a century. Now they’ve almost disappeared
Department store share of US addressable retail revenue*
35%
30%
25%
20%
15%
10%
5%
0%
1930 1940 1950 1960 1970 1980 1990 2000 2010 2020
Source: US Census, ARTS. Definition change in 1964
*Excluding automotive, building materials, gasoline, grocery, food service
Benedict Evans
–– February 2023
19
Visuals: One line chart. Title printed above the plot: 'Department store share of US addressable retail revenue*'. Y axis: percentage share of US addressable retail revenue, labelled 0% to 35% in 5% steps, with dotted light grey horizontal gridlines at each step and a solid thin grey baseline at 0%. X axis: years labelled 1930, 1940, 1950, 1960, 1970, 1980, 1990, 2000, 2010, 2020 (annual data, range 1930 to 2020). Single series drawn as a smoothed red line about 3 px wide, colour about #E8473B. The line has a visible break between about 1964 and 1965 where the definition changed. Estimated values, none printed on the slide: 1930 about 20%; 1936 about 24.5% (local peak); 1939 about 23.8%; 1943 about 21.7%; 1946 about 17.7% (low); 1949 about 23% (local peak); 1951 about 20.4%; 1955 about 19.5%; 1958 about 18.7%; 1961 about 20%; 1964 about 21%; 1965 about 23.3%; 1967 about 25.7%; 1970 about 28%; 1972 about 28.8%; 1974 about 28%; 1977 about 29.7% (peak); 1980 about 28.7%; 1983 about 29.7%; 1986 about 29.2%; 1990 about 27.7%; 1992 about 26%; 1993 about 23.7%; 1997 about 21.8%; 2000 about 18.5%; 2003 about 15%; 2007 about 12.5%; 2010 about 10.2%; 2015 about 7.8%; 2020 about 4.2% (end point, lowest). No legend, no highlighted points, no data labels, no annotations.
Slide 20
And the rise of new ones / On a GMV basis, Amazon has now overtaken Walmart’s revenue / Retail revenue ($bn, 2022 dollars) / Walmart / Amazon GMV / 800 / 700 / 600 / 500 / 400 / 300 / 200 / 100 / 0 / 1970 / 1980 / 1990 / 2000 / 2010 / 2020 / Source: Amazon, Walmart, BLS, Benedict Evans / Benedict Evans –– February 2023 / 21
Visuals: Line chart titled 'Retail revenue ($bn, 2022 dollars)'. Y-axis: 0 to 800 in steps of 100, labelled with values only, unit $bn in 2022 dollars, dotted light grey horizontal gridlines at each 100 step. X-axis: years 1970 to about 2022, labelled every decade from 1970 to 2020, solid mid-grey baseline at 0. Series 1, Walmart: dark grey line (about #4D4D4D), about 0 in 1970, about 7 in 1980, about 75 in 1990, about 290 in 2000, about 360 in 2005 to 2010 (about 360 in 2009), about 575 in 2015, about 630 peak near 2020, about 600 at the end in 2022. Series 2, Amazon GMV: red line (about #E8463A), starts about 1995 at 0, about 5 in 2000, about 35 in 2008, about 60 in 2010, about 160 in 2014, about 340 in 2018, about 580 in 2019, about 680 peak near 2021, about 675 in 2022. The lines cross at about 2019 to 2020. No data labels or highlighted points. Legend at top left of chart: short dark grey dash labelled Walmart, short red dash labelled Amazon GMV. Lines are smooth, about 2 px stroke.
Slide 21
Software eats advertising
Digital broke up the old markets - then, a decade later, it found new models
Advertising as % of US GDP
Internet
Magazines
Newspapers
TV
Radio
1.75%
1.50%
1.25%
1.00%
0.75%
0.50%
0.25%
0.00%
1930
1940
1950
1960
1970
1980
1990
2000
2010
2020
Source: Coen, McCann, Zenith, BEA
Benedict Evans
–– February 2023
22
Visuals: Chart: stacked area chart titled 'Advertising as % of US GDP'. Y axis: 0.00% to 1.75%, labelled every 0.25%, with faint dotted horizontal gridlines at each label. X axis: years 1930 to about 2022, labelled every 10 years from 1930 to 2020. Series, stacked bottom to top: Radio (black), TV (dark grey), Newspapers (mid grey), Magazines (light grey), Internet (red). The slide prints no data values; estimates: Radio about 0.05% in 1930, about 0.2% around 1950, about 0.05% in 2022. Newspapers is the largest series until about 1990 (about 0.6% to 0.8% of GDP for much of the period). Total advertising peaks near 1.73% in 1932, falls to about 0.57% in 1944, and reaches about 1.47% in 2000. Internet appears from about 1997, rising to about 0.6% of GDP in 2010 and about 0.85% by 2022; the total in 2022 is about 1.23%. Legend: top to bottom Internet (red swatch), Magazines (light grey swatch), Newspapers (mid grey swatch), TV (dark grey swatch), Radio (black swatch). Highlighted: the red Internet series, the only colour on the chart; the other four series are greys and black.
Slide 22
Software eats advertising
A $700bn industry turns over
2022 ad revenue ($bn)
All other*
TV
Digital pure-play
350
300
250
200
150
100
50
0
USA
China
UK
RoW
Source: GroupM
* Print, OoH, radio and cinema
Benedict Evans
–– February 2023
23
Visuals: Chart: stacked column chart titled '2022 ad revenue ($bn)'. Y axis runs from 0 to 350 in steps of 50 ($bn, light dotted horizontal gridlines at each step). X axis categories: USA, China, UK, RoW, with a thin solid grey baseline at 0. Series (stacked bottom to top): Digital pure-play (red #EB483F), TV (dark grey #535353), All other* (mid grey #7F7F7F). Values are not printed; estimates: USA about Digital 201, TV about 71, All other about 33, total about 305; China about Digital 122, TV about 8, All other about 8, total about 138; UK about Digital 38, TV about 5, All other about 4, total about 48; RoW about Digital 180, TV about 70, All other about 80, total about 330. Legend at left, top to bottom: All other* (grey square), TV (dark grey square), Digital pure-play (red square). No highlighted points. Bars are flat with thin white separators between segments.
Slide 23
Global channels, global winners
Moving from local to global markets means moving from local to global winners
Top 10 global media owners by ad revenue, 2016-2021 ($bn)
250
200
150
100
50
0
Alphabet
Meta
Bytedance
Alibaba
Amazon
Comcast
Microsoft
Tencent
Baidu
Disney
Source: GroupM, companies
Benedict Evans
–– February 2023
24
Visuals: Chart: grouped vertical bar chart titled 'Top 10 global media owners by ad revenue, 2016-2021 ($bn)'. Y axis: labelled 0, 50, 100, 150, 200, 250 with units $bn implied by the chart title, range 0 to 250, dotted horizontal gridlines at each labelled value. X axis: ten company categories, left to right: Alphabet, Meta, Bytedance, Alibaba, Amazon, Comcast, Microsoft, Tencent, Baidu, Disney. Each company has a cluster of six (or five) thin bars, one per year 2016 to 2021, with no printed data labels; values are estimates marked 'about'. Alphabet: about 80, 96, 117, 135, 148, 210. Meta: about 27, 40, 55, 70, 85, 115. Bytedance: about 2, 7, 17, 30, 39 (five bars). Alibaba: about 10, 15, 18, 23, 29, 32. Amazon: about 4, 6, 9, 12, 20, 32. Comcast: about 13, 14, 16, 14, 13, 15. Microsoft: about 7, 8, 9, 11, 11, 15. Tencent: about 4, 6, 8, 10, 13, 14. Baidu: about 9, 11, 12, 11, 11, 13. Disney: about 11, 11, 12, 12, 11, 12. Bars for Alphabet, Meta, Bytedance, Alibaba, Amazon, Microsoft, Tencent and Baidu are dark grey; Comcast and Disney bars are highlighted in red-orange. Bars are separated by thin white gaps and sit on a thin grey baseline. No legend.
Slide 24
Concentration / Moving from local to global markets means moving from local to global winners / 2021 advertising ($bn) / 800 / 600 / 400 / Amazon / Meta / 200 / Alphabet / 0 / Global advertising / Ad spend by top / 100 global advertisers / Ad revenue / Source: GroupM, AdAge, companies / Benedict Evans / –– February 2023 / 25
Visuals: Bar chart, stacked column, with title '2021 advertising ($bn)' printed above the plot at upper left. Y-axis is linear from 0 to 800 ($bn) with labelled ticks at 0, 200, 400, 600 and 800 and light grey dotted horizontal gridlines at each labelled tick. X-axis is a solid thin grey baseline at 0 with three categories: 'Global advertising', 'Ad spend by top 100 global advertisers' and 'Ad revenue'. Series 1, Global advertising: single dark grey bar (#535353), top about 760 ($bn, estimate, no value printed). Series 2, Ad spend by top 100 global advertisers: single mid grey bar (#A7A7A7), top about 340 ($bn, estimate, no value printed). Series 3, Ad revenue: one stacked red column (#EB483F) split by thin white horizontal divider lines into three labelled segments from bottom to top: Alphabet (bottom, about 0 to 200, labelled inside in white), Meta (middle, about 200 to 320, labelled inside in white) and Amazon (top sliver, about 320 to 355, labelled outside to the right in dark grey). The stack total is about 355 ($bn, estimate). No legend; the three stacked company segments are identified by in-bar labels. Highlighted points: the red Ad revenue column is the only coloured series and is the emphasis; the other two bars are grey.
Slide 25
Concentration / Booking and Expedia paid $13bn for reach in the last 12 months / Sales & Marketing as % revenue (TTM) / Booking / Expedia / 60% / 50% / 40% / 30% / 20% / 10% / 0% / 2010 / 2011 / 2012 / 2013 / 2014 / 2015 / 2016 / 2017 / 2018 / 2019 / 2020 / 2021 / 2022 / Source: Companies / Benedict Evans / –– February 2023 / 26
Visuals: Line chart titled 'Sales & Marketing as % revenue (TTM)'. Y axis: percent of revenue, 0% to 60% in 10% steps, dotted light-grey horizontal gridlines at each step. X axis: years 2010 to 2022 labelled at each year, baseline solid grey at 0%. Two series drawn as smoothed lines: Booking (dark grey, about #545454) starts about late 2011 at about 26% and rises to about 27% in 2012, about 29% in 2013, about 33% in 2014, about 35% in 2015, about 37% in 2016, about 40% in 2017, about 40% in 2018, about 39% in 2019, about 39% in 2020, about 43% in 2021 with a dip to about 40% at early 2021, about 43% in 2022, ending about 45%. Expedia (red, about #E84B3C) starts about mid-2016 at about 49%, peaks about 52.8% in 2018, falls to about 50% in 2019, about 48% in late 2020, dips to about 46% in 2021, rises to about 50% in 2021 to 2022 and ends about 50.5%. Legend at left: Booking with dark grey dash, Expedia with red dash. No highlighted points. Values other than the peaks are estimates.
Slide 26
How do you reach your customers?
Rent, advertising and pricing were all separate budgets - now they merge into one
Logistics
How do you
reach people?
Discovery
Benedict Evans
–– February 2023
27
Visuals: Three filled circles in a horizontal row, vertically centred at about y 51% of the slide. Left circle: dark grey #535353 with the label 'Logistics'. Centre circle: red #EB483F with the label 'How do you reach people?' on two lines. Right circle: dark grey #535353 with the label 'Discovery'. Between the left and centre circles is a right-pointing block arrow in light grey #A7A7A7 (block shaft with triangular head pointing right, at about x 41.6%). Between the centre and right circles is a left-pointing block arrow in light grey #A7A7A7 (triangular head pointing left, at about x 68.9%). No photographs, logos or charts. Flat fills, no shadows, no gradients.
Slide 27
How do you reach your customers? / Rent, advertising and pricing were all separate budgets - now they merge into one / US budgets, 2022 ($bn) / 350 / 300 / 250 / 200 / 150 / 100 / 50 / 0 / Advertising / Retail / rents / Online / advertising / Parcel / shipment / Retailer / net income / Search / ads / Card network / fees / Returns / Sales / promotion / Direct mail / Amazon ads / Source: GroupM, Zenith, Costar, BLS, Federal Reserve, Amazon, Deloitte, Pitney Bowes, NRF / Benedict Evans –– February 2023 / 28
Visuals: Vertical bar chart. Title: US budgets, 2022 ($bn). Y axis: US dollars in billions ($bn), linear scale from 0 to 350, gridlines and labels at 0, 50, 100, 150, 200, 250, 300, 350. X axis: 11 categories in descending order of value. Series values (about where the slide prints no value): Advertising about 300 (dark grey); Retail rents about 275 (dark grey); Online advertising about 200 (red); Parcel shipment about 188 (dark grey); Retailer net income about 175 (dark grey); Search ads about 90 (red); Card network fees about 84 (dark grey); Returns about 80 (dark grey); Sales promotion about 59 (dark grey); Direct mail about 37 (dark grey); Amazon ads about 35 (red). Highlighted points: the red bars, Online advertising, Search ads and Amazon ads, are coloured #EB483F while the other eight bars are #535353. No legend. Gridlines are light grey dotted horizontal lines at each 50-unit step. Bars are flat with no outline, about 2.7% of slide width each, with the category axis as a thin grey baseline at 0.
Slide 28
What’s the right ad budget? / Where else could this budget be going? / 2021 ad spend as % of GDP / 1.5% / 1.0% / 0.5% / 0.0% / USA / UK / Japan / Germany / France / Spain / Italy / Source: Zenith, World Bank / Benedict Evans –– February 2023 / 29
Visuals: Vertical bar chart, titled '2021 ad spend as % of GDP'. Y-axis: 0.0% to 1.5%, labelled at 0.0%, 0.5%, 1.0% and 1.5%, no unit beyond the percent sign; dotted light grey gridlines at 0.5, 1.0 and 1.5; solid grey baseline at 0.0%. X-axis: seven categories, labelled USA, UK, Japan, Germany, France, Spain, Italy, left to right. Single series, values not printed on the slide; estimated from bar heights: USA about 1.33%, UK about 1.26%, Japan about 1.02%, Germany about 0.67%, France about 0.56%, Spain about 0.44%, Italy about 0.42%. The USA bar is highlighted in red #EB483F; all other bars are dark grey #535353. Bars are about 4.3% of slide width each, evenly spaced, with flat tops and no labels or legend. The chart plot area spans about x 20.6% to 95.3%, y 36% to 86%.
Slide 29
How much retail space do you need? / Where else could this budget be going? / Retail square feet per capita, 2021 / Shopping centres & malls / Stand-alone retail / 60 / 50 / 40 / 30 / 20 / 10 / 0 / USA / UK / Germany / Spain / France / Italy / Japan / Source: Cushman & Wakefield, Costar, ICSC, Savills, GfK, MIAC. GLA basis. / Benedict Evans / –– February 2023 / 30
Visuals: Chart: vertical stacked bar chart, title 'Retail square feet per capita, 2021' (text, left-aligned above plot). Y-axis: numeric 0 to 60 in steps of 10, no unit label printed, faint dotted horizontal gridlines at each step. X-axis: seven categories, USA, UK, Germany, Spain, France, Italy, Japan, with a thin grey baseline at 0. Series: two stacked segments per bar. Top segment is 'Shopping centres & malls' (pale pink #F8DBD9 for USA; light grey about #A6A6A6 for the other countries, not in legend). Bottom segment is 'Stand-alone retail' (red #EB483F for USA; dark grey #535353 for the other countries). No data labels are printed, so values are estimates: USA stand-alone about 30.5 and shopping centres & malls about 23 (top about 53.5); UK stand-alone about 14 and top about 16.5; Germany stand-alone about 13.7 and top about 15.5; Spain stand-alone about 8.3 and top about 12; France stand-alone about 8.7 and top about 12; Italy stand-alone about 8.2 and top about 11.2; Japan stand-alone about 7.2 and top about 11.6. Legend: two entries at upper left of the plot, a pale pink square with 'Shopping centres & malls' above a red square with 'Stand-alone retail'. Highlighted point: the USA bar is the only bar drawn in the colours of the legend; the other six bars use grey tones with no legend entry.
Slide 30
Retail versus logistics / The US had over-invested in retail space - now the trend reverses / Annual US construction spending ($bn, 2022 dollars) / Retail & food service / Warehouses / 100 / 75 / 50 / 25 / 0 / 1970 / 1980 / 1990 / 2000 / 2010 / 2020 / Source: US Census, BLS / Benedict Evans / –– February 2023 / 31
Visuals: Line chart titled 'Annual US construction spending ($bn, 2022 dollars)'. Y axis: US$ billions in 2022 dollars, range 0 to 100, labelled ticks at 0, 25, 50, 75, 100, with light dotted horizontal gridlines at each labelled tick. X axis: years 1970 to 2022 (ticks labelled 1970, 1980, 1990, 2000, 2010, 2020), with a thin solid grey baseline at 0. Series 1, 'Retail & food service', dark grey (#545454) smoothed line about 2.5pt wide: about 53 in 1973, about 35 in 1975, about 55 in 1979, about 42 in 1983, about 76 in 1985, about 62 in 1990, about 47 in 1991, about 59 in 1995, about 71 in 2000, about 62 in 2003, about 86 in 2007 (peak), about 33 in 2010, about 53 in 2016, about 41 in 2019, about 33 in 2021, about 37 in 2022. Series 2, 'Warehouses', red (#E8473B) smoothed line about 2.5pt wide: about 14 in 1973, about 9 in 1976, about 19 in 1985, about 24 in 1989, about 11 in 1993, about 24 in 2001, about 7 in 2010, about 20 in 2016, about 34 in 2019, about 56 in 2022 (line ends highest of the two at the right edge). No data labels printed; values above are estimates. Legend at upper left of chart: short dark grey dash then 'Retail & food service', short red dash then 'Warehouses'. No highlighted points. Source line at bottom left; no logos, photographs or icons.
Slide 31
Amazon doubled its warehouse space since 2019
… And is now pulling back, slowing down and subletting
Amazon fulfilment centre space (m square feet)
600
500
400
300
200
100
0
2000
2005
2010
2015
2020
2022
Source: Amazon
Benedict Evans
–– February 2023
32
Visuals: Line chart titled 'Amazon fulfilment centre space (m square feet)'. Y axis: 0 to 600, labelled every 100, dotted light grey horizontal gridlines at each 100 step. X axis: years 2000 to 2022, labelled at 2000, 2005, 2010, 2015, 2020 and 2022, with a thin grey baseline at 0. One series drawn as a smooth thick red line, with approximate values read from the curve (no values printed): about 5 in 2000, about 10 in 2005, about 25 in 2010, about 110 in 2015, about 200 in 2017, about 255 in 2019, about 380 in 2020, about 500 in 2021, about 540 in 2022. The line is steepest between 2019 and 2021. No legend and no highlighted points.
Slide 32
Retail as media / ‘Merchant media’ - Amazon had $38bn of ad revenue in 2022 / Amazon advertising, TTM ($bn) / 'Other, predominantly ads' / Ads / 40 / 30 / 20 / 10 / 0 / Mar-17 / Sep-17 / Mar-18 / Sep-18 / Mar-19 / Sep-19 / Mar-20 / Sep-20 / Mar-21 / Sep-21 / Mar-22 / Sept-22 / Source: Amazon / Benedict Evans –– February 2023 / 33
Visuals: One line chart titled 'Amazon advertising, TTM ($bn)'. Y-axis: $bn, range 0 to 40, labelled ticks at 0, 10, 20, 30, 40, with light dotted horizontal gridlines at each tick. X-axis: monthly time from Mar-17 to Sept-22, labelled every six months (Mar-17, Sep-17, Mar-18, Sep-18, Mar-19, Sep-19, Mar-20, Sep-20, Mar-21, Sep-21, Mar-22, Sept-22), with a thin grey baseline. Series 1, 'Other, predominantly ads', is a red dotted line from about Mar-17 at about 3.5 rising to about 10 at Sep-18, about 15 at Mar-20, about 20 at Sep-20, ending near Aug-21 at about 30.5. Series 2, 'Ads', is a solid red line starting about Nov-20 at about 26, about 29 at Sep-21, about 32 at Mar-22, about 34 near Jun-22 and about 38 at Sept-22 (the subtitle states $38bn for 2022). Legend at top left: a red dot marker labelled 'Other, predominantly ads' above a short red dash labelled 'Ads'. No data labels and no highlighted points. Source line reads 'Source: Amazon'. No photographs, logos or icons.
Slide 33
Ads > Prime
Amazon’s ad business overtook Amazon Prime revenue in 2022
Amazon revenue, TTM ($bn)
'Other, predominantly ads'
Ads
Prime
40
30
20
10
0
Mar-17
Sep-17
Mar-18
Sep-18
Mar-19
Sep-19
Mar-20
Sep-20
Mar-21
Sep-21
Mar-22
Sept-22
Source: Amazon
Benedict Evans
–– February 2023
34
Visuals: Line chart titled 'Amazon revenue, TTM ($bn)'. Y axis: 0 to 40 in steps of 10, unit $bn, dotted light-grey gridlines at 10, 20, 30 and 40, solid grey baseline at 0. X axis: quarterly-style labels from Mar-17 to Sept-22 at six-month intervals (Mar-17, Sep-17, Mar-18, Sep-18, Mar-19, Sep-19, Mar-20, Sep-20, Mar-21, Sep-21, Mar-22, Sept-22). Series 1 'Prime' (dark grey #545454 solid line, about 2 px): about 7 at Mar-17, about 13.5 at Sep-18, about 20 at Mar-20, about 24 at Sep-20, about 27.5 at Mar-21, about 31 at Sep-21, about 32.5 at Mar-22, about 35.3 at Sept-22; no printed values. Series 2 'Ads' (red #E8473F solid line): starts about 26 around mid-2021, about 31 at Mar-22 and about 38 at Sept-22; no printed values. Series 3 'Other, predominantly ads' (red dotted line): about 3.5 at Mar-17, about 10 at Sep-18, about 15 at Mar-20, about 20 at Sep-20, about 28 at mid-2021, ending about 30.5 near Sep-21; no printed values. The Ads and Other lines both lead into the Prime line around Sep-21 to Mar-22 where they converge; the Ads line finishes above Prime. Legend at upper left of the chart with a small red dot, a red line and a dark grey line, labels as in text. No highlighted points.
Slide 34
Old and new gatekeepers
New ad models overtake old ones
Global advertising revenue ($bn, 2022 dollars)
Newspapers
Amazon
200
150
100
50
0
1980
1990
2000
2010
2020
Source: Amazon, Zenith, BLS
Benedict Evans
–– February 2023
35
Visuals: Line chart titled 'Global advertising revenue ($bn, 2022 dollars)'. Y-axis: 0 to 200, labelled 0, 50, 100, 150, 200 (no unit label on axis; unit given in chart title as $bn, 2022 dollars). X-axis: 1980 to about 2022, labelled 1980, 1990, 2000, 2010, 2020. Dotted light grey horizontal gridlines at 50, 100, 150 and 200; solid grey baseline at 0. Series 1, Newspapers, dark grey (#545454) line: about 103 in 1980, about 102 in 1982, about 123 in 1985, about 152 in 1989, about 137 in 1993, about 152 in 1997, peak about 170 in 2000, about 150 in 2003, about 148 in 2007, about 110 in 2009, about 89 in 2012, about 63 in 2016, about 45 in 2019, about 28 in 2022. Series 2, Amazon, red (#E8443A) line: starts about 5 in 2017, about 10 in 2018, about 15 in 2019, about 30 in 2021, about 37 in 2022. The two lines cross at about 2021. Values are estimates marked 'about' because the slide prints no data labels. Legend at upper left of chart: dark grey short line with 'Newspapers', red short line with 'Amazon'. No highlighted points.
Slide 35
Ads > AWS?
When they work, ads have much higher margins than infrastructure (let alone retail)
Amazon segments, 2022 ($bn)
Net sales
Operating income *
Capex **
100
$502bn
75
50
25
0
Group
AWS
Ads
Source: Amazon, Benedict Evans
Benedict Evans
–– February 2023
36
* Amazon reports Group & AWS; assume 60% operating margin for ads, matching Google ads minus TAC
** Amazon reports approx. 50% of capex going to AWS; assume incremental capex to serve ads is minimal
Visuals: Clustered vertical bar chart titled 'Amazon segments, 2022 ($bn)'. Y-axis: $bn, linear, range 0 to 100, labelled ticks at 0, 25, 50, 75, 100, with light dotted horizontal gridlines at each tick. X-axis: three categories, Group, AWS, Ads, with a thin baseline at 0. Three series per category, in this order: Net sales (dark grey #535353), Operating income * (pale pink #F8DBD8), Capex ** (red #EB483F). Labelled value: Group Net sales $502bn (printed inside the bar top in white). Other values are not printed; estimates: Group Operating income about 12, Group Capex about 64; AWS Net sales about 80, AWS Operating income about 23, AWS Capex about 32; Ads Net sales about 37, Ads Operating income about 22, Ads Capex about 2. Legend at left of the chart, stacked vertically: dark grey square with 'Net sales', pale pink square with 'Operating income *', red square with 'Capex **'. No series is highlighted beyond the red capex colour.
Slide 36
“I can’t remember a business with the
margin structure of the advertising
business here at Walmart (and having
30% growth for the quarter was nice)”
Doug McMillon, Walmart CEO
Benedict Evans
–– February 2023
37
Slide 37
New channel, new gold rush / First party data, inventory, and very attractive margins / Walmart / $2.7bn / in 2022 / Uber / $500m / run rate / Amazon / $38bn / in 2022 / Inventory / 1P Targeting / Margins! / Source: Companies / Benedict Evans –– February 2023 38
Visuals: Four circles in a single row, with equal diameters and even spacing. Circle 1 is dark grey #535353 and reads 'Walmart / $2.7bn / in 2022'. Circle 2 is dark grey #535353 and reads 'Uber / $500m / run rate'. Circle 3 is dark grey #535353 and reads 'Amazon / $38bn / in 2022'. Circle 4 is red #EB483F and reads 'Inventory / 1P Targeting / Margins!'. Each circle is a flat filled disc with no outline, no shadow and no gradient, and holds white centred text. The circles are not charts, photographs or logos. No axes, legend or data points are present.
Slide 38
Retail media / Retail media may have taken 10% share in 2022 / Share of US advertising spending / Other digital / Retail / Social / Search / 75% / 50% / 25% / 0% / 2010 / 2011 / 2012 / 2013 / 2014 / 2015 / 2016 / 2017 / 2018 / 2019 / 2020 / 2021 / 2022 / Source: Zenith, GroupM / Benedict Evans / –– February 2023 / 39
Visuals: Chart: stacked column chart, type vertical stacked columns, 13 columns for 2010 to 2022. Chart title: Share of US advertising spending. Y axis: percentage of US advertising spending, labelled 0%, 25%, 50%, 75%, range 0% to 75%, faint dotted horizontal gridlines at 25%, 50%, 75%, solid thin grey baseline at 0%. X axis: years 2010 to 2022, one label per column. Series from bottom to top: Search (black), Social (dark grey), Retail (red), Other digital (mid-light grey). No values are printed on the slide, so the following totals and segments are estimates: 2010 about 17% total (Search about 11.5, Social about 0.5, Other digital about 5); 2011 about 18% (Search about 12.5, Social about 1, Other digital about 4.5); 2012 about 20.5% (Search about 13.5, Social about 1, Other digital about 6); 2013 about 23.5% (Search about 14, Social about 2, Other digital about 7.5); 2014 about 26% (Search about 15, Social about 3, Other digital about 8); 2015 about 30% (Search about 15.5, Social about 4.5, Other digital about 10); 2016 about 34% (Search about 17, Social about 7, Other digital about 10); 2017 about 39.5% (Search about 19.5, Social about 9, Other digital about 11); 2018 about 45.5% (Search about 21, Social about 11.5, Other digital about 13); 2019 about 49.5% (Search about 22.5, Social about 13.5, Other digital about 13.5); 2020 about 57% (Search about 24, Social about 17, Retail about 2.5, Other digital about 13.5); 2021 about 64% (Search about 27.5, Social about 19, Retail about 5, Other digital about 12.5); 2022 about 67% (Search about 28.5, Social about 16.5, Retail about 9.5, Other digital about 12). Legend: vertical list at left, top to bottom Other digital (light grey swatch), Retail (red swatch), Social (dark grey swatch), Search (black swatch), swatches about 1.2% wide, text 1.85% high. Highlighted points: the red Retail segment in 2020, 2021 and 2022 is the only colour in the chart and draws the eye. Segments are separated by thin white borders. Columns are about 4% of slide width each with square corners and no shadows.
Slide 39
Advertising? Marketing? Price discrimination?
There are lots of different terms to describe the ancient practice of ‘brands paying retailers’
One estimate is that trade dollars comprise about 7.5 percent of U.S. retailers’ revenues—about two times retailers’ pre-tax income.49
According to one source, “Retailers are hooked on the heroin of this promotional money, and even the few who say they need to wean themselves from these payments know it is a difficult and arduous process. Manufacturers would love to find a way to reduce these payments…but, on the other hand, they’re used to a system that allows them to virtually buy real estate in the store.”52
Amazon ads:
7.5% of 2022
retail
revenue
Source: Competing in Tough Times, Barry Berman (2010), Amazon
Benedict Evans
–– February 2023
40
Visuals: One photograph of a printed book page, shown as a flat white card with a soft grey drop shadow, not full-bleed, not cropped. The page shows two paragraphs of black serif body text on white with two red underlines: a red rule beneath “7.5 percent of” at the end of the first line and a red rule beneath “U.S. retailers’ revenues” on the second line. A thin white band overlays the image region at about y 43.3% to 44.5%, covering part of the left-side text line spacing. Lighting is flat and even; dominant colours are white and black. One red filled circle (#EB483F) with white text reading “Amazon ads: / 7.5% of 2022 / retail / revenue” acts as a callout; it is a solid circle with no outline or shadow.
Slide 40
Chinese suppliers going direct on Amazon / Chinese manufacturers bypass US retailers and brands and go direct to the consumer / Share of Amazon Marketplace Top Sellers based in China / 50% / 40% / 30% / 20% / 10% / 0% / Mar-17 / Sep-17 / Mar-18 / Sep-18 / Mar-19 / Sep-19 / Mar-20 / Sep-20 / Mar-21 / Sep-21 / Source: MarketplacePulse / Benedict Evans / –– February 2023 / 41
Visuals: One line chart, a smoothed red line with no markers. Chart title: 'Share of Amazon Marketplace Top Sellers based in China' (above the plot, left-aligned). Y axis: percentage share, labelled 0% to 50% in 10% steps, gridlines at each 10%. X axis: time in half-year steps, labelled Mar-17, Sep-17, Mar-18, Sep-18, Mar-19, Sep-19, Mar-20, Sep-20, Mar-21, Sep-21. The slide prints no data values, so the values below are estimates marked about: Mar-17 about 17%, Sep-17 about 22%, Mar-18 about 24%, Sep-18 about 26%, Mar-19 about 27%, Sep-19 about 31%, Mar-20 about 33%, Sep-20 about 40%, Mar-21 about 39.5%, Sep-21 about 38%, final point about 37%. Peak near late 2020 about 42.5%. Single series, no legend. No highlighted points. Line colour is red approximately #E84C3D, about 3 px stroke.
Slide 41
Building brands on Amazon
Anker, based in Shenzhen, has built a $2bn phone accessory business on Amazon Marketplace
Anker Innovations financials ($bn)
Revenue
Net income
2.0
1.5
1.0
0.5
0.0
2015
2016
2017
2018
2019
2020
2021
Source: Anker
Benedict Evans
–– February 2023
42
Visuals: Clustered bar chart, vertical bars. Title: Anker Innovations financials ($bn). Y axis: $bn, range 0.0 to 2.0, gridlines at 0.5 intervals, labels 0.0, 0.5, 1.0, 1.5, 2.0. X axis: years 2015 to 2021, one category per year. Two series: Revenue in red #EB483F and Net income in dark grey #545454. Printed values: none; the only printed numbers are the axis labels. Estimated values, marked as about: Revenue 2015 about 0.18, 2016 about 0.35, 2017 about 0.54, 2018 about 0.73, 2019 about 0.93, 2020 about 1.31, 2021 about 1.76. Net income 2015 about 0.01, 2016 about 0.05, 2017 about 0.04, 2018 about 0.06, 2019 about 0.10, 2020 about 0.12, 2021 about 0.14. Legend: red square labelled Revenue above dark grey square labelled Net income, stacked vertically in the left margin. Highlighted points: none. Gridlines are thin dotted light grey lines; the category baseline is a thin solid grey line at 0.0.
Slide 42
Unbundling Amazon
Shopify powered $200bn of sales in 2022 - 45% the size of Amazon Marketplace
Retail GMV ($bn)
Amazon Marketplace
Shopify
500
400
300
200
100
0
2015
2016
2017
2018
2019
2020
2021
2022
Source: Goldman Sachs, Shopify
Benedict Evans
–– February 2023
43
Visuals: Chart: clustered vertical bar chart, titled 'Retail GMV ($bn)' (top-left above the plot). Y-axis: 0 to 500, gridlines and labels at 0, 100, 200, 300, 400, 500, with dotted light-grey horizontal gridlines; unit $bn. X-axis: years 2015 to 2022 with labels beneath each bar pair. Series 1, Amazon Marketplace, dark grey #535353 bars; about values: 2015 about 78, 2016 about 105, 2017 about 139, 2018 about 173, 2019 about 212, 2020 about 311, 2021 about 389, 2022 about 435 (no values printed on the slide). Series 2, Shopify, red #EB483F bars; about values: 2015 about 7, 2016 about 15, 2017 about 26, 2018 about 41, 2019 about 61, 2020 about 118, 2021 about 175, 2022 about 197 (no values printed). Bars are paired per year with a small white gap between the two bars, Amazon on the left and Shopify on the right. Legend at top-left of the chart: dark grey square with 'Amazon Marketplace' above a red square with 'Shopify', stacked vertically, no border. No highlighted points.
Slide 43
New channels, new winners / A Chinese smartphone-only fast fashion brand overtakes the market leaders? / Worldwide relative search interest / Zara / H&M / Shein / 100 / 75 / 50 / 25 / 0 / 2005 / 2010 / 2015 / 2020 / Source: Google Trends / Benedict Evans / –– February 2023 / 44
Visuals: Line chart titled 'Worldwide relative search interest'. Y axis: relative search interest, unitless index, scale 0 to 100 with labelled gridlines at 0, 25, 50, 75 and 100, drawn as thin dotted light grey horizontal lines. X axis: calendar years 2005 to about 2023 with labelled ticks at 2005, 2010, 2015 and 2020, and a solid grey baseline at 0. Three series, monthly values. Zara (dark grey #4D4D4D line, about 2.5 px): starts about 13 in 2005, rises to about 25 by 2009, jumps to about 43 in late 2010, about 50 to 65 through 2012 to 2014, about 60 to 77 in 2015 to 2017, peaks at 100 about late 2007 (plotted near 2018 on the axis), typically 60 to 85 from 2018 to 2022 with a low near 50 in early 2020, and ends about 72 in early 2023. H&M (light grey #A6A6A6 line, about 2.5 px): about 11 in 2005, about 20 by 2007, about 25 to 35 in 2008 to 2011, spike to about 57 in 2012, mostly about 30 to 45 from 2013 onward, dip to about 25 in early 2020, and ends about 30 in early 2023. Shein (red #E8453C line, about 2.5 px): first appears about 1 in mid 2015, stays about 1 to 2 until 2016, rises to about 10 by 2018, about 15 to 20 in 2019, about 45 to 48 in early 2020, about 33 in late 2020, climbs to about 60 to 65 in 2022, peaks about 84 in early 2023 and ends about 75. Legend: Zara with dark grey short line, H&M with light grey short line, Shein with red short line, listed top to bottom at the left of the plot. No points are highlighted with markers.
Slides 44 to 103 continue in the full text file.
Download this deck
The hosted PDF of every library deck is free for readers of the SlideDeck Co newsletter. Join with your email and the viewer and download appear here.
Building a deck of your own? The SlideDeck Co Standard Deck is a slide library for business presentations: reviews, updates and plans.







