

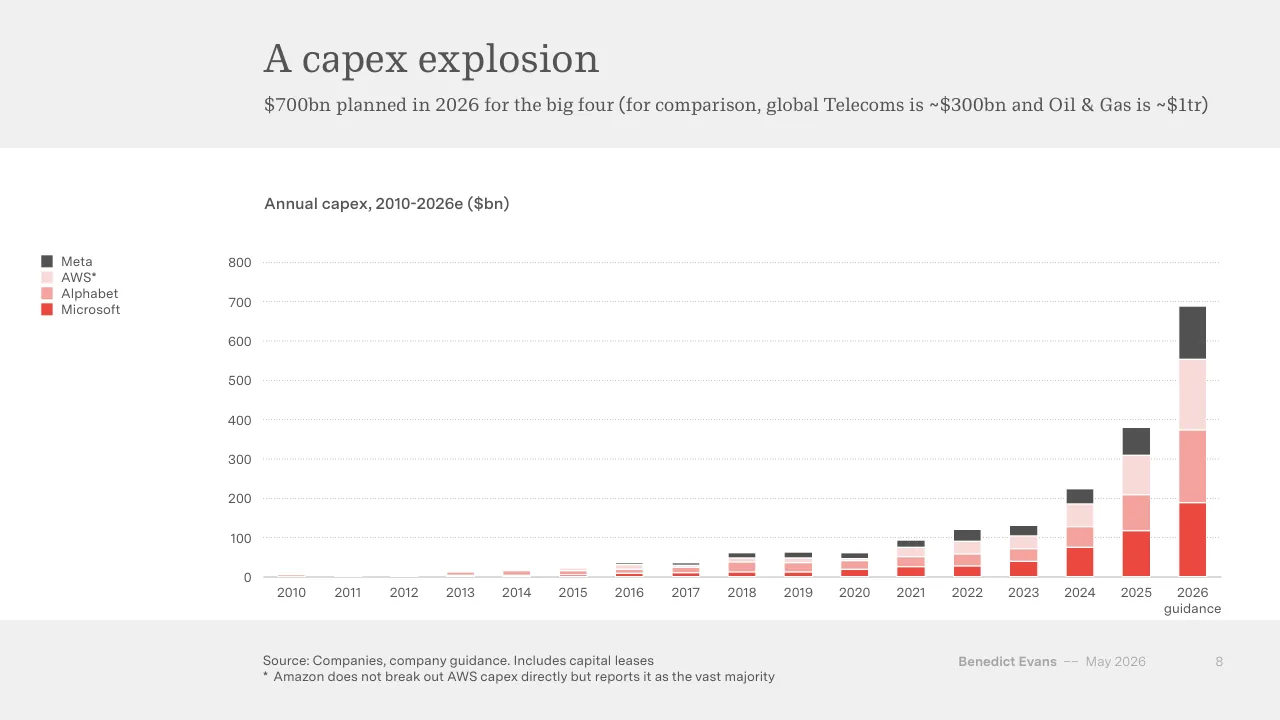
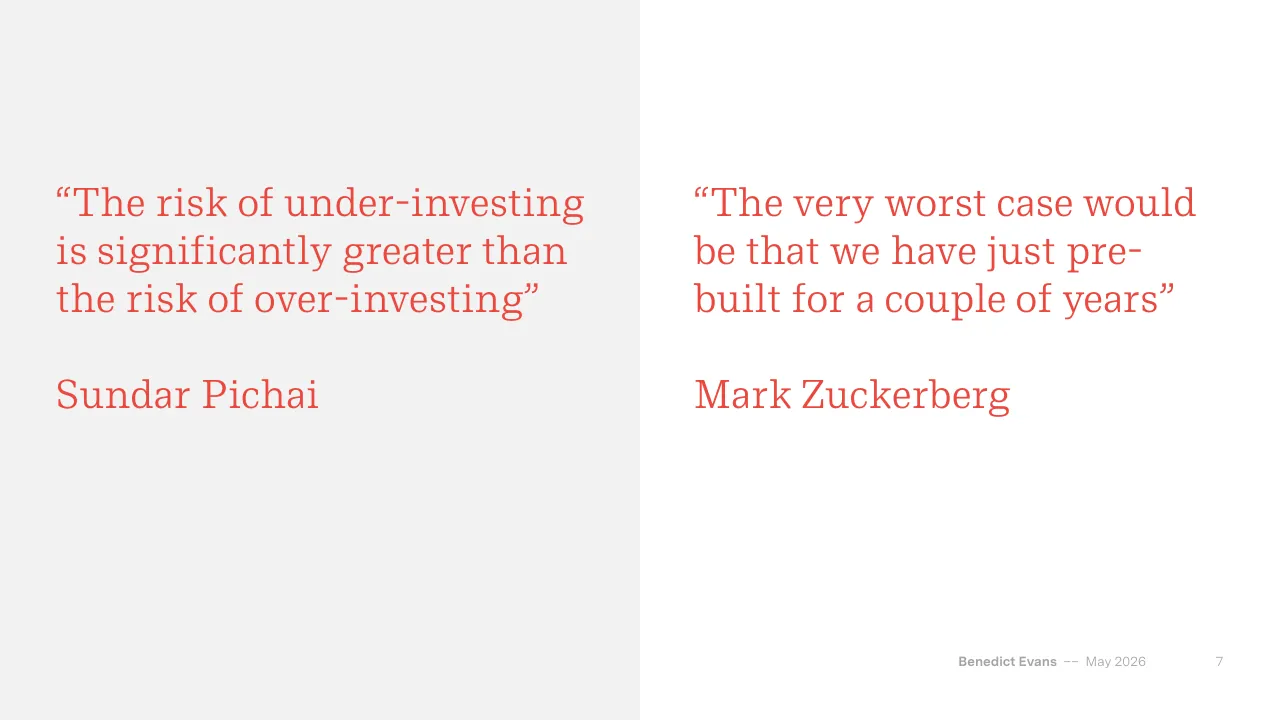
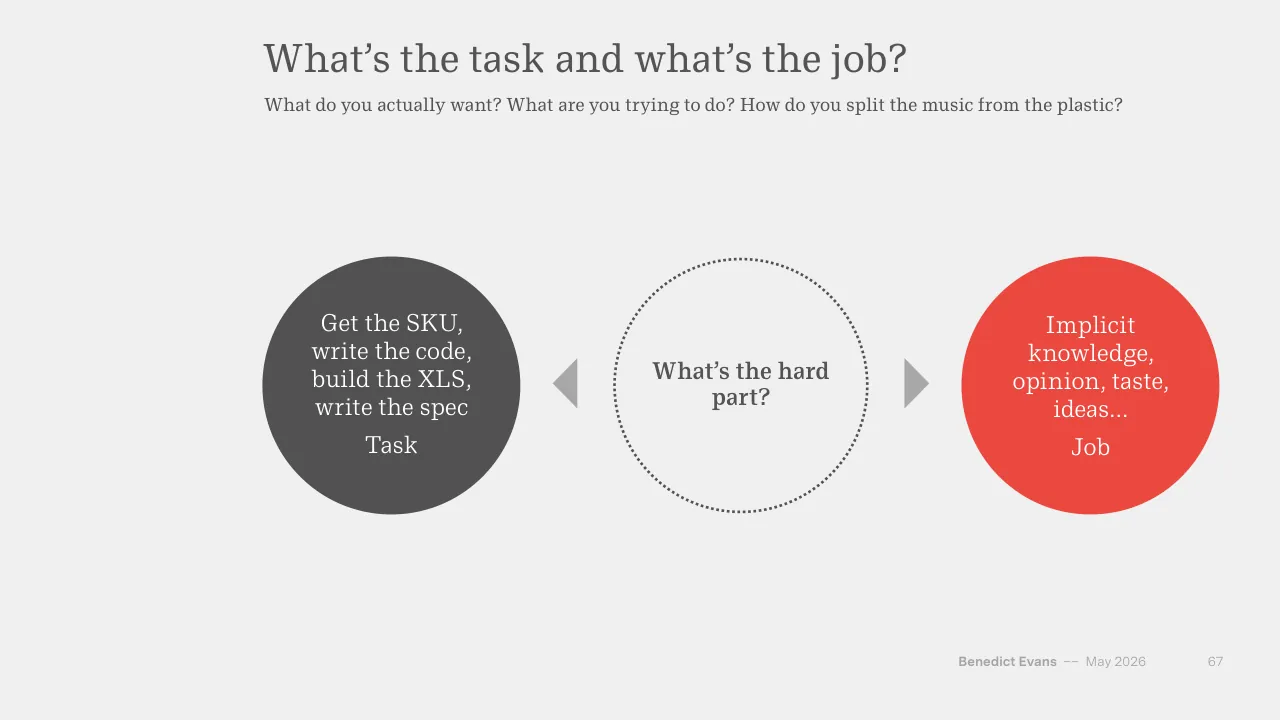
The deck opens with a title slide and a three-part frame of Capital, Deployment and Change, then moves into the capital section, which tracks platform shifts and the rising capital spending on AI infrastructure by large technology companies, including chips, data centres and balance-sheet strain. The deployment section looks at user adoption, workplace use, how companies move from pilots to daily use, and the software market. The change section asks what automation means for jobs and industries, and what new questions AI makes possible. The closing slides return to the theme that the outcome is uncertain and that the useful work is asking the right questions. Charts carry most of the argument, with short headline titles and subtitles that state the point of each chart. Quotes from executives appear as separate slides between sections to break up the data. The author's name and date appear in a consistent footer. Slides worth studying include the capex chart (slide 8), the quote slides (7 and 17), and the framework slides on tasks and jobs (67 and 68).
Slides worth studying
Questions about this deck
How many slides does the Benedict Evans AI eats the world deck have, and how is it structured?
The deck has 79 slides. Slide 2 frames it in three parts, Capital, Deployment and Change, after the title slide.
What does the Benedict Evans deck say about AI infrastructure capex by big technology companies?
Slide 8, titled 'A capex explosion', says $700bn is planned in 2026 for the big four. For comparison, it lists global Telecoms at about $300bn and Oil & Gas at about $1tr.
What does the Benedict Evans deck say about ChatGPT weekly users?
Slide 29, titled 'Everyone is already using this!', says OpenAI reports 900m+ weekly users but only 5% are paying.
What does the Benedict Evans deck say about Nvidia's revenue and capacity?
Slide 9, titled 'Nvidia can't keep up', charts quarterly revenue in $bn for Nvidia and Intel from 2000 to 2025. Its subtitle says Nvidia can't get TSMC to increase capacity fast enough.
Details
- Company: Benedict Evans
- Year: 2026
- Type: Conference talk
- Industry: Technology analysis
- Pages: 79
More from Benedict Evans
- Benedict Evans conference talk, Autumn 2025
- Benedict Evans conference talk, Spring 2025
- Benedict Evans conference talk, 2023
- Benedict Evans conference talk, 2023
- Benedict Evans strategy presentation, 2022
- Benedict Evans conference talk, 2021
All Benedict Evans decks in the library
Review score: 8 out of 10, Strong
Presentation quality, judged with the SlideDeck Co review heuristic. Ask, evidence and idea merit are not rated here.
The deck has a clear route of Capital, Deployment and Change (slides 2, 3, 28, 49), and most chart slides pair a plain headline with a subtitle that states the point, such as slide 8 with its comparison to telecoms and oil and gas. The visual system is disciplined: one serif and one sans, a red and charcoal palette, a consistent footer and source line, and charts that use red to isolate the series that matters. Weaknesses are small text in chart legends and footers for a conference room, a repeated circle-and-arrow diagram that adds little beyond its words (36, 42, 44, 59, 67), and several near-empty quote and divider slides (50, 51, 60) that slow the rhythm across 79 pages.
Worth keeping: The headline-plus-subtitle chart format with red highlighting on slide 8, the section dividers, and the consistent footer and source lines.
Most useful repair: Enlarge legends, axis labels and footer text on the chart slides, and add direct labels so the charts read from the back of a room.
What would change the score: Cut or merge the sparse quote slides (50, 51, 60) and vary the circle diagrams so that slides 36, 42 and 44 carry more than short phrases in circles.
Confidence medium. 72 of 79 pages inspected on contact sheets, 4 at readable size. Reviewed 2026-11-08. Model-assisted review (claude-sonnet-5-5).
Full text of the slides (79 slides)
Every slide's words and a description of its charts and images, so the deck can be searched and rebuilt. Also available as Markdown.
Slide 1
AI eats the world
Benedict Evans
May 2026
www.ben-evans.com
Benedict Evans –– May 2020
Visuals: none (no photograph, chart, icon or logo). The only non-text marks are a faint white translucent rectangle behind the text panel and a thin white horizontal rule along the panel's bottom edge.
Slide 2
AI eats the world
Capital
Deployment
Change
Benedict Evans –– May 2026 2
Visuals: Three filled circles of identical size, each a solid red circle (#EB483F) about 22.1% of slide width and 39.3% of slide height, vertically centred on the same horizontal line. From left to right they carry the labels Capital, Deployment and Change in white serif type. No chart, photo, icon or logo.
Slide 3
Capital
Benedict Evans –– May 2026
3
Slide 4
Tech moves in platforms shifts
Every 10-15 years, a platform shift reshapes technology
Mainframes
PCs
Web
Smartphones
Generative AI
Benedict Evans
–– May 2026
4
Visuals: Diagram: a left-to-right sequence of five upward S-curved arrows, one per column, showing platform shifts. Curve 1 (grey #808080, about 3px stroke at 2000px width, solid line with a filled grey triangular arrowhead) runs from the lower-left of the Mainframes column (about x 20%, y 68%) up to the arrowhead at about x 35%, y 56.5%, at the boundary with the PCs column. Curve 2 (same style) runs from about x 35%, y 62.4% up to an arrowhead at about x 50%, y 50.7%, at the boundary with the Web column. Curve 3 runs from about x 50%, y 56.5% up to an arrowhead at about x 65%, y 45%, at the boundary with the Smartphones column. Curve 4 runs from about x 65%, y 50.7% up to an arrowhead at about x 80%, y 39%, at the boundary with the Generative AI column. Curve 5 is the only red element: a dotted red (#EB483F) line, about 3px, with a filled red triangular arrowhead, running from about x 80.3%, y 43.6% up and right to an arrowhead at about x 95%, y 32%. The curves are not connected to any boxes; each begins where the previous one ends, forming a stepped rising sequence. No photographs, logos or icons.
Slide 5
What happens in a platform shift?
Who is affected, and how much?
The New Thing!
All tech innovation,
investment and
company creation
switches over
Inside tech
New gatekeepers,
new value capture
New and bigger
markers
Outside tech
Is this a new tool,
new revenue, or
an existential
threat?
Benedict Evans
–– May 2026
5
Visuals: Three white circles of equal size, each with a thin outline: the first and second have dark grey (#545454) outlines about 0.3% of slide width, the third has a red (#E84A3F-like) outline of the same width. Between circle 1 and 2, and between circle 2 and 3, there is a small solid grey right-pointing triangle (chevron) filled #A6A6A6, pointing right, roughly 3.5% wide by 6% tall. Text inside circles is centred. No chart, photo or logo.
Slide 6
Platform shifts reset the tech industry
Microsoft dominated the PC era, but then smartphones made it irrelevant
Microsoft OS share of global computer unit sales
100%
75%
50%
25%
0%
1980
1990
2000
2010
2020
Source: Apple, Google, Gartner
Benedict Evans
–– May 2026
6
Visuals: One line chart. Type: line chart with a single smoothed red series. Title: 'Microsoft OS share of global computer unit sales'. Y axis: percentage share of global computer unit sales, 0% to 100%, gridlines and labels at 0%, 25%, 50%, 75%, 100%. X axis: years, 1980 to about 2024, labelled at 1980, 1990, 2000, 2010 and 2020. Series values (none printed; all about): 1980 about 0%; 1982 about 9%; 1983 about 26%; 1985 about 49%; 1988 about 80%; 1990 about 84%; 1991 about 77% (local minimum); 1995 about 91%; 1998 about 97% (peak); 2000 about 97%; 2004 about 97%; 2008 about 91%; 2010 about 70%; 2011 about 48%; 2013 about 20%; 2016 about 11% (low); 2018 about 12%; 2021 about 16% (local high); 2024 about 12%. Legend: none. Highlighted points: none, apart from the 1998 peak and the 2016 trough being the visual extremes. Gridlines are thin dotted light grey lines at each 25% step spanning the plot width. The x axis is a solid thin grey baseline at 0%. No markers on the line.
Slide 7
“The risk of under-investing / is significantly greater than / the risk of over-investing” / Sundar Pichai / “The very worst case would / be that we have just pre- / built for a couple of years” / Mark Zuckerberg / Benedict Evans –– May 2026 7
Slide 8
A capex explosion / $700bn planned in 2026 for the big four (for comparison, global Telecoms is ~$300bn and Oil & Gas is ~$1tr) / Annual capex, 2010-2026e ($bn) / Meta / AWS* / Alphabet / Microsoft / 800 / 700 / 600 / 500 / 400 / 300 / 200 / 100 / 0 / 2010 / 2011 / 2012 / 2013 / 2014 / 2015 / 2016 / 2017 / 2018 / 2019 / 2020 / 2021 / 2022 / 2023 / 2024 / 2025 / 2026 / guidance / Source: Companies, company guidance. Includes capital leases / * Amazon does not break out AWS capex directly but reports it as the vast majority / Benedict Evans / –– May 2026 / 8
Visuals: Chart: stacked column chart titled 'Annual capex, 2010-2026e ($bn)'. Y axis: '$bn' implied by chart title, range 0 to 800, labelled every 100, with light dotted horizontal gridlines at each 100 step. X axis: years 2010 to 2026, with 2026 labelled 'guidance' beneath; 2026 is a forecast. Series stacked bottom to top: Microsoft (red), Alphabet (salmon), AWS* (pale pink), Meta (dark grey). Printed values: none; estimates marked 'about'. Estimated column totals: 2010 about 5; 2011 about 0; 2012 about 0; 2013 about 12; 2014 about 16; 2015 about 22; 2016 about 36; 2017 about 35; 2018 about 62; 2019 about 63; 2020 about 60; 2021 about 93; 2022 about 120; 2023 about 131; 2024 about 225; 2025 about 380; 2026 guidance about 690. Estimated 2025 segments: Microsoft about 118, Alphabet about 92, AWS about 100, Meta about 70. Estimated 2026 guidance segments: Microsoft about 190, Alphabet about 182, AWS about 180, Meta about 137. Legend: top to bottom Meta (dark grey square), AWS* (pale pink square), Alphabet (salmon square), Microsoft (red square). No highlighted points; bars are separated by thin white gaps. Bars are solid fills with no gradients.
Slide 9
Nvidia can’t keep up / (And can’t get TSMC to increase capacity fast enough) / Quarterly revenue ($bn) / Intel / Nvidia / 70 / 60 / 50 / 40 / 30 / 20 / 10 / 0 / 2000 / 2005 / 2010 / 2015 / 2020 / 2025 / Source: Companies / Benedict Evans / –– May 2026 / 9
Visuals: One line chart titled 'Quarterly revenue ($bn)'. Y-axis: quarterly revenue in $bn, labelled 0, 10, 20, 30, 40, 50, 60, 70, with light dotted horizontal gridlines at each 10 step and a solid thin grey baseline at 0. X-axis: years 2000 to 2025 labelled at every fifth year, plotted quarterly. Series 1, Intel, dark grey line (about #545454), about 8 at 2000, about 9 around 2001, about 7 around 2002, about 10 around 2007, about 12 at 2009 low, about 14 around 2011, about 15 around 2014, about 20 around 2019 to 2020 and a peak of about 20.5 around 2022, falling to about 12 around 2023, then about 14 at 2025. Series 2, Nvidia, red line (about #E8473F), about 0.5 from 2000 to 2016, about 2 around 2017, about 3 around 2018, about 6 around 2020 to 2021, about 8 around 2022, a dip to about 6 at 2023, then a steep rise to about 17 at 2024, about 35 at mid-2024, about 47 at late 2025 and about 68 at the last plotted point. No values are printed on the chart, so all values are estimates marked 'about'. Legend at upper left of the plot, outside it, with a short dark grey line for Intel and a short red line for Nvidia. No points are highlighted.
Slide 10
A new semiconductor investment cycle? / Unprecedented surge in chip demand (but semis have always been a cyclical industry) / Monthly global semiconductor billings ($bn, 2026 dollars) / 125 / 100 / 75 / 50 / 25 / 0 / Jan 1990 / Jan 2000 / Jan 2010 / Jan 2020 / Mar 2026 / Source: WSTS, US Census / Benedict Evans / –– May 2026 / 10
Visuals: One line chart. Type: continuous time-series line chart, single series, no markers. Chart title: 'Monthly global semiconductor billings ($bn, 2026 dollars)'. Y-axis: 0 to 125 $bn, labelled every 25 (0, 25, 50, 75, 100, 125), light dotted horizontal gridlines at each labelled value. X-axis: monthly from Jan 1990 to Mar 2026, labelled Jan 1990, Jan 2000, Jan 2010, Jan 2020, Mar 2026; solid thin grey baseline at 0. Series: red line about #EE4035, roughly 2.5 px wide, rising from about 10 in 1990 (about 10 to 12 through the early 1990s), about 25 to 30 in 1996 to 1997, a peak about 40 in late 1999, a dip to about 17 in 2001 to 2002, about 30 to 40 in 2005 to 2008, a dip to about 20 in late 2008, about 40 to 50 in 2012 to 2016, about 50 to 60 in 2018 to 2019, a dip to about 40 in 2019 to 2020, about 55 to 62 in 2021, a dip to about 41 in 2023, a sharp climb to about 80 to 85 in 2024 to 2025, and ending at about 116 at Mar 2026 at the right edge of the plot. No legend. Highlighted point: the final point at Mar 2026, about 116, where the line runs off the top-right of the plot area steeply upward.
Slide 11
Driving yet more investment
Semiconductor capex is surging to meet (though not as much as the customers might like)
Capex for leading semiconductor companies ($bn)
Samsung Electronics
Intel
TSMC
150
100
50
0
2010
2011
2012
2013
2014
2015
2016
2017
2018
2019
2020
2021
2022
2023
2024
2025
2026
guidance
Source: Companies
Benedict Evans
–– May 2026
11
Visuals: Stacked column chart titled 'Capex for leading semiconductor companies ($bn)'. Y-axis: $bn, 0 to 150, with labelled gridlines at 0, 50, 100 and 150 (dotted light grey lines; solid grey baseline at 0). X-axis: calendar years 2010 to 2025 and '2026 guidance' (the final label wraps to two lines). Three stacked series, bottom to top: TSMC (red), Intel (dark grey), Samsung Electronics (light grey); thin white separators between segments. Legend at top-left of chart: Samsung Electronics (light grey swatch), Intel (dark grey swatch), TSMC (red swatch), listed top to bottom. No values are printed on the bars; values below are estimates marked 'about', read against the axis (TSMC / Intel / Samsung segments, total in brackets): 2010 about 6 / 5 / 14 (about 25); 2011 about 7 / 11 / 14 (about 32); 2012 about 8 / 11 / 15 (about 34); 2013 about 9 / 11 / 15 (about 35); 2014 about 9 / 10 / 15 (about 34); 2015 about 8 / 7 / 18 (about 33); 2016 about 10 / 10 / 16 (about 36); 2017 about 10 / 13 / 28 (about 51); 2018 about 10 / 15 / 20 (about 45); 2019 about 15 / 16 / 17 (about 48); 2020 about 16 / 14 / 26 (about 56); 2021 about 27 / 20 / 32 (about 79); 2022 about 35 / 24 / 34 (about 93); 2023 about 30 / 26 / 39 (about 95); 2024 about 30 / 24 / 35 (about 89); 2025 about 41 / 14 / 33 (about 88); 2026 guidance about 56 / 15 / 74 (about 145). No highlighted points; the 2026 guidance bar is the tallest and is not visually distinguished beyond its label.
Slide 12
Overtaking the office cycle
US data centre construction spending (not including the compute!) is now overtaking office construction
US construction value ($bn, 2026 dollars, seasonally adjusted annual rate)
Offices
125
Data centres*
100
75
50
25
0
Jan 1995
Jan 2000
Jan 2005
Jan 2010
Jan 2015
Jan 2020
Jan 2025
Source: US Census.* Excludes compute
Benedict Evans
–– May 2026
12
Visuals: Chart: line chart, two series. Title printed above the plot: 'US construction value ($bn, 2026 dollars, seasonally adjusted annual rate)'. Y axis: 'US construction value' in $bn, 2026 dollars, seasonally adjusted annual rate, range 0 to 125, gridlines and labels at 0, 25, 50, 75, 100, 125; no axis title printed beyond the chart title. X axis: time, Jan 1995 to about Jan 2025 (last tick at Jan 2025 with series running slightly past it), labelled ticks at Jan 1995, Jan 2000, Jan 2005, Jan 2010, Jan 2015, Jan 2020, Jan 2025. Series 1 'Offices', dark grey line (#545454), no printed values; about 53 in Jan 1995, rising to a peak of about 115 around Jan 2001, falling to about 87 by Jan 2003, a trough of about 55 in 2003, a second peak of about 95 in 2007, a fall to a low of about 35 in 2011, a rise to about 85 in 2015, a peak of about 95 in 2019/2020, falling to about 46 at the end in 2025. Series 2 'Data centres*', red line (#E8473B), starts about 2 in 2014, about 4 in 2015, about 10 in 2018, about 12 in 2020, about 20 in 2023, about 35 in 2024, ending about 49 in 2025, where it crosses above the Offices line. Legend at upper left of the plot: dark grey short line with 'Offices', red short line with 'Data centres*'. No highlighted points or annotations. Gridlines: horizontal dotted light grey lines at 25, 50, 75, 100, 125; solid mid grey baseline at 0.
Slide 13
Challenging financial gravity / These were asset-light businesses that funded capex from free cashflow - not any more / Annual capex/sales, CY 2010 to 2026e / 60% / 50% / 40% / 30% / 20% / 10% / 0% / Meta / Microsoft / Alphabet / Amazon / Source: Companies, consensus estimates / Benedict Evans / –– May 2026 / 13
Visuals: Chart: clustered column chart with a bar for every year, grouped by company, titled 'Annual capex/sales, CY 2010 to 2026e'. Y-axis: 'capex/sales' in percent, range 0% to 60%, labelled every 10% (0%, 10%, 20%, 30%, 40%, 50%, 60%), with thin dotted horizontal gridlines at each label. X-axis: four company groups labelled Meta, Microsoft, Alphabet, Amazon, each group having 16 dark grey columns for 2010 to 2025 followed by one red column for 2026e as the final bar of the group; no printed data values. Estimated values (about, read from the image): Meta grey columns about 19.5, 21, 31, 22, 17, 15, 17.5, 16.5, 25, 22, 18.5, 16.5, 27.5, 21, 24, 36 percent; red 2026e column about 55 percent. Microsoft grey columns about 3, 3, 4, 7, 6, 7, 11, 11, 13, 13, 13.5, 15, 14, 18, 29, 39 percent; red 2026e about 54 percent. Alphabet grey columns about 18.5, 12, 8.5, 17, 21, 16.5, 14, 15, 23, 18, 15, 12, 13.5, 13, 18, 27 percent; red 2026e about 44 percent. Amazon grey columns about 3, 4, 6, 4.5, 5.5, 4.5, 5, 6, 6, 6, 10.5, 13, 12.5, 9, 13, 18.5 percent; red 2026e about 26 percent. Highlighted points: the final red column of each group (2026e) is coloured red and the other years are dark grey; there is no legend. Columns are flat, with thin white separators between adjacent columns, and the plot baseline is a thin dark grey horizontal line at 0%. Chart has no photograph, logo or icon.
Slide 14
Here comes the ‘structure’
As spending surges, companies scramble to manage the balance sheet
CNBC window: CNBC / LIVESTREAM / SIG / TECH / Meta partners with Blue Owl Capital or / $27 billion AI data center project / PUBLISHED TUE, OCT 21 2025•5:36 PM EDT / Jonathan Vanian / @/IN/JONATHAN-VANIAN-B704432/ / WATCH LIVE / KEY POINTS / Meta said Tuesday that it formed a joint venture agreement with Blue Owl Capital in a deal worth $27 billion to fund and develop the massive Hyperion data center in rural Louisiana. / The asset management firm will own 80% in the joint venture, while Meta will retain a 20% stake and oversee the construction and property management services of the data center. / Meta has been spending heavily on AI amid a broader race with other tech giants like Alphabet and ChatGPT-maker OpenAI, which are also developing gigantic data centers to power future AI models.
Bloomberg window: Bloomberg / Oracle: Shares Tumble | Oracle's $300 Billion AI Bet | AI-Fueled Rent Spree | L / Markets / Oracle Debt Trades Like Junk as Bond, CDS Spreads Flare / By Caleb Mutua / December 12, 2025 at 3:03 PM EST / Updated on December 12, 2025 at 4:09 PM EST / Save / Translate / 3:05 / Takeaways by Bloomberg AI / Oracle Corp.'s new investment-grade notes are now trading more like junk bonds due to delays in data center completion dates and fears about profits from artificial intelligence investments. / The premium on Oracle's 5.2% notes maturing in 2035 has widened to 1.71 percentage points, and the yield on the notes has reached 5.9%, higher than the average for a basket of bonds in the highest tier of junk territory. / The cost of protecting Oracle's debt against default has risen, and some investors are hedging their exposure, with one investor saying that funding speculation in the tech market "isn't a recipe for success".
FT window: FINANCIAL TIMES / ig Tech / + Add to myFT / 'Absolutely immense': the / companies on the hook for the / 3tn AI building boom / rivate capital joins Big Tech in seeking to capture rewards from / istoric expansion of data centres / © FT montage/The Washington Post/Getty Images
Benedict Evans –– May 2026 14
Visuals: Three browser-window screenshots of news websites, each with a macOS-style title bar of three traffic-light dots (red, yellow, green) at its top-left corner and a rounded-corner white window frame with a soft drop shadow. (1) Left, CNBC Tech article page: navy header bar with white CNBC logo, LIVESTREAM link, search icon and partly hidden SIGN IN text; headline, byline of Jonathan Vanian, a red WATCH LIVE button, a blue rule and a KEY POINTS list with three bullet points, cut off at the bottom edge; partly covered by the Bloomberg window on its right. (2) Centre, Bloomberg article page: black header bar with hamburger icon, Bloomberg wordmark and user icon; a ticker row of headline links; article headline with byline and timestamps; Save, Translate and 3:05 audio buttons as outlined pill shapes; a bordered AI summary box titled Takeaways by Bloomberg AI with three bullets; sits in front of both other windows. (3) Right, Financial Times page: pale peach header with FINANCIAL TIMES masthead in black serif capitals, hamburger and user icons; below is a photograph in a black band: black-and-white photograph of a chain-link fence enclosing a construction site with a partly built structure and small trees on flat ground, with red diagonal lines drawn across it as an overlay and a white caption at bottom right; below that a pink-red Big Tech tag, a '+ Add to myFT' outlined pill, a large bold serif headline, a short black rule and a sans-serif standfirst. The FT window is partly hidden on its left edge by the Bloomberg window.
Slide 15
OpenAI tries to join the club
Deals to build 30GW+ of capacity at $1.4tr? Or / $600bn by 2030?
Aspiration for 1GW/week of new construction / at $20bn/GW = ~$1tr annually?
Other People’s Balance Sheets, circular revenue / and a lot of plate-spinning
Source: OpenAI
Benedict Evans
–– May 2026
15
On the screenshot: EXPLORE OUR BRANDS / DJIA Futures 46429.00 0.10% / S&P 500 Futures 6711.00 0.13% / Nasdaq Futures / WSJ / TECHNOLOGY / OpenAI Unveils Plans for Seemingly Limitless Expansion of Computing Power / In Texas prairie, startup showcases ground zero of AI boom and its plans to shepherd $1 trillion in infrastructure spending / By Berber Jin Follow / Updated Sept. 23, 2025 at 7:13 pm ET
Visuals: One photograph-style screenshot of a Wall Street Journal article mocked up in a browser window, shown as a single image on the right half. The window has a white rounded frame with three traffic-light dots at top left (red, yellow, green), a black bar reading EXPLORE OUR BRANDS, a stock ticker strip (DJIA Futures 46429.00 0.10% up arrow; S&P 500 Futures 6711.00 0.13% up arrow; Nasdaq Futures cut off at the edge), a hamburger menu icon and the WSJ masthead at centre, then the article: a blue TECHNOLOGY kicker, a black serif headline, a grey deck, byline and a Follow button, an italic update timestamp, and a row of outline icons (share, bookmark, text size AA, comment, headphones). The lower part of the window shows a photograph cropped at the bottom edge: five men seated or standing at a panel in front of a dark backdrop with ORACLE lettering in white neon-style signage; the man third from left holds a black microphone; the men wear blue, grey and white shirts, and the two at the right wear dark suits. Lighting is soft and even with a dark, slightly purple-tinted backdrop; the photo is full-width within the window and cropped at the bottom. The window has a soft drop shadow.
Slide 16
Deployment hits bottlenecks everywhere
Broader supply chains cannot keep up with sudden demand for capital deployment
GPUs,
memory
+
Multi-year
power backlog
(Except China)
+
Community/
political
backlash?
=
Pig in a
python
Benedict Evans
–– May 2026
16
Visuals: Diagram: four circles in a horizontal row of equal size (about 16.2% of slide width and 28.8% of slide height each), with operators between them. Circle 1 is dark grey #535353 containing 'GPUs, memory'. Operator '+' in light grey #A7A7A7 bold sans sits between circle 1 and circle 2. Circle 2 is dark grey #535353 containing 'Multi-year power backlog' above '(Except China)' with a gap between the two lines. Operator '+' in light grey #A7A7A7 bold sans sits between circle 2 and circle 3. Circle 3 is dark grey #535353 containing 'Community/ political backlash?'. Operator '=' in light grey #A7A7A7 bold sans sits between circle 3 and circle 4. Circle 4 is red #EB483F containing 'Pig in a python'. The circles are flat with no outline or shadow; no arrows or connectors.
Slide 17
“It’s been almost impossible to build / capacity fast enough since ChatGPT / launched” / Kevin Scott, Microsoft CTO / Benedict Evans –– May 2026 / 17
Slide 18
Meanwhile - unprecedented growth
Explosive growth, with demand far ahead of supply (though business models are nowhere near equilibrium)
Reported monthly revenue ($bn)*
OpenAI (net)
4
Anthropic (gross)
3
2
1
0
Dec 2022
Jun 2023
Dec 2023
Jun 2024
Dec 2024
Jun 2025
Dec 2025
Jun 2026
Source: Companies, press reports. NB: round numbers reported without precise dates
Benedict Evans
–– May 2026
18
* Companies report ‘annualised’ revenue, defined as sum of previous 4 weeks multiplied by 13
Visuals: Line chart with two series, titled 'Reported monthly revenue ($bn)*'. Y axis: labelled 0, 1, 2, 3, 4 in $bn, gridlines dotted grey at each integer, solid grey baseline at 0, range 0 to about 4.4. X axis: labelled Dec 2022, Jun 2023, Dec 2023, Jun 2024, Dec 2024, Jun 2025, Dec 2025, Jun 2026 (semi-annual ticks). Series 1, 'OpenAI (net)', red #E8453C line with round markers: about 0 at Dec 2022, about 0.1 at early 2023, about 0.16 mid 2023, about 0.27 at late 2023, about 0.46 early 2024, about 0.55 mid 2024, about 0.78 at early 2025, about 0.91 at mid 2025, about 1.53 at late 2025, about 1.91 at early 2026 (last point). Series 2, 'Anthropic (gross)', dark grey #4D4D4D line with round markers: about 0 at Dec 2023, about 0.07 at Dec 2024, about 0.38 at mid 2025, about 0.54 at late 2025, about 0.69 at late 2025, about 1.07 at early 2026, about 1.45 at early 2026, about 2.29 at early 2026, about 3.49 at mid 2026 (last point). Values are estimates from the plotted positions as no values are printed. Legend at upper left of plot: red dot and 'OpenAI (net)', grey dot and 'Anthropic (gross)'. No highlighted points. Chart spans roughly x 19.6% to 93.7% and y 34.7% to 81.9%.
Slide 19
“Wait, how much did we spend?!”
Applied AI
Uber CTO Shows How Claude Code Can Blow Up AI Budgets
Uber’s surging use of AI coding tools, particularly Anthropic’s Claude Code, has maxed out its full year AI budget just a few months into 2026, according to chief technology officer Praveen Neppalli Naga.
“I'm back to the drawing board because the budget I thought I would need is blown away already,” Neppalli Naga said in an interview.
Neppalli Naga’s comments highlight the challenges for companies trying to take advantage of new AI tools while also keeping costs under control. Uber is one of a number of companies that say they have encouraged employees to use AI as much as possible, creating internal “leader boards” ranking software engineers who use the most AI.
Benedict Evans
–– May 2026
19
Visuals: One photograph-style screenshot of a web article shown inside a browser window mockup, boxed (not full-bleed), with a soft drop shadow. The window has rounded corners of about 2% of slide height and a light grey-white title strip containing three traffic-light dots: red #FF5F57, yellow #FEBC2E, green #28C840, at left. Below the title strip is a dark charcoal navigation bar #2E3338 containing, left to right: a three-line hamburger menu icon in white, a gold four-point sparkle icon #C9A227, a red-crimson stylised 'T' logo #E8174F centred, a white magnifying-glass search icon at right, and a grey-and-white circular user avatar silhouette at far right. Beneath the bar is the article page on a white background: a small crimson monospace kicker 'Applied AI', a large serif headline, and a serif body text block with the first phrase in bold. The photo is not cropped inside the window; the image box is 1372 by 1684 pixels at x 57.1, y 11.0, w 35.7, h 78.0 and the visible window sits inside it with white margin. Lighting is flat, no overlay or tint.
Slide 20
Price, use and capex are out of equilibrium / How long does usage growth outpace efficiency gains? How much do we spend to chase the frontier? / Explosive / demand growth, / far ahead of / supply / ↑ / X / Inference / efficiency / growing by / 50-100x per / year / ↓ / X / More and/or / less efficient / models? Edge? / Open source? / Asset life? / ? / X / Building the / next frontier / model, every / 6-9 months / ? / Benedict Evans / –– May 2026 / 20
Visuals: Four filled circles of identical size (about 16.2% of slide width, 28.8% of slide height) in a horizontal row: circles 1 to 3 are dark grey #535353 with white serif text, circle 4 is red #EB483F with white serif text. Between circles 1 and 2, 2 and 3, and 3 and 4 sit grey bold sans 'X' multiplication signs in #A7A7A7. Beneath each circle is one symbol in #535353: circle 1 an upward block arrow, circle 2 a downward block arrow, circle 3 a question mark, circle 4 a question mark. No photographs, charts or logos. Flat fills, no shadows, no gradients, no outlines.
Slide 21
History doesn’t repeat, but it rhymes
Press reports: “Usage surge from a new application overwhelms infrastructure and drives new pricing models”
The New York Times
GIVE THE TIMES
Heaviest Users of Phone Data Will Pay More
Share full article
By Matt Richtel
June 2, 2010
They spend hours watching video on their phones, downloading songs, browsing the Web, sending photos to friends and generally using mobile devices as full-fledged computers. They are the data hogs.
On Wednesday, AT&T pulled away the trough. And other wireless carriers could do the same.
AT&T said it would no longer offer an unlimited data plan to new users of iPhones and other smartphones. The decision, industry analysts said, could signal a shift away from an era in which American wireless carriers sought to attract customers with simple, all-you-can-eat pricing plans for data.
The trouble for AT&T was that a fraction of users fewer than 2
The Information
In-depth insights in seconds. Ask Deep Research.
Exclusive
Anthropic Changes Pricing to Bill Firms Based on AI Use as Demand Jumps
Art by Mike Sullivan.
Benedict Evans
–– May 2026
21
Visuals: Two browser-window mockups with three traffic-light dots (red, yellow, green) at top-left of each white card. Left mockup is a screenshot of a New York Times article page: masthead wordmark, hamburger and account icons, the headline in bold italic serif, a 'Share full article' pill with gift icon, a share arrow icon and a bookmark icon, byline, date, and body text cut off at the bottom edge. Right mockup is a screenshot of The Information article page: hamburger icon, masthead, avatar icon, a full-width black banner with a red arrow, a red 'Exclusive' kicker, a headline, and a cut-out illustration. The illustration shows a cyan (#00D8E8) grid background with a coral-orange (#F0A070) paper cut-out of a figure in a dark navy suit whose head is replaced by a coral starburst; a hand from the lower left holds out a green banknote toward the figure's open hand. The cut-out has a white outline and a drop shadow, is full-width within the card and boxed, and is cropped at the bottom edge. A grey (#A6A6A6) solid right-pointing triangle sits between the cards, indicating progression from left to right.
Slide 22
Mobile networks in 2010 = LLMs in 2026?
How do you manage explosive demand with marginal cost and limited capacity? And then what?
Bits = tokens
Marginal cost
Opaque & poorly
aligned with use
cases or value
Equilibrium
Flat-rate capped
bundles align
price, usage &
capacity growth
Wifi/Edge
Now v. next
Supply/demand
imbalance today lets
labs price at ROI
But long-term
pricing power is
unlikely
Benedict Evans
–– May 2026
22
Visuals: Three white circles with dark grey (#545454) outlines about 0.3% of slide width thick, each about 21.7% wide by 38.5% tall, sitting at y 34.3%. The third circle has a red outline (about #E84B3C) instead of grey. Between circles 1 and 2, and between 2 and 3, is a small solid grey (#A6A6A6) right-pointing triangle, about 3% wide and 10% tall, vertically centred on the circles. Circle 1 contains bold heading 'Bits = tokens' followed by 'Marginal cost' and 'Opaque & poorly aligned with use cases or value'. Circle 2 contains bold heading 'Equilibrium' followed by 'Flat-rate capped bundles align price, usage & capacity growth' and 'Wifi/Edge'. Circle 3 contains bold heading 'Now v. next' followed by 'Supply/demand imbalance today lets labs price at ROI' and 'But long-term pricing power is unlikely'. No photographs, logos or icons.
Slide 23
"We see a future where intelligence is a / utility like electricity or water and people / buy it from us on a meter” / Sam Altman / Benedict Evans –– May 2026 / 23
Slide 24
Commodity infra rarely captures value up the stack
Mobile networks are a trillion dollar industry, but all the use-cases and value-capture are built by other people
Global mobile data traffic (EB)
Global telco stocks (MSCI index)
2,000
2,000
1,500
1,500
1,000
1,000
500
500
0
0
2010
2015
2020
2025
2010
2015
2020
2025
Source: Ericsson, MSCI
Benedict Evans
–– May 2026
24
Visuals: Two line charts, both with a smoothed red line and dotted light-grey horizontal gridlines at 500, 1,000, 1,500 and 2,000, and a solid grey x-axis baseline at 0. Left chart: title 'Global mobile data traffic (EB)', y-axis 0 to 2,000 (units EB, exabytes), x-axis 2010 to 2025 with labels at 2010, 2015, 2020, 2025; one series with about values: 2010 about 0, 2015 about 60, 2017 about 130, 2018 about 270, 2020 about 580, 2022 about 1,080, 2024 about 1,480, 2025 about 1,720. No legend; no highlighted points. Right chart: title 'Global telco stocks (MSCI index)', y-axis 0 to 2,000 (index points), x-axis 2010 to 2025 with labels at 2010, 2015, 2020, 2025; one series starting 2012 with about values: 2012 about 1,000, 2013 about 1,230, 2015 about 1,180, 2017 about 1,330, 2018 about 1,200, 2019 about 1,380, 2021 about 1,340, 2022 about 1,200, 2024 about 1,430, 2025 about 1,720. No legend; no highlighted points.
Slide 25
And so far, models do seem to be commodities / For most general and consumer use, models are very similar, and crucially there are no network effects / Selected frontier LLMs by aggregate benchmark score / OpenAI / Anthropic / Google / Meta / Chinese labs / 70 / 60 / 50 / 40 / 30 / 20 / 10 / 0 / Jun 2022 / Jun 2023 / Jun 2024 / Jun 2025 / Jun 2026 / Source: ArtificialAnalysis / Benedict Evans / –– May 2026 / 25
Visuals: Chart: scatter plot titled 'Selected frontier LLMs by aggregate benchmark score'. Y axis: 'aggregate benchmark score' with no unit printed, range 0 to 70, ticks every 10 (0, 10, 20, 30, 40, 50, 60, 70), dotted light grey horizontal gridlines at each tick, solid thin grey baseline at 0. X axis: time from Jun 2022 to Jun 2026, labelled at Jun 2022, Jun 2023, Jun 2024, Jun 2025 and Jun 2026. Series, shown as filled circles of about 1.5% of slide width: OpenAI red #E8473A; Anthropic black #000000; Google dark grey #555555; Meta mid grey #9E9E9E; Chinese labs light grey #D9D9D9. Legend at left, top to bottom: OpenAI, Anthropic, Google, Meta, Chinese labs, each with a small filled dot of its series colour. No values are printed on points; approximate values follow. OpenAI: about Dec 2022 9; about Mar 2023 13; about Nov 2023 14; about Jan 2024 15; about Mar 2024 19; about Apr 2024 24; about Oct 2024 31; about Dec 2024 38; about Jan 2025 41; about Mar 2025 45; about May 2025 48; about Jun 2025 51; about Aug 2025 54; about Sep 2025 57; about Oct 2025 60. Anthropic: about Mar 2023 7.5; about Jun 2023 9; about Nov 2023 9.5; about Jan 2024 18; about Mar 2024 19; about Nov 2024 35; about Dec 2024 39; about Feb 2025 42; about Mar 2025 43; about Jul 2025 50; about Aug 2025 53; about Sep 2025 57.5. Google: about Jan 2023 8.5; about Dec 2023 10; about Feb 2024 12; about Jun 2024 17; about Jul 2024 20; about Oct 2024 30.5; about Dec 2024 35; about Sep 2025 57. Meta: about Mar 2023 7.5; about Jun 2023 9.5 and about 8.5; about Mar 2024 18; about Oct 2024 19; about Sep 2025 52. Chinese labs: about Mar 2023 7.5; about Nov 2023 9; about Jan 2024 9.5 and 12; about Jun 2024 16 and 17; about Oct 2024 19 to 22.5; about Dec 2024 27; about Feb 2025 29.5; about Mar 2025 31 and 34; about Jul 2025 41 to 42.5; about Aug 2025 47 and 50; about Sep 2025 54. Highlighted points: none. Upper-right cluster around Jun 2025 to Oct 2025 is densest.
Slide 26
What will equilibrium look like?
What will you get if you win the capex war?
Software
Capital-light
Network effects
Monopolies
High margin
LLMs
Capital-intensive
No network effects?
Commodity?
Low margin?
Will LLMs have
pricing power?
Can they capture
use-cases & value
further up the
stack?
Benedict Evans –– May 2026 26
Visuals: Three circles with thin dark grey outlines (about #545454, about 0.3% of slide height stroke) filled white, arranged left to right; the first two have dark grey outlines and the third has a red outline (about #E84C3D, same stroke width). Between circle 1 and circle 2 and between circle 2 and circle 3 sit two solid grey right-pointing triangular chevrons (about #A6A6A6), each about 2.5% wide and 6% tall, vertically centred on the circles. Circle 1 contains, centred: 'Software' (bold) then 'Capital-light', 'Network effects', 'Monopolies', 'High margin'. Circle 2 contains, centred: 'LLMs' (bold) then 'Capital-intensive', 'No network effects?', 'Commodity?', 'Low margin?'. Circle 3 contains, centred: 'Will LLMs have / pricing power?' then 'Can they capture / use-cases & value / further up the / stack?'. No photographs, logos or charts.
Slide 27
A provisional thesis / This is all very early, and these might be the wrong answers, but hopefully they’re the right questions / Chat is a / terrible UX / General use / needs ‘apps’ / Labs can’t / build (or / generate) all / the apps / Models are / commodities / and have no / network / effects / Models will / just be infra / Innovation / will move up / the stack / Benedict Evans –– May 2026 / 27
Visuals: Four solid circles in a row, each about 16.2% of slide width and 28.8% of slide height, with white serif text centred inside. Circles 1 to 3 are dark grey #535353; circle 4 at the right is red #EB483F. Three small right-pointing isosceles triangles in light grey #A6A6A6 sit in the gaps between circles, each about 1.9% of width by 6.9% of height, vertically centred on the circles, with no outline and no shadow. No photographs, logos or icons. No chart or table.
Slide 28
Deployment / Benedict Evans –– May 2026 / 28
Slide 29
“Everyone is already using this!” / OpenAI reports 900m+ weekly users (but only 5% are paying) / ChatGPT global weekly active users (m) / 1,000 / 750 / 500 / 250 / 0 / Dec 2022 / Jun 2023 / Dec 2023 / Jun 2024 / Dec 2024 / Jun 2025 / Dec 2025 / Jun 2026 / Source: OpenAI. NB: round numbers reported without precise dates / Benedict Evans / –– May 2026 / 29
Visuals: One line chart, titled 'ChatGPT global weekly active users (m)', with a y-axis from 0 to 1,000 (units: millions of weekly active users; labelled ticks at 0, 250, 500, 750, 1,000) and an x-axis of dates labelled Dec 2022, Jun 2023, Dec 2023, Jun 2024, Dec 2024, Jun 2025, Dec 2025, Jun 2026 (half-year intervals). The chart has no legend because it has a single series, drawn as a smooth red line (about #EE3F35) 2 px wide with round red circular markers at each data point. Values printed on the slide: none; the values below are read from the marker positions and are estimates: Dec 2022 about 0; about Nov 2023 about 100; about Aug 2024 about 200; about Oct 2024 about 300; about Feb 2025 about 400; about Jun 2025 about 700; about Oct 2025 about 800; about Dec 2025 about 900. Gridlines are light grey dotted horizontal lines at 250, 500, 750 and 1,000; the x-axis baseline at 0 is a thin solid grey line. No points are highlighted beyond the markers themselves. The chart ends at the last marker, about Dec 2025, with no further data to Jun 2026.
Slide 30
Consumer use is a mile wide and an inch deep
Less than 1,000 prompts in a year means it isn’t a daily essential for at least 80% of users, so far
Range of user-reported total ChatGPT messages sent in 2025, by cohort
Highest observed
Lowest observed
5,000
4,000
3,000
2,000
1,000
0
Top 5%
Top 10%
Top 15%
Top 20%
Source: OpenAI ‘Wrapped’
Benedict Evans
–– May 2026
30
Visuals: Line chart with markers. Title above plot: 'Range of user-reported total ChatGPT messages sent in 2025, by cohort'. Y-axis: messages sent in 2025 (count), linear scale from 0 to 5,000 with dotted horizontal gridlines every 1,000 and labelled ticks at 0, 1,000, 2,000, 3,000, 4,000, 5,000. X-axis: categories Top 5%, Top 10%, Top 15%, Top 20% (cohort percentile), with a solid grey baseline at 0. Series 1 'Highest observed', dark grey line with dark grey circular markers, values about 4,350 (Top 5%), about 2,600 (Top 10%), about 1,800 (Top 15%), about 1,450 (Top 20%). Series 2 'Lowest observed', red line with red circular markers, values about 2,900 (Top 5%), about 2,000 (Top 10%), about 1,500 (Top 15%), about 1,200 (Top 20%). Lines are smoothed curves. Legend at upper left of the plot: dark grey dot-line marker 'Highest observed' above red dot-line marker 'Lowest observed'. No highlighted points beyond the markers. No photographs or logos.
Slide 31
Experimentation versus daily use / Glass half-empty/half-full - lots of people using this sometimes, but fewer make it a daily habit / Consumer generative AI chatbot use in the USA / Weekly / Daily / 60% / 50% / 40% / 30% / 20% / 10% / 0% / US adults / Bick et al, Nov 2025 / Aged 13-17 / Pew, October 2025 / Aged 14-29 / Gallup, March 2026 / Source: Companies. Dates indicate when research was conducted / Benedict Evans / –– May 2026 / 31
Visuals: Chart: vertical stacked column chart, titled Consumer generative AI chatbot use in the USA. Y axis: percentage of respondents, 0% to 60%, gridlines and labels every 10%, dotted light grey gridlines. X axis: three categories with two-line labels: US adults / Bick et al, Nov 2025; Aged 13-17 / Pew, October 2025; Aged 14-29 / Gallup, March 2026. Two stacked series, bottom to top: Daily (red #EB483F) and Weekly (dark grey #535353). No values are printed on the bars, so values are estimates. US adults: Daily about 13%, Weekly about 35%, total about 48%. Aged 13-17: Daily about 26%, Weekly about 18%, total about 44%. Aged 14-29: Daily about 22%, Weekly about 29%, total about 51%. Legend at top left of the chart in order Weekly (dark grey square) above Daily (red square), with labels in grey sans-serif. No highlighted points. Thin white separators between stacked segments. Bars are about 10% of slide width each, evenly spaced across the plot at about x 28%, 53% and 78%. Baseline is a thin grey horizontal axis line at 0%. No photographs, logos or icons.
Slide 32
The ‘capacity gap’ - usage versus potential
The same for work - rapid growth, but how do we go from ‘I used it last week’ to daily essential?
US workplace AI use by industry, June 2023 to December 2025
Any
Weeky
Daily
100%
75%
50%
25%
0%
Tech
Finance
Professional
services
Healthcare
Retail
Manufacturing
Government
Source: Gallup
Benedict Evans
–– May 2026
32
Visuals: Stacked area chart (drawn as filled bands per industry, each band running from a left edge to a right edge) titled US workplace AI use by industry, June 2023 to December 2025. Y axis: percentage of respondents, 0% to 100%, gridlines and labels at 0%, 25%, 50%, 75%, 100%. X axis: seven industries, Tech, Finance, Professional services, Healthcare, Retail, Manufacturing, Government. Three stacked series from bottom to top: Daily (red #EB483F), Weeky (dark grey #535353), Any (light grey #A7A7A7). No values are printed; estimates from the left and right edge of each band are given as about values, in the order Daily / Weekly top / Any top. Tech left: about 7 / 20 / 38; right: about 31 / 57 / 77. Finance left: about 4 / 10 / 23; right: about 19 / 40 / 64. Professional services left: about 3 / 9 / 26; right: about 16 / 36 / 62. Healthcare left: about 6 / 11 / 17; right: about 13 / 25 / 41. Retail left: about 8 / 18 / 26; right: about 10 / 19 / 33. Manufacturing left: about 6 / 9 / 18; right: about 9 / 20 / 41. Government left: about 2 / 8 / 18; right: about 8 / 21 / 42. Legend at top-left of plot: Any, Weeky, Daily with square swatches in the same colours. No highlighted points. Dotted light grey horizontal gridlines at 25, 50, 75 and 100 percent; solid thin grey baseline at 0%.
Slide 33
Imagine you were an / accountant seeing the first / software spreadsheets / Now imagine you were a / lawyer: “very cool, but…” / Source: Computer History Museum / Benedict Evans / –– August 2026 / 33
Visuals: One black-and-white photograph occupying the right half, full-bleed (x 46.8% to 100%, y 0% to 100%), cropped at the right and bottom edges. Subject: an Apple II personal computer (beige case with a rainbow-style 'apple II' badge on the lower front panel, detachable keyboard, separate beige CRT monitor) displaying a spreadsheet on its screen, with the header 'FINANCIAL HIGHLIGHT', 'ABC COMPUTER, INC', 'FOR THE FISCAL YEARS ENDING SEPTEMBER', 'DOLLARS AND SHARES IN THOUSANDS', column headings '1982' and '1983', and row labels including NET SALES, NET INCOME, EARNINGS PER SHARE, PRE-TAX RETURN ON NET SALE, EFFECTIVE TAX RATE, RETURN ON NET SALE, CASH AND CASH EQUIVALENTS and ACCOUNTS RECEIVABLE, with numeric values in the two year columns. At the far right edge, partly cropped, are two stacked Disk II floppy drives labelled '1' and '2' and 'disk II'. Composition: computer shown three-quarter view from the front-left, centred slightly right of the photo, on a dark grey tabletop. Lighting: soft studio light from above-left; background is a dark grey gradient, darkest at top-right and lighter behind the monitor. Dominant colours: greyscale only, with off-white/light grey hardware and near-black screen. No overlay or tint.
Slide 34
“What’s this for?” Well, what’s the pattern? / How do we always deploy new technologies? / Absorb / Doing the old things better with the new technology / Innovate? / Things that are only possible with the new technology / Disrupt? / Redefine the question / Benedict Evans –– May 2026 34
Visuals: Diagram: three white circles with thin dark grey outlines (#545454, about 0.3% of slide width stroke) arranged left to right, the third circle outlined in red. Circle 1 contains the bold heading 'Absorb' and body text 'Doing the old things better with the new technology'. Circle 2 contains 'Innovate?' and 'Things that are only possible with the new technology'. Circle 3 (red outline, about #E74C3C) contains 'Disrupt?' and 'Redefine the question'. Between circle 1 and 2, and between circle 2 and 3, is a solid grey right-pointing triangle (chevron) in #A6A6A6 connecting them in sequence. No photographs, logos or icons; no chart or table.
Slide 35
What works first?
First, automate the obvious use cases - innovation takes longer
Impact of AI deployment (US CFOs surveyed in December 2025)
Results in 2025
Expected in 2026
4%
Easy to deploy, hard to measure
3%
Hard to deploy, easy to measure
2%
1%
0%
Productivity
Better insights &
decision-making
Better customer
service
Cost-saving
New
revenue
Source: Atlanta Fed: Baslandze et al
Benedict Evans
–– May 2026
35
Visuals: Chart: grouped vertical bar chart titled 'Impact of AI deployment (US CFOs surveyed in December 2025)'. Y-axis: percentage, 0% to 4%, gridlines at every 1% (dotted light grey), labels 0%, 1%, 2%, 3%, 4%. X-axis: five categories, labelled Productivity, Better insights & decision-making, Better customer service, Cost-saving, New revenue. Two series: 'Results in 2025' in red #EB483F and 'Expected in 2026' in dark grey #535353. Values: Productivity 2025 about 1.8% (printed value not shown), 2026 about 3.0%; Better insights & decision-making 2025 about 1.9%, 2026 about 3.3%; Better customer service 2025 about 0.8%, 2026 about 2.1%; Cost-saving 2025 about 0.1%, 2026 no bar shown; New revenue 2025 about 0.5%, 2026 about 1.3%. No values are printed on the bars; all values are estimates. Legend at top left of the chart with red square for 'Results in 2025' and dark grey square for 'Expected in 2026'. Two unboxed annotations in the plot: 'Easy to deploy, hard to measure' placed above the Productivity and Better insights bars, and 'Hard to deploy, easy to measure' placed above the Cost-saving and New revenue area. No highlighted points.
Slide 36
What’s working first? / Where is it easy and obvious to use generative AI? / Analytics & / productivity / Marketing / Customer / support / Back-office / processes / Coding! / Benedict Evans / –– May 2026 / 36
Visuals: Four solid filled circles, identical size (about 16.2% of slide width, 28.8% of slide height, i.e. a circle of roughly 325 by 325 px on a 2000 by 1125 canvas). Circles 1 to 3 are dark grey #535353 with white serif labels; circle 4 is red #EB483F with the white label 'Coding!'. No chart, photo, logo or icon. No connecting lines or arrows between circles.
Slide 37
“ChatGPT, make me a chart of product-market fit”
A generational change in software development
Annualised enterprise AI spending, March 2026 ($bn)
4
3
2
1
0
Coding
Legal
Support
Medical &
Search
Text
Real estate
Finance
health admin
Source: a16z
Benedict Evans
–– May 2026
37
Visuals: Vertical bar chart titled 'Annualised enterprise AI spending, March 2026 ($bn)'. Y-axis: labelled 0, 1, 2, 3, 4 with units $bn implied by the title, range 0 to 4, light dotted horizontal gridlines at each integer. X-axis: categories Coding, Legal, Support, Medical & health admin, Search, Text, Real estate, Finance, baseline solid thin grey line at 0. Series values with no printed data labels, so estimates: Coding about 3.0 (highlighted red bar), Legal about 0.5, Support about 0.4, Medical & health admin about 0.35, Search about 0.25, Text about 0.15, Real estate about 0.15, Finance about 0.05. Bars are dark grey #515151 except Coding which is red #EB483F and is the only highlighted point. No legend. Bars are evenly spaced, approximately 60 px wide each at slide width of 2000 px, with rectangular square corners.
Slide 38
“We’re seeing more and more examples / where one or two people are building / something in a week that would have / previously taken dozens of people / months” / Mark Zuckerberg / Benedict Evans –– May 2026 / 38
Slide 39
Create screens like / this in minutes . . . / The Software Betting Company Of New York / New Client Information List / Account #: / Billing Rate: / Telephone: / Company: Entranco Systems Corp. / Contact: Tony Infranco / Title: President / Address: 55 Park Avenue / State: NY / Zip: / City: New York / Referred By: / New Account's or NO: / Bank Code: / and Screen Sculptor™ / writes the program! / In Basic and Turbo Pascal / It's that easy! The same Screen Sculptor package generates programs in IBM Basic, Turbo Pascal, and IBM Pascal. / Now, anyone can have attractive, intelligent input screens and sophisticated data entry routines in minutes. / Move pieces of the screen around, select / ... from a menu, draw lines / And more!—Specify variable names, data types, acceptable data ranges, pictures for edit checking, etc. / Screen Sculptor then generates actual program source code based on your screen design. Use it as is or modify it. / And It's only $125 / Requires an IBM PC, XT, PCjr, PC AT or 100% compatible, 128K, DOS, one 320K disk drive and any 80 column display. / NEW / STOP / CODING / with QUICKCODE PLUS™ / Let's face it. Coding is a waste of time. Why should you have to work hard just to get dBASE to do what you want? / You shouldn't. And now you don't. / Let QUICKCODE PLUS do it for you. QUICKCODE PLUS is a complete application generator which automatically writes your dBASE programs. Design any kind of screen using the built-in Form Editor. Then, use lightning-fast 1-2-3™ style commands to tell QUICKCODE PLUS all about your application (files, fields, computations, menus, etc.). / After that, just sit back and watch as QUICKCODE PLUS produces some of the best dBASE programs you've ever seen. Modular, standardized, highly commented code which you can easily modify. / Benedict Evans / –– May 2026 / 39
Visuals: Left: a full-height photograph-style scan of a 1980s advertisement on saturated yellow, with a tilted, angled computer monitor illustration showing a blue-screen data entry form with green input fields, labelled Account #, Billing Rate, Telephone, Company, Contact, Title, Address, State, Zip, City, Referred By, New Account's or NO and Bank Code. The monitor has a black bezel and is tilted about 8 degrees; it is set on the yellow field with a soft shadow. To its right is a vertical strip of printed program source code, alternating green and white horizontal bands, angled slightly, running from top to about 72% of the height. Right: a stop-sign shape in red #E8452C with a white inner border and a thin red outer outline, containing the white letters STOP and CODING, set above a small red tilted NEW tag at lower left. Below the sign, the red headline with QUICKCODE PLUS. No logos or icons. Overall composition is a scanned print with no cropping on the left; the right ad is set on white with no tint.
Slide 40
Writing code isn’t the hard part
What should the code be doing, and where does it fit into the market? What gets bundled and unbundled?
Improvised
workflows
Email, Excel,
shared folders…
Plus AI?
Horizontal
‘Big iron’ systems
of record - ERP,
CRM, HCM etc
Vertical
Large companies
use hundreds of
SaaS, on-prem and
custom apps
Benedict Evans
–– May 2026
40
Visuals: Three circles and two double-headed block arrows. Left circle: solid filled circle, fill #535353, diameter about 22.1% of slide width, containing white text 'Horizontal' over '‘Big iron’ systems of record - ERP, CRM, HCM etc'. Centre circle: outlined dotted circle with a dark grey (#535353) dotted stroke of about 0.3% slide height, no fill (transparent over #F1F1F1), containing grey text 'Improvised workflows' over 'Email, Excel, shared folders…' over 'Plus AI?'. Right circle: solid filled circle, fill #EB483F (red), same size as left circle, containing white text 'Vertical' over 'Large companies use hundreds of SaaS, on-prem and custom apps'. Two arrows: each is a double-headed horizontal block arrow with fill #A7A7A7 and no outline, about 5.7% wide and 9.3% tall; the left arrow sits between the left circle and centre circle, the right arrow between the centre circle and right circle; they are vertically centred on the circles. No photographs, icons or logos. Flat design, no shadows.
Slide 41
“For half of my jobs I tell clients who use / Excel to switch to a database, and the / other half are the other way around” / Anon / Benedict Evans –– May 2026 / 41
Slide 42
What does AI do to software? More! But then what?
The best answer to this question might be “BREATHE”
Coding is
much faster &
cheaper
New margin
structures &
competitive
threats
Chatbots
unbundle some
use-cases
Do models
replace
software?
Or make more
software?
Benedict Evans
–– May 2026
42
Visuals: Four solid circles in a row, no icons, photographs or charts. Circles 1 to 3 are dark grey #535353 with white serif text centred inside: “Coding is much faster & cheaper”, “New margin structures & competitive threats”, “Chatbots unbundle some use-cases”. Circle 4, on the right, is red #EB483F with white serif text centred inside: “Do models replace software?” above “Or make more software?”. Each circle is a flat fill with no outline, no shadow and no gradient, and all four are the same size and sit at the same vertical position.
Slide 43
“People don’t know what they want until / you show it to them” / “You’ve got to start with the experience / and work backwards to the technology” / Steve Jobs / Benedict Evans –– May 2026 / 43
Slide 44
How do you build ‘AI software’?
How do you turn an amazing raw technology into something people can use?
“Blank screen”
“Jagged frontier”
Use cases!
Tooling, GUI,
process, GTM,
proprietary data,
workflows
Does the model
go at the top of
the stack or the
bottom?
Benedict Evans
–– May 2026
44
Visuals: Diagram: three filled circles of equal size (each about 22.1% of slide width and 39.3% of slide height) in a horizontal row, left to right. Circle 1 is dark grey #535353 and contains the two quotations “Blank screen” and “Jagged frontier” in white serif type. Circle 2 is dark grey #535353 and contains the heading Use cases! followed by the list Tooling, GUI, process, GTM, proprietary data, workflows in white serif type. Circle 3 is red #EB483F and contains the question Does the model go at the top of the stack or the bottom? in white serif type. Between each pair of circles is a small right-pointing solid triangle (chevron arrow) in mid grey #A6A6A6, about 2% of slide width and 6.8% of slide height, vertically centred on the circles, showing flow from circle 1 to circle 2 and from circle 2 to circle 3. No photographs, logos or charts.
Slides 45 to 79 continue in the full text file.
Download this deck
The hosted PDF of every library deck is free for readers of the SlideDeck Co newsletter. Join with your email and the viewer and download appear here.
Building a deck of your own? The SlideDeck Co Standard Deck is a slide library for business presentations: reviews, updates and plans.







