This deck is the State of European Tech 2025 keynote, a roadmap to Europe's first trillion-euro tech company. It opens with a title slide, then sets the scene under the heading Europe at a crossroads. This section frames urgent change, argues that now is the best time to be a founder, and describes the friction and global race Europe faces. The middle section is a data review in three parts: the size of the ecosystem and its growth, talent flows and founder sentiment, and how European companies compete on the global stage. A recurring device is a provocation slide, Let's not pat ourselves on the back too soon, which leads into a sequence of capital charts comparing Europe with the United States. These cover total capital invested, bootstrapping the future, the bar for companies reaching $10B+, and the share of firms that go on to raise funding. Later sections turn to policy, presenting a Europe-wide framework of Fix the Friction, Empower Talent, Fund the Future, and Champion Risk.
Slides worth studying
- Slide 2: A two-column grid of short phrases in matching tiles, with the key word in each bold, sets up the argument at a glance over a full-bleed photo.
- Slide 6: Logos are grouped under two labelled headings, European champions and competing head-to-head, so the comparison reads in one view.
- Slide 12: Three equal cards each carry a large number and a single line of context, a clean way to present a stat triad.
Details
- Company: Atomico
- Year: 2025
- Type: Keynote
- Industry: Venture capital
- Pages: 20
The hosted copy of this deck is being prepared. Newsletter readers will find the download here.
Review score: 8 out of 10, Strong
Presentation quality, judged with the SlideDeck Co review heuristic. Ask, evidence and idea merit are not rated here.
The keynote has a clear arc in 20 pages: the ecosystem numbers on slide 3, the talent case on 4 and 5, the turn on slide 7 (let's not pat ourselves on the back), the capital gap on 8 to 11, the fix on 16 to 18 and a three-line close on 19. Titles are claims (Capital not scaling as fast as talent; What got us to $100B, won't get us to $1T) and the tile pages 3, 4, 5 and 12 pair one large number with a comparison figure underneath so each stat has context. The dark teal identity is consistent throughout. Improvements left: the bar charts on 8, 9 and 10 carry no value labels except the last bar, the axis text on 10 and 11 is too small for a stage, and slide 13 is a wall of 50 small logos that reads as texture.
Worth keeping: Keep the claim titles, the number-plus-comparison tiles, the three-line closing page and the consistent palette.
Most useful repair: Put values on every bar on slides 8 to 11, and cut the Mighty 50 page to a dozen names the talk mentions.
What would change the score: Labelled charts and a lighter logo page would make this a 9; the structure already does the work.
Confidence high. 20 of 20 pages inspected on contact sheets, 4 at readable size. Reviewed 2026-11-11. Model-assisted review (claude-fable-5-1, in session).
Full text of the slides (20 slides)
Every slide's words and a description of its charts and images, so the deck can be searched and rebuilt. Also available as Markdown.
Slide 1
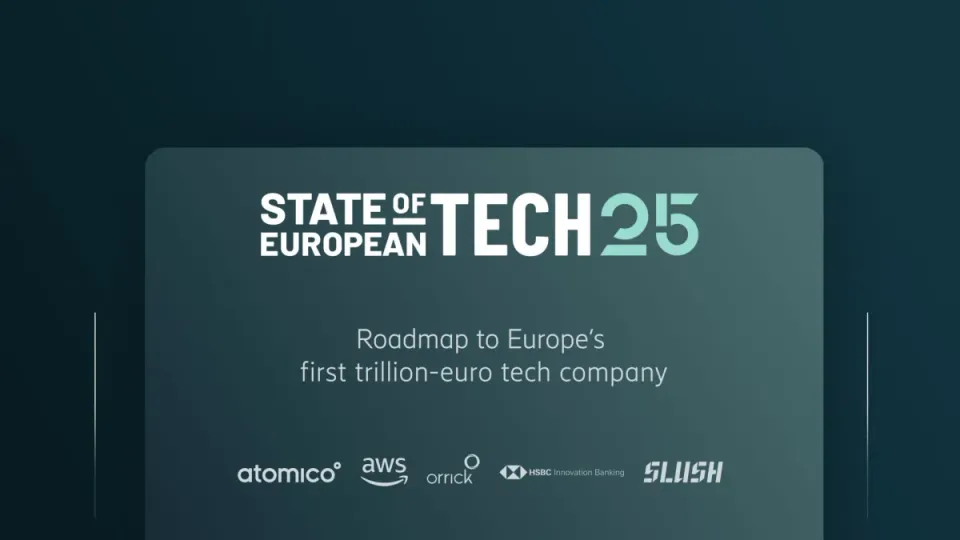
STATE OF EUROPEAN TECH 25
Roadmap to Europe's
first trillion-euro tech company
atomico
aws
orrick
HSBC Innovation Banking
SLUSH
Visuals: Two thin vertical white hairlines, one at the left (about x 10%, from y 58% to y 96%) and one at the right (about x 90%, from y 58% to y 96%), each about 0.2% wide and light grey-white. A large rounded rectangle panel with a teal-grey gradient (lighter top-right #4A6C6A to darker bottom-left #22393F), corner radius about 3% of slide width, with a soft dark drop shadow, spanning x 15% to 85% and from y 27% down past the bottom edge. Logos in a single row: atomico wordmark in white (x 25%, y 84%, w 10%, h 4%), aws smile logo in white (x 37%, y 83%, w 5%, h 6%), orrick wordmark with circular mark in white (x 44%, y 83%, w 5.5%, h 6%), HSBC Innovation Banking logo with white hexagon mark and small white text (x 52%, y 84%, w 13%, h 3.5%), SLUSH italic bold wordmark in light grey-white (x 67%, y 84%, w 8%, h 4%). The 'STATE OF EUROPEAN TECH 25' logo is white bold geometric sans lettering with the '25' in mint #9ADBD0 (x 27%, y 35%, w 46%, h 12%).
Slide 2
Europe at a crossroads
Awakening to the need for urgent change
Relentless race for global dominance
Best time to be a founder
Friction exacerbated
Once-in-a-century opportunity
Trillions of unrealised GDP at risk
Building on our own terms
Agency and optionality threatened
STATE OF EUROPEAN TECH25
Visuals: Full-bleed photograph of a sterile, modern hospital-style corridor split into two contrasting halves. Left half: a woman in pale blue scrubs stands beside a tall transparent cylindrical capsule or scanner with a white base and ring, lit by bright overhead panels and a cool teal-white glow; a second capsule sits behind her. Right half: a warm, dim, yellow-olive corridor with two patients lying on hospital gurneys, a nurse in white and blue uniform holding a clipboard, a doctor in a dark jacket, an IV stand, a wall-mounted monitor and medical equipment. Lighting is cool and bright on the left and warm and murky on the right. Composition is full-frame with the subjects in the lower and middle areas. The photograph is not cropped in a boxed frame; it covers the whole slide. Dominant colours: teal, white and pale mint on the left; olive, ochre and dark navy on the right. A soft translucent tint overlays the image. Logo: STATE OF EUROPEAN TECH25 wordmark in white, bottom-right corner.
Slide 3
Vibrant ecosystem / $3.8T / total ecosystem value / +14% / YoY / 4.6M / tech employees / +4% / YoY / 27K+ / new founders / +36% / YoY / Source: / atomico powered by revelio labs dealroom.co crunchbase / Notes: Data is as of 30 September 2025. Excludes the following: biotech.
Visuals: Three stacked-value stat cards, not a chart. Card 1: large figure $3.8T, label total ecosystem value, accent bar, +14%, YoY. Card 2: large figure 4.6M, label tech employees, accent bar, +4%, YoY. Card 3: large figure 27K+, label new founders, accent bar, +36%, YoY. Each card is a rounded rectangle with a diagonal gradient fill from lighter teal-grey #36615F at top-right to deeper slate #1B3F45 at bottom-left, no visible shadow. Between cards are two thin vertical white lines (about 2 px wide, 42% of slide height) that fade toward their ends. Each accent bar is a pale mint rounded pill about 6.9% of slide width by 0.7% of slide height in #A1D2BF. Logos at bottom-left, in order: atomico wordmark in white with a small mint circle over the o, followed by the word powered by in white, then the revelio labs wordmark in white, then a dealroom.co logo (white d-icon in a white-outlined square followed by the dealroom.co wordmark), then the crunchbase wordmark in white. The State of European Tech 25 logo at top-right is a white two-line wordmark: STATE OF over EUROPEAN in a condensed sans, then TECH25 in a bolder condensed sans with the 25 stylised. No photographs or illustrations.
Slide 4
All the raw ingredients are here / STATE OF EUROPEAN TECH 25 / Optimism returns / Hiring eases off / Most founders stay / 42% / say it’s more attractive to / become a founder in Europe / than 12 months ago / STATE OF EUROPEAN TECH Survey / 25% / in 2024 / 40% / find it easier to recruit and / retain top-tier talent than 12 / months ago / STATE OF EUROPEAN TECH Survey / 33% / in 2024 / 82% / of European founders start / their company in Europe / 80% / in 2016 / Source: / STATE OF EUROPEAN TECH Survey / atomico / powered by / revelio labs / Notes: / Survey data based on founder, co-founder, operator at a startup or scaleup respondents only. Founder origin is determined by their first country of employment. Data is as of 30 September 2025.
Visuals: None photographic. Three identical rounded rectangular cards (gradient teal panels) each carry one stacked data block: a large mint percentage, a white sentence, a short mint horizontal bar, then a large white percentage and a small white year. Card 1: 42% (say it’s more attractive to become a founder in Europe than 12 months ago) / 25% in 2024. Card 2: 40% (find it easier to recruit and retain top-tier talent than 12 months ago) / 33% in 2024. Card 3: 82% (of European founders start their company in Europe) / 80% in 2016. No chart axes or legend. Small circular State of European Tech Survey badges overlap the bottom-left corner of cards 1 and 2. The footer shows the State of European Tech, atomico and revelio labs logos.
Slide 5
Europe’s gravitational pull on talent
State of European Tech 25
Mission-led founders
Talent on rocket ships
51%
founders say they feel a
sense of mission building
in Europe
34%
founders say they
would if the conditions
were right
47%
of tech employees work
for a VC-backed company
38%
in 2016
Source:
powered by
Notes: Data is as of 30 September 2025.
Visuals: Two rounded rectangle cards with a subtle diagonal gradient from teal-grey #3A6664 at top-left to dark teal #1F4550 at bottom-right, no visible borders. Left card shows 51% and 34% stacked; right card shows 47%, a short mint accent bar, and 38% with 'in 2016'. A thin white vertical divider line runs between the cards from about 31% to 71% of slide height. A circular badge with the State of European Tech Survey logo overlaps the left edge of the left card at about 20% x and 52% y. Logos along the bottom are the atomico powered by revelio labs, dealroom.co and crunchbase wordmarks in white. The top-right State of European Tech 25 logo is white.
Slide 6
Competing on the global stage / STATE OF EUROPEAN TECH25 / 413 / European $1B+ / companies / 1,200+ / with $100M+ / revenue or / $1B+ value / European champions… / synthesia / Lovable / cusp.ai / Framer / IIElevenLabs / …competing head-to-head on the global stage / HeyGen / replit / L I L A / Webflow / AssemblyAI
Visuals: Ten logo tiles and one stats banner, no charts. Row one, labelled European champions…, has five light-teal gradient tiles (top #A1D2BF fading to slate #4A7A7A at the bottom, corner radius about 1%) holding the logos synthesia (blue #2F5BD3 icon with navy #142A4A wordmark), Lovable (multicolour orange-to-purple heart icon with black wordmark), cusp.ai (black three-lobed icon with black wordmark), Framer (black angular icon with black wordmark), and IIElevenLabs (black wordmark with a bar glyph). Row two, labelled …competing head-to-head on the global stage, has five dark-teal tiles (about #1F4A4F at top-left to #0E2C32 at bottom-right, subtle gradient, same corner radius) holding white logos HeyGen (white wordmark with multicolour pinwheel glyph), replit (white monospace wordmark with orange #F26207 blocks icon), LILA (spaced white letters L I L A), Webflow (white W glyph with wordmark), and AssemblyAI (blue #2338C9 chevron glyph with white wordmark). The banner is a teal gradient rectangle from #3A6F6F at top-left to #008C8C at bottom-right holding the figures 413 and 1,200+ and their captions.
Slide 7
Let’s not pat ourselves on the
back too soon
Visuals: Photograph, full-bleed, not cropped at the frame edges. Left half: a golden-green wheat field in low late-sun light, receding to a horizon at about 46% of slide height, with three white wind turbines on the left (tall one at about x 2 to 9%, y 24 to 46%; middle one at about x 16 to 20%, y 30 to 46%; small distant one at about x 19 to 22%, y 39 to 46%). Centre-left at about x 34 to 42%, y 37 to 42%, a dark grey quadcopter drone with four rotors and red accents hovers over the field. A man in a grey short-sleeved shirt and brown trousers stands in the wheat at about x 23 to 27%, y 48 to 69%, looking down at a glowing blue tablet held in both hands at about x 26 to 30%, y 51 to 58%. Right half: a flat, desaturated grey-brown ploughed field with stubble and furrows, under an overcast blue-grey sky; a red-brown vintage tractor with a trailed implement sits at about x 53 to 67%, y 44 to 58%, and a strip of dark green field runs along the right horizon at about x 75 to 100%, y 46 to 52%. Lighting: warm low sun on the left, flat diffuse light on the right. Dominant colours: wheat yellow-green #8A9A3C and gold #C9A24A on the left, slate grey #6E7A82 and stone brown #8C7F6E on the right, sky #B9C4C9. Overlay: the right half is cooler and slightly desaturated; the dark panel is the only overlay. Full-bleed, no border.
Slide 8
Investment levels have been stagnant / Total capital invested ($B) in Europe, 2016 to 2025 / STATE OF EUROPEAN TECH25 / $44B / 2014 / 2015 / 2016 / 2017 / 2018 / 2019 / 2020 / 2021 / 2022 / 2023 / 2024 / 2025 / Source: / atomico / powered by / dealroom.co / crunchbase / Notes: Data is as of 30 September 2025. Full year 2025 extrapolated based on year to date data. Excludes the following: biotech, debt, lending capital, and grants.
Visuals: Vertical bar chart with 12 visible bars plus a partly cropped bar at the far left edge (probably 2013, year label not visible). Chart title: none printed; subtitle reads Total capital invested ($B) in Europe, 2016 to 2025. Y axis: no axis line, tick labels or units shown beyond the $B in the subtitle; the value axis range is not printed. X axis: years 2014 to 2025 printed under each bar in Barlow Medium, mint #A7D9CF. Labelled values: only 2025 carries a value, $44B, printed above its bar in thin mint type. Other bars carry no printed values; estimates from bar heights against the 2025 bar (about $6B per 60 px): partial left bar about $6B; 2014 about $9B; 2015 about $12B; 2016 about $15B; 2017 about $21B; 2018 about $27B; 2019 about $34B; 2020 about $34B; 2021 about $96B (tallest bar); 2022 about $76B; 2023 about $43B; 2024 about $41B; 2025 $44B. Legend: none. Highlighted points: the 2021 bar is the tallest and the 2025 bar carries the only printed value. Bars are rounded-top rectangles with a vertical gradient from pale mint #A7D9CF at the top to dark teal #3E6E70 at the base, sitting on a thin mint baseline. Source logos (atomico wordmark with powered by, dealroom.co and crunchbase) sit bottom-left, white, not cropped. The State of European Tech 25 logo is white, top-right. Photograph or illustration: none.
Slide 9
We are bootstrapping our future
Total capital invested ($B) in Europe and United States, 2016 to 2025
United States
Europe
$238B
Capital invested ($B)
$141B
$44B
$108B
2014
2015
2016
2017
2018
2019
2020
2021
2022
2023
2024
2025
Source: powered by
Notes: Data is as of 30 September 2025. Full year 2025 extrapolated based on year to date data. Excludes the following: biotech, debt, lending capital, and grants.
Visuals: Vertical grouped bar chart titled by the subtitle 'Total capital invested ($B) in Europe and United States, 2016 to 2025'. Horizontal axis: calendar years 2014 to 2025 (a partial bar for 2013 is cut off at the left edge), one labelled tick per year. Vertical axis: capital invested in $B, no tick scale printed; the axis label 'Capital invested ($B)' runs vertically on the right. Two series per year: United States (dark teal gradient bars, left of each pair) and Europe (pale mint gradient bars, right of each pair). Printed values: United States 2025 $238B (label above bar), 2024 $141B, 2023 $108B. Europe 2023 $44B is printed in the text layer. Other bars carry no printed value; estimated relative heights: United States 2014 about 11, 2015 about 15, 2016 about 12, 2017 about 12, 2018 about 19, 2019 about 20, 2020 about 22, 2021 about 53 (tallest, reaching the top area of the chart), 2022 about 34, 2023 about 21, 2024 about 27, 2025 about 46 percent of slide height. Europe bars, estimated heights: 2014 about 2, 2015 about 2.5, 2016 about 3, 2017 about 4, 2018 about 5, 2019 about 7, 2020 about 7, 2021 about 19, 2022 about 15, 2023 about 9, 2024 about 8, 2025 about 9 percent of slide height. Legend: two square swatches with gradient fill, dark teal swatch labelled United States at upper-left of legend and pale mint swatch labelled Europe at right, centred above the 2016 to 2021 bars. Highlighted points: the 2021 United States bar is the tallest bar; the 2025 United States bar is labelled with the highest printed value. Logos at the footer: atomico wordmark with 'powered by', dealroom.co logo, crunchbase wordmark. Bars have rounded top corners and sit on a thin light baseline.
Slide 10
The bar keeps being raised / United States / Europe / 206 / 48 / 39 / 10 / 23 / 5 / 8 / 0 / # of companies / $10B+ / $50B+ / $100B+ / $1T+ / Source: / powered by / Notes: / Data is as of 31 October 2025.
Visuals: One grouped vertical bar chart with no chart title. Y-axis: rotated label '# of companies' in thin sans type, no tick marks or numeric scale printed, so bar heights are proportional only. X-axis: categories $10B+, $50B+, $100B+, $1T+, with a thin light horizontal baseline spanning about x 16.5% to 84%. Series United States (dark teal bars, left of each pair): $10B+ 206, $50B+ 39, $100B+ 23, $1T+ 8. Series Europe (pale mint bars, right of each pair): $10B+ 48, $50B+ 10, $100B+ 5, $1T+ 0. Every value is printed above its bar. Legend centred at top of chart: dark teal square with 'United States' and pale mint square with 'Europe'. No highlighted points. Bars have rounded top corners and a vertical gradient from lighter at the top to darker at the base. Logos: State of European Tech 25 logo top-right; atomico wordmark and dealroom.co logo in the source line.
Slide 11
Capital not scaling as fast as talent
State of European Tech25
Share of companies (%) that go on to raise funding
United States
Europe
44%
38%
% of companies
3.7%
1.3%
Any funding
$15M+
$50M+
Source:
powered by
Notes: Data is as of 30 September 2025. Only includes companies founded in 2016.
Visuals: Grouped vertical bar chart. Title: none printed on the chart itself; the slide headline and subtitle serve as its title. Y-axis: labelled '% of companies' (rotated 90 degrees, reading bottom to top, Barlow Thin, light mint #A7D9CF); no tick labels or numeric scale are printed, so the axis range is not shown; bars are scaled to their printed values. X-axis: three categories, 'Any funding', '$15M+', '$50M+', printed below a thin horizontal baseline in light mint text. Series 1, United States (dark slate-teal bars): Any funding 44%, $15M+ about 13% (no value printed; estimated from bar height), $50M+ 3.7%. Series 2, Europe (pale mint bars): Any funding 38%, $15M+ about 7% (no value printed; estimated), $50M+ 1.3%. Legend: top-right of the plot area, two square swatches with labels 'United States' (dark slate swatch) and 'Europe' (mint swatch). No highlighted points. Value labels sit above each bar in thin mint numerals. Baseline: thin off-white horizontal line across the plot width at about 81% of slide height. Logos in source line: atomico (wordmark with small circle over the o), revelio labs, dealroom.co (white square icon with a D-shaped mark plus wordmark), crunchbase (wordmark). All are white on the dark background, unboxed except the dealroom icon, which sits on a white square.
Slide 12
What got us to $100B, won’t get us to $1T / STATE OF EUROPEAN TECH 25 / Capital / 0.01% / of European pension AUM / gets invested in VC annually / 3x / higher in the US / Procurement / 9% / of public procurement / goes to innovation / 20% / equivalent in the US / IT Spend / $2T / spent by European / corporates and / governments on IT / mostly going to US / vendors / Source: / atomico / INVEST EUROPE / PPMi / dealroom.co / Notes: / Data is as of 30 September 2025.
Visuals: Three rounded rectangular cards with a subtle lighter-to-darker teal gradient (lighter at top-left, around #3D6E6E, darkening to around #1A4348 at bottom-right), each containing a large mint numeral or figure, a white statement, a short mint horizontal rule and a secondary white figure or caption. Two thin white vertical divider lines, about 0.3% wide and 39% tall, sit between the cards, fading toward their bottoms. Logos in the source row: atomico (wordmark with a small circle over the o), INVEST EUROPE (stacked white wordmark), PPMi (bold white wordmark) and dealroom.co (small square icon with bars and a D, followed by lowercase wordmark). No charts, photographs or icons beyond these logos.
Slide 13
Europe’s Mighty 50 shining bright
STATE OF EUROPEAN TECH25
Horizontal Infra & Software
Health
Transportation
Fintech
Other
Source: atomico powered by dealroom.co crunchbase
Notes: Data is as of 30 September 2025. Based on revenues, headcount, enterprise value and/or capital raised since 2016. Larger grey bubbles represent companies with revenues of $500M or more, while smaller white bubbles represent companies with revenues below $500M.
Visuals: Logo grid of company bubbles grouped in four panels. Each bubble is a circle filled #EEEEEE (large bubbles about 6.7% wide, small about 4.0% wide) containing a company logo in black or dark grey. Health: alan, OURA, Doctolib, CMR Surgical. Transportation: Bolt, FLiX, RIMAC, forto. Other: Enpal, grammarly, Personio, Back Market, perk+, Helsing. Fintech: Revolut, monzo, Starling Bank, OakNorth, Qonto, ZEPZ, N26, Rapyd, marshmallow, checkout.com, mollie, TRADE REPUBLIC, sumup, GoCardless, PLEO, Pennylane, Thought Machine. Horizontal Infra & Software: infobip, DARKTRACE, celonis, miro, dataiku, BIRD, DeepL, MIRAKL, Lovable, contentful, lighthouse, quantexa, ElevenLabs, Synthesia, aiven, poolside, Framer, QUANTINUM, Mistral AI. Larger bubbles mark companies with revenue of $500M or more; smaller bubbles mark companies below $500M. Logos are not cropped.
Slide 14
We must fix Europe for our future
Visuals: One photograph, full-bleed, shown as a split composition of two halves divided at x 50%. Left half: a white and black underwater robot with a short black antenna, four black wheels or thrusters at the upper left, two white headlights glowing at the front, and four articulated black-and-white legs ending in round black-rimmed mesh nets, hovering above a dense coral reef with orange branching coral, pink and red rounded coral, blue-grey branching coral, and a striped black-and-white fish in the centre; a few small fish swim in the teal water. Right half: murky green-grey water with a dark brown clump of debris at upper left, a pale translucent plastic bag hanging from a dark strand at centre top, a dark tangled piece of debris with a faint transparent bag at upper right, and dim sediment on the seabed; no living coral or fish is visible. At the top centre a person in a straw sun hat lies back on the water surface with arms behind the head, surrounded by forest trees and a pale shoreline. Composition: wide landscape frame, subject matter split left and right, the water surface line at about 20% of height. Lighting: soft diffuse underwater light, with two bright point highlights from the robot headlights. Dominant colours: teal #1F6F78 and deep green #2E5A4C on the left, grey-green #4A5E50 and olive-brown #3B3A2A on the right, orange coral #C8782E, forest green #1E3B2E at the top. The photograph is not cropped inside the frame and has no tint over the whole image, but the right half is visibly darker and greyer than the left. A dark navy banner (#0A1F2E, about 90% opaque, small rounded corners of about 0.5% of height, faint shadow) is laid over the photograph at the top, overlapping the surface line and the person's body.
Slide 15
Equal parts belief and doubt
Do you believe Europe can define its technological / future on its own terms in the age of AI?
Unsure (29%) / Too early to tell
No (36%) / Europe will be / shaped by others
Yes (35%) / Europe has the / potential to lead
Source:
Visuals: One diagram made of a circle divided into three sectors by three dark arrow-shaped bands. The circle is about 49% of slide width and 78% of slide height, centred horizontally at about 49% and bottom-cropped at the slide edge. Sector 1 (top, Unsure, 29%) has a teal-to-pale-mint gradient running from about #0E4A5A on the left through #0F5C70 to pale #CDEBD3 on the right. Sector 2 (bottom-left, No, 36%) has a dark teal gradient from about #0C2E3A at the top-left to #0F5C70 at the lower right. Sector 3 (bottom-right, Yes, 35%) has a cream gradient from about #D5EDE0 on the left to #FFF9E0 on the right. Three arrow-shaped dark bands in #012834 run from the centre to the edges: one points up-left, one points up-right, and one points down, each with a triangular arrowhead cutting into the circle. Each sector carries its label in black or white as listed in the elements. No chart axes or legend. Labelled values are 29%, 36% and 35%, totalling 100%. A round badge with teal-grey fill, a white State of European TECH wordmark and a tiny Survey line sits at left-middle, with a second copy of the wordmark in the Source line.
Slide 16
Fix Europe for founders
Fix the Friction
Empower Talent
Make it simpler and / faster to build across / borders at scale
Make Europe the home of / choice for the most / ambitious builders
Fund the Future
Champion Risk
Build deep, full-stack / capital markets fit for / champions
Cement risk culture as / foundational infrastructure
Visuals: Four rounded-corner rectangular cards with a translucent teal gradient fill, lighter at the top-right (about #4A7A74) and darker at the bottom-left (about #0E3A40). Each card has a white-outlined circle badge (about 2px white stroke, dark navy numeral square inside) containing the numerals 1, 2, 3 and 4 in order: card 1 top-left, card 2 top-right, card 3 bottom-left, card 4 bottom-right. Each card has a horizontal divider line in pale mint #A7D9CF, about 0.2% thick. No photographs, charts or other graphics.
Slide 17
28th Regime
Let’s do it right.
EU-INC
STATE OF EUROPEAN TECH25
Visuals: Illustration: a stylised map of Europe, drawn as thin grey-teal coastline outlines (about #4E6F74 at about 60% opacity) across the right of the slide, with Ireland, Great Britain, Iberia, France, Italy, Scandinavia and the Balkans visible and cropped at the right and bottom edges. Over the map is a network diagram: about 40 thin pale lines (about #A9D6CF at about 30% opacity) join small mint nodes (about #9FEBD9 dots, about 1% of slide width) to form a mesh. Larger translucent teal circles (about #7FD1C0 at about 35% opacity with a radial gradient darkening to about #0B3440 at the centre) sit on many nodes, ranging from about 15% of slide width (the large circles over Scandinavia, Germany and Iberia) down to about 3% (small circles over Ireland, Benelux and the Balkans); the largest circle sits over central Europe at about x 69.6 y 26.4 to 78.3 y 63.1. No chart, table or photograph.
Slide 18
2026 could determine the path forward / Overview of selected European Commision work programme initiatives for 2026 / 2026 / Q1 / Q2 / Q3 / Q1 2026 / 28th Regime for / Innovative / Companies / Q1 2026 / European / Innovation Act / Q2 2026 / Quantum Act / TBC 2026 / European / Innovation / Investment Pact / Q1 2026 / Savings & / Investment / Union / Q1 2026 / Cloud and AI / Development / Act / Q2 2026 / Public / Procurement / Act / Q3 2026 / Update of the / European Venture / Capital Funds / Regulation
Visuals: Horizontal timeline diagram. A thin mint (#A7D9CF) line about 1.5px thick runs from the left edge to an mint solid triangular arrowhead at the right edge (about x 89.4 to 90.5, y 61.4 to 63.2). Along the line from left to right: a filled mint rounded pill labelled 2026 (about x 5.8 to 13.2, y 59.7 to 65.0); an outlined rounded rectangle labelled Q1 (about x 28.0 to 35.3, y 59.7 to 64.9) with a mint outline and dark fill; an outlined rounded rectangle labelled Q2 (about x 50.2 to 57.5, y 59.7 to 64.9) with the same style; an outlined rounded rectangle labelled Q3 (about x 72.3 to 79.7, y 60.2 to 65.4) with the same style. Eight rounded-corner rectangular cards (callouts) are attached to the timeline: four above the line and four below, each with a small triangular pointer on its edge that points toward the timeline (above-line pointers point down at about x 14.3, 33.5, 52.6 and 71.8, y 55.6 to 57.6; below-line pointers point up at the same x values, y 67.0 to 69.0). Card contents: top-left card Q1 2026, 28th Regime for Innovative Companies; top second card Q1 2026, European Innovation Act; top third card Q2 2026, Quantum Act; top right card TBC 2026, European Innovation Investment Pact; bottom-left card Q1 2026, Savings and Investment Union; bottom second card Q1 2026, Cloud and AI Development Act; bottom third card Q2 2026, Public Procurement Act; bottom right card Q3 2026, Update of the European Venture Capital Funds Regulation. Each card date line is in light mint (#A7D9CF) regular weight and each initiative name is in white semibold. No photographs, charts or icons other than the logo.
Slide 19
€T+ companies are coming to Europe
It’s about how fast we get there
The time to act is now
Visuals: Three translucent rounded-rectangle panels with a subtle diagonal teal gradient, each about 82% of slide width and 9% of slide height. Two thin horizontal white hairline rules sit in the gaps between panels, each about 42% of slide width, starting near the centre and fading out to the left, placed at about y 38.8% and y 60.7%. Top-right: the State of European Tech 25 logo in white (STATE OF EUROPEAN with stacked wordmark, TECH with a stylised 25). Measured but not visibly rendered: a 984 by 152 px image at x 85.9 y 90.5 and a 1024 by 162 px image at x 21.6 y 71.7; both appear invisible against the background.
Slide 20
Thank you / atomico / aws / orrick / HSBC Innovation Banking / SLUSH / STATE OF EUROPEAN TECH25
Visuals: Logo: the STATE OF EUROPEAN TECH 25 wordmark, bold white condensed sans capitals, with the '25' in mint #9FD8C9. Partner logos, left to right, all rendered in light grey #E7E6E6 on the dark background: atomico (wordmark with a small degree-style circle after the o); aws (lowercase wordmark with a curved smile arrow beneath); orrick (lowercase wordmark with a loop ring above the k); HSBC Innovation Banking (HSBC hexagon-style diamond mark with bold HSBC and regular 'Innovation Banking'); SLUSH (italic slab-style bold capitals). No photographs, charts or diagrams.
Download this deck
The hosted PDF of every library deck is free for readers of the SlideDeck Co newsletter. Join with your email and the viewer and download appear here.
Building a deck of your own? The SlideDeck Co Standard Deck is a slide library for business presentations: reviews, updates and plans.