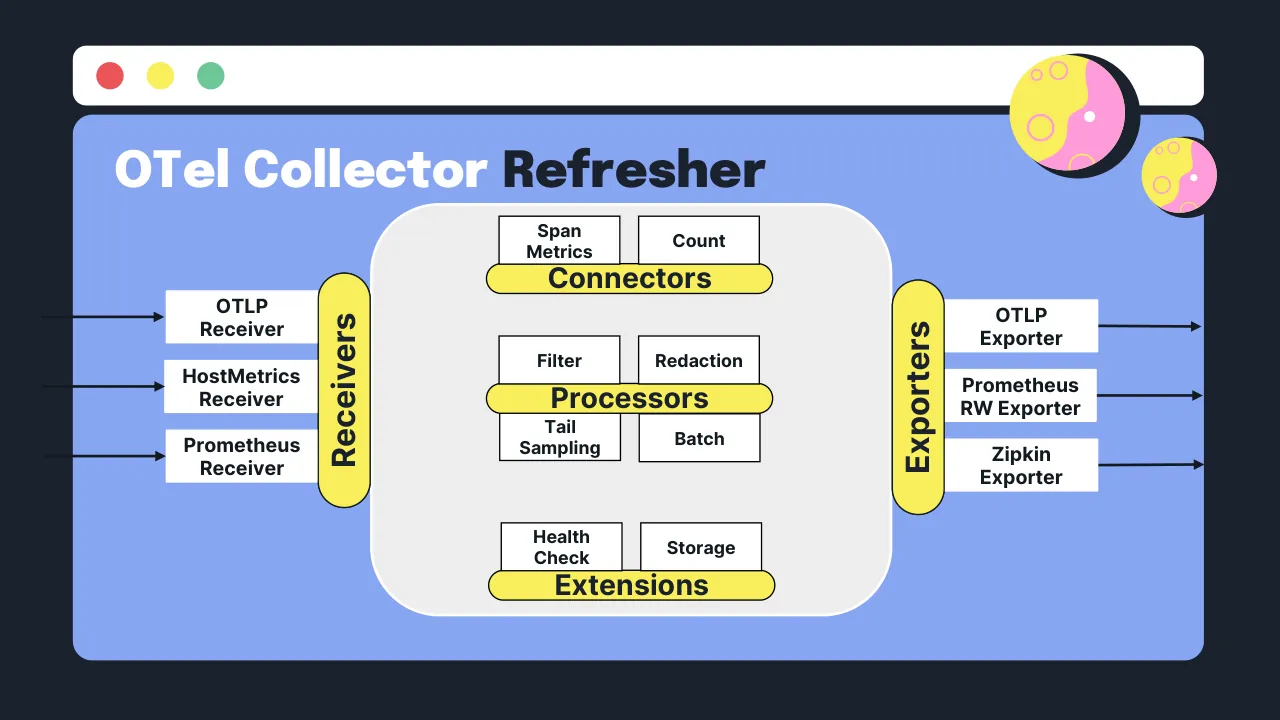
The deck opens with a title slide and an About Us slide introducing the two speakers, Adriana Villela of ServiceNow Cloud Observability (formerly Lightstep) and Reese Lee of New Relic. A playful 'Why, hello, old friends' slide follows, then a table of contents with five sections. Section one covers Prometheus metrics with OTel: it refreshes the OpenTelemetry Collector architecture, explains Prometheus as both a server and a data format, compares the two projects, and covers the Prometheus receiver and exporters, including the remote write exporter. Section two covers the Target Allocator, listing Prometheus scaling challenges such as resource intensity and uneven target distribution, then explains how the Target Allocator decouples service discovery from collection within the OTel Operator. Section three, Show me!, walks through a sample Python app deployed on Kubernetes with the OTel Operator, Collector and Target Allocator, using a sequence of configuration slides. Section four covers alternative OTel components for Kubernetes, such as the cluster, kubelet stats, host metrics and file log receivers, and the Kubernetes attributes processor.
Slides worth studying
Questions about this deck
How many slides does the ServiceNow and New Relic deck on Prometheus and OpenTelemetry have?
The ServiceNow and New Relic deck has 54 slides. Slide 1 is the title slide, 'Prometheus & OpenTelemetry Better Together'.
How is the ServiceNow and New Relic deck structured?
Slide 4 is the table of contents with five sections: 01 Prometheus metrics with OTel, 02 Target Allocator, 03 Show me!, 04 Additional OTel components for K8s, and 05 Wrap-up. These sections begin on slides 5, 15, 27, 43 and 47.
What does the ServiceNow and New Relic deck say about the Target Allocator?
Slide 22 says the Target Allocator decouples the service discovery and metric collection functions of Prometheus. It also says the Target Allocator manages the configuration of the Collector's Prometheus Receiver.
What pros and cons does the ServiceNow and New Relic deck list for using OpenTelemetry with Prometheus?
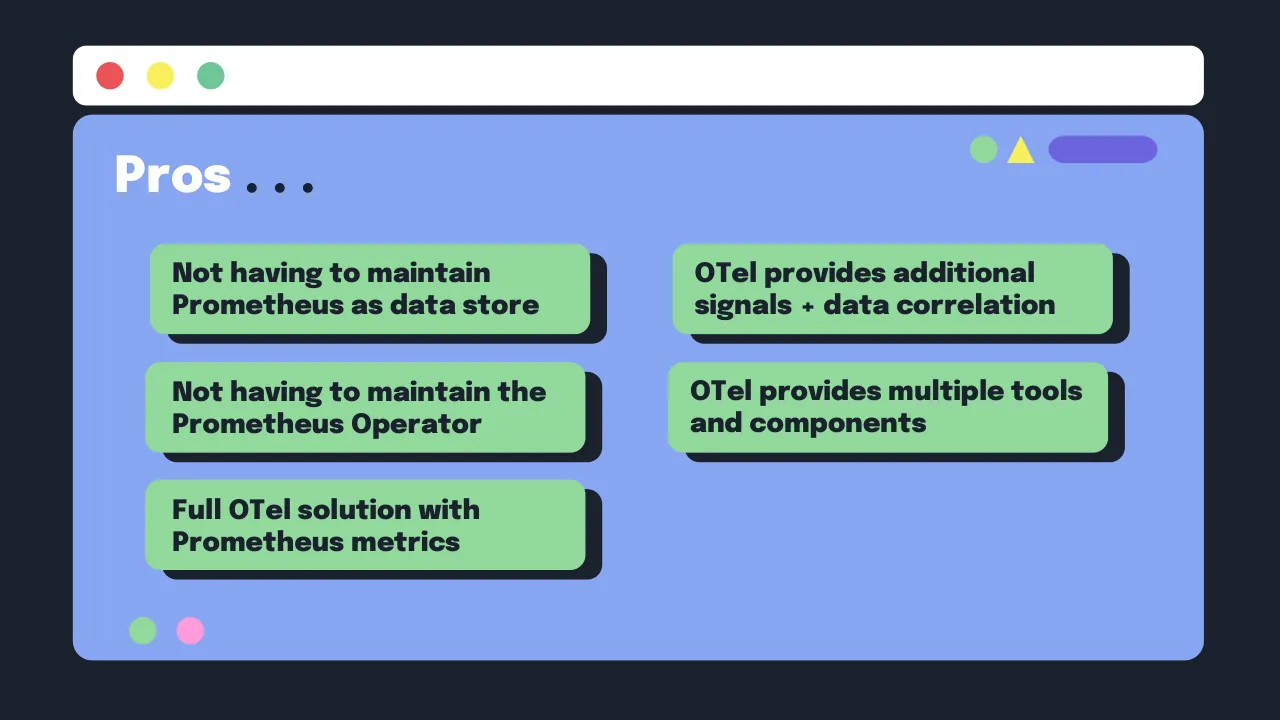
Slide 48 lists pros such as not having to maintain Prometheus as a data store and OTel providing additional signals and data correlation. Slide 49 lists cons such as a steep learning curve, possibly no PromQL, and operational complexity.
Details
- Company: ServiceNow and New Relic
- Year: 2024
- Type: Conference talk
- Industry: Cloud observability
- Pages: 54
Review score: 7 out of 10, Effective
Presentation quality, judged with the SlideDeck Co review heuristic. Ask, evidence and idea merit are not rated here.
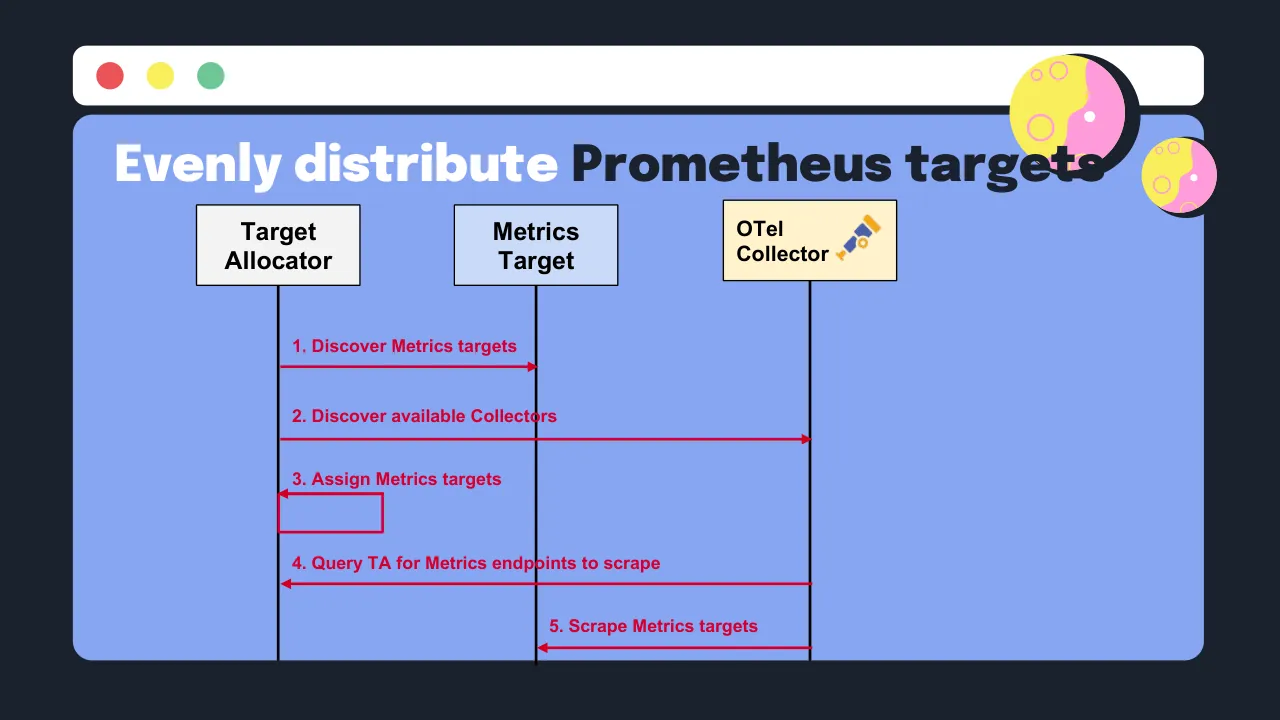
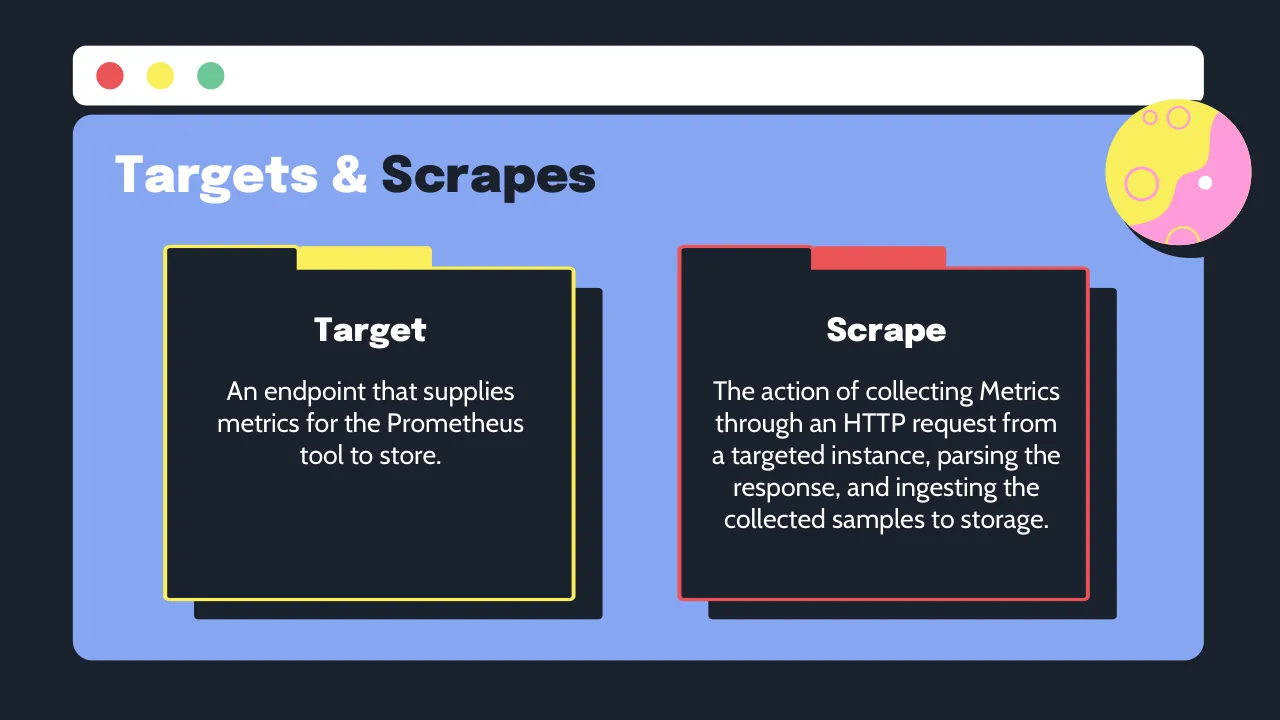
The deck has a clear five-section route announced on slide 4 and repeated by numbered dividers, and it moves from concepts (slides 6 to 14) to the Target Allocator problem and fix (slides 16 to 26) to a configuration walkthrough (slides 28 to 40) and wrap-up. The visual identity is consistent and distinctive, and the sequence diagram on slide 24 and the collector diagram on slide 6 explain their ideas well. Weaknesses are real, though: the YAML slides 31 to 40 use small monospace code on a large blue field with small highlight boxes, text on several slides is tiny (slides 9, 10, 14, 25 captions and diagram labels), and slide 34 is a blurred code frame whose purpose is unclear. Several slides carry mostly decorative sloth images with only a few words (slides 10, 11, 16, 17, 23), so rhythm is playful but some pages add little.
Worth keeping: Keep the numbered section dividers with the table of contents on slide 4, the sequence diagram on slide 24, the collector architecture on slide 6, and the consistent dark and periwinkle palette with yellow accents.
Most useful repair: Enlarge the YAML on slides 30 to 40 so the highlighted lines fill the frame and are readable from a room, and remove or explain the blurred slide 34.
What would change the score: I would merge the sloth-led slides that carry two or three short labels into fewer, denser pages and enlarge the small body text on slides 9, 10 and 25, plus the red labels on slide 24, which crowd the title decoration on the right.
Confidence medium. 54 of 54 pages inspected on contact sheets, 4 at readable size. Reviewed 2026-11-08. Model-assisted review (claude-sonnet-5-5).
Full text of the slides (54 slides)
Every slide's words and a description of its charts and images, so the deck can be searched and rebuilt. Also available as Markdown.
Slide 1
Prometheus &
OpenTelemetry
Better Together
Visuals: Decorative illustration only, no photograph or chart. (1) A white rounded title bar across the top with three filled circles at its left: red (#E95A5F), yellow (#F8EF5B) and green (#6EC59A), each about 3% of slide width. (2) A large blue rounded rectangle (#88A6F3) forming a browser body under the title bar. (3) A dark rounded inner panel (#1B222D) inside it. (4) Three planet-like spheres: each is a white circle with blue (#88A6F3) organic blob shapes and thin white and blue ring outlines and small dots; one at upper right (about x 76.7, y 23.1), one at centre right (about x 64.7, y 47.5), one at lower right (about x 75.8, y 56.1 to 78). (5) A small solid blue dot (#88A6F3) at about x 87.3, y 49.8, about 3% wide. (6) Three yellow (#F8EF5B) folder icons with rectangular tabs at the top and dark (#1B222D) offset shadows, along the bottom right: folder 1 at x 56.1, y 82.7; folder 2 at x 68.6, y 82.7; folder 3 at x 81.0, y 82.7; each about 10.3% wide and 13.9% tall. Composition is flat vector, with no photographs, no lighting effects and no gradients.
Slide 2
About US / Adriana Villela / Sr. Staff Developer Advocate / ServiceNow Cloud Observability / (formerly Lightstep) / bento.me/adrianamvillela / Reese Lee / Sr. Developer / Relations Engineer / New Relic / x.com/reesesbytes
Visuals: Two circular head-and-shoulders photographs, each cropped to a circle and centred above a name. Left photo: a smiling woman with shoulder-length wavy highlighted brown hair, wearing a magenta top, against a plain grey backdrop, lit by soft even daylight, framed close and centred. Right photo: a smiling woman with long dark hair blown across her face, wearing a teal zip jacket, against a desert landscape with dry flat ground, distant mountains, and a blue sky with white clouds under bright sunlight. Two black-and-white QR codes, each on a white square with a thin light-grey rule above and below, labelled beneath with the URL: left bento.me/adrianamvillela, right x.com/reesesbytes. Three yellow (#F8EF5B) folder icons stacked vertically at the right edge of the panel, each with a dark navy (#1B222D) offset shadow shape behind it and a folder tab at top left. A red (#EB5358) squiggly line with round end dots running from the bottom-left corner of the panel down and across to the bottom centre-left. A small purple (#6D65E0) triangle at left-centre-bottom and a yellow (#F8EF5B) cross/X below it. Three traffic-light dots in the white title bar: red (#EB5358), yellow (#F8EF5B), green (#6CC796).
Slide 3
Why, hello,
old friends…
Image source:https://shorturl.at/cjqDT
Visuals: Painting: a classical oil-style painting of a bearded, muscular nude man holding a flaming torch aloft in his right arm, his left hand raised to his chin in a thoughtful pose, looking upward. He wears a loose orange-red drape over one shoulder and hip, and a gold clasp at the chest. A dark, crouching figure sits in shadow at the lower left. Background is a pale grey-white sky fading to slate blue at the upper right. Lighting is soft and diffuse from the upper left. Dominant colours: orange, red, cream and slate blue. The painting is boxed (not full-bleed), with a yellow border, sitting over a pink offset rectangle. Overlays: a red-orange circular logo with a white flame mark at the upper left of the painting, and a white security-camera icon, tilted, at the upper right. Folder card is a graphic shape, not a photo. No charts or tables.
Slide 4
Table of Contents / 01 / Prometheus / metrics with OTel / 02 / Target Allocator / 03 / Show me! / 04 / Additional OTel / components for / K8s / 05 / Wrap-up
Visuals: Decorative shapes only, no photographs, charts or logos. (1) Three traffic-light window dots at the top-left of the white title bar: red #EB5757-like circle (about 2.1% wide) at x 7.5, y 8.6; yellow #F8EF5B circle at x 11.4, y 8.6; green #6FC895-like circle at x 15.1, y 8.6, each about 2.1% wide and 3.7% high. (2) A solid violet-blue circle #6D65E0 at the top-right of the panel, partly overlapping the title bar's right end and the panel edge, about 6.5% wide and 11.5% high. (3) A top-right decorative badge: a circle about 12.4% wide and 22% high at x 85.9, y 12.9, filled yellow #F8EF5B on its upper-left portion and pink #FF9BDA on its lower-right portion, divided by an S-shaped curve; it has a dark #1B222D offset shadow about 12.3% by 21.9% at x 86.9, y 13.9. Small pink #FF9BDA ring outlines and one small white dot sit on it: a small ring near the top, a larger ring near the left-centre, a white filled dot at the right-centre, and a ring cut off at the bottom edge. (4) Five yellow folder tabs #F8EF5B, each about 10.3% wide and 13.9% high with a small raised tab on top, each with a flat dark #1B222D offset shadow down and to the right: 01 at x 8.8, y 32.8; 04 at x 51.5, y 33.3; 02 at x 8.8, y 51.3; 05 at x 52.1, y 51.7; 03 at x 8.9, y 70.7. (5) Five green rounded rectangles #92D99C, each about 25.2% wide and 13.7% high, each with a flat dark #1B222D offset shadow: 01 box at x 21.7, y 33.9; 04 box at x 64.1, y 34.6; 02 box at x 21.8, y 52.6; 05 box at x 64.7, y 53.0; 03 box at x 21.6, y 71.7. (6) A white rounded title bar #FFFFFF and a periwinkle rounded panel #88A6F3 with a flat dark shadow of the same type, described in layout.
Slide 5
01
Prometheus
metrics with OTel
Visuals: Decorative flat illustration, no photograph or chart. (1) A white upward arrow, a thick straight shaft with a chevron head, at the left of the blue panel, partly hidden behind the large planet; it has a drop-shadow offset in #1B222D. (2) A yellow #F8EF5B folder icon with a small tab at its top-left, a #1B222D offset shadow down and right, containing the large dark numeral 01. (3) A pink #FF9BDA rounded label with a #1B222D offset shadow behind it, containing the white title. (4) Two flat planets in the lower-left: the large one is a red #EB5358 circle with a yellow #F8EF5B lower half divided by a wavy boundary, small yellow outlined rings and a few white dots on it, and a #1B222D offset shadow down-right; the smaller one is a red and yellow circle with a wavy boundary, yellow outlined rings and a white dot, also with a dark offset shadow. A solid pink #FF9BDA circle overlaps the bottom of the large planet. (5) Small white dots scattered around the lower-left and bottom-centre of the panel. (6) At the top-right of the blue panel, a purple #6D65E0 pill-shaped bar and a yellow #F8EF5B pill-shaped bar sit side by side, both fully rounded.
Slide 6
OTel Collector Refresher / Connectors / Span Metrics / Count / Receivers / OTLP Receiver / HostMetrics Receiver / Prometheus Receiver / Processors / Filter / Redaction / Tail Sampling / Batch / Extensions / Health Check / Storage / Exporters / OTLP Exporter / Prometheus RW Exporter / Zipkin Exporter
Visuals: Diagram. Left column: three white rectangular boxes labelled OTLP Receiver, HostMetrics Receiver and Prometheus Receiver, each with a black arrow entering from the left slide edge and pointing right into the box. A tall yellow rounded pill labelled Receivers (rotated vertical, navy text) sits on the right edge of this column. Centre: a large light-grey #EEEEEE rounded rectangle with a thin white border, containing three bands. Top band: white boxes Span Metrics and Count above a yellow pill labelled Connectors. Middle band: white boxes Filter and Redaction above a yellow pill labelled Processors, and white boxes Tail Sampling and Batch below it. Bottom band: white boxes Health Check and Storage above a yellow pill labelled Extensions. Right: a tall yellow rounded pill labelled Exporters (rotated vertical) on the left edge of a right column of three white boxes, OTLP Exporter, Prometheus RW Exporter and Zipkin Exporter, each with a black arrow leaving right toward the slide edge. Decoration: two overlapping planet-like circles in the top right corner. The larger one is yellow #F8EF5B with a pink #FF9BDA patch, small outlined circles and a white dot, with a navy #1B222D offset shadow. The smaller one is a similar yellow and pink circle with a navy offset shadow, partly overlapping the browser bar edge. Top left of the browser bar has three filled circles: red #EB5757-like, yellow #F8EF5B and green #6FC595-like.
Slide 7
What is a
Prometheus?
Is it a tool? Is it data?
Visuals: One illustration: a digital-painting style sloth with large wide eyes and a worried expression, holding a lit wooden match in its left hand (flame at upper left) while its right paw touches its chin. Warm orange-to-tan gradient background behind the sloth. Framing is a square crop of the head and upper body, cropped at the top and right edges, placed in a box with a 0.4% thick yellow #F8EF5B border and a solid dark navy #1B222D offset shadow to the lower right. Lighting is warm from the flame. Dominant colours are orange, brown, cream and magenta-violet. Also three identical yellow #F8EF5B folder icons, each with a small tab on top and a flat dark navy #1B222D offset shadow to the lower right, arranged in a row at the bottom right of the panel.
Slide 8
What is / Prometheus? / Prometheus as a / Server / Collects metrics data from / targets defined in a / configuration file / Prometheus as / Data / Stored as a dimensional time- / series
Visuals: Three small filled circles in the white title bar at its left end, red (#EB5358), yellow (#F8EF5B) and green (#6EC59A), roughly 2% of slide width each and evenly spaced like window controls. A decorative circle at top right, about 12% wide: a yellow (#F8EF5B) disc with pink (#FF9BDA) wavy shape filling its lower-right part, with small yellow and pink outlined rings and one small white dot scattered on it, and a dark navy (#1B222D) offset shadow disc peeking out beneath its lower edge. Two folder illustrations: each is a dark navy (#1B222D) rectangular card with a rounded tab at its upper-left corner and a second, slightly offset dark navy card behind it as a shadow stack. The left folder has a yellow (#F8EF5B) outline about 0.5% of slide height thick and a yellow tab at its top-right. The right folder has a red (#EB5358) outline of the same thickness and a red tab at its top-right. No charts, photographs or icons.
Slide 9
Prometheus and OTel differences? / OTel / Focused on / instrumentation / No storage / No alerts, querying, or / official UI / Prometheus / Time-series data store / Instrumentation clients / Web UI / Data format
Visuals: Two folder-shaped shapes, drawn as flat rectangles with a small tab at top-left. The left folder (OTel) is dark navy #1B222D with a yellow #F8EF5B outline of about 0.3% of slide height and a yellow tab, with a dark navy offset shadow card behind it shifted right and down. The right folder (Prometheus) is the same construction in red #EB5358 outline and red tab. Each folder carries a white bold heading and a white bullet list. Decorative top-right element: a yellow #F8EF5B circle with a dark navy #1B222D offset shadow circle beneath it, a pink #FF9BDA blob filling the right portion of the circle, pink outline rings of differing sizes, one yellow outline ring at the bottom edge, and one white dot. Browser bar: a white rounded rectangle with three filled circles, red #EB5358 at left, yellow #F8EF5B in the middle, and green #6CC393 at right. No photographs, charts or tables.
Slide 10
Prometheus / Receiver / Collects metrics / Drop-in replacement for / Prometheus / Exemplars
Visuals: Illustration: a coloured-pencil style cartoon of a smiling sloth with grey-brown and white fur, black nose, pink tongue, and wide brown eyes. The sloth leans in from the left, reaching its right arm out to knock on or push against a wooden panel door at the right; its left arm rests on a cardboard parcel with a white shipping label with barcode and red print, sitting on a red-brown brick or tile step. A brick wall and green foliage appear at the far left edge. Lighting is warm, glowing orange and yellow from the doorway; dominant colours are orange, amber, brown, grey and green. The picture is boxed, not full-bleed, with a yellow (#F8EF5B) border about 0.3 percent of slide width and a hard dark offset shadow (#1B222D) about 0.5 percent to the right and bottom. Three yellow (#F8EF5B) folder icons with tabs sit along the bottom edge at x 52.5, 65.0 and 77.4, each with a dark offset shadow (#1B222D) about 1 percent right and down, extending below the blue panel. Each green card has a dark offset shadow of the same size. No charts, tables or logos.
Slide 11
Prometheus
Exporter
Ship data in Prometheus’
format
Prometheus scrape HTTP
endpoint
Scaling issue
Visuals: One illustration: a cartoon sloth in a colored-pencil style with a gentle smile, its left arm outstretched to knock on or reach toward a brown wooden door with a glowing yellow-orange panel. In front, a taped cardboard parcel with a shipping label sits on a tiled terracotta pathway; the sloth's right hand rests on the box edge. Background shows a red brick wall and green foliage at the right edge. Warm lighting from the upper left, dominant colours orange, brown, yellow and green. The image is boxed (not full-bleed) with a thin yellow border (#F8EF5B) and a dark navy offset shadow block to its lower right. Three yellow (#F8EF5B) folder icons with dark navy (#1B222D) offset shadows sit in a row at the bottom right, each with a tab at top centre; they overlap the bottom edge of the periwinkle panel.
Slide 12
app
app
app
app
OTLP receiver
proces sors
Prom exporter
/metrics
prometheus
Source: https://grafana.com/blog/2023/07/20/a-practical-guide-to-data-collection-with-opentelemetry-and-prometheus/#6-use-prometheus-remote-write-exporter
Visuals: One hand-drawn-style architecture diagram in a white rectangle, with three decorative browser-window dots and three yellow folder shapes. Diagram: four identical circles stacked vertically at left, each labelled app, with pale hatched pinkish-beige fill and thin dark outline. Four straight arrows fan from the circles into the left side of the OTLP receiver box. Inside a large rounded-rectangle container with a thin dark outline, three boxes are connected left to right: OTLP receiver (tall rounded rectangle) → arrow → processors (tall narrow rounded rectangle, label split as proces / sors) → double-headed arrow with open arrowhead → Prom exporter (rounded rectangle). A pink (#F9A8D4) rounded-rectangle highlight outlines a left-pointing arrow labelled /metrics that runs from the Prom exporter's right edge to the Prometheus box. The Prometheus box is a separate rounded rectangle at right with a rounded-square outline, containing the orange-red (#E6522C) Prometheus flame logo above the lowercase word prometheus. Diagram text is in a handwritten monoline font, dark grey-black. Folders: three yellow (#F8EF5B) rectangular file-folder shapes with tabs, each with a dark (#1B222D) offset shadow block behind it, sitting across the bottom edge of the blue panel, not cropped.
Slide 13
Prometheus
Remote Write
exporter
Push from multiple
Collector instances
Remote write compatible
Visuals: One illustration: a cartoon three-toed sloth with a brown-grey fur coat and a wide smile, reaching its left arm toward a wooden door while its right hand rests on a taped cardboard parcel with a shipping label on the tiled doorstep. Background shows a red-orange brick wall, a warm glowing wooden door and green foliage at the right edge. Lighting is warm and golden from the upper left; dominant colours are amber, orange-red, brown and grey. The image is a square-ish rectangle, not cropped, boxed with a thin yellow #F8EF5B border (about 0.3% of slide width) and a flat navy #1B222D offset shadow panel behind it, shifted down and right by about 1.5%. Three yellow folder icons (#F8EF5B) with navy #1B222D offset shadows sit at the bottom right, each about 10.3% wide and 13.9% high, positioned at x 52.5, 65.0 and 77.4 percent, with tabs at the top. Two green pill shapes (#92D99C) each have a navy #1B222D offset shadow beneath them.
Slide 14
app
app
app
app
OTLP
receiver
proces
sors
Prom
remote
write
exporter
remote
write
prometheus
Source: https://grafana.com/blog/2023/07/20/a-practical-guide-to-data-
collection-with-opentelemetry-and-prometheus/#6-use-prometheus-remote-
write-exporter
Visuals: Diagram (hand-drawn sketch style, black outlines on white): four circles on the left, stacked vertically, each labelled 'app', with pale pink-hatched fill and thin black outlines. Four thin black arrows run from the right edge of each circle diagonally to the left edge of the 'OTLP receiver' box, with arrowheads converging on it. Inside a large rounded-corner black-outlined rectangle (the collector boundary, spanning about 52 to 81 percent of the diagram width) sit three boxes left to right: a rounded rectangle labelled 'OTLP receiver'; a tall narrow rounded rectangle labelled 'processors' split as 'proces / sors'; and a rounded rectangle labelled 'Prom remote write exporter'. Solid black arrows with open arrowheads connect OTLP receiver to processors, and processors to the exporter box. A pink (#F9A8D4) rounded rectangle outline highlights a 'remote write' label with a short line and open arrowhead, leaving the exporter and pointing into the Prometheus box. The Prometheus box is a large rounded rectangle with a black outline containing an orange (#E6522C) circular Prometheus flame logo with white flame and base, and the lowercase label 'prometheus' beneath it. Also three yellow folder icons at bottom right, each a flat rectangle with a small tab on top and a dark navy offset shadow to the lower right. No photographs, charts or tables.
Slide 15
02
Target Allocator &
Prometheus
Visuals: Decorative flat illustration, no photograph. Elements: (1) a white upward arrow (thick stroke, chevron head pointing up) at the left, x about 10.5 to 18, y about 40 to 75, partly hidden behind a large red-and-yellow planet; (2) a yellow folder shape with a tab on top and a navy offset drop shadow, holding the numeral 02 in navy Epilogue Black; (3) a pink rounded rectangle holding the white title 'Target Allocator & Prometheus' on two lines, with a navy offset drop shadow; (4) two decorative planets at lower left, the larger one red (#EB5358) upper half and yellow (#F8EF5B) lower half with yellow and red ring outlines and white dots, with navy drop shadow; the smaller one similar with red/yellow split and ring outlines; (5) a solid pink (#FF9BDA) circle at lower left overlapping the planets; (6) small white dots scattered at upper-left and lower-middle; (7) a browser chrome bar of white with red (#EB5358), yellow (#F8EF5B) and green (#6FC79A) dots at top-left; (8) two pill-shaped bars at upper right, a purple (#6D65E0) bar and a yellow (#F8EF5B) bar. Lighting flat, no gradients, no textures, no photograph.
Slide 16
Prometheus has
some Challenges
Welp, nothing’s perfect, amirite?
Visuals: Photo-style illustration (digital painting) of a fluffy brown-and-cream sloth with large glossy amber eyes, resting its chin on folded arms with long pale claws at the bottom of the frame. In front of it on a wooden table are a lit tealight candle with a flame, and six wooden matches with red heads arranged around it, three on the left and three on the right. Lighting is warm and focused on the candle and fur, with a cool blue-dark background behind the sloth's head. Composition is a near-square crop, centred, with the sloth filling most of the frame. The image is boxed (not full-bleed) with a thin yellow #F8EF5B border and a dark #1B222D offset shadow block behind it. Dominant colours are brown, amber, cream, dark blue and yellow. Three yellow folder icons (#F8EF5B) with dark #1B222D offset shadows sit side by side at the bottom right, each with a tab on its top edge. Three window-control dots at the top left of the browser bar: red, yellow and green.
Slide 17
Resource intensive / Uneven target distribution
Visuals: Illustration: a cartoon sloth with large brown eyes and a dark brown face mask, resting its chin on folded forearms with long pale claws, on a wooden tabletop. In the centre foreground a single lit tealight candle with a bright orange-yellow flame stands on a white-grey metal base, with about six wooden matchsticks with red heads radiating around it. The background is a deep blue-to-purple gradient, lit warmly by the candle, with a soft orange-brown glow on the fur and table. Composition: a near-square frame with the sloth's head filling the upper two-thirds and the candle near the bottom centre. The image is boxed, not cropped or full-bleed, with a 0.3% yellow #F8EF5B border and a dark #1B222D offset shadow about 1.5% to the right and bottom. Decorative: two small yellow-and-pink spherical moon shapes at top right, each with pink #FF9BDA craters drawn as circles and a white dot highlight, offset by dark #1B222D shadows; the larger one overlaps the header bar's right end and the smaller one overlaps the blue panel's right edge.
Slide 18
So what do
we do??
Visuals: Browser-window illustration drawn in flat shapes. Outer window: a white rounded top bar at x 5.7%, y 6.3%, w 88.4%, h 8.3% carrying three window-control dots (red #EB5757 at about x 7.5%, yellow #F8EF5B at about x 11.5%, green #6FC59A at about x 15.4%, each about 2.2% wide and centred at y 10.5%). Below it, a periwinkle #88A6F3 rounded rectangle at x 5.7%, y 15.9%, w 88.4%, h 75.8% forms the window body. Inside it, a dark #1B222D rounded panel at x 7.6%, y 20.0%, w 84.5%, h 60.9% holds the headline. Bottom strip of the window: two white diagonal slash marks ('//') at about x 7.9% to 10.7%, y 83.1% to 88.0%; a pink #FF9ED6 pill at x 11.5%, y 83.6%, w 6.9%, h 3.8%; a white pill at x 20.2%, y 83.7%, w 4.7%, h 3.8%; a white rounded progress-bar track at x 67.6%, y 82.7%, w 23.5%, h 5.2%, with a green striped fill (#92D99C and #6CB98C diagonal stripes) at x 68.0%, y 83.3%, w 18.0%, h 4.1%, ending in a rounded cap. A small red #EB5757 heart or pin shape sits above the progress bar at about x 84.4%, y 79.6%, w 1.3%, h 1.7%, overlapping the edge of the blue strip.
Slide 19
Target Allocator / can Turbo Boost / Prometheus / OTel FTW, y’all! / TURBO BOOST! / Image source: https://images.app.goo.gl/ND7sSWAU2np485Vy9
Visuals: One photograph: a still from a retro TV-style GIF showing a man with dark swept-back hair, a teal collared shirt and a black leather jacket seated inside a car, looking straight ahead with his mouth open mid-speech. The background shows a grey, out-of-focus car window and dark interior. Lighting is dim and cool, with greyish-blue ambient light and a fine dithered, pixelated texture. Framing is a medium close-up from head to chest, cropped at the bottom edge of the image. The overlaid white bold condensed caps text TURBO BOOST! sits across the lower part of the photo with a dark outline. The photo is boxed, not full-bleed, with a yellow (#F8EF5B) frame about 3 px wide and a dark navy (#1B222D) hard offset shadow about 1.2% of slide width to the lower right. Three yellow (#F8EF5B) folder icons, each with a tab at the top-left and a dark navy (#1B222D) hard offset shadow to the lower right, stand side by side at the bottom right of the panel. Traffic-light dots: red, yellow and green circles at the left of the title bar.
Slide 20
TARGET ALLOCATOR
What is the
Target Allocator?
The Target Allocator is part of the
OTel Operator
FCC80 / 3400 / +425CO7
Visuals: Photo-style illustration (boxed, not full-bleed, not cropped): a cartoon sloth teacher in a chalk-pastel painted style stands at a green chalkboard with a wooden frame. The sloth has brown fur, a pale face, large brown eyes and a small green leaf on its head, and it points a wooden pointer stick toward a chalk bar chart. The chalkboard shows a chalk title TARGET ALLOCATOR above a white-outlined arrow axis with a rising set of about seven bars of varying heights, and below it three chalk numbers (FCC80, 3400, +425CO7). In front, a wooden desk holds a cup of coloured pencils, scattered coloured erasers or chips, and an open white book. The lighting is soft and even, with a dominant palette of green, brown, cream and red brick. The image has a thin yellow border and sits on a dark navy offset shadow block. Three flat yellow folder icons (#F8EF5B) with dark navy offset shadows stand in a row at the bottom right, each with a tab at the top, with no text or icons inside them.
Slide 21
Collector management
Auto-instrumentation
management
OTeL Operator
#55780
#55780
-72500
-23580
44:010
44817
24667
olelorr
Visuals: Photograph-style illustration in the left column: a cartoon sloth standing at a green chalkboard, smiling, with its right arm raised holding a wooden pointer toward a chalk graph. The chalkboard reads 'OTeL Operator' across the top, with a rising pink chalk arrow on a grid graph and numbers in the right and left margins (#55780, #55780, -72500, -23580, 44:010, 44817, 24667 as best readable). Below the board are pencil cups, a notebook, an eraser and loose crayons on a wooden desk. The frame is a medium-close, front-on composition, lit evenly with warm light; dominant colours are chalkboard green, warm brown fur, red-brown wood, and multicoloured pencils. It is boxed (not full-bleed, not cropped), with a yellow outline and a dark #1B222D offset shadow. Three yellow #F8EF5B folder icons with tabs sit at the lower right, each a plain rectangle with a tab on its top-left, with dark #1B222D offset shadows. Browser-bar decoration: three filled circles, red, yellow and green, at the top left.
Slide 22
What is the Target Allocator? / Decouples the service discovery and metric collection functions of Prometheus / The Collector manages Prometheus Metrics without needing to install Prometheus / The Target Allocator manages the configuration of the Collector’s Prometheus Receiver
Visuals: Three dark navy folder-shaped cards in a row, each with a coloured tab at top-right and a coloured outline, sitting on an offset dark navy shadow block drawn down and to the right. Card 1 (left) has a red #EB5358 tab and outline and holds the text 'Decouples the service discovery and metric collection functions of Prometheus'. Card 2 (centre) has a yellow #F8EF5B tab and outline and holds 'The Collector manages Prometheus Metrics without needing to install Prometheus'. Card 3 (right) has a pink #FF9BDA tab and outline and holds 'The Target Allocator manages the configuration of the Collector’s Prometheus Receiver'. Each card's text is white and centred. Decorative shapes: at top-right of the panel a green #94D99A circle, a yellow #F8EF5B triangle and a violet #6B6BE0 pill. At bottom-left of the panel a green #94D99A dot and a pink #FF9BDA dot. In the browser bar, three dots: red #EB5358, yellow #F8EF5B, green #6CC79A. No photographs, charts, tables or logos.
Slide 23
Even Prometheus target distribution / Discovery of Prometheus Operator CRs
Visuals: Photo-style illustration of a cartoon sloth standing at a green chalkboard, pointing with a wooden pointer toward a bar chart with an upward arrow y-axis and rightward arrow x-axis, headed 'TARGET ALLOCATOR' in white chalk capitals; faint chalk arithmetic below the chart. Sloth is brown-grey with cream face, dark eyes and nose, a small green leaf on its head, smiling; sits behind an open book and a cup of coloured pencils on a wooden desk with scattered chalk erasers. Framing: square crop, subject centred-right. Lighting: soft even studio light. Dominant colours: forest green board, warm wood brown, cream, grey-brown fur. The image is boxed with a thin yellow border and a dark offset shadow to the bottom-right. Three flat yellow folder icons with tabs, no text, sitting along the bottom right edge of the periwinkle panel.
Slide 24
Evenly distribute Prometheus targets
Target Allocator
Metrics Target
OTel Collector
1. Discover Metrics targets
2. Discover available Collectors
3. Assign Metrics targets
4. Query TA for Metrics endpoints to scrape
5. Scrape Metrics targets
Visuals: A UML-style sequence diagram with three participant boxes across the top, each with a vertical black lifeline running down to the panel bottom. Five red arrows labelled in order: 1. Discover Metrics targets runs from Target Allocator to Metrics Target (right-pointing). 2. Discover available Collectors runs from Target Allocator to OTel Collector (right-pointing). 3. Assign Metrics targets is a self-loop on Target Allocator, drawn as a red rectangle outline with an arrowhead pointing left back into Target Allocator. 4. Query TA for Metrics endpoints to scrape runs from OTel Collector to Target Allocator (left-pointing). 5. Scrape Metrics targets runs from OTel Collector to Metrics Target (left-pointing). The OTel Collector box has a small blue-and-gold telescope icon at its right. Two moon-like circles at top right: a larger yellow moon with pink crescent shading, pink ring craters and a white dot, with a dark offset shadow; and a smaller yellow and pink moon with pink ring craters, a white dot and a dark offset shadow.
Slide 25
Targets & Scrapes
Target
An endpoint that supplies
metrics for the Prometheus
tool to store.
Scrape
The action of collecting Metrics
through an HTTP request from
a targeted instance, parsing the
response, and ingesting the
collected samples to storage.
Visuals: Two folder illustrations drawn as flat shapes. The left folder is a dark navy body with a yellow outline and a yellow tab at its top edge, with a dark navy offset shadow shape behind and to the lower right. The right folder is a dark navy body with a red outline and a red tab, with the same offset dark shadow. Both folders are the same size and sit on the same baseline. Top-right is a circular blob with a yellow base, a pink wavy region on the right, a white dot, and small pink and yellow outlined ring doodles, with a dark navy offset shadow beneath it. Three small filled circles (red, yellow, green) at the top-left of the browser bar act as window controls. No photographs or charts.
Slide 26
Discover Prometheus operator CRs / PodMonitor / (Prometheus Operator) / ServiceMonitor / (Prometheus Operator) / Target / Allocator / Prometheus / Receiver / OTel / Collector / Prometheus / Receiver / OTel / Collector / Prometheus / Receiver / OTel / Collector / 1. Discover / Prometheus / Operator CRs / 2. Add job to TA / scrape / configuration / 3. Add jobs to Collector’s / Prometheus Receiver’s / scrape configuration
Visuals: Diagram. Left column: two light-blue rectangles with thin black outlines, PodMonitor (Prometheus Operator) at top and ServiceMonitor (Prometheus Operator) below it. Centre: a light-grey rectangle labelled Target Allocator. Right: three small pale-blue rectangles labelled Prometheus Receiver, each attached to a larger pale-yellow rectangle labelled OTel Collector with a small satellite icon at its right side. Connectors: red (#D30020) elbow lines with arrowheads. Two elbow connectors run from the Target Allocator's left edge to the PodMonitor and ServiceMonitor right edges, with arrowheads pointing left at each monitor. A straight red line runs from the middle Prometheus Receiver's left edge to the Target Allocator's right edge, with an arrowhead pointing left at the Target Allocator. Two further red elbow connectors join the left edges of the top and bottom Prometheus Receivers to a vertical bus at x about 53.9% that meets the middle line. Icons: three satellite illustrations in blue and gold, one per OTel Collector, at the right of each yellow box. Upper satellite is the largest, middle medium and lower smallest. Each is shown diagonally, with blue body, gold solar panels and gold rings, on no background. Decorative: at top right, two planet-like circles overlap the title bar and panel edge. The larger planet is yellow with pink crescent and small pink-outlined crater rings, with a dark #1B222D offset shadow behind it; the smaller planet is the same design at a smaller scale, also with a dark offset shadow. No photographs, no cropping.
Slide 27
03
Show Me!
Visuals: Decorative illustration, no chart or table. Three filled circle dots in the white title bar: red #EB5358 at left, yellow #F8EF5B at centre-left, green #6FC59A at centre-right, each about 2.2% of width. A purple #6D65E0 rounded pill and a yellow #F8EF5B rounded pill sit at the upper right of the blue panel, aligned on one row. A white upward arrow (thick shaft, chevron head) rises from the lower left of the panel, its shaft partly hidden behind the large planet. A yellow #F8EF5B folder with a tab on its top edge carries the number 03 in black, with a dark #1B222D offset shadow down and right. A pink #FF9BDA rounded button with a dark #1B222D offset shadow carries the white label Show Me!. Lower left: a large red-and-yellow planet with a dark offset shadow circle behind it, yellow and red ring outlines on it and white dots; a smaller red-and-yellow planet with a dark shadow lower right of it and ring outlines; a solid pink #FF9BDA circle at the bottom left. Small white dots are scattered at the left of the arrow, at the far left edge near the planet, and at the bottom centre. All shapes are flat with no gradients.
Slide 28
Sample app
Python App
Prometheus
Metrics
OTel
Collector
Target
Allocator
OTLP
Metrics
< / >
Visuals: Diagram with three shapes and two arrows, plus two decorative icons. Shape 1: a dark blue rectangle labelled 'Python App' (white bold text). A yellow arrow labelled 'Prometheus / Metrics' runs from its right edge to the left edge of shape 2. Shape 2: a large pale blue rectangle (#CFE2F3) with a thin dark blue border labelled 'OTel Collector', containing two dark blue sub-boxes: top sub-box 'OTel Collector' (white bold text) and bottom sub-box 'Target Allocator' (white bold text), with a small icon between them of a telescope-like instrument drawn in blue and orange (a blue body with orange end caps and a ring). A second yellow arrow labelled 'OTLP / Metrics' runs from the right edge of shape 2 to a black monitor icon with a thick black bezel, a light blue screen and the centred black text '< / >' (code symbol), with a black stand and base. Decorative icons: two yellow-and-pink planet or moon circles with dark navy offset shadows, the larger at top right overlapping the title bar's right end and the smaller at far right overlapping the blue panel's upper-right edge; each has yellow with pink lower-right area and small pink circle outlines and white dots. The lower image is about 263 by 263 pixels and the telescope icon about 79 by 77 pixels; both are unboxed, no crop, no tint.
Slide 29
Sample app
Kubernetes
opentelemetry | opentelemetry-operator-system
OTel Collector | OTel Operator
Target Allocator
Python App
Visuals: Diagram: a large light-grey (#F3F3F3) rectangle with a thin dark-blue (#1C4587) 1px outline, labelled 'Kubernetes' at top centre, contains two light-blue (#CFE2F3) rectangles with thin dark-blue outlines side by side. The left rectangle is labelled 'opentelemetry' and contains three dark-blue (#1C4587) boxes stacked vertically, labelled 'OTel Collector', 'Target Allocator' and 'Python App' from top to bottom, with white bold text. The right rectangle is labelled 'opentelemetry-operator-system' on two lines and contains one dark-blue box labelled 'OTel Operator' in its upper half. No arrows or connectors join the shapes. Decorative: two moon-like circles at top right, each a yellow (#F8EF5B) and pink (#FF9BDA) two-tone disc with pink and yellow outlined crater circles and a small white dot, each with a dark navy (#1B222D) offset shadow; the larger overlaps the top edge of the white title bar and the smaller sits on the right edge of the blue panel. Three small window-control dots at top left of the title bar: red (#EB5757), yellow (#F8EF5B) and green (#6FC59B), estimated colours.
Slide 30
deployment, sidecar, / daemonset, or statefulset / OTel Collector CR API / docs / apiVersion: opentelemetry.io/v1alpha1 / kind: OpenTelemetryCollector / metadata: / name: otelcol / namespace: opentelemetry / spec: / mode: statefulset / targetAllocator: / enabled: true / serviceAccount: opentelemetry-targetallocator-sa / prometheusCR: / enabled: true / config: / receivers: / otlp: / protocols: / grpc: / http: / prometheus: / config: / scrape_configs: / - job_name: 'otel-collector' / scrape_interval: 30s / static_configs: / - targets: [ '0.0.0.0:8888' ] / target_allocator: / endpoint: http://otelcol-targetallocator / interval: 30s / collector_id: "${POD_NAME}" / ...
Visuals: A black macOS-style terminal window with three traffic-light dots at top left (red #FF5F57-like, yellow, green) containing YAML code of an OpenTelemetryCollector custom resource. Green (#00C389-like) outlined highlight boxes with white eye icons on the left edge mark selected code blocks: one around 'namespace: opentelemetry', one around 'mode: statefulset' (with a small red arrow pointing at it from the callout), one around the targetAllocator block, and one around the config block. A red line connects the red callout box to the mode line. A small blue and orange icon of a pencil/tool-like object with a key-shaped ring (OTel Collector CR API docs icon) sits left of the grey card text. A black-and-white QR code sits at the right of the grey card, about 152 by 152 pixels, unboxed with white quiet zone. Code colours: keys white, values yellow (#E5E510-like), config block cyan (#2AA8B8-like) text, bold true values.
Slide 31
apiVersion: opentelemetry.io/v1alpha1 / kind: OpenTelemetryCollector / metadata: / name: otelcol / namespace: opentelemetry / spec: / mode: statefulset / targetAllocator: / enabled: true / serviceAccount: opentelemetry-targetallocator-sa / prometheusCR: / enabled: true / config: | / receivers: / otlp: / protocols: / grpc: / http: / prometheus: / config: / scrape_configs: / - job_name: 'otel-collector' / scrape_interval: 30s / static_configs: / - targets: [ '0.0.0.0:8888' ] / target_allocator: / endpoint: http://otelcol-targetallocator / interval: 30s / collector_id: "${POD_NAME}" / ...
Visuals: A screenshot-style illustration of a code editor window on a near-black (#000000) panel, with three traffic-light dots at the top left: red #FF5F57, amber #FEBC2E and green #28C840, each about 1.2% of slide width. The code is set in a monospace font with yellow (#E5E510) values such as opentelemetry.io/v1alpha1, OpenTelemetryCollector, otelcol, opentelemetry, statefulset, opentelemetry-targetallocator-sa, and the 'true' values in bold; keys are off-white (#F0F0F0) in the top block and teal (#2AB7B7) from receivers: downward. A teal (#00C896) rectangular outline with a 0.6% stroke surrounds the lines targetAllocator through enabled: true, and a teal (#00C896) tab on its left holds a white outline eye icon. The image is boxed, not cropped, with a sharp rectangular edge and no shadow or rounded corners; it is flat with no overlay other than the highlight.
Slide 32
apiVersion: opentelemetry.io/v1alpha1
kind: OpenTelemetryCollector
metadata:
name: otelcol
namespace: opentelemetry
spec:
mode: statefulset
targetAllocator:
enabled: true
serviceAccount: opentelemetry-targetallocator-sa
prometheusCR:
enabled: true
config: |
receivers:
otlp:
protocols:
grpc:
http:
prometheus:
config:
scrape_configs:
- job_name: 'otel-collector'
scrape_interval: 30s
static_configs:
- targets: | '0.0.0.0:8888' ]
target_allocator:
endpoint: http://otelcol-targetallocator
interval: 30s
collector_id: "${POD_NAME}"
...
Visuals: Screenshot-style photograph of a code editor window (YAML) with a black background and three window-control dots at top left: red (#FF5F57-like, about #E8564F), yellow (about #F5B829) and green (about #2BC840), arranged left to right. Monospaced code text: keys in light grey-white (#E0E0E0), values and the key 'apiVersion' value, 'kind' value, 'name' and 'namespace' values, 'mode' value in yellow (about #E5D21B), the 'receivers' through 'collector_id' block in teal-cyan (about #3FB8C4), and bold white 'true' values. Two highlight callouts: (1) a rectangle outline in green (about #00C896), stroke about 0.5% of slide height, enclosing the line 'enabled: true' under targetAllocator, extending from the window's left edge to its right edge, with a green square tab on the left containing a white outline eye icon; (2) a larger green rectangle outline enclosing the block from 'target_allocator:' through 'collector_id: "${POD_NAME}"', with a matching green square tab and white outline eye icon at its left. The image is boxed (not full-bleed) and is slightly blurred and low resolution. Lighting is flat, with no shadows.
Slide 33
metadata.name + -targetallocator / apiVersion: opentelemetry.io/v1alpha1 / kind: OpenTelemetryCollector / metadata: / name: otelcol / namespace: opentelemetry / spec: / mode: statefulset / targetAllocator: / enabled: true / serviceAccount: opentelemetry-targetallocator-sa / prometheusCR: / enabled: true / config: | / receivers: / otlp: / protocols: / grpc: / http: / prometheus: / config: / scrape_configs: / - job_name: otel-collector / scrape_interval: 10s / static_configs: / - targets: ['0.0.0.0:8888'] / ... / endpoint: http://otelcol-targetallocator / interval: 30s / collector_id: "${POD_NAME}"
Visuals: Screenshot of a dark terminal window (photograph-style capture of a code editor, blurry) showing a Kubernetes YAML manifest for an OpenTelemetryCollector resource. Window chrome: three traffic-light dots at top left, red (about #FF5F57 area), yellow/orange (about #FEBC2E), and green (about #28C840), each about 1% of slide width. Code text is monospace and low-resolution: keys in light grey/white, values such as 'opentelemetry.io/v1alpha1', 'OpenTelemetryCollector', 'otelcol', 'opentelemetry', 'statefulset', and 'opentelemetry-targetallocator-sa' in olive-yellow, receiver keys in teal. Red arrow: solid line in #D30020 with a filled triangular head pointing left at the 'otelcol' value, running from the callout box's left edge; the arrow line is about 0.5% of slide height thick. Callout box: rectangle filled #F2F2F2 with a #D30020 red border about 0.4% of slide height thick, containing the bold text 'metadata.name +' in Arial bold and '-targetallocator' in Consolas bold, both #1B222D. Highlight bar: a rectangle with transparent (black) interior and a #00C389 green border about 0.4% thick, spanning the endpoint line of the YAML. Eye icon: white outline eye symbol centred in a solid #00C389 square block at the left of the highlight bar, about 4.5% wide and 7.8% high. Lighting: flat screen glow; dominant colours black, periwinkle blue, red, and green.
Slide 34
Visuals: One blurred, heavily pixelated screenshot of a dark code editor or terminal, shown as a tall rectangle filling the full slide height in the centre. Its content is low-resolution, with grey, pale yellow, olive, teal and cyan text lines in indented blocks running down the page, and a few small red, orange and green coloured squares at the top left. The top-left squares are about 5 px each. A green rectangular outline frames a horizontal band across the middle of the screenshot, with a green square tab on its left holding a white outline eye icon with a small ring at the centre. The eye icon is a stylised open eye, white stroke about 2 px, on a solid green square. Lighting is flat, with no shadows. Dominant colours are black, muted yellow, teal and the green highlight. The image is boxed with hard edges, not cropped and not full-bleed, and has no overlay other than the green highlight band.
Slide 35
apiVersion: monitoring.coreos.com/v1
kind: ServiceMonitor
metadata:
name: sm-example
namespace: opentelemetry
labels:
app.kubernetes.io/name: py-prometheus-app
release: prometheus
spec:
selector:
matchLabels:
app: my-app
namespaceSelector:
matchNames:
- opentelemetry
endpoints:
- port: prom
interval: 15s
apiVersion: v1
kind: Service
metadata:
name: py-prometheus-app
namespace: opentelemetry
labels:
app: my-app
app.kubernetes.io/name: py-prometheus-app
spec:
selector:
app: my-app
app.kubernetes.io/name: py-prometheus-app
ports:
- name: prom
port: 8080
ServiceMonitor &
PodMonitor API
Visuals: Two screenshots of YAML code in black terminal-style windows with three traffic-light dots at the top left (red, amber, green). Left window: a Prometheus ServiceMonitor manifest, lines as in the text field, monospace font, keys in pale green-white and values in yellow. Right window: a Kubernetes Service manifest with the same style. Teal-green (#00C896) rectangular outline highlights (about 3 px stroke, square corners) mark: on the left, the line 'app: my-app' under matchLabels (x 5.2%, y 52.3%, w 43.8%, h 4.2%) and the block 'namespaceSelector / matchNames / - opentelemetry' (x 5.2%, y 56.9%, w 43.8%, h 9.4%); on the right, the line 'namespace: opentelemetry' (x 55.2%, y 31.3%, w 43.8%, h 4.8%) and the line 'app: my-app' under selector (x 55.2%, y 51.6%, w 43.8%, h 4.8%). Four teal (#00C896) square tabs with white line icons sit at the left edge of each highlight group: on the left an eye icon badge (x 0.6%, y 52.2%, w 4.4%, h 12.0%) with a second 'eye' glyph above, on the right two eye badges (x 50.6%, y 31.3%, w 4.5%, h 7.9%) and (x 50.6%, y 51.6%, w 4.5%, h 7.9%). The Prometheus logo: orange-red (#E6522C) flame-in-circle mark. QR code: black modules on white, square.
Slide 36
apiVersion: monitoring.coreos.com/v1 / kind: ServiceMonitor / metadata: / name: sm-example / namespace: opentelemetry / labels: / app.kubernetes.io/name: py-prometheus-app / release: prometheus / spec: / selector: / matchLabels: / app: my-app / namespaceSelector: / matchNames: / - opentelemetry / endpoints: / - port: prom / interval: 15s / apiVersion: v1 / kind: Service / metadata: / name: py-prometheus-app / namespace: opentelemetry / labels: / app: my-app / app.kubernetes.io/name: py-prometheus-app / spec: / selector: / app: my-app / app.kubernetes.io/name: py-prometheus-app / ports: / - name: prom / port: 8080 / ServiceMonitor & / PodMonitor API
Visuals: Left: a screenshot of a black terminal window with three traffic-light dots (red, amber, green) at top left, showing a Kubernetes ServiceMonitor YAML file (apiVersion: monitoring.coreos.com/v1, kind: ServiceMonitor, metadata name sm-example in namespace opentelemetry, labels app.kubernetes.io/name py-prometheus-app and release prometheus, spec selector matchLabels app my-app, namespaceSelector matchNames opentelemetry, endpoints port prom and interval 15s). Keys are pale grey and values are yellow-green. The bottom two endpoint lines (- port: prom and interval: 15s) are outlined by two stacked teal rectangles and a teal eye-icon tab on the left edge with an open-eye and closed-eye glyph, marking them as highlighted. Right: a smaller screenshot of a black terminal window with the same three dots, showing a Kubernetes Service YAML (apiVersion: v1, kind: Service, metadata name py-prometheus-app in namespace opentelemetry, labels app my-app and app.kubernetes.io/name py-prometheus-app, spec selector app my-app and app.kubernetes.io/name py-prometheus-app, ports name prom with port 8080, partly obscured by the teal highlight). A single teal rectangle outlines the line '- name: prom' and extends to the right edge of the screenshot, with a teal eye-icon tab on its left side at the same height. Both screenshots are crisp rectangular boxes with no crop, no overlay other than the teal highlights, and are lit evenly with a flat dark-on-black colour scheme. Caption card: a light grey (#F2F2F2) rounded rectangle containing the Prometheus logo (an orange-red circle with a white flame and three white horizontal bars at its base) at left and a black QR code at right, both on the grey field.
Slide 37
metadata.name + / -collector / apiVersion: opentelemetry.io/v1alpha1 / kind: OpenTelemetryCollector / metadata: / name: otelcol / namespace: opentelemetry / spec: / mode: statefulset / targetAllocator: / enabled: true / serviceAccount: / prometheusCR: / enabled: true / app: my-app / config: | / receivers: / otlp: / protocols: / grpc: / http: / prometheus: / config: / scrape_configs: / - job_name: 'otel-collector' / scrape_interval: 30s / static_configs: / - targets: [ '0.0.0.0:8888' ] / target_allocator: / endpoint: http://otelcol-targetallocator / interval: 30s / collector_id: "${POD_NAME}" / ...
Visuals: Photograph-style screenshot of a dark code editor window, full height of the slide, placed at x 28.9%, y 0%, w 43.3%, h 100%, unframed and not rounded at the bottom. The window has three traffic-light dots at top left (red, amber, green) about 2% of slide width each. The code is monospace text: keys in white or light grey, values in yellow, and the receivers block in teal. A green eye icon (outline eye with pupil) sits in a solid green square at about x 24.3%, y 33.8%, w 4.6%, h 7.9%, with two green horizontal lines (about 0.3% thick) running from the square's right edge to the callout box, one at about y 34% and one at about y 38.4%. A callout label box with light grey fill #F2F2F2 and a red border (about 0.4% thick, #D0021B) sits at x 45.5%, y 31.5%, w 27.2%, h 8.5% and overlaps the code lines serviceAccount and prometheusCR. Dominant colours: black #000000 window, yellow #E8E84A values, teal #3FB8B0 keys, green #00C48C icon and lines. Lighting is flat; the image is slightly soft.
Slide 38
apiVersion: v1
kind: ServiceAccount
metadata:
name: opentelemetry-targetallocator-sa
namespace: opentelemetry
Target Allocator
Service Account
Configs
Visuals: Illustration: a screenshot-style dark code window with three traffic-light dots at its top-left (red, yellow, green, each about 1.1 percent of slide width, sitting in a row at about y 14 percent). Below the dots is YAML text in a monospace font: keys in pale mint green (#C8F0C8) and values in bright yellow (#F5E642). The window is flat, boxed, with small corner radius and no shadow. Icon: a small telescope-like tool with a key-shaped end, blue (#3E5FBF) body and orange (#F5A623) lens, parts and tip, on the light grey card at the left of the text. QR code: square black-and-white QR code, black modules on white, at the right of the card; its encoded content is not legible.
Slide 39
apiVersion: rbac.authorization.k8s.io/v1 / kind: ClusterRole / metadata: / name: opentelemetry-targetallocator-role / rules: / - apiGroups: ["monitoring.coreos.com"] / resources: / - servicemonitors / - podmonitors / verbs: ['*'] / - apiGroups: [""] / resources: / - namespaces / verbs: ["get", "list", "watch"] / - apiGroups: [""] / resources: / - nodes / - nodes/metrics / - services / - endpoints / - pods / verbs: ["get", "list", "watch"] / - apiGroups: [""] / resources: / - configmaps / verbs: ["get"] / - apiGroups: ["discovery.k8s.io"] / resources: / - endpointslices / verbs: ["get", "list", "watch"] / - apiGroups: ["networking.k8s.io"] / resources: / - ingresses / verbs: ["get", "list", "watch"] / - nonResourceURLs: ["/metrics"] / verbs: ["get"]
Visuals: Two screenshots of YAML Kubernetes ClusterRole rules, shown as dark terminal windows. Left: a macOS-style terminal window, black fill #000000, with three traffic-light dots at its top-left (red #FF5F56, yellow #FEBC2E, green #27C93F), showing the start of a ClusterRole manifest (apiVersion, kind, metadata name opentelemetry-targetallocator-role, rules) and its first two rule blocks. A teal highlight box (#00C896 border, about 6 px) with a white eye icon on a teal tab sits over the lower part of the left window, framing the monitoring.coreos.com rule and the namespaces rule. Right: a borderless black code panel with a teal border (#00C896, about 6 px) and a white eye icon on a teal tab at its top-left corner; the first line is clipped at the top edge of the panel and the content runs to the bottom edge. It lists the remaining rules as shown in the text. Code colours: keys and plain text in off-white #E8E8E8, string and name values in yellow #E6E04A, quoted strings and wildcard in cyan #2FB8C9. Both code blocks use a monospace font at about 39 px line pitch with no line numbers. Crop: the left window is shown whole with its rounded top corners; the right panel is cropped at top and bottom. Lighting is flat; no shadows or gradients.
Slide 40
apiVersion: rbac.authorization.k8s.io/v1 / kind: ClusterRoleBinding / metadata: / name: opentelemetry-targetallocator-rb / subjects: / - kind: ServiceAccount / name: opentelemetry-targetallocator-sa / namespace: opentelemetry / roleRef: / kind: ClusterRole / name: opentelemetry-targetallocator-role / apiGroup: rbac.authorization.k8s.io
Visuals: One illustration: a macOS-style terminal window rendered as a flat screenshot of a YAML file (832 by 616 pixels). The window is a solid black rounded rectangle with three traffic-light dots at its top left: red (#FF5F57), yellow (#FEBC2E) and green (#28C840), arranged horizontally, about 3% of the slide width apart. The code is monospace with keys in pale off-white-green (#D5EBD0) and values in bright yellow (#E8E82A). The lines read: apiVersion: rbac.authorization.k8s.io/v1; kind: ClusterRoleBinding; metadata:; name: opentelemetry-targetallocator-rb (indented); subjects:; - kind: ServiceAccount; name: opentelemetry-targetallocator-sa; namespace: opentelemetry; roleRef:; kind: ClusterRole; name: opentelemetry-targetallocator-role; apiGroup: rbac.authorization.k8s.io. Two highlight boxes in green (#00C896) with a 0.5% stroke outline the subjects block (lines 6 to 8) and the roleRef block (lines 9 to 12). Each highlight has a green tab on its left edge, about 4.4% of slide width wide, containing a white outline eye icon. The first tab sits beside the subjects block and the second beside the roleRef block; the two highlight boxes touch with no gap. The image is not cropped and is boxed, with no tint or gradient over the window itself.
Slides 41 to 54 continue in the full text file.
Download this deck
The hosted PDF of every library deck is free for readers of the SlideDeck Co newsletter. Join with your email and the viewer and download appear here.
Building a deck of your own? The SlideDeck Co Standard Deck is a slide library for business presentations: reviews, updates and plans.