
We review a deck against the job it has to do. Before judging a page we write down who the audience is, whether a speaker will be in the room, and what the audience should understand or be ready to do afterwards. The score follows from how well the deck does that job.
A useful review tells the author what works, what holds the deck back and which repair matters most. Steps 1 to 5 produce the presentation-quality score. Steps 6 to 10 are the further checks in a full review: the evidence, the idea, a proposed revision and testing with readers.
1. Write down the deck’s job before judging it.
Identify the audience, their existing knowledge, the setting and the intended outcome. A live pitch can rely on a speaker. A document sent ahead must carry more explanation. An investment exhibit may need considerable detail; an introductory product slide may need one clear demonstration.
Write one sentence: “After this presentation, this audience should understand or be ready to ___ because ___.” Say whether the deck is presented live or read alone. The label on the file is a hint. A file called a pitch deck may turn out to be a report that an investor reads at a desk.
A useful brief
Help shareholders assess the case for a US listing. They need to understand the operating exposure, investor base, valuation comparison and proposed next step. Judge the exhibits by how well they support that assessment.
Judge the deck against others that do the same job.
An earnings deck and a seed pitch succeed in different ways. Once the job is written down, we judge the deck with the questions for that kind of deck. They are questions to investigate. A deck can answer them without a slide named after each one.
| Kind of deck | What we ask |
|---|---|
| Early startup pitch | Can a stranger quickly grasp the product, why it matters, evidence that fits the stage, the team and the next milestone? We do not ask a young company for a mature company’s evidence. |
| Growth fundraising | Do traction, economics, distribution and use of capital connect into a credible next stage? Are the metrics defined on the page? |
| Sales deck | Can a buyer identify fit, trust delivery, weigh proof and limits, and see the commercial next step? |
| Investor reporting | Are actual results separated from plan and outlook? Are changes explained? Are exceptions and risks visible? Can a reader find the number they need? A celebratory summary that hides exceptions is a weakness. Dense exhibits that a reader can find their way around are appropriate here. |
| Investor day, strategy or fund deck | Is the thesis stated? Are targets distinguished from results? Are definitions comparable? Do the sections build on each other? |
| Keynote or conference talk | The slides support a speaker. Does each slide give the room one thing to look at? Does the sequence still make sense to someone reading it later? We do not mark a slide down for lacking words the speaker would say. We do note where the deck cannot be followed without the talk. |
| Explanation or education | Does it build an accurate mental model step by step, with mechanism and example before implication? |
| Culture or recruiting deck | Does it say something specific about how the company works that a candidate could act on, in a voice of its own? |
| Report-style document | Can a reader find things? Are the exhibits designed consistently? Is there a route through the material? |
Choose the checks that fit the slide’s job.
Classify each page from its content and context. “Our solution” might be a product demonstration or customer proof. Chart, table and photograph describe formats, not purposes. Give a mixed-purpose page one main role and add only the distinct checks its second role requires. Five examples:
| Purpose | Questions that matter |
|---|---|
| Introduction | Who is speaking, and about what? Why should this audience pay attention? Does the opening set the right expectation? An identity-only cover may leave the hook to the next page. |
| Problem | Who experiences it, when and how? What makes it consequential? Are current workarounds treated fairly? Can the problem be recognized independently of the proposed product? |
| Solution | What is the approach? How does it address that problem? What demonstrates the mechanism? Are the benefit, dependencies and limits clear, with intended outcomes distinguished from results? |
| Evidence | What does this example or metric establish? Are the source, comparison and definition appropriate? Does the claim stay within the evidence? A qualitative testimonial need not have a numerical baseline. |
| Ask or conclusion | What decision or understanding follows? Is the request proportionate to the evidence? Are the next step, owner, timing and conditions clear where needed? An educational conclusion need not request approval. |
For applicable checks, record Fails, Partial, Meets or Strong, with the observation behind the judgment. Mark missing inspection evidence Unassessed; use N/A for a requirement the job does not need. Neither is a zero. Identify essential checks rather than treating every detail as mandatory. These are examples from a wider catalog, not a compulsory pitch outline.
Nancy Duarte’s Big Idea approach connects an argument to audience stakes. Her Slidedocs work distinguishes a detailed visual document from a speaker-supported presentation.
2. Read the whole argument before changing a page.
Look at every available slide in order, including supplied notes, appendices and accompanying documents. Record the exact source, date and coverage. A partial reproduction cannot establish what the complete deck omitted. A historical presentation does not describe the company today.
For every page, identify its takeaway, evidence, dependencies and distinct contribution. What would the audience lose if it disappeared? Check neighboring pages before calling something missing. Read titles alone as a diagnostic, without requiring every cover or divider to make a claim.
Then assess the deck as a whole. Does it fulfill the opening promise and support the intended decision? Do explanations arrive before they are needed? Do repeated figures, terms and assumptions agree? Are the strongest reasons, material objections and next step prominent? Keep slides together when they explain or reinforce each other. Move a slide only when the new position helps the audience follow the argument.
Read the whole package before judging the ask. Trian’s Solventum letter names the forthcoming February long-range plan, three-year targets, incentives and capital-allocation priorities. Those requests give shareholders a clear subject for discussion. Endorsing its valuation outcome requires more evidence than requesting an operating review does. Historical analyst and peer exhibits need not each contain a downside scenario; the concluding investment case does need to address downside.
Assess timing against the meeting, leaving room for discussion, demonstrations and decisions. A divider and a financing exhibit need different allowances. Label timing planned estimate, measured rehearsal, measured delivery or not assessed. Slide count and word count are not a rehearsal. A read-ahead needs navigable explanations and references; an optional template library needs no duration score.
3. Read pages at the size the audience will see them.
A sheet of thumbnails shows sequence, rhythm and consistency. It also shrinks every label, so it cannot show whether the type is too small. We look at every page in order on contact sheets, then read a spread of pages at full size: the first slide, pages that carry the main exhibits, and others spaced evenly through the deck. A finding about legibility, small type or label size has to come from a page read at full size.
On those pages, check type size, contrast, spacing, alignment, image quality and reading order. Look for clipped text, overflowing boxes and labels that are hard to read. Check that charts and tables have baselines, labels and units. Put related facts close enough to compare, and make the most important information easy to find. Across the deck, check that fonts, colors and imagery fit a consistent identity, with enough variation to distinguish different kinds of content.
A strong slide can reveal a pattern, explain an unfamiliar process or give the audience a memorable example. Name the design choice that makes it work: a mechanism made visible, an analytical insight, a dense exhibit that is easy to find your way around, a distinctive identity. “Clean” and “polished” describe a baseline and say little about whether the slide helps someone understand the point.
Organize useful detail before deleting it. A financial exhibit may need many figures to make a fair comparison, and that density suits a reader at a desk. Preserve distinctive imagery, company identity and voice when they help explain the subject. Choose a simpler layout when it makes the information easier to use.
A well-known company or a successful outcome says nothing about how well its deck communicates. A dated visual style alone does not fail a deck that does its job.
Garr Reynolds explains how contrast, repetition, alignment and proximity clarify relationships, crediting Robin Williams’s design teaching. He also distinguishes useful simplicity from oversimplification.
4. Score from the decisive strength and the decisive weakness.
The presentation-quality score is a whole number from 1 to 10. Ask which strength does most for this deck’s job and which weakness limits it most, and set the score from those two. We do not average dimensions, count defects or grade on a curve. Good typography does not cancel a failure in something the job depends on.
| Score | What the score means |
|---|---|
| 1–2 · Ineffective | Fails the basic communication task or cannot be used. |
| 3–4 · Ineffective | Missing logic or illegible pages prevent effective use. |
| 5–6 · Needs substantial work | The core can be recovered with substantial revision. At 5 the audience would struggle to get the main point. At 6 they get it despite the deck. |
| 7 · Effective | Competent and usable for its job. Consequential weaknesses remain. |
| 8 · Strong | Clear purpose and disciplined execution throughout. Worthwhile improvements remain and none blocks the job. |
| 9 · Excellent | Exceptional for its job, with no unresolved material defect in the pages inspected. The reviewer can name what sets it apart from a competent deck of the same kind. |
| 10 · Benchmark | A rare reference example for its job, given only with a stated comparison to other decks of its kind. |
A seven needs a named weakness.
Seven is where an undecided reviewer lands. Before settling on it, name the one consequential weakness that keeps the deck from 8 and the strength that keeps it from 6. If no consequential weakness can be named, the deck is not a 7. If the main point is hard to get, it is not a 7 either.
State confidence with the score.
- High: the observations that set the score are directly visible on pages read at full size, and at least a quarter of the pages were read at that size.
- Medium: the observations are visible, but their consequence depends on an assumption about the audience or setting, or fewer than a quarter of the pages were read at full size.
- Low: the deck’s purpose is uncertain, or the observations rest on contact sheets alone.
A score is not a probability of success. Use “not assessable” when essential evidence is missing.
What a Deck Library score covers
Each Deck Library entry carries one score, for presentation quality, made with steps 1 to 5. It does not rate the ask, the evidence or the merit of the idea, and we do not verify a deck’s claims for a library entry. Library reviews are written by an AI reviewer that follows this rubric, and SlideDeck Co publishes them.
As of 13 November 2026 the library holds 338 reviewed decks, and their mean score is 6.82. One deck scores 9, Tesla’s 2020 Battery Day keynote. Another 54 decks score 8, 193 score 7, 67 score 6, 19 score 5 and 4 score 4. No deck has a 10 and none scores below 4.
By kind of deck, the 187 reporting decks average 6.95, the 62 conference talks 6.82 and the 33 investor pitch decks 6.24. The statistics page recalculates these figures on every publish run.
A full review goes further. It scores how well each slide fulfills its purpose and gives separate deck-level verdicts for presentation quality, ask quality, metrics and evidence, and idea merit. A high average cannot rescue an argument that depends on a false premise. Checklist counts do not translate directly into scores or percentage improvements. For idea merit, explain whether the proposal is flawed, plausible or well supported for its audience and stage. Give template usability and file delivery their own verdicts.
Ask another reviewer to inspect the brief and the deck without seeing earlier ratings or a preferred winner. Resolve disagreements by returning to the slides and sources. Agreement between reviewers, including AI reviewers, does not establish how an audience will respond.
5. Write down the reasons.
Lead with the strength and the weakness that set the score, in three to five sentences. Then answer five questions in a sentence each:
- Why not a point higher? The weakness that keeps the deck from the next score up.
- Why not a point lower? The strength that keeps it from the next score down.
- What should be preserved? The choice a revision must not lose.
- What is the most useful repair? One change, with slide numbers.
- What would change the score? The check or assumption that could move it.
Refer to slides by number and quote figures exactly as shown. For each important finding, identify the page, explain what you observed and why it matters, recommend a change, and say how to check it. Make clear whether you found an error, made a judgment about communication or expressed a preference. Prioritize the changes that matter most to the audience.
Give specific feedback in plain language.
Use plain language, remove clutter and preserve the author’s voice. Keep substantive facts, qualifications, humor and useful technical terms. Replace vague praise with the decision that makes the slide work; replace vague criticism with a concrete repair.
Vague
Improve clarity and make the data more compelling.
Useful
Keep both shareholder lists and all 50 rows. Align the names, holdings and status columns, then recalculate the marked holdings under one stated rule. Check that the revised table preserves every row and its coverage note.
Read the feedback aloud. Cut inflated praise, abstract criticism and qualifications that repeat a point already made. Each recommendation should tell the author what to do.
6. Check the evidence and the idea it supports.
A chart can be correctly drawn and still compare the wrong things. Check periods, units, denominators, definitions and reporting bases. Keep actual results, forecasts, targets and fictional examples distinct. A logo, demonstration and customer quotation establish different things.
Recalculate central totals, signs, rounding, weights and subset relationships. Nested markets cannot be added; annual margins cannot be summed from quarterly margins. Preserve the original artifact when it contains a discrepancy. Label recalculated figures, retain the source’s coverage limits and say when a definition is unknown.
Compare related figures across pages. Annual growth rates, their average and compounded growth measure different things. Check periods, reporting boundaries and restatements before replacing a number. If a forecast heading and footnote name different years, consult the underlying estimates. If peers use different accounting standards, check whether the difference affects the comparison.
Check geometry too. Bars normally need zero because length represents magnitude. Lines, dots and floating intervals can use a narrower, clearly labeled range. Determine what the marks encode before applying a rule.
Solventum: make the margin comparison proportional.
Trian, January 2025 · deck page 7 (bundle page 15) · independent proposed revision
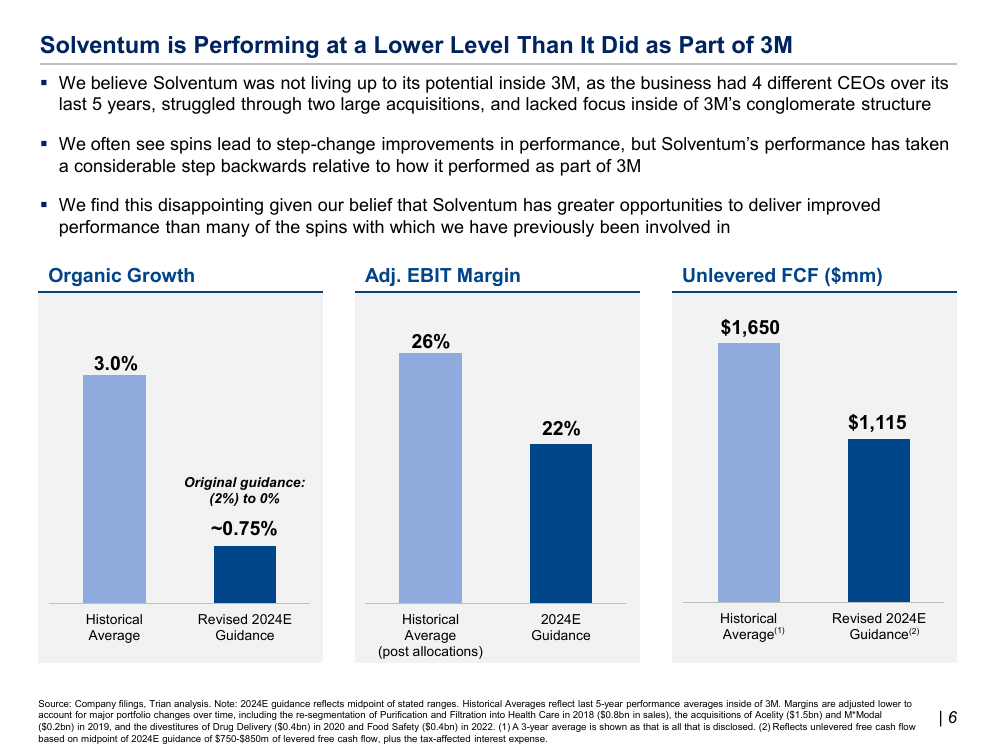
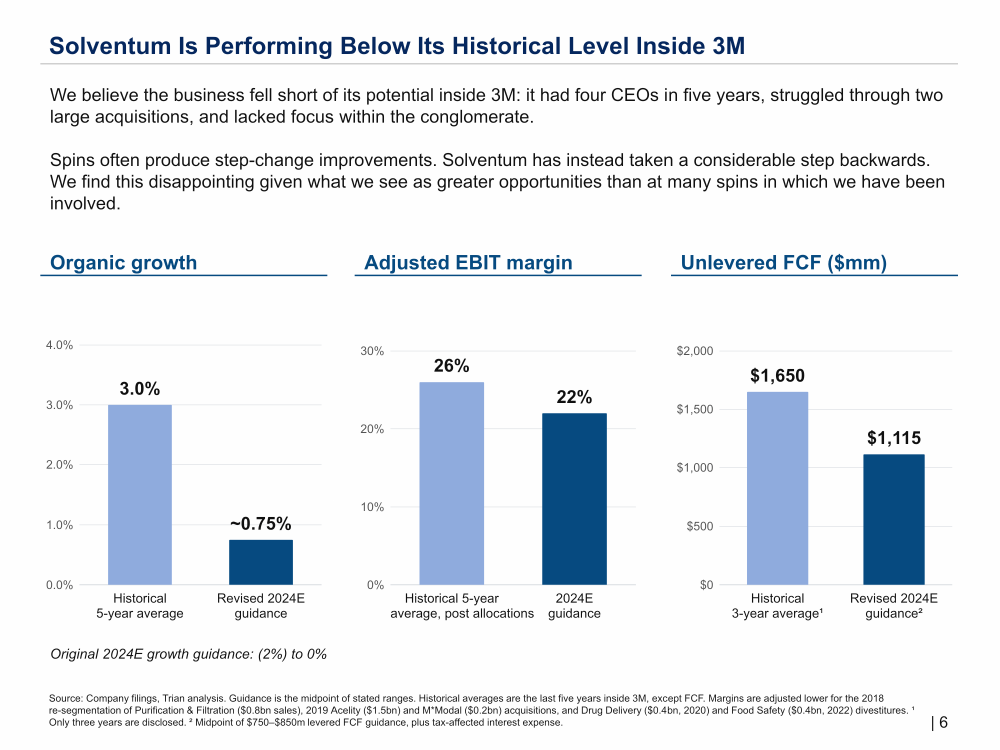
The revision puts the margins on an explicit, proportional scale. The original’s printed 26% and 22% values are much closer than their bar lengths suggest. The new bars show that difference accurately.
Verify the claims that matter to the decision.
Check important claims against outside evidence, preferably primary sources. Check the exact entity, measure, period and scope, including conflicting evidence. Record the source, publisher, publication date, data period, access date and claim status. Historical reviews use evidence available at the deck’s date; later results belong in a separately dated assessment.
Distinguish a checked fact from company reporting, an uncorroborated assertion, an assumption, a reviewer inference and an unresolved or contradicted claim. A filing can verify what a company reported without independently proving product superiority or causation. Reconciled arithmetic does not verify its inputs. An inaccessible source leaves a claim unverified; it does not make it false.
Quote or paraphrase the author’s claim accurately before testing it. Give the author credit for qualifications already on the page. A top-holder list establishes who appears on that list; absence does not establish zero ownership or underweighting. A valuation multiple proposed for one segment needs a calculation covering the other operations, costs and debt before it can support a whole-company equity value.
Read the footnotes behind comparison tables. A blanket cross may conceal an important exception. Compare companies separately when their records differ, and label group figures used as estimates for a segment. Distinguish a margin change from an unstable margin. A successful listing precedent can show that a move is feasible, but a simultaneous merger makes it hard to isolate the listing’s effect on returns.
Axalta: check what the EBITDA figures measure.
Trian’s Axalta comparison uses adjusted figures for the same year. To judge what their difference says about savings, compare the analyst’s definitions with the company’s disclosure.
| 2011 measure | What the source supports |
|---|---|
| Trian’s $339m and $568m | Trian-adjusted comparability measures, not two directly reported EBITDA figures. Their $229m difference is valid arithmetic; it does not by itself establish that $229m of costs disappeared or remained at DuPont. Trian’s February 2015 reconciliation, pp. 70–72. |
| Axalta’s own disclosure | $411.1m EBITDA and $570.1m adjusted EBITDA. A separate $91.7m net adjustment comprises $333.5m allocated costs less $241.8m estimated standalone costs. Actual costs could differ materially. Axalta’s August 2014 S-1, pp. 19–20. |
These calculations have different scopes: $91.7m is neither a substitute for $229m nor proof that Trian’s broader reconstruction is false. The analogy gives a reason to examine allocations and replacement costs. Solventum’s potential savings still need their own calculation. This is a same-year comparison, not achieved year-on-year growth. The acquisition closed in February 2013, so 2011 was also not the last full year under DuPont.
Assess whether the idea has merit.
Is the problem worth solving, and is there a credible explanation of how the proposal would solve it? Why choose it over the alternatives, including doing nothing? Examine demand, adoption, feasibility, execution, costs and benefits. State the strongest objection and the assumption most likely to change your conclusion. An early venture, a service proposal and an investment at a stated price need different kinds of evidence.
In Solventum, large parent allocations justify investigation but do not quantify avoidable expense. The countercase is that necessary services, supply arrangements and reinvestment absorb the apparent savings. Trian already acknowledges transition costs and uses a pro forma standalone margin baseline; the missing calculation is how operating changes would produce net savings, cash and earnings. Solventum’s November 2024 filing describes replacement-cost uncertainty; its March 2024 investor-day slides disclose a roughly $100m supply-cost risk in 2027. These are company disclosures, not independent validation of either side’s strategy. Trian’s $140 scenario relies on both earnings recovery and a higher valuation multiple; $9.33 × 15 ≈ $140 checks the multiplication, not the outcome.
Michael Alley’s assertion-evidence approach connects messages with supporting visual evidence. Edward Tufte’s analytical-design teaching emphasizes comparison, explanation and reasoning about evidence.
7. Compare the original and proposed slides.
Before redesigning, identify the problem, the intended benefit and the parts worth keeping. Compare a screenshot of the actual original with a finished proposed slide at equal size. Read both in the context of the surrounding deck. The proposal should be ready for a presenter to use.
Judge the design and the argument separately. Check whether the revision makes evidence easier to read, preserves important relationships and fits the surrounding slides. Keep reviewer questions and research requests in the review rather than placing them inside the company’s presentation.
- Correction: a factual, logical or numerical error, or a confirmed technical failure is repaired. Its importance depends on the consequence.
- Communication gain: a relevant relationship or argument becomes easier to inspect, for a stated reason. This remains an editorial judgment until tested with readers.
- Conditional alternative: the versions serve different tasks. Explain when to use each.
- No gain or regression: keep the original or make a narrower change.
When the original wins
ValueAct’s 2012 range chart makes relative return targets easy to compare during a talk. A table supports exact-number lookup in a document, but loses that immediate visual comparison. We retain the chart for the presentation and offer the table as an optional exhibit for readers who need the figures.
If the revision loses something important, fix that loss or keep the original. Sometimes a small edit is enough.
8. Test a template with replacement content.
A template is a product someone must use. Evaluate the teaching material, editable starter, filled example and finished presentation separately. The buyer should know what to replace, how to choose a layout and which assumptions the example makes.
Try plausible content in representative pages: a longer title, uneven category names, negative financial results, a different denominator and images with different proportions. Check what overflows, crops, stops adding up or leaves a placeholder behind. Check the filled slide as carefully as the empty layout.
NextView: give the product explanation usable space.
Seed-pitch template, 2024 update · source PDF page 3 · independent proposed revision
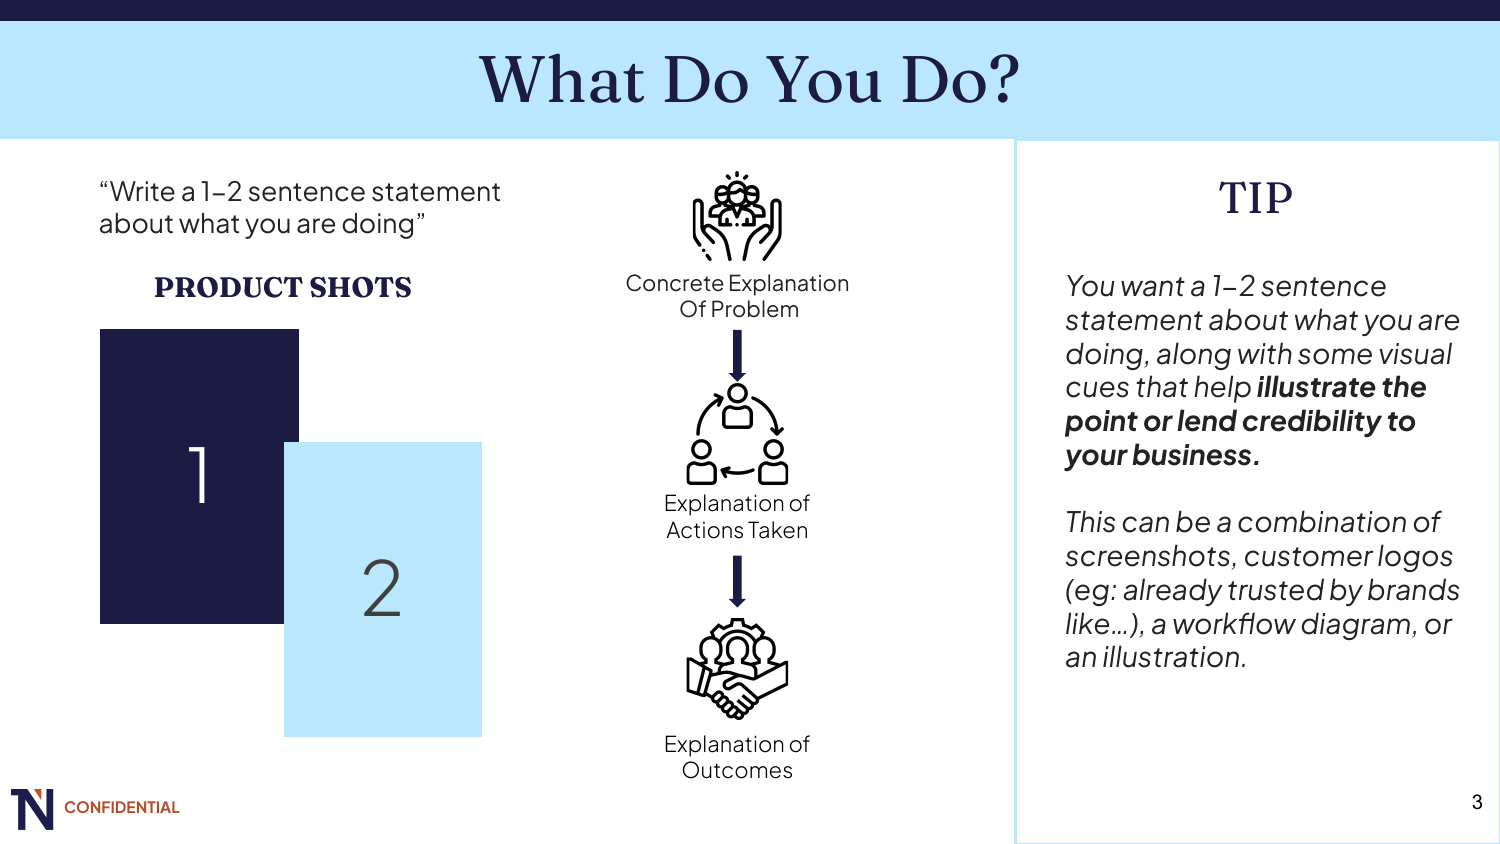
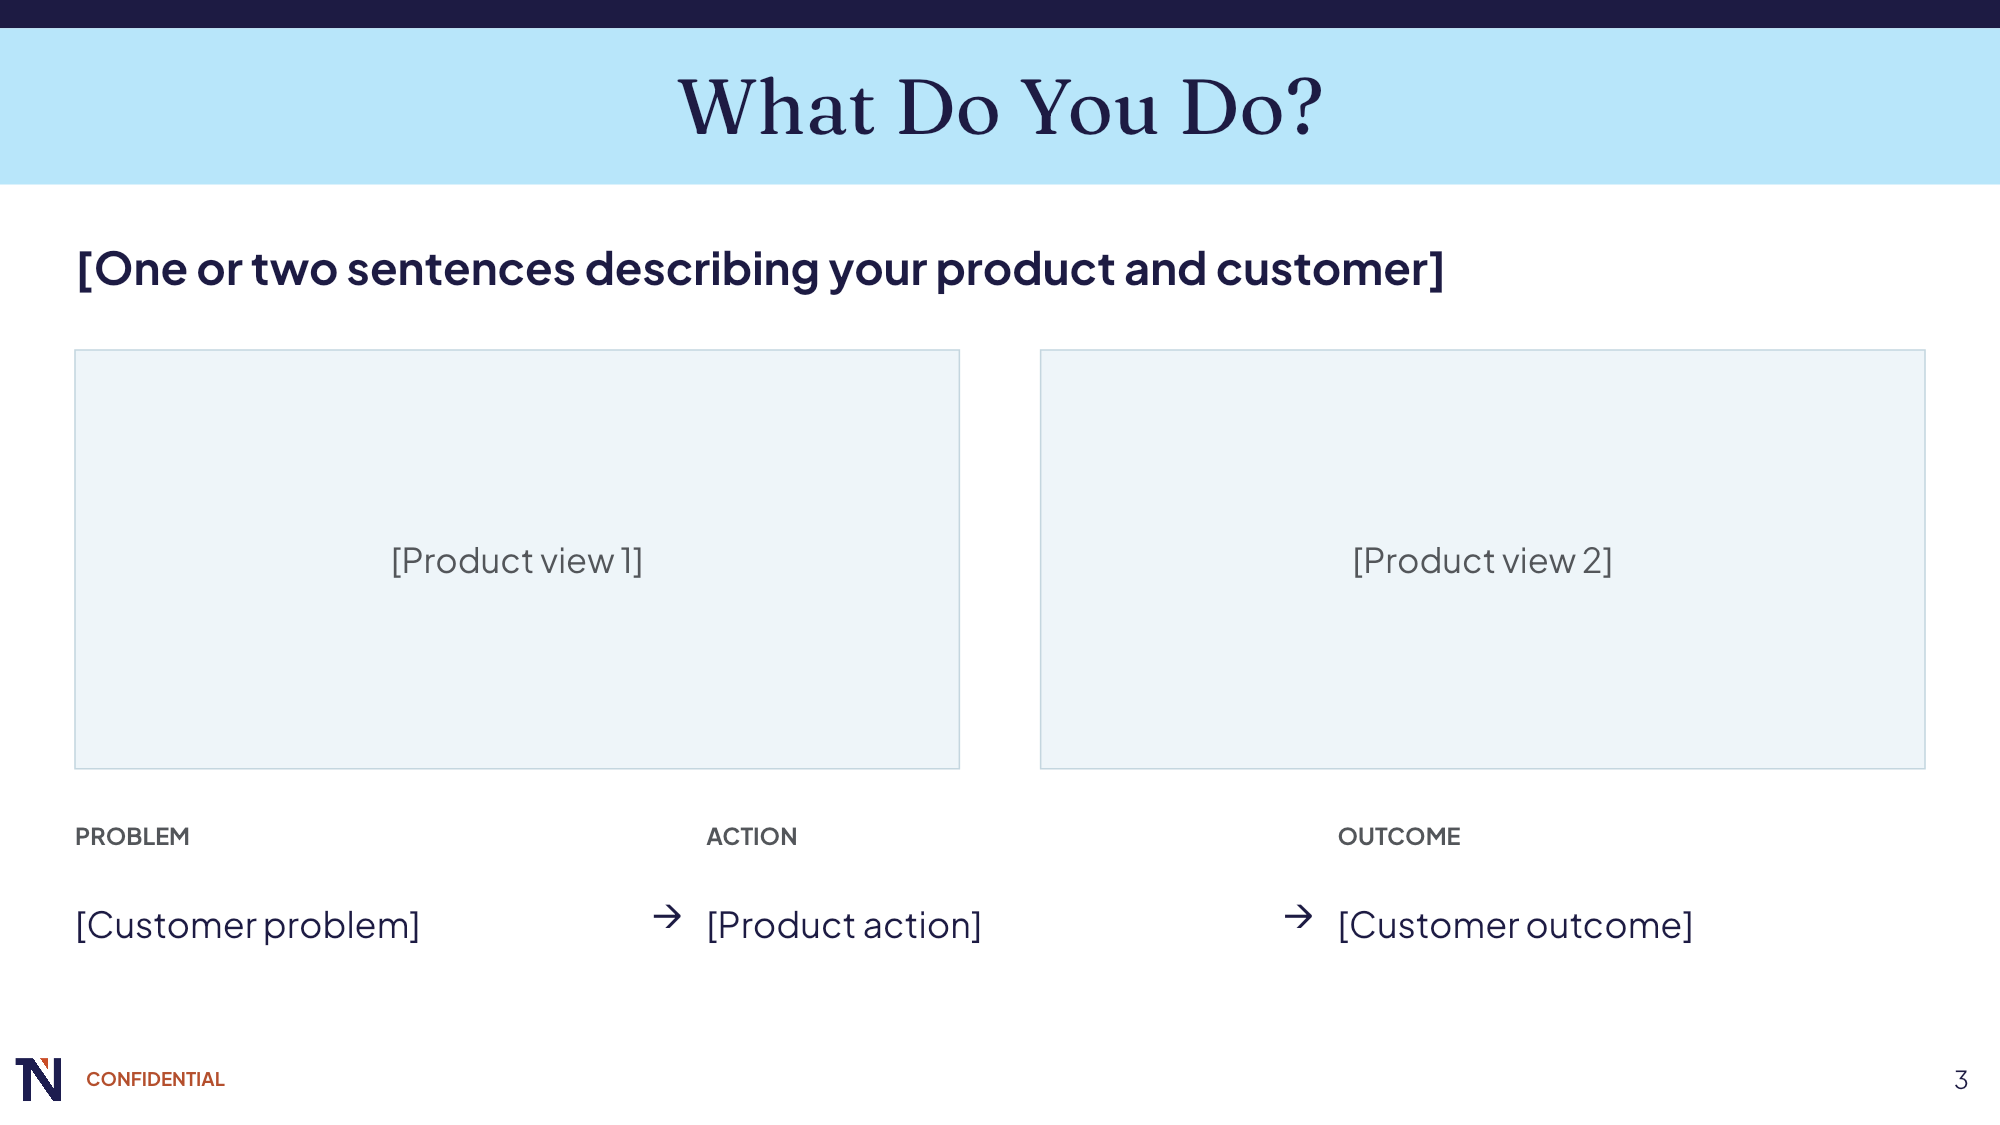
The two product views no longer overlap, and the explanation follows one direction. Teaching advice remains available in notes and a companion guide. The layout was checked with longer text and different image proportions. Keeping the instructions accessible is part of making the template useful.
Fill financial templates with realistic figures and check the calculation from revenue through EBITDA to net income. Test transparent images too: placeholder text can remain visible behind them. These checks reveal problems that an empty layout can hide.
Test editing and delivery separately: open the actual exported file, replace text and images, edit table or chart data, refresh links when used, and inspect the resulting export. Check the customer download and copy permissions when reviewing a sold product. State the app and operation tested; a screenshot cannot certify PowerPoint, Keynote or Google Slides compatibility.
9. Apply the method to real decks.
These examples draw on 209 pages across three investment presentations and two template products. We inspected every available original page before selecting changes. The complete comparisons retain the unchanged pages so readers can judge each proposal in context.
- Trian / Solventum, January 2025, 17 pages. Proportional comparisons and clearer target-versus-result labels improve selected exhibits. The Axalta example shows why reporting definitions matter. Most pages and the argument remain intact. Primary letter and presentation bundle; the 17-page deck begins on bundle page 9.
- Trian / Ferguson, November 2019, 23 pages. The shareholder table keeps all 50 rows, corrects its subtotals and distinguishes top-holder overlap from underownership. The investment assessment examines the valuation and expected-return questions separately. Archive PDF; the historical primary PDF link no longer resolved during this review.
- ValueAct / Jeff Ubben, October 2012, 26 pages. Selected criteria and growth-driver exhibits become more readable. The range-chart alternative remains conditional. This is an investment-philosophy conference presentation, not an authenticated LP fundraising memorandum. Archive PDF.
- NextView seed-pitch template, 17 pages. The proposed slides separate the product views, label market-sizing assumptions and organize the financial results. Teaching instructions remain available in a guide. A buyer-criteria table is offered as an alternative to the original positioning map. Author’s article and download; the linked PDF identifies itself as the 2024 update.
- Mark Nold’s High Impact Documents v1.0, 126 pages. The library is evaluated as optional tools, with attention to KPI denominators, phase labels and the arithmetic and units in worked mining examples. This is a template product, not a consulting engagement deck. Author’s article and files.
Ferguson: correct the subtotal and the claim.
Trian, November 2019 · source PDF page 11 · independent proposed revision
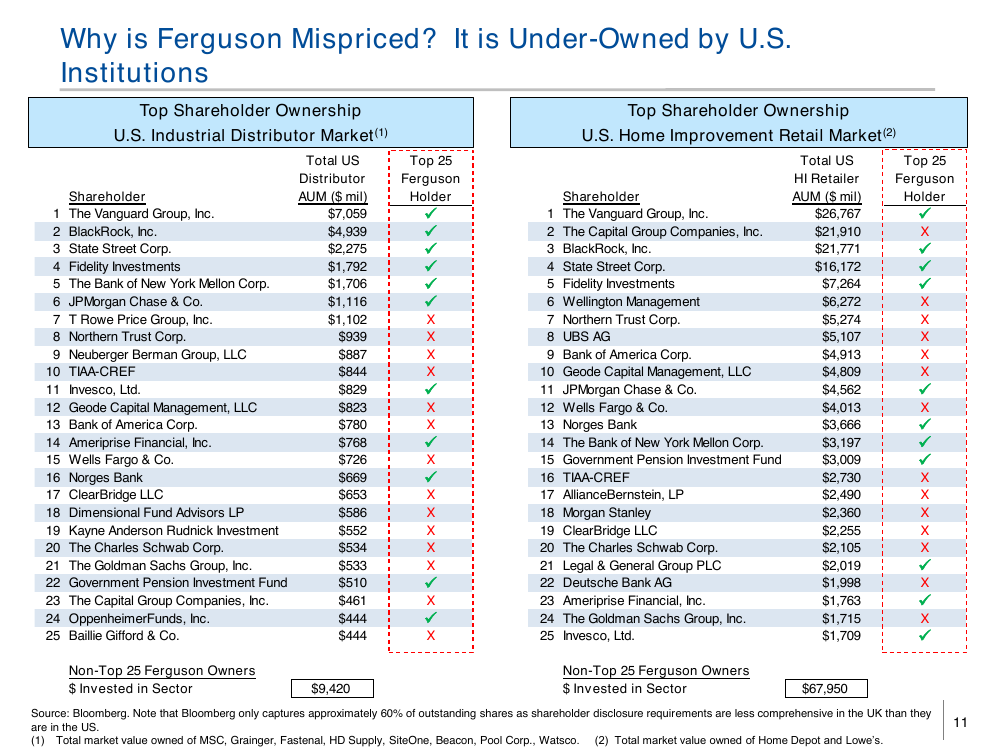
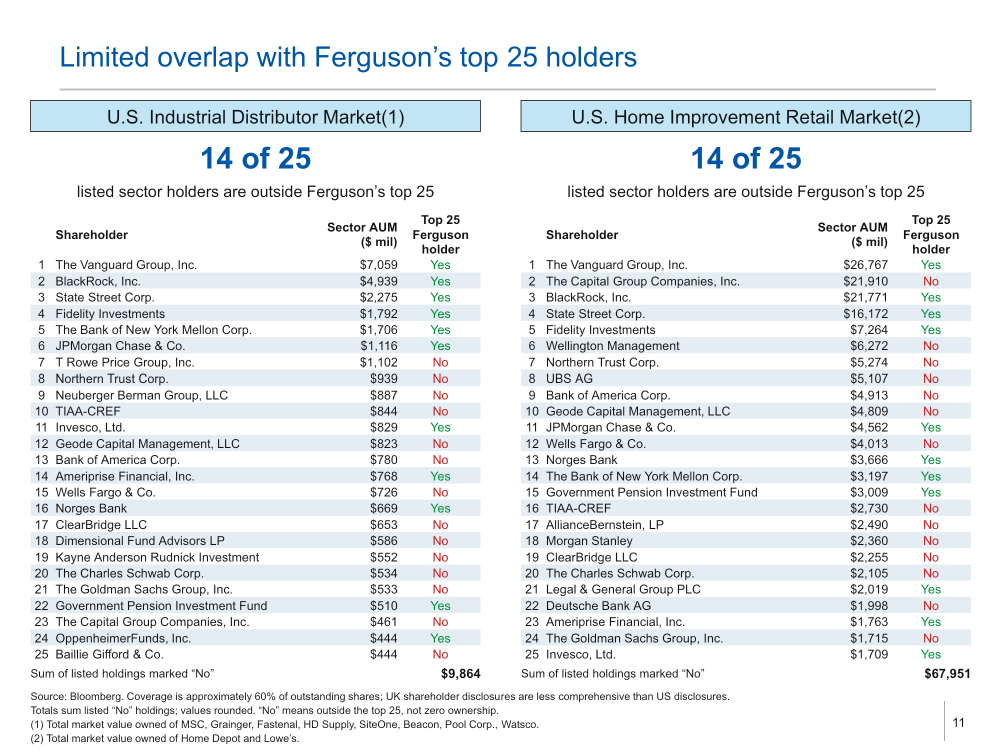
The revision retains all 50 rows. The 14 marked industrial holdings total $9,864m, compared with the original’s $9,420m; the retail total is $67,951m, compared with $67,950m. The headline describes overlap with Ferguson’s top 25 holders. “No” means outside that list, not zero ownership. The sums use the displayed, rounded inputs, and the source covers approximately 60% of shares. These checks do not verify Bloomberg’s underlying holdings or establish underweighting or future demand.
Mark Nold: make the KPI denominator explicit.
High Impact Documents v1.0 · source page 70 · independent proposed revision
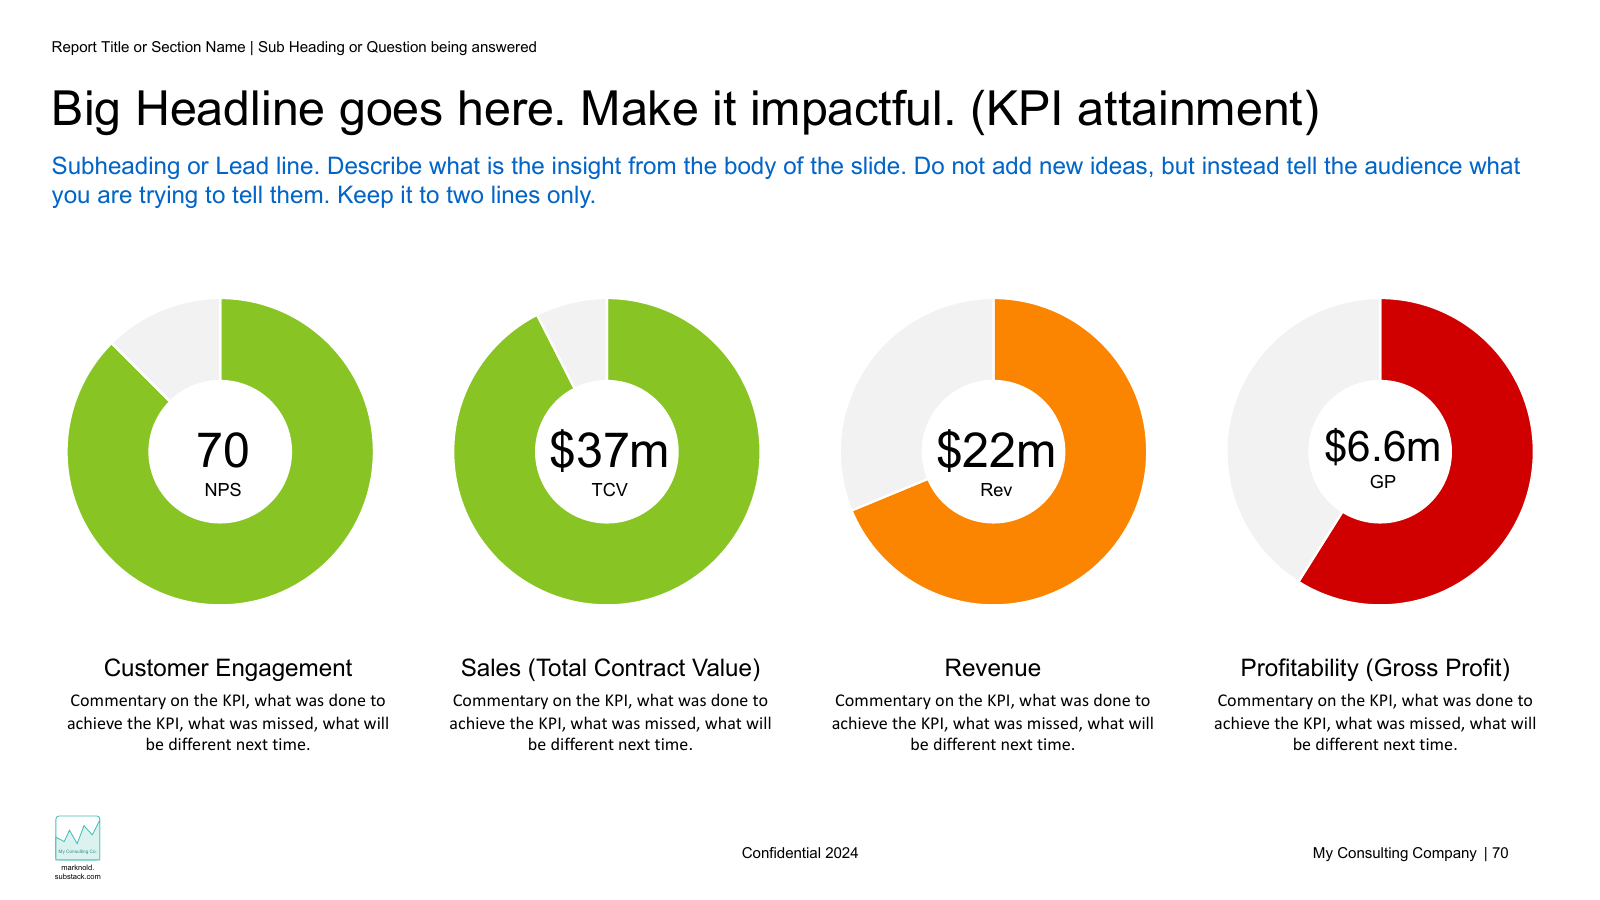
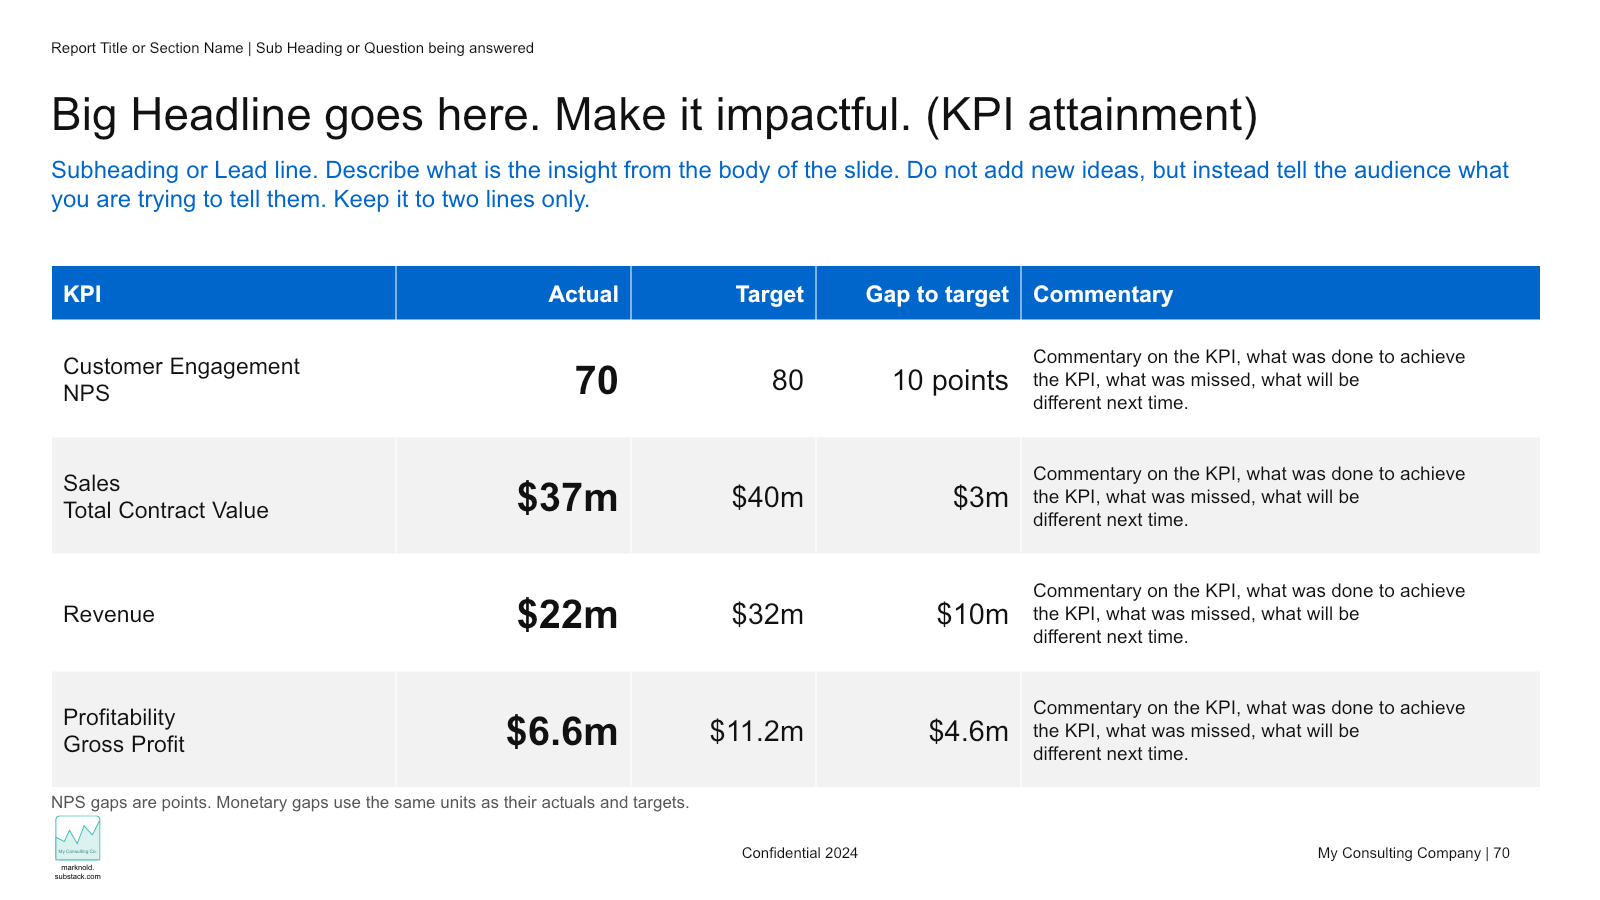
The table separates the current result, the target and the gap to target. The original ring needs to make clear what counts as 100%. The example remains fictional template content. Original template by Mark Nold; adaptation by SlideDeck Co under CC BY 4.0, subject to separately credited third-party assets.
Some findings require more research. In ValueAct, the category definitions behind a revenue-mix exhibit’s components and headline percentages remain unclear. Another exhibit calls real estate a relative bargain without showing the other financial assets used for comparison. A layout change cannot supply that missing information.
In the complete comparison PDFs, replacement pages are images and their text cannot be searched or selected. Editable proposed slides are supplied separately as PowerPoint files. Export and reimport checks were completed; native PowerPoint, Keynote and Google Slides behavior was not tested for these examples. NextView’s separate guide preserves the teaching advice but requires the user to consult another file.
Solventum: distinguish potential savings from a savings model.
The deck and shareholder letter make a case for reviewing operations and setting clearer targets. Assessing the proposed $140 outcome requires a model of net savings, reinvestment, earnings and downside. The assessment uses information available by 8 January 2025; later performance is a separate question.
Ferguson: test the investment case beyond the layout.
The 23-page deck presents a coherent case for investigating a US listing. Its scale and operating record give the idea merit as a research proposal. A return estimate needs further support. Checking 19 material claims against information available by 14 November 2019 identifies four questions that matter:
- Do the growth figures reconcile? Page 17’s 7.4% five-year CAGR implies about 43% cumulative growth, while page 9 prints 37%. Contemporary annual figures plausibly reproduce the CAGR; their sum is close to 37%. The historical definitions remain unresolved. The calculation flags a discrepancy; it does not establish that 43% should replace 37%. Ferguson’s 2018 results presentation, p. 9 and 2019 annual report, pp. 26–27 and 118 provide part of that reconstruction.
- Are the peer comparisons fair? Fastenal reported 2,227 branches; the deck’s own footnote acknowledges its branch model. Home Depot’s reported five-year gross margins stayed within 34.0–34.3%, weakening the combined margin label for Home Depot and Lowe’s. Separate the businesses and account for reporting changes. Fastenal’s 2018 report; Home Depot’s FY2018 filing.
- Which estimates support the valuation? CY2020 headings conflict with CY2019 footnotes. The dated consensus inputs were unavailable. The 17.2x argument also concerns blended branches, not an established whole-company target or share-price return. The source estimates and a valuation of the remaining operations are needed to resolve those questions.
- Does the investment work if the valuation multiple stays flat? Ferguson’s scale and operating history support further investigation, but the growth slowdown disclosed before the talk must also be considered. A US listing might improve access; the analysis must account for possible selling, transition costs and index conditions when estimating net demand. Test whether the investment works with slower earnings and partial or no increase in its valuation multiple. Ferguson’s October 2019 results presentation; Signet’s 2008 circular on listing-transition risks.
To assess the expected return, put valuations on a common year and accounting basis, define the segments consistently, and show how a demerger would affect costs, debt and equity value. Include a conservative earnings case. Those calculations allow the reader to judge the return; a cleaner chart cannot supply them.
10. Test improvements with readers.
Source checks, recalculations, visual inspection and app tests answer different questions. To find out whether a revision helps people understand, decide or act, test it with the intended audience.
When a measurable audience benefit matters, use representative readers and tasks drawn from the brief. For example: identify which margin improved, explain the product’s mechanism, distinguish a target from a result, or replace the chart data and produce a usable slide.
Use equivalent tasks and vary which version people see first so the first attempt does not teach the answer to the second. Record correct answers, wrong inferences, completion time and the conditions of the test. For templates, record whether users can finish the replacement task and recover from common changes. Report the sample size and uncertainty.
The examples in this guide are based on slide inspection, source and calculation checks, replacement-content exercises and fresh AI-assisted critique. They have not been tested with readers. Ratings express editorial judgment; they do not establish measured improvements in comprehension, decisions or business results. Apply each example to its stated audience and purpose.
- The complete available original has been inspected and its source identified.
- The audience task and the original’s strengths are explicit.
- The proposed version preserves the facts and important relationships.
- The comparison shows a useful gain, a correction, a conditional alternative or a reason to keep the original.
- The author knows which few changes matter most and what remains unresolved.
- Editorial judgments, tested behavior and measured audience outcomes are reported separately.
Sources and independence.
Duarte, Alley, Reynolds and Tufte provide useful guidance on audience, argument, visual organization and evidence; their work is linked above. Kevin Hale’s YC pitch-deck guidance is also useful for founder presentations; its selected examples are not complete source decks for this study.
Original authors retain their rights. Proposed slides are independent adaptations for analysis, not official revisions or endorsements. The complete private comparison files identify the sources, preserve unchanged pages and distinguish editable proposed slides from PDF-only originals. We do not present those source decks as SlideDeck Co products.
SlideDeck Co sells presentation templates and publishes reviews of real company decks. Our reviews identify the source material, explain our recommendations and disclose what was tested. Found an error or a better source? Let us know.
The Standard Deck and the Private Equity Deck were built with this checklist in mind. Six guides apply it to specific slides and sequences: executive summary slides, a business review presentation, a client recommendation deck, a services proposal deck, a private equity fund presentation, and editing a template with AI.

