
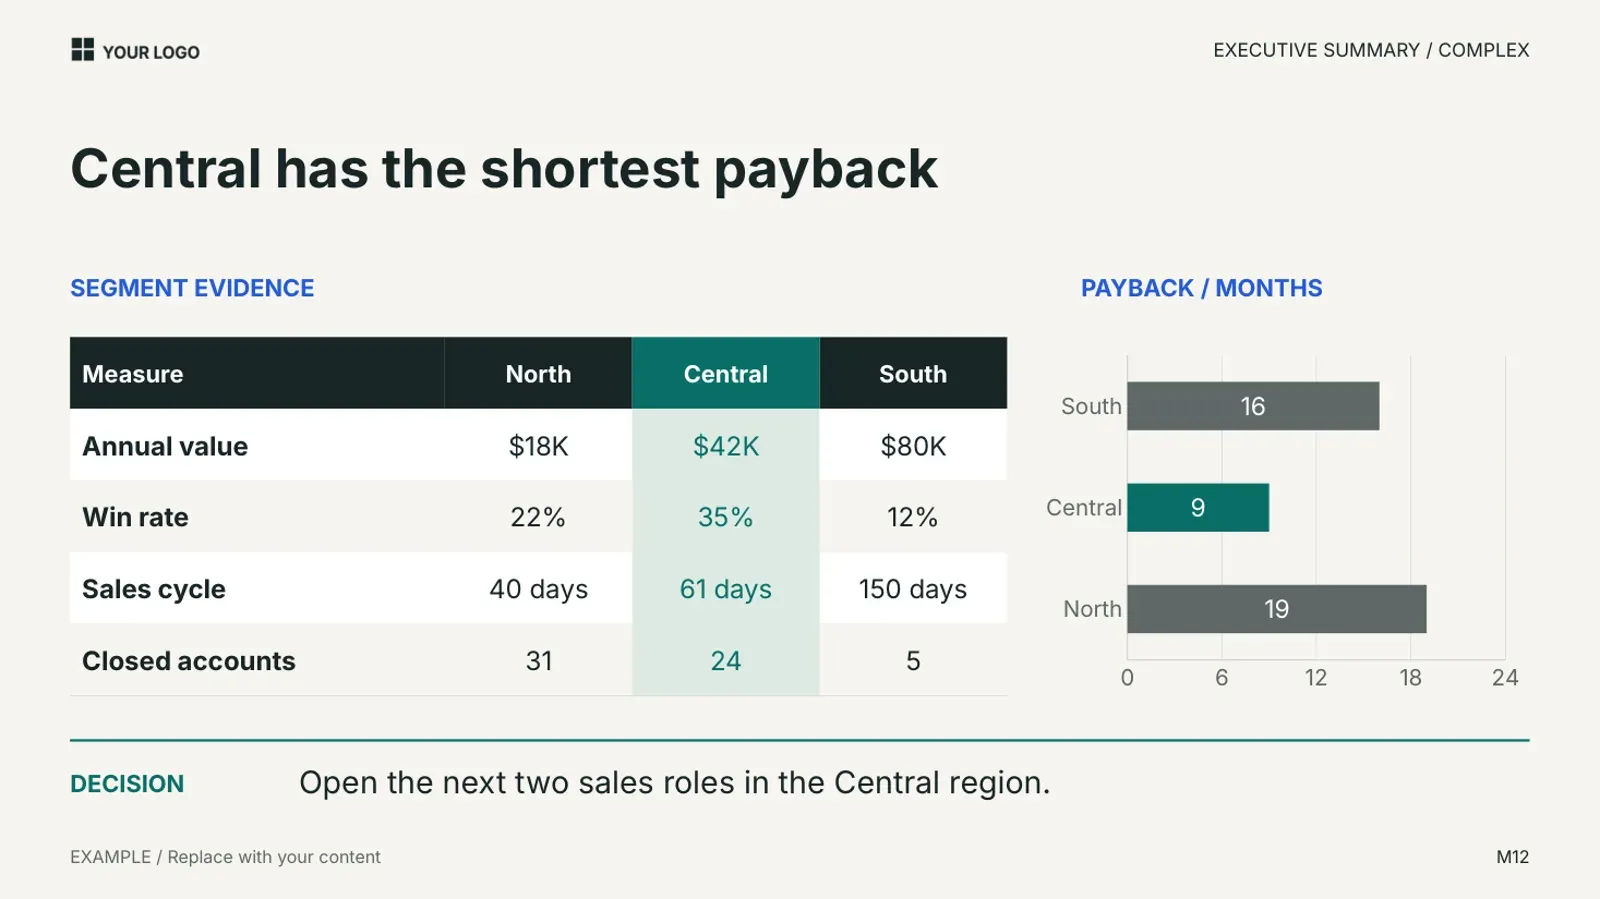
Can an AI change the content of a designed slide without breaking the design? We ran one exact test on one slide and kept everything: the request, the tool and its version, the date, the before and after renders, what the tool did, and what still needed a hand. The answer is yes for this slide, with three habits that made the difference and two checks you still do yourself.
The test
| File | SDC-Standard-Deck-2.2-Sample.pptx, the free three-slide sample from the Standard Deck page. Slide 2, the complex executive summary layout (M12): a headline, a four-column table, a native bar chart and a decision line. |
|---|---|
| Tool | Claude (Fable 5.1) running in Claude Code, writing and executing python-pptx 1.0.2 code against the file. No slide add-in; the AI edited the file directly. |
| Date | 7 November 2026 |
| Request, verbatim | Replace the three customer segments with three regions (North, Central, South). New values: annual value $18K/$42K/$80K, win rate 22%/35%/12%, sales cycle 40/61/150 days, closed accounts 31/24/5, payback 19/9/16 months. Headline: Central has the shortest payback. Decision: Open the next two sales roles in the Central region. Keep every font, size, color and position as it is. |
| Render | Both files rendered to PDF and PNG with LibreOffice through the same script, with the deck's Inter font installed, so the two images are comparable to each other. PowerPoint for Mac may place line breaks slightly differently. |
Before and after
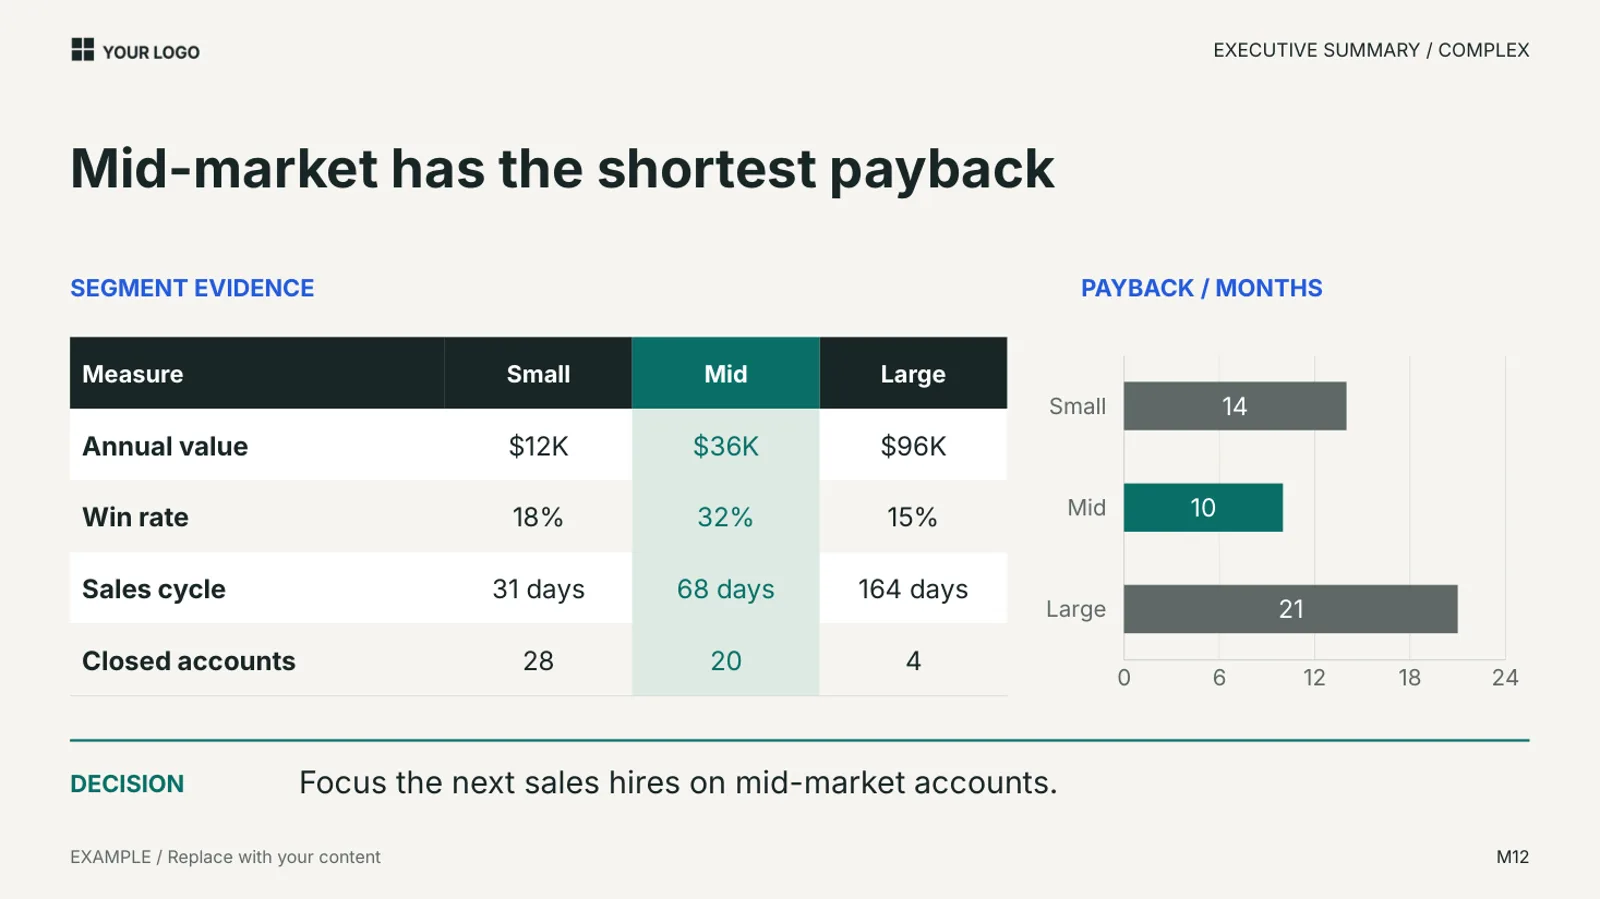
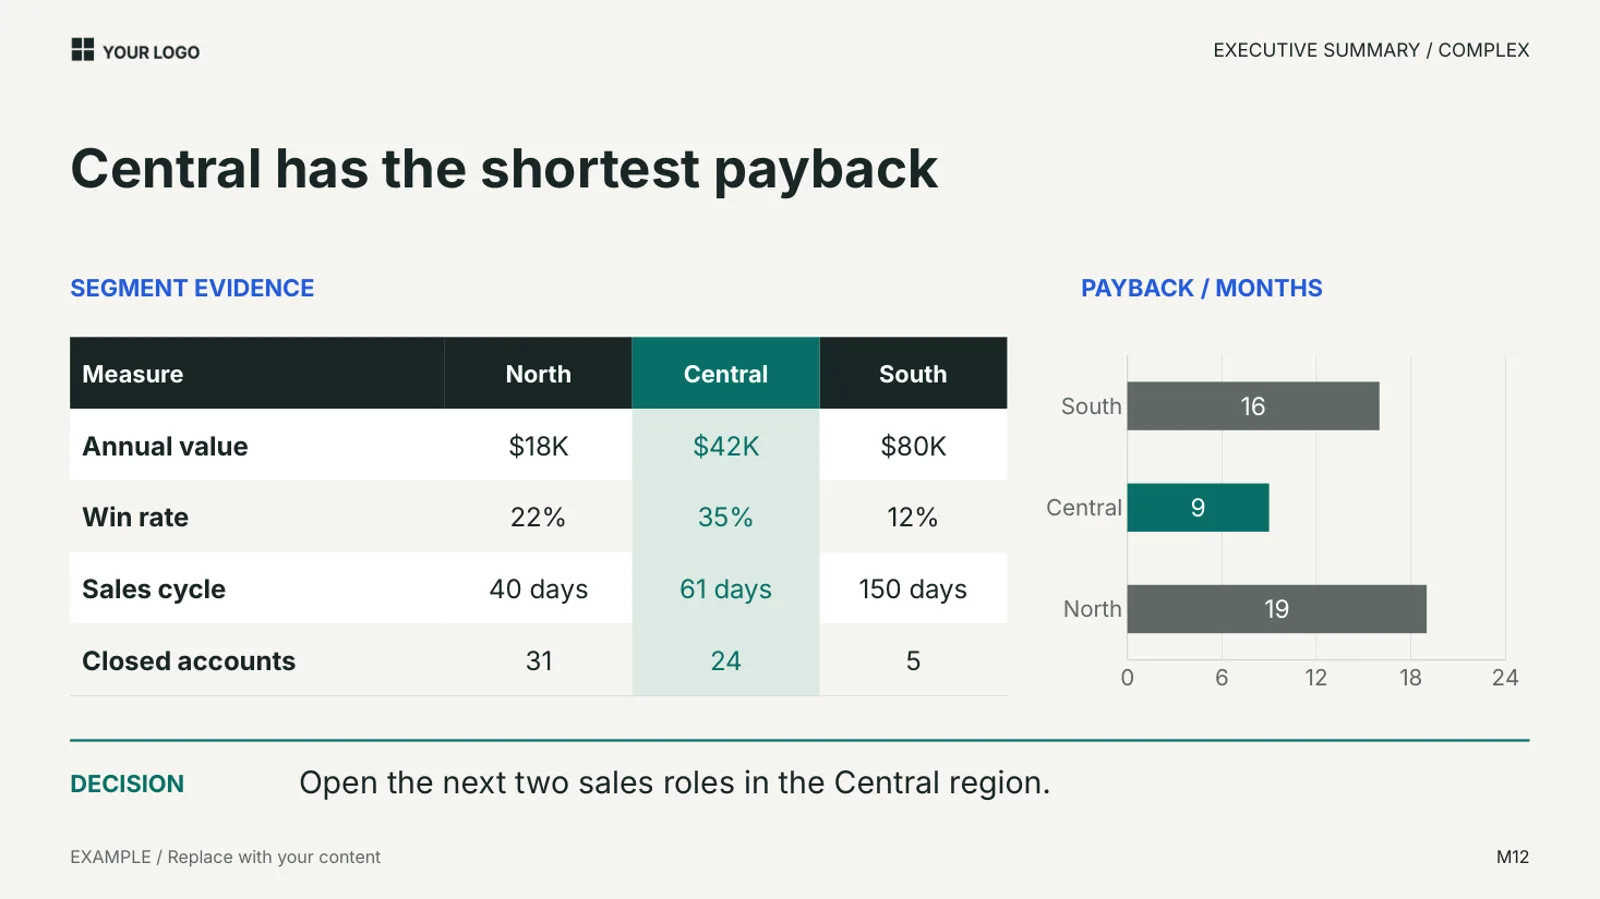
What the AI did, step by step
- Headline and decision line. It replaced the text inside the existing first text run of each box rather than replacing the box's text. That is the difference between keeping the weight, size and color and losing them: setting a text box's text wholesale resets the run formatting to the paragraph default.
- Table. The table has a header and four measure rows; the request supplied four measures for the table and one for the chart, so no rows were added or removed. Each cell was edited the same way, first run only. The shaded "Central" column kept its fill because the fill belongs to the cells, not to the text.
- Chart. The payback chart is a native chart, so the AI replaced its data (three categories, one series) instead of drawing bars. The highlighted middle bar stayed highlighted because that formatting is attached to the second data point, and Central is still second. Had Central been moved to first position, the highlight would have landed on the wrong region.
- Nothing else was touched. No shape moved, no size changed, no slide was added.
What needed a human
- Chart order. The original chart listed the categories in reverse order (Large, Mid, Small, so that Small reads at the top of a horizontal bar chart). The edited chart reads North, Central, South from the top. Both are readable; a person decides which order matches the story.
- Series name. The original series had no name; the AI gave it one ("Payback"). No legend is shown on this layout so nothing changed visibly, but on a layout with a legend it would have.
- Line breaks. The decision line grew from 50 to 52 characters and still fits on one line. A longer sentence would wrap, and the AI did not check that. You read the rendered slide for wrapping; it does not.
- The numbers themselves. The AI typed what it was told. Whether $42K and 35% are right is your job, exactly as it would be with a human editor.
Three habits that preserve the design
- Ask for text to be replaced inside the existing runs, not for text boxes to be rewritten. If your tool cannot do that, expect to re-apply bold, size and color by hand.
- Ask for chart data to be replaced, never for a chart to be recreated. Recreated charts lose point formatting, axis settings and fonts.
- Keep the table shape the same, or say explicitly how many rows and columns the result should have. Adding a row to a designed table almost always needs a manual height fix.
When it is easier to edit by hand
When you are changing fewer than ten values, PowerPoint, Keynote or Google Slides is faster than writing the request. When a layout needs a different number of rows or series, do that change by hand first and let the AI fill the values afterwards. When the slide has images to swap, do it yourself; the AI cannot see whether a crop looks right.
Limits of this test
One slide, one tool, one date. A different tool, a different version of the same tool, or a slide with grouped shapes or SmartArt could behave differently. The sample slide uses Inter and the render had it installed; a machine without the font substitutes another and line breaks move. We will repeat the test when either the deck or the tool changes and keep the log alongside the guide.
Try it on the same file
The slide in this test is in the free sample on the Standard Deck page, so you can run the same request through your own tool and compare. Every layout in the Standard Deck carries editing notes in the speaker notes, which is also where you tell an AI what each placeholder is for.
Guides use the SlideDeck Co decks as their examples. See the six decks.

