
This is a walk through the worked example that ships with the Consulting Deck: a 15-slide strategic recommendation for Cedar ServiceWorks, a fictional facilities maintenance company. Every number in it is synthetic and the slides say so. What the example shows is how a recommendation deck gets from a client's question to a decision the sponsor can sign, and which supporting files do the work behind each slide.
The question the deck answers
The engagement starts from a one-page client brief. Cedar's revenue grew from $10.0m to $12.0m between 2024 and 2025 while direct contribution margin fell from 31.0% to 29.2%. The sponsor can commit one implementation lead for six months and hire at most six technicians in the first year. The brief asks the team to compare three growth investments (planned maintenance contracts, installation projects, and improvements to reactive dispatch), recommend one, estimate its contribution and say what evidence would make the client change course. It also fixes the decision criteria and their weights before any analysis begins.
That last part matters. When the criteria are agreed in the brief, the recommendation slide later in the deck is a result of the client's own rules, not the consultant's taste.
Slide 2: the recommendation first
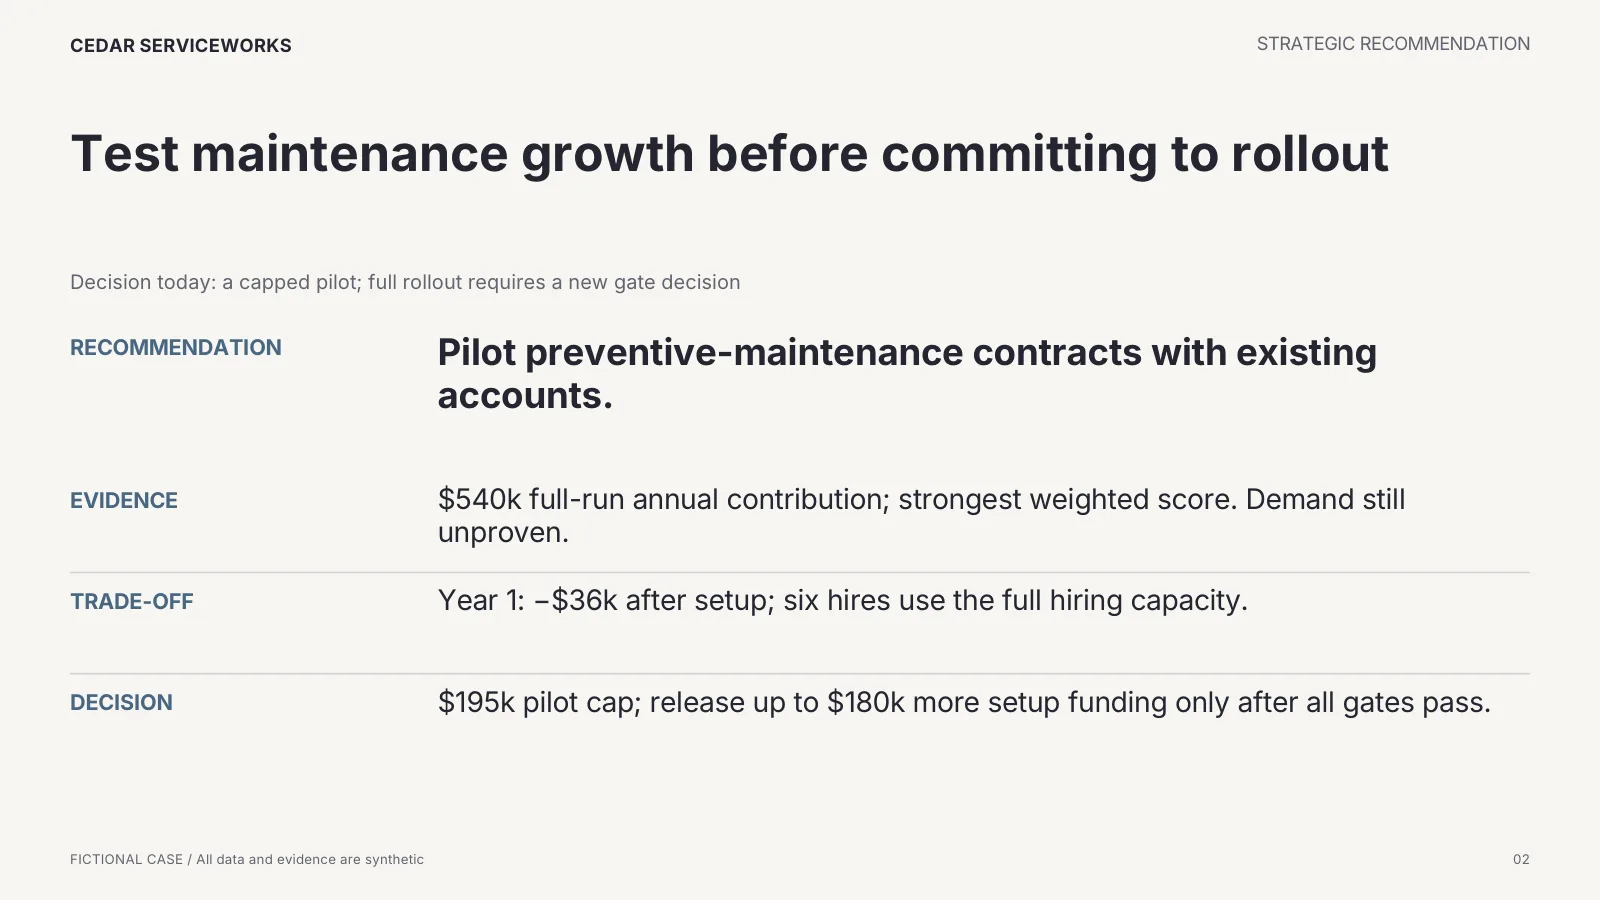
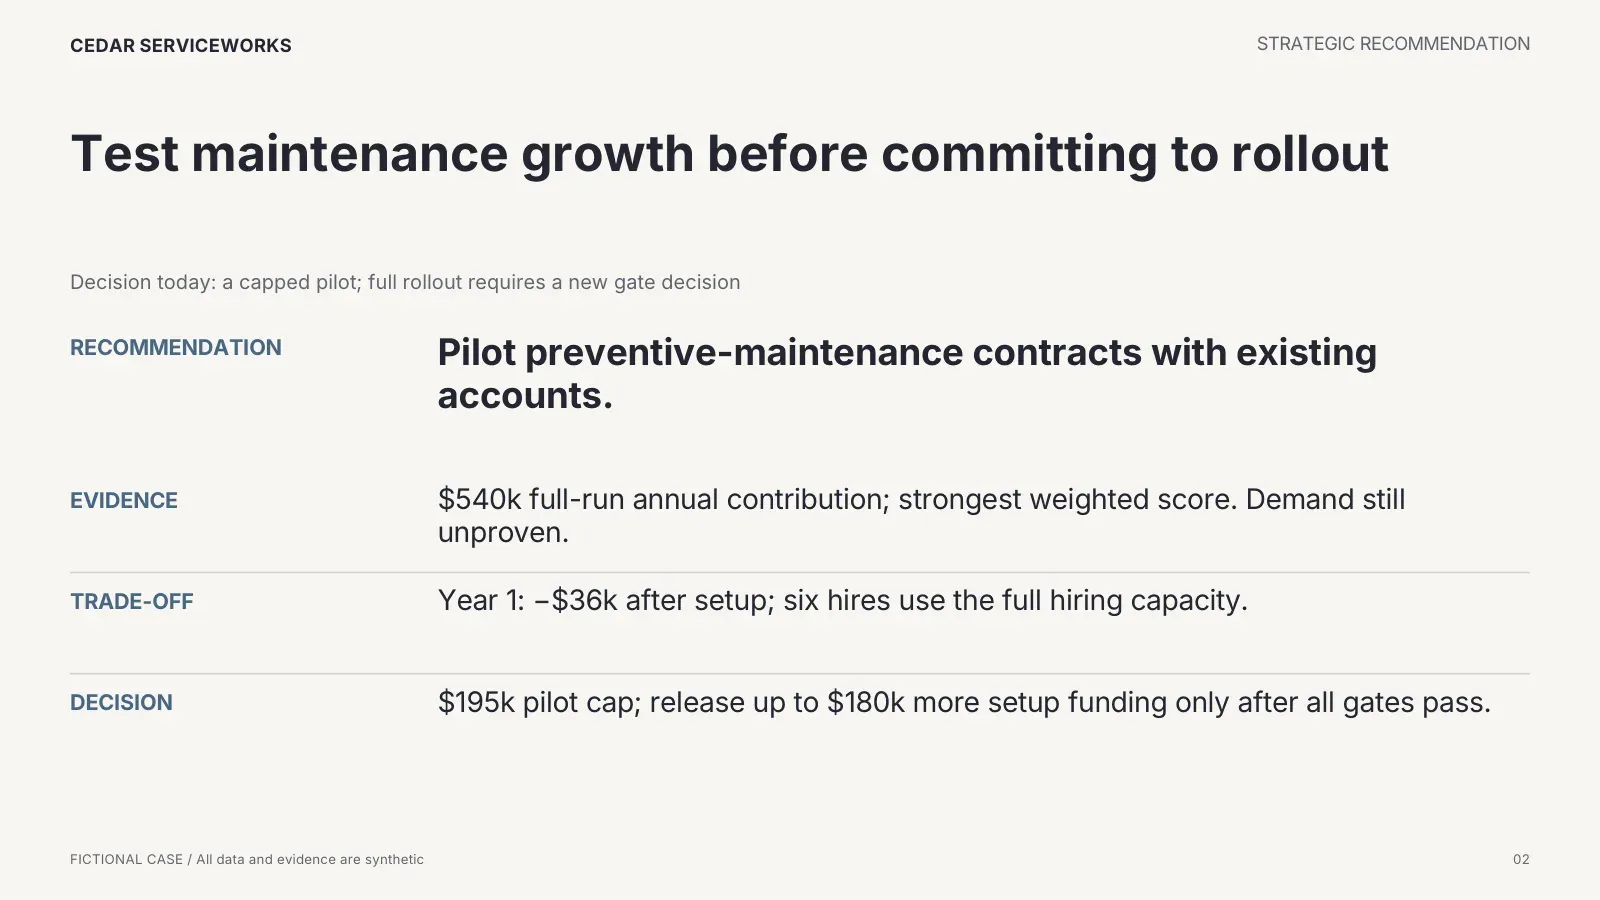
The second slide is the whole deck in one page: pilot preventive maintenance contracts with existing accounts; the modeled full-run contribution is $540k a year with the strongest weighted score; demand is still unproven; Year 1 is negative after setup; the decision today is a $195k capped pilot, with full rollout requiring a new gate decision. A sponsor who reads nothing else knows what is being asked and what it costs.
Slide 3: the decision frame
Before the evidence, the deck states what is being decided and what must be protected: one growth investment, chosen among three mutually exclusive routes; reactive on-time arrival stays at or above 88%; one implementation lead and at most six hires. These constraints come straight from the brief and they reappear as risk triggers on slide 13.
Slides 4 and 5: what the history and the customers say
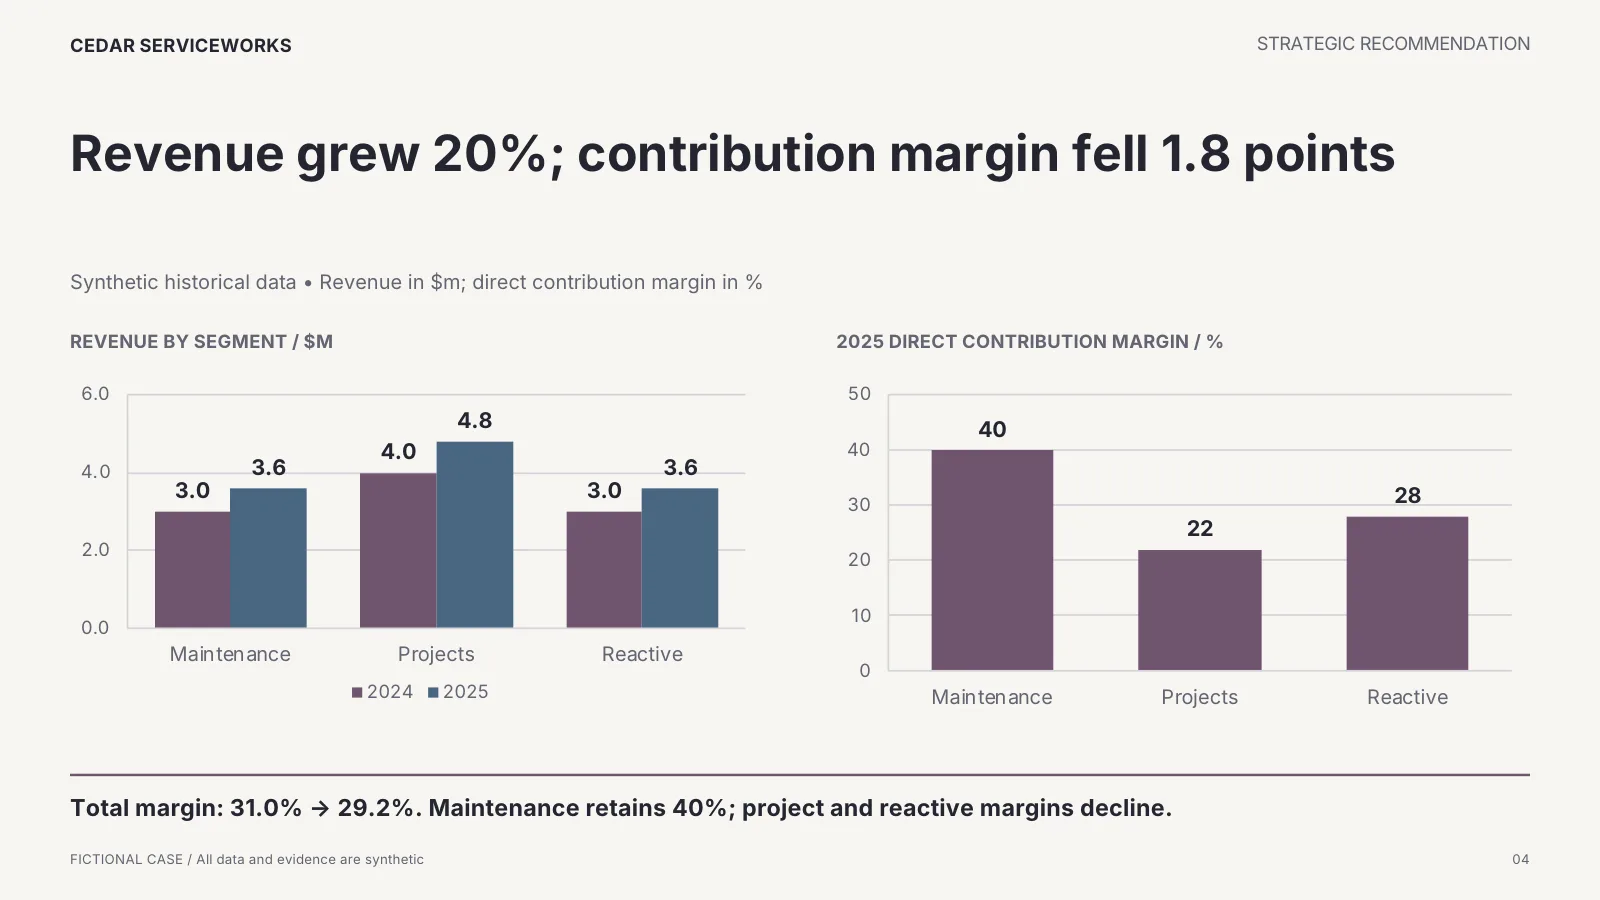
Slide 4 shows revenue by segment and direct margin by segment for two years. The headline is the finding, not the chart title. Slide 5 summarizes ten synthetic customer interviews in a three-column table: what the evidence is, what it supports, and what is still unknown. The honest column is the third one. "Willingness to pay $40k" is unknown, and that gap is what the pilot is designed to close.
Slides 6 to 8: the options and their economics
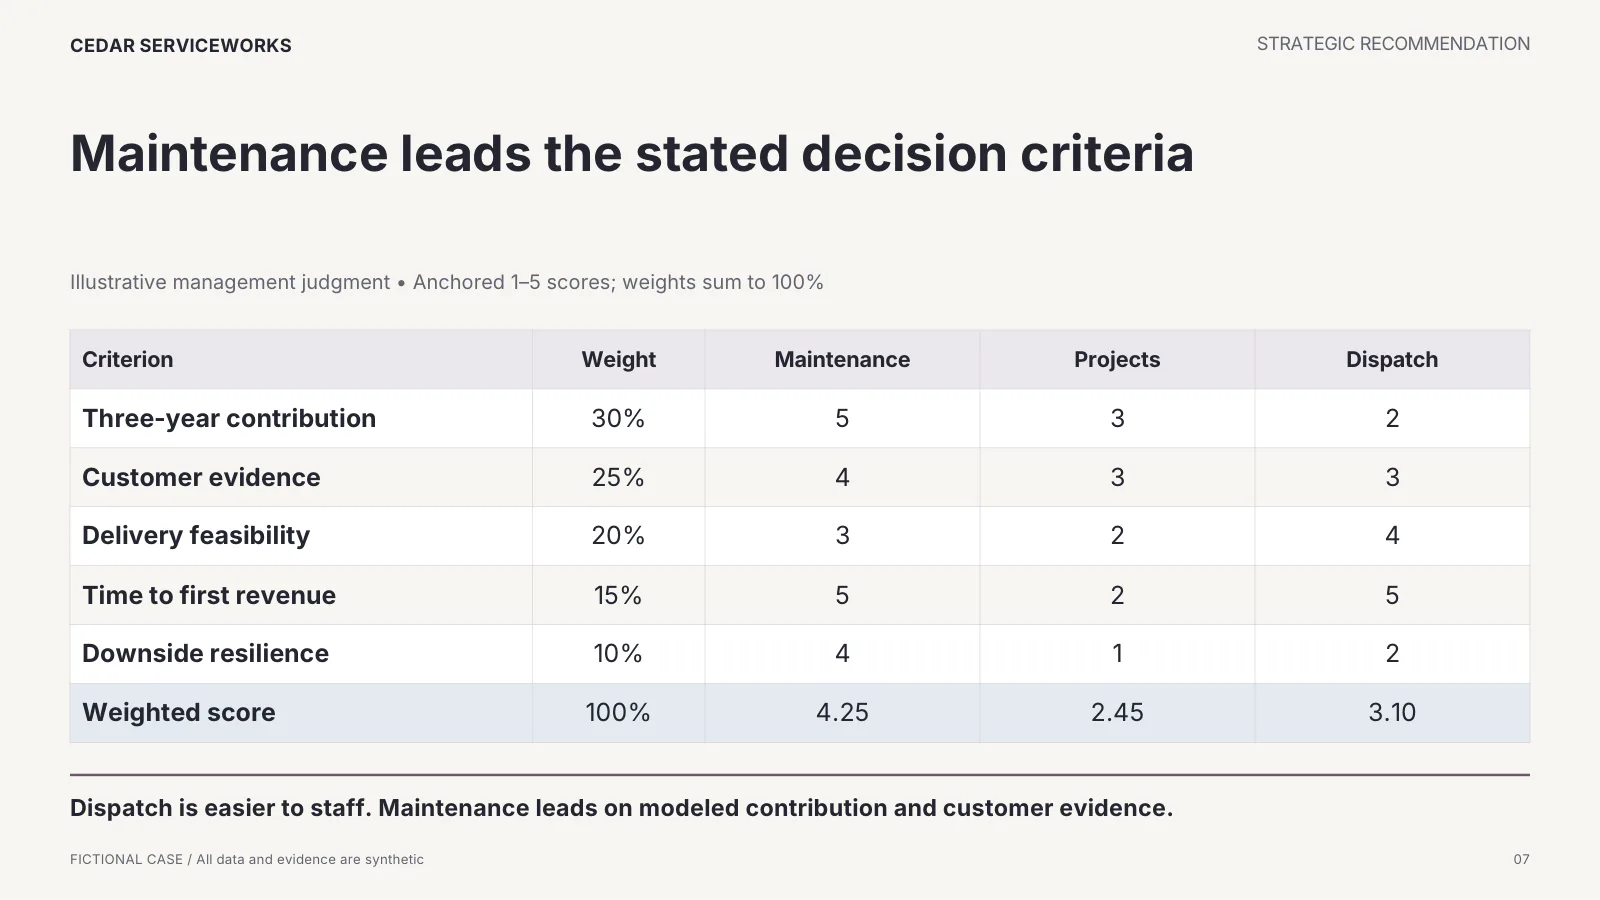
Slide 6 lays the three options side by side: the commercial logic, the delivery need and the main uncertainty of each. Slide 7 scores them against the five weighted criteria from the brief. Slide 8 shows the modeled contribution: full-run annual contribution, one-time setup, Year 1 result and three-year result for each option. The numbers come from the sample inputs workbook that ships with the deck, and the last slide of the deck says which sheet each figure comes from.
Slides 9 and 10: the timing and the downside
Slide 9 shows cumulative incremental contribution by year, with Year 1 carrying all implementation cost and turning positive in Year 2. Slide 10 runs the same model on a downside set of assumptions (lower revenue, thinner margin, slower ramp) and shows the Year 1 and full-run results side by side. A recommendation that only shows the base case asks the sponsor to take the consultant's word for the risk; this one shows how much room is left.
Slides 11 to 14: the pilot, the gates, the risks and the ask
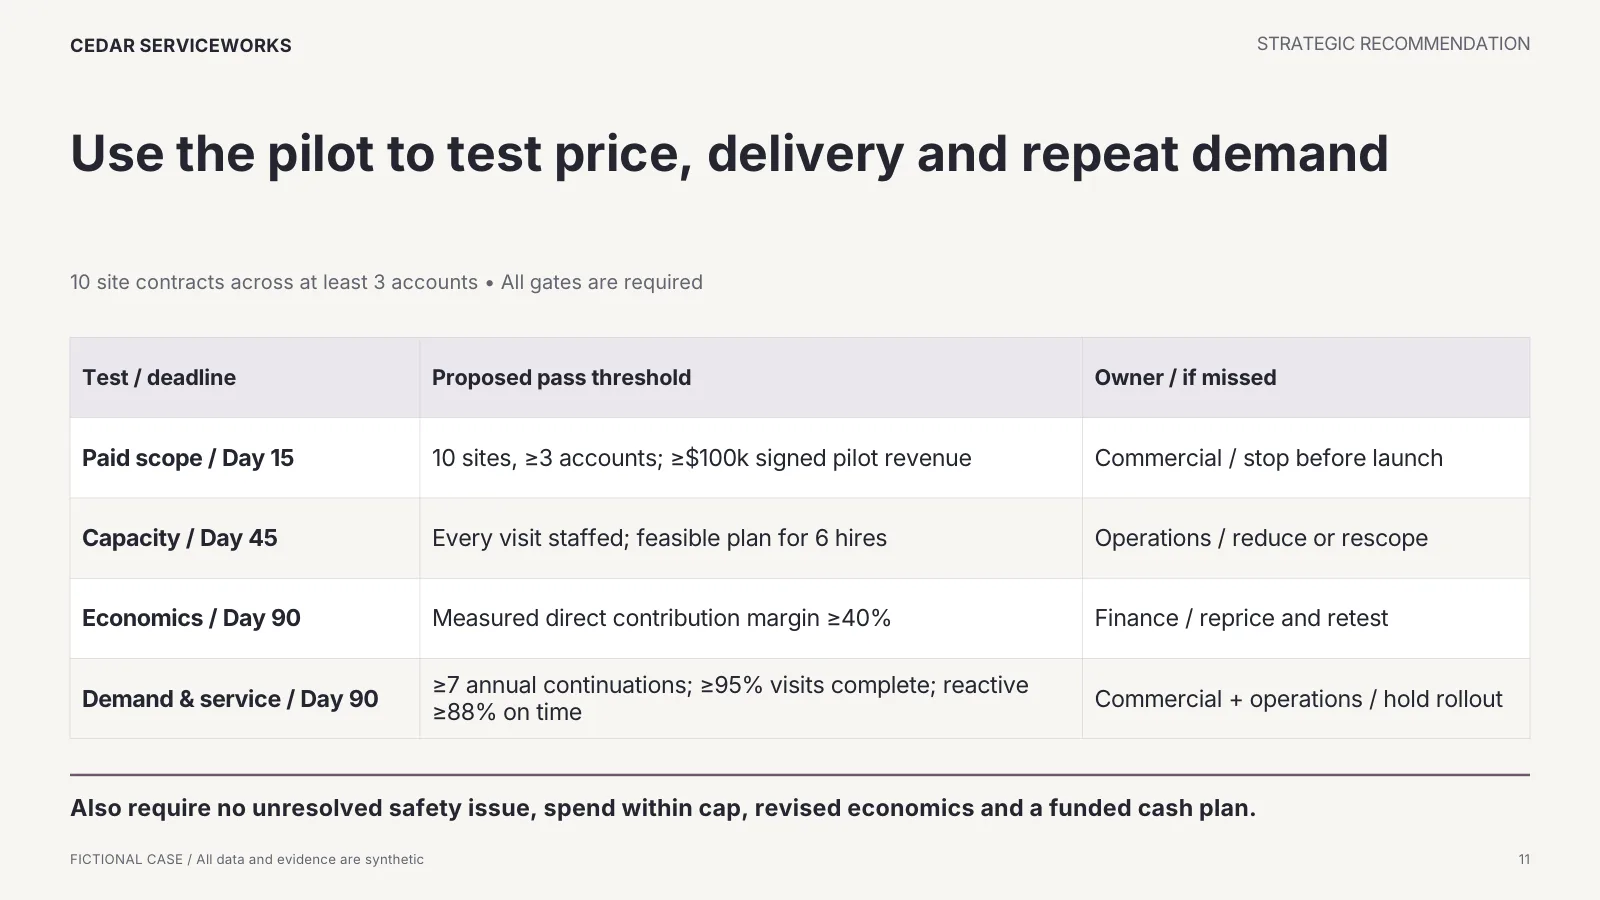
Slide 11 turns the recommendation into a test plan: ten site contracts across at least three accounts, with a deadline, a pass threshold and an owner for each gate. Slide 12 releases funding in stages as the gates pass. Slide 13 lists each material risk with its trigger, response and owner, and says in the subtitle that these are future decision rules, not achieved results. Slide 14 is the ask: authorize $195k now, with the rollout envelope of $240k conditional on all gates passing and on the economics still supporting the choice.
Slide 15: where every number comes from
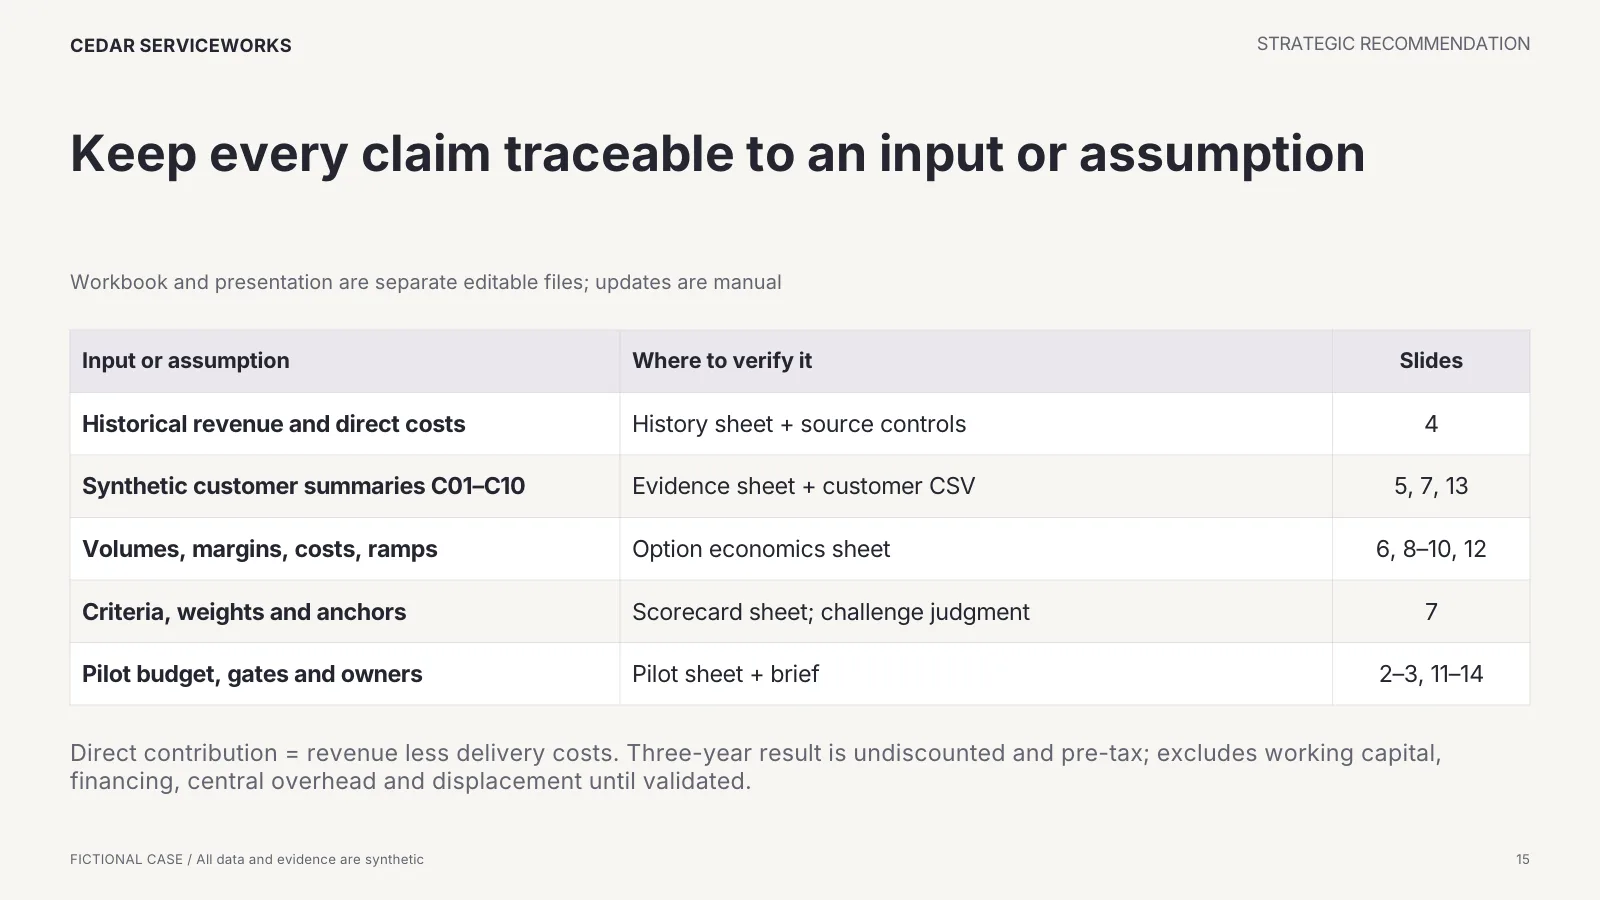
The last slide maps each input or assumption to the workbook sheet that holds it and the slides that use it. It also states a limit plainly: the workbook and the presentation are separate editable files, and updates between them are manual. If you change a margin assumption in the workbook, you update the slides yourself.
What the supporting files do
| File | Role in the deck |
|---|---|
| Client brief (PDF and HTML) | Fixes the question, the constraints and the weighted criteria before analysis. Slides 3 and 7 are built from it. |
| Statement of work (Word and PDF) | A template with bracketed fields for scope, exclusions, interviews and data sources. The exclusions section states that running the pilot and hiring are the client's responsibility, which is why slide 14 asks for authorization rather than promising delivery. |
| Sample inputs workbook (Excel) | History, evidence, option economics and scenario sheets. Source of the figures on slides 4 to 10; changes do not flow to the slides automatically. |
| Finished example (PowerPoint, Keynote, PDF) | The 15 slides shown here. |
| Editable starter (PowerPoint, Keynote) | The same sequence with placeholders, for your own engagement. |
| Workflow field guide (PDF and HTML) | The order of work from brief to final deck. |
What to copy, and what not to
Copy the order: recommendation first, then the frame, then evidence, then options, then economics, then the downside, then the plan and the ask, then the sources. Copy the habit of putting the finding in the headline and the limits in the subtitle. Do not copy the numbers. Cedar ServiceWorks is fictional, its interviews are synthetic, and the deck says so on every slide. A real engagement needs real inputs in the workbook and real interviews behind slide 5.
Where this comes from
The example, the brief, the statement of work, the workbook and the starter ship with the Consulting Deck, a 75-layout library for client recommendations and delivery plans. The slide-level judgments above follow How to review a deck.
Guides use the SlideDeck Co decks as their examples. See the six decks.

