

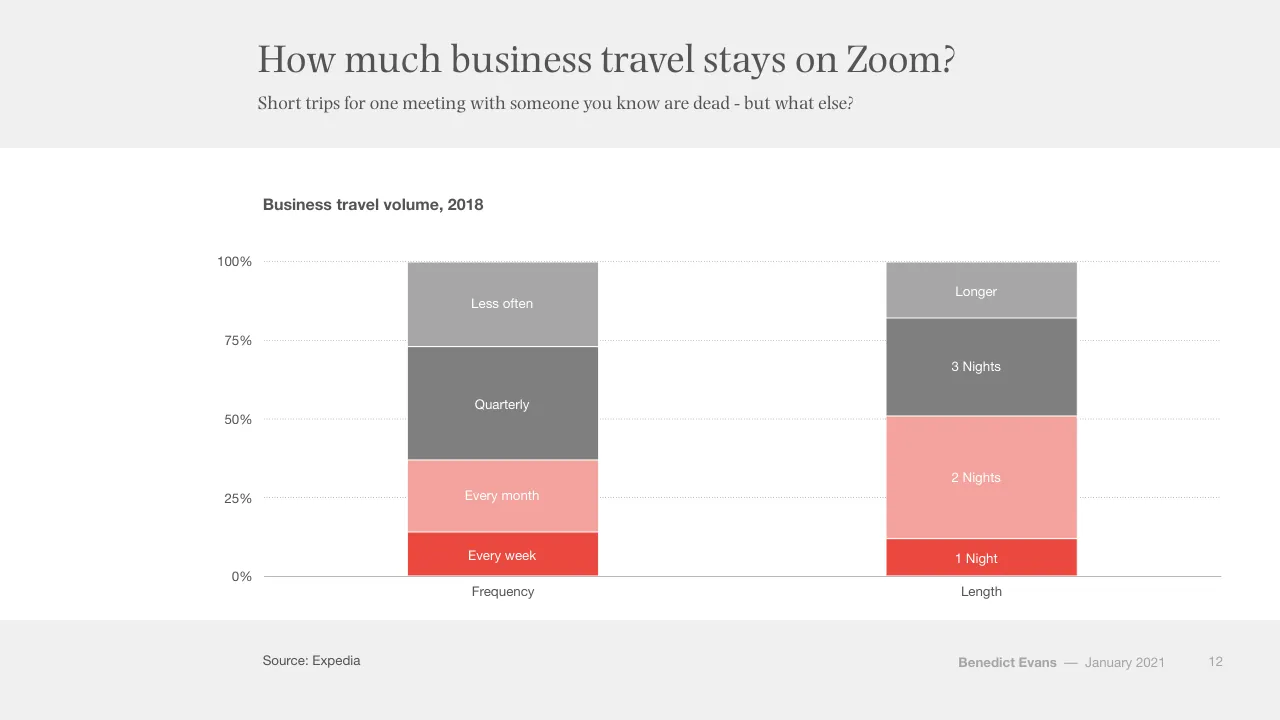
The deck opens with a title slide and a 2021 agenda built around four themes: COVID acceleration, the great unbundling, harder problems including China, and tech becoming a regulated industry. The first section shows how the pandemic pulled forward years of adoption, using charts on labour force change, ecommerce share, online grocery, video calls and working from home. The middle sections examine how retail, logistics and advertising are being split apart, with Amazon, Shopify, Nike, streaming services and cookie-based targeting as recurring examples. A longer section on harder problems covers electric vehicles, renewable energy costs, SpaceX and machine learning. It is followed by a section on China's technology supply chain, its internet market, and the growth of India and other markets. The deck closes with a regulation section and a conclusion comparing the first and second fifty years of technology, ending on a thank-you slide. Slides 3, 10 and 42 use section dividers with a single headline, and slide 12 pairs two stacked bars to make a point about business travel.
Slides worth studying
Questions about this deck
What does the Benedict Evans deck say about Amazon's revenue growth?
Slide 27 says Amazon's revenue grew 37% in 2020, shown on a line chart of Amazon annual revenue in $bn from 1995 to 2020.
What share of US parcel deliveries does the Benedict Evans deck say Amazon handles?
Slide 23 says a third of all US parcels are now delivered by Amazon's own logistics network. The source is ShipMatrix, using US parcel deliveries for July 2020.
What topics are listed in the agenda of the Benedict Evans deck?
Slide 2 lists COVID acceleration, The Great Unbundling, Harder problems, China, and Tech becomes a regulated industry as the agenda for 2021.
What does the Benedict Evans deck say about Shopify's GMV?
Slide 33 says Shopify has come from nowhere to over $100bn of GMV in 2020, shown on a bar chart of Shopify GMV in $bn.
Details
- Company: Benedict Evans
- Year: 2021
- Type: Conference talk
- Industry: Technology
- Pages: 134
More from Benedict Evans
- Benedict Evans conference talk, 2026
- Benedict Evans conference talk, Autumn 2025
- Benedict Evans conference talk, Spring 2025
- Benedict Evans conference talk, 2023
- Benedict Evans conference talk, 2023
- Benedict Evans strategy presentation, 2022
All Benedict Evans decks in the library
Review score: 8 out of 10, Strong
Presentation quality, judged with the SlideDeck Co review heuristic. Ask, evidence and idea merit are not rated here.
The deck has a clear, disciplined system: serif action titles with a one-line subtitle that states the point, a single red highlight against grey and charcoal, and sourced charts with direct labels. It reads as an argument, with slides 28 to 30 building one stacked bar step by step and slides 65 to 67 reusing a single consumer-spending bar to frame two eras. Defects are real but modest: the two-column bars on slide 12 have low-contrast white labels on pale pink and light grey, many charts leave large empty margins with tiny legends, and the circle slides (2, 10, 13, 15, 18) carry little visual information. I only saw 72 of 134 pages, so the later China and regulation sections are unjudged.
Worth keeping: Keep the action-title plus subtitle pattern, the red-for-the-point colour logic, the sourced footers, and the incremental chart builds on slides 28 to 30.
Most useful repair: Raise contrast of white labels on pale fills (slides 8, 12, 45, 65), and enlarge the small legends and axis text on slides like 5, 6 and 9.
What would change the score: Replace some of the repeated circle-and-arrow slides and the near-empty divider slides with a bolder visual device, and fill the wide chart margins so the data sits larger.
Confidence medium. 72 of 134 pages inspected on contact sheets, 4 at readable size. Reviewed 2026-11-08. Model-assisted review (claude-sonnet-5-5).
Full text of the slides (134 slides)
Every slide's words and a description of its charts and images, so the deck can be searched and rebuilt. Also available as Markdown.
Slide 1
The Great
Unbundling
Benedict Evans
January 2021
www.ben-evans.com
Benedict Evans
–– January 2020
Visuals: none. The only non-text marks are a thin white horizontal rule under the panel and a faint white translucent panel (opacity 0.04) behind the text.
Slide 2
Welcome to 2021
What matters in tech?
COVID
acceleration
The Great
Unbundling
Harder
problems
China
Tech becomes
a regulated
industry
Benedict Evans –– January 2021
2
Visuals: Four solid circles, each about 16.2% of slide width by 28.8% of slide height (approximately 324 by 324 px on a 2000 by 1125 slide, so true circles), filled #EB483F, evenly spaced in one row with their centres at about 27.5%, 47.7%, 67.8% and 87.9% across and about 53.5% down. Each circle holds centred white serif text: left circle 'COVID / acceleration'; second 'The Great / Unbundling'; third 'Harder / problems / China' with 'China' separated by extra space; fourth 'Tech becomes / a regulated / industry'. No photographs, icons, charts or logos.
Slide 3
COVID acceleration
Benedict Evans — January 2021
3
Slide 4
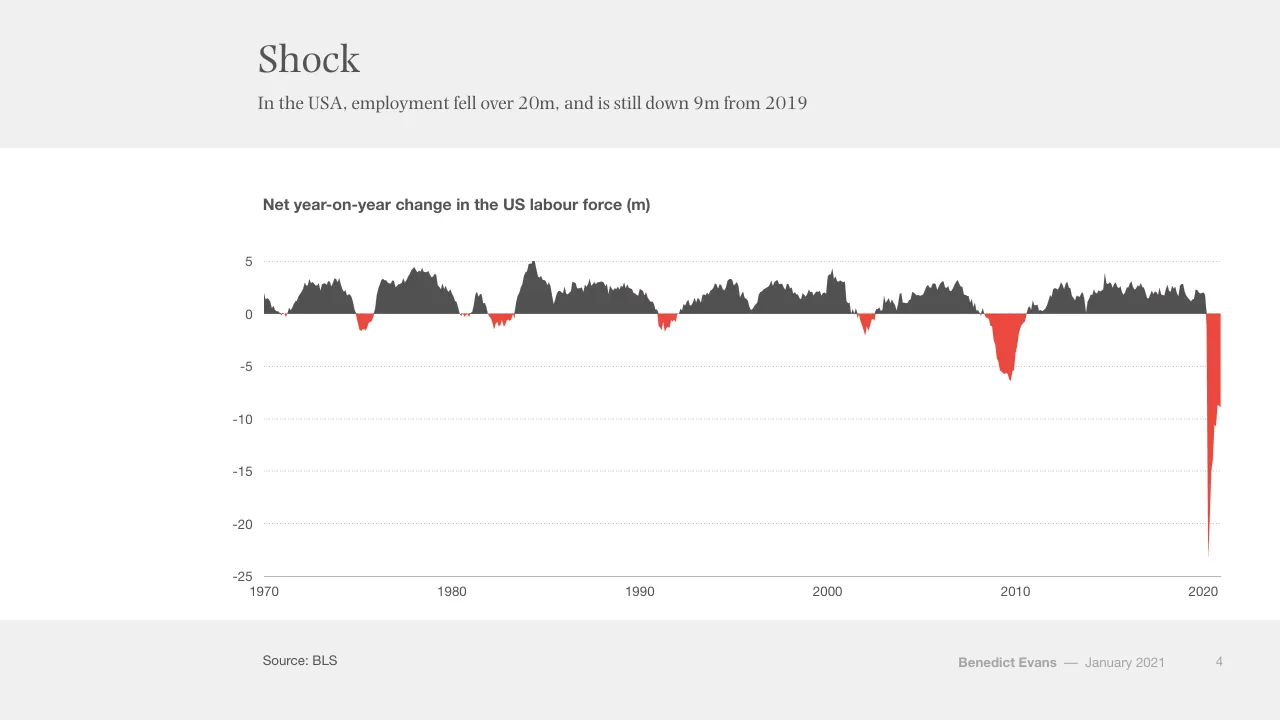
Shock
In the USA, employment fell over 20m, and is still down 9m from 2019
Net year-on-year change in the US labour force (m)
5
0
-5
-10
-15
-20
-25
1970
1980
1990
2000
2010
2020
Source: BLS
Benedict Evans
–– January 2021
4
Visuals: One area chart (filled area / ribbon chart) titled 'Net year-on-year change in the US labour force (m)'. Y-axis: linear, labelled values 5, 0, -5, -10, -15, -20, -25 (units: millions, m), range about -25 to 5, faint dotted horizontal gridlines at each labelled value. X-axis: years 1970 to 2020 labelled at 1970, 1980, 1990, 2000, 2010, 2020, with a solid grey baseline at the bottom (y = -25). Single series filled area: segments above zero are dark grey #535353, segments below zero are red #EB483F. No legend. Values are not printed; approximate readings: peaks near +5 in about 1984, about +4 around 1978 and 2000, troughs of about -1.5 in 1975, about -5.5 to -6.3 around 2009-2010, about -2 in 2002, and a sharp drop to about -23 in 2020 followed by recovery to about -9 at the right edge. Highlighted points: the 2020 red spike is the most prominent feature.
Slide 5
Ecommerce steps forward 5-10 years
Lockdown has pulled forward a huge amount of future adoption
Ecommerce as a share of addressable retail*
UK (monthly)
USA (quarterly)
40%
30%
20%
10%
0%
2010
2011
2012
2012
2014
2015
2016
2016
2018
2019
2020
2021
Source: ONS, US Census
* Excluding cars, car parts, fuel, bars & restaurants. Seasonally adjusted
Benedict Evans — January 2021
5
Visuals: One line chart titled 'Ecommerce as a share of addressable retail*', with a y-axis from 0% to 40% in 10% steps (dotted horizontal gridlines at each step) and an x-axis from 2010 to 2021 with year labels. Series 1, 'UK (monthly)', red line: about 6.5% at start of 2010, about 8% in 2011, about 10% in 2013, about 12% in 2015, about 16% in 2016, about 19% in 2019, about 20% at start of 2020, a sharp rise to about 34% around mid-2020 (highlighted peak), a fall to about 28% late 2020, a rise to about 31% at end of 2020, ending about 30%. Series 2, 'USA (quarterly)', dark grey line: about 6% in 2010, about 10% in 2015, about 17% in early 2020 (flat), a rise to about 22% around mid-2020 (highlighted peak), ending about 20.5%. Values are estimates, not printed on the slide. Legend at top-left: red short line with 'UK (monthly)' above dark grey short line with 'USA (quarterly)'. No data labels, no other highlighted points. Axis baseline is a thin grey line at 0%.
Slide 6
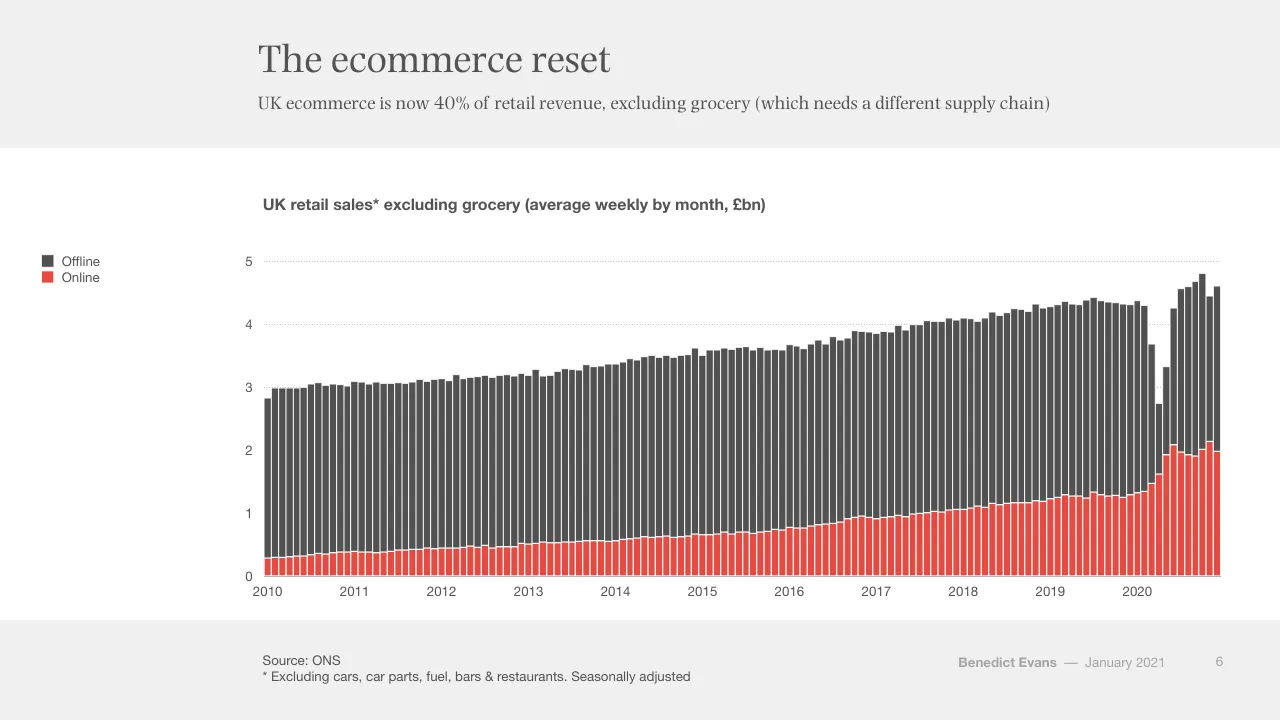
The ecommerce reset
UK ecommerce is now 40% of retail revenue, excluding grocery (which needs a different supply chain)
UK retail sales* excluding grocery (average weekly by month, £bn)
Offline
Online
5
4
3
2
1
0
2010
2011
2012
2013
2014
2015
2016
2017
2018
2019
2020
Source: ONS
* Excluding cars, car parts, fuel, bars & restaurants. Seasonally adjusted
Benedict Evans — January 2021
6
Visuals: Stacked column chart. Title: 'UK retail sales* excluding grocery (average weekly by month, £bn)', bold sans, dark grey. Y-axis: £bn, linear, range 0 to 5, labelled ticks 0, 1, 2, 3, 4, 5, with faint dotted horizontal gridlines at 1, 2, 3, 4 and 5 and a solid thin axis line at 0. X-axis: time in months from 2010 to 2020 (about 130 monthly columns), labelled at each January 2010, 2011 ... 2020. Series: Offline (dark grey, top segment) and Online (red, bottom segment), stacked. No printed data values. Estimates: 2010 monthly totals about 2.8 to 3.1 with Online about 0.3; 2014 totals about 3.4 to 3.6 with Online about 0.6; 2016 totals about 3.6 to 3.7 with Online about 0.8; 2018 totals about 4.0 to 4.1 with Online about 1.1; 2019 totals about 4.3 to 4.4 with Online about 1.3; early 2020 Online about 1.5 to 1.4 and total dips to about 3.7 (Feb) then about 2.8 (Apr 2020) with Online about 1.6; mid 2020 totals rise to about 4.8 to 4.9 with Online peaking about 2.1 (late 2020); final bar about 4.6 total with Online about 2.0. Legend: two entries, Offline (dark grey square) above Online (red square), no border. No highlighted points beyond the 2020 spike.
Slide 7
Online grocery sales have doubled / Forced adoption, forced experiment / UK online grocery as % total grocery / 15% / 10% / 5% / 0% / 2010 / 2011 / 2012 / 2013 / 2014 / 2015 / 2016 / 2017 / 2018 / 2019 / 2020 / Source: ONS / Benedict Evans / –– January 2021 / 7
Visuals: Line chart. Title: 'UK online grocery as % total grocery' (bold sans, dark grey). Y-axis: percentage of total grocery, range 0% to 15%, labelled ticks at 0%, 5%, 10%, 15%, with light dotted horizontal gridlines at 5%, 10% and 15%. X-axis: years 2010 to 2020 labelled at each January, with a thin solid grey baseline at 0%; the series runs monthly to late 2020. Single series, drawn as a red line about 0.5% of slide height thick, colour about #E8453C. Labelled values: none printed on the slide. Estimated values (about): starts at about 2.5% in early 2010; about 3% through 2011 to 2012; about 3.5% in 2013; about 4% in early 2015; about 4.5% in 2016; about 5% through 2017 to 2019; dips to about 5% in early 2020; spikes to about 9.5% in spring 2020; peaks at about 11.1% around mid 2020; falls to about 10.3% in autumn 2020; ends at about 11% at the last point. Legend: none. Highlighted points: none marked, though the 2020 spike is the steepest feature of the line. No photographs, logos or icons.
Slide 8
Forced experiment, forced adoption / Breaking habits - everyone is forced to try things for the first time / Growth of grocery delivery during Covid / Using more / Used for first time / 50% / 40% / 30% / 20% / 10% / 0% / China / UK / USA / Italy / France / Spain / Germany / Brazil / Mexico / Argentina / Source: McKinsey / Benedict Evans / —January 2021 / 8
Visuals: Chart: stacked vertical bar chart titled 'Growth of grocery delivery during Covid'. Y axis is percentage of the population, 0% to 50%, with labelled ticks at 0%, 10%, 20%, 30%, 40% and 50% and dotted light grey horizontal gridlines at each labelled tick; the 0% baseline is a solid grey line. X axis: categories China, UK, USA, Italy, France, Spain, Germany, Brazil, Mexico, Argentina, left to right. Two stacked series per bar: bottom series 'Used for first time' in red, top series 'Using more' in light pink, stacked to a total. The slide prints no data values, so all values are estimates: China about 13 (used for first time) and about 46 total (using more about 33); UK about 11 and about 33 (using more about 22); USA about 10 and about 26 (about 16); Italy about 9 and about 25 (about 16); France about 8 and about 16 (about 8); Spain about 5 and about 15 (about 10); Germany about 3 and about 11 (about 8); Brazil about 11 and about 22 (about 11); Mexico about 9 and about 26 (about 17); Argentina about 6 and about 28 (about 22). Legend: top-left, two square swatches stacked vertically: light pink square labelled 'Using more' above a red square labelled 'Used for first time'. No highlighted points. Bars are narrow, about 3% of slide width, with thin white separators between stacked segments.
Slide 9
Video broke through
UK video call adoption doubled during lockdown
UK adults making personal video calls at least weekly
February 2020
May 2020
75%
50%
25%
0%
Any
FB Messenger
Facetime
Zoom
Skype
Snapchat
MSFT Teams
Houseparty
Source: Ofcom
Benedict Evans
–– January 2021
9
Visuals: Chart: clustered vertical bar chart titled 'UK adults making personal video calls at least weekly' (bold sans-serif, above the plot). Y-axis: percentage of UK adults, range 0% to 75%, labelled at 0%, 25%, 50%, 75% with dotted light grey horizontal gridlines at 25%, 50% and 75%. X-axis: nine platform categories, left to right: Any, WhatsApp, FB Messenger, Facetime, Zoom, Skype, Instagram, Snapchat, MSFT Teams, Houseparty (ten categories in total). Two series: February 2020 in dark grey #535353 (left bar of each pair) and May 2020 in red #EB483F (right bar of each pair). Values are not printed on the slide; estimates from bar heights are: Any Feb about 35%, May about 71%; WhatsApp Feb about 20%, May about 49%; FB Messenger Feb about 18%, May about 41%; Facetime Feb about 13%, May about 30%; Zoom Feb none shown (no bar), May about 23%; Skype Feb about 7%, May about 15%; Instagram Feb about 6%, May about 15%; Snapchat Feb about 6%, May about 10%; MSFT Teams Feb none shown, May about 10%; Houseparty Feb none shown, May about 7%. Legend: top-left of the chart, two square swatches with labels, February 2020 (dark grey #535353) above May 2020 (red #EB483F). No bars are highlighted beyond the colour coding. No photographs, icons or logos.
Slide 10
Forced experiment: working from home?
What happens once the novelty wears off? What works better and what get broken?
Maximalists
‘Global distributed company’
Moderates
3-4 days a week in the office?
Questions
Collaboration? Social capital? Training?
Benedict Evans — January 2021
10
Visuals: Three identical white circles (filled #FFFFFF) with thin red outlines (about #E94B3C, roughly 0.3% of slide width stroke), each about 21.7% wide and 38.5% tall, drawn as ellipses placed side by side at x 19.2%, 46.9% and 74.5%, y 34.3%. Each circle holds a bold heading and a short text block, centred horizontally and vertically. No photographs, charts, icons or logos.
Slide 11
What does WFH mean for retail? Office rents?
WFH for a day a week means 20% less footfall. What does that do?
Employment in New York City (000s)
Retail
Restaurants & bars
Clothing stores
400
300
200
100
0
1990
2000
2010
2020
Source: BLS
Benedict Evans
—— January 2021
11
Visuals: Line chart titled 'Employment in New York City (000s)'. Y axis: employment in thousands, range 0 to 400, gridlines and labels at 0, 100, 200, 300, 400, dotted light grey horizontal gridlines. X axis: years 1990 to about 2021 with labels at 1990, 2000, 2010, 2020, solid grey baseline. Series: Retail (red #E8443A line) starts about 268 in 1990, dips to about 228 in 1993, rises to about 285 in 2001, falls to about 265 in 2002, rises to about 357 in 2015, stays near 350 through 2019, then drops sharply to about 253 in 2020 before recovering to about 305 at the end. Restaurants & bars (dark grey #545454) starts about 144 in 1990, falls to about 119 in 1993, rises to about 166 in 2001, about 200 in 2008, about 320 in 2018, then plunges to about 90 in 2020 before recovering to about 193 at the end. Clothing stores (light red-pink #F4A09A) starts about 41 in 1990, about 35 in 1993, about 52 in 2001, about 62 in 2013, about 58 in 2018, then falls to about 17 in 2020 and about 24 at the end. Legend at left top of chart: red line Retail, dark grey line Restaurants & bars, pink line Clothing stores. No highlighted points.
Slide 12
How much business travel stays on Zoom?
Short trips for one meeting with someone you know are dead - but what else?
Business travel volume, 2018
100%
Longer
Less often
75%
3 Nights
Quarterly
50%
2 Nights
Every month
25%
Every week
1 Night
0%
Frequency
Length
Source: Expedia
Benedict Evans
—— January 2021
12
Visuals: Stacked column chart, titled 'Business travel volume, 2018'. Y-axis from 0% to 100% in 25% steps, with light dotted horizontal gridlines at 25%, 50%, 75% and 100%. X-axis categories: 'Frequency' and 'Length', with a solid thin grey baseline at 0%. Frequency column (about 100% total), bottom to top: 'Every week' about 14% (#EB483F red), 'Every month' about 23% (#F5A39F light red), 'Quarterly' about 36% (#7F7F7F dark grey), 'Less often' about 27% (#A6A6A6 light grey). Length column (about 100% total), bottom to top: '1 Night' about 12% (#EB483F red), '2 Nights' about 39% (#F5A39F light red), '3 Nights' about 31% (#7F7F7F dark grey), 'Longer' about 18% (#A6A6A6 light grey). Segments are separated by thin white lines; labels are white centred inside each segment. No legend; the segment labels act as the legend. No highlighted points. Bars are about 15% of slide width each, with the Frequency bar centred near x 39% and the Length bar near x 76%.
Slide 13
Cambrian explosion in remote tools
How do collaboration and social capital work remotely? No, not just another video call
Zoom
$110bn
Hopin
$2bn in 18
months
And hundreds
of others
Benedict Evans –– January 2021
13
Visuals: Three identical circles (shapes), each with a white #FFFFFF fill and a red #E84C3D outline about 0.3% of slide width thick. Circle 1 at x 19.2%, y 34.3%, w 21.7%, h 38.5% contains the text Zoom (bold) above $110bn. Circle 2 at x 46.9%, y 34.3%, w 21.7%, h 38.5% contains Hopin (bold) above $2bn in 18 months. Circle 3 at x 74.5%, y 34.3%, w 21.7%, h 38.5% contains And hundreds of others (bold). No chart, photograph, logo or icon.
Slide 14
Towards an exit…
There is announced supply for 8bn vaccinations in 2021, if they can be administered
Announced 2021 vaccination supply (bn)
9
8
7
6
5
4
3
2
1
0
PFEB
Modema
Gamaleya
Sinopharm
Sinovac
AstraZeneca
J&J
CanSino
Novavax
CureVac
Sanofi-GSK
Total
Source: Companies
Benedict Evans
–– January 2021
14
Visuals: Chart: waterfall (floating column) chart. Title: 'Announced 2021 vaccination supply (bn)'. Y axis: numeric, unit bn, range 0 to 9, gridlines at every 1 unit, dotted light grey lines. X axis: categories with no unit, solid thin grey baseline at 0. Series: 12 columns, all dark grey (about #505050) except the final column. Floating columns, with about values read from the image: PFEB about 0.0 to 0.7; Modema about 0.7 to 1.1; Gamaleya about 1.1 to 2.3; Sinopharm about 2.3 to 3.4; Sinovac about 3.4 to 3.9; AstraZeneca about 3.9 to 5.4; J&J about 5.4 to 6.4; CanSino about 6.4 to 6.6; Novavax about 6.6 to 7.6; CureVac about 7.7 to 7.9; Sanofi-GSK about 7.8 to 8.3. Total column: red (#EB483F) from 0 to about 8.3, the only highlighted point. No data labels are printed on the bars. Legend: none. Each column is a rectangle with square corners and no outline; column width about 3.5% of slide width. Gridlines run across the full plot width.
Slide 15
A decade in a year / Towards a ‘new normal’ / Macro, political, social, cultural, fiscal shock / Forced acceleration, forced experiment / Broken habits / Benedict Evans — January 2021 / 15
Visuals: Three identical solid red filled circles (#EB483F), each about 22.1% of slide width and 39.3% of slide height, placed left to right at x 19.2%, 46.7% and 74.1%, all at y 33.9%. Each circle carries centred white serif text: left circle 'Macro, political, social, cultural, fiscal shock'; middle circle 'Forced acceleration, forced experiment'; right circle 'Broken habits'. No photographs, charts or icons.
Slide 16
The Great Unbundling
Benedict Evans —— January 2021
16
Slide 17
“I’m a terrified dinosaur…
I’ve been living in this cozy world of old brands, big / volumes, nothing changing very much, and you could / just focus on being very efficient and you’d be okay, and / all of a sudden we are being disrupted in all ways”
Jorge Paulo Lemann, Kraft Heinz
2018
Benedict Evans –– January 2021
17
Slide 18
$25tr - and nobody knows anything / Every part of the retail and media journey is being unbundled / Brands / Retail / Advertising / TV / Benedict Evans — January 2021 / 18
Visuals: Four solid red circles of identical size (about 16.2% wide by 28.8% tall, rendered as circles), evenly spaced in a single row, each carrying a white label: Brands, Retail, Advertising, TV. No chart, photo or logo; no connecting lines or arrows; no overlays or shadows.
Slide 19
The traditional view of ecommerce / There’s retail, and some of that goes online, and some already has. Simple… / US retail revenue ($tr) / Restaurants / Non-addressable retail / Addressable retail / Ecommerce / 7 / 6 / 5 / 4 / 3 / 2 / 1 / 0 / 2000 / 2005 / 2010 / 2015 / 2019 / Source: US Census / Benedict Evans / —— January 2021 / 19
Visuals: Stacked area chart, titled US retail revenue ($tr). Y axis: 0 to 7 in $tr, gridlines at each integer as thin dotted grey lines, labels 0 to 7 at the left of the plot. X axis: 2000 to 2019, labels at 2000, 2005, 2010, 2015 and 2019. Series, bottom to top: Ecommerce (red #EB483F), Addressable retail (pale pink #FBDAD9), Non-addressable retail (mid grey #7F7F7F), Restaurants (light grey #A6A6A6). No values are printed; estimates: 2000 totals about 3.3 with Ecommerce about 0.0, Addressable top about 1.95, Non-addressable top about 3.0. 2009 totals about 4.05 with a dip, Addressable top about 2.55. 2019 totals about 6.2 with Ecommerce about 0.6, Addressable top about 3.7, Non-addressable top about 5.45. Legend at left, top to bottom: Restaurants, Non-addressable retail, Addressable retail, Ecommerce, each with a small square swatch in the series colour. No highlighted points. Series boundaries drawn with thin white hairlines.
Slide 20
But is that a useful split?
‘Ecommerce’ penetration is spread so widely in different categories that aggregate numbers don’t mean much
US ecommerce penetration, 2019
60%
50%
40%
30%
20%
10%
0%
Toys & games
Consumer
Apparel
Personal
Pet care
Beauty
Home &
Consumer
Eyewear
Grocery
electronics
accessories
garden
health
Source: Euromonitor, Haver
Benedict Evans
–– January 2021
20
Visuals: Vertical bar chart titled 'US ecommerce penetration, 2019'. Y-axis: percentage of ecommerce penetration, 0% to 60% in 10% steps, with dotted light grey horizontal gridlines at each step. X-axis: ten categories with a solid grey baseline. Series values (about, read from bar heights, no values printed): Toys & games about 51%, Consumer electronics about 30.5%, Apparel about 24%, Personal accessories about 23%, Pet care about 18%, Beauty about 15%, Home & garden about 14%, Consumer health about 13%, Eyewear about 11%, Grocery about 3%. Highlighted points: the Toys & games bar and the Grocery bar are red (#EB483F); all other bars are dark grey (#535353). No legend. Bars are narrow, evenly spaced, flat-filled with no outlines.
Slide 21
Much more useful: ecommerce as logistics / Cardboard boxes versus hand delivery, trucks and bikes / US retail revenue by delivery model, 2019 ($bn) / 3,000 / 2,500 / 2,000 / 1,500 / Gasoline / Restaurants / 1,000 / Home & building / Car dealers / & repair / 500 / Grocery / Ecommerce / 0 / Could be parcels / Could be custom delivered or collected / Can't be delivered (?) / Source: US Census / Benedict Evans — January 2021 / 21
Visuals: Stacked column chart. Title: 'US retail revenue by delivery model, 2019 ($bn)' in bold sans-serif above the plot. Y-axis: 'bn' dollars, linear, 0 to 3,000 with labelled ticks at 0, 500, 1,000, 1,500, 2,000, 2,500 and 3,000; dotted light grey horizontal gridlines at each tick. X-axis: three categories labelled 'Could be parcels', 'Could be custom delivered or collected' and 'Can't be delivered (?)', with a thin grey baseline at 0. Series and segments, bottom to top. Column 1 (Could be parcels): red 'Ecommerce' segment about 550, then a mid-grey unlabelled segment about 2,110 up to a total of about 2,660. Column 2 (Could be custom delivered or collected): a thin red segment about 50 at the base (unlabelled), 'Grocery' dark grey about 770 (about 50 to 820), 'Home & building' mid-grey about 210 (about 820 to 1,030), 'Restaurants' dark grey about 770 (about 1,030 to 1,800). Column 3 (Can't be delivered (?)): 'Car dealers & repair' mid-grey about 1,230, 'Gasoline' light grey about 510 (about 1,230 to 1,740), and a very thin grey sliver about 20 on top (total about 1,760). Values are estimates from the gridlines, marked 'about', since the slide prints no segment values. No legend. Highlighted series: the red Ecommerce segments are the only accent colour. Segments are separated by thin white borders.
Slide 22
Much more useful: ecommerce as logistics
Cardboard boxes versus hand delivery, trucks and bikes
US retail revenue by delivery model, 2019 ($bn)
3,000
2,500
2,000
1,500
1,000
500
Ecommerce
0
Parcels
Delivery & collection
Cars
Source: US Census
Benedict Evans
—
January 2021
22
Visuals: Chart: stacked vertical bar chart, title 'US retail revenue by delivery model, 2019 ($bn)'. Y-axis: linear, unit $bn, range 0 to 3,000, gridlines dotted light grey at every 500 (0, 500, 1,000, 1,500, 2,000, 2,500, 3,000). X-axis categories: Parcels, Delivery & collection, Cars. Series: 'Ecommerce' in red #EB483F at the bottom of each bar, and a second series in dark grey #535353 stacked above. Values as drawn: Parcels total about 2,660 with ecommerce about 550 (grey about 2,110); Delivery & collection total about 1,800 with ecommerce about 55 (grey about 1,745); Cars total about 1,760 with no visible ecommerce segment (grey about 1,760). Only the Parcels ecommerce segment carries a label, 'Ecommerce' in white. No legend. Bars are equal width, centred on their categories, with thin white separators between segments. No highlighted points beyond the red ecommerce segments.
Slide 23
Parcels: Amazon replaces the post office / A third of all US parcels are now delivered by Amazon’s own logistics network / US parcel deliveries, July 2020 / Amazon / UPS / FedEx / US Post Office / 0% / 25% / 50% / 75% / 100% / Source: ShipMatrix / Benedict Evans / — January 2021 / 23
Visuals: Horizontal 100% stacked bar chart titled 'US parcel deliveries, July 2020'. X-axis runs from 0% to 100% with labelled ticks at 0%, 25%, 50%, 75%, 100%; faint dotted vertical gridlines at 25%, 50%, 75%, and a solid grey vertical axis line at 0%. Single bar in the middle of the plot, spanning about 20.7% to 95.9% of slide width and about 49.4% to 66.8% of slide height. Segments left to right: Amazon in red #EB483F, about 33% of parcels (about 34 to 35% of the axis, read from bar edge at about 35%); UPS in dark grey #535353, about 16% (about 35% to 51%); FedEx in mid grey #7F7F7F, about 10% (about 51% to 61%); US Post Office in light grey #A6A6A6, about 39% (about 61% to 100%). No legend; segment names are printed inside each segment in white. Thin white separators between segments. No printed numeric values on the segments.
Slide 24
Delivery: how many logistics models?
General ecommerce is almost all shipped by parcel, but half of food is collected or delivered
US ecommerce by fulfilment, June 2020
Parcels
Delivery
Collection
100%
75%
50%
25%
0%
General ecommerce
CPG
Food retail
Source: IRI
Benedict Evans –– January 2021 24
Visuals: Stacked column chart, titled 'US ecommerce by fulfilment, June 2020'. Y axis: percentage of total, 0% to 100%, gridlines and labels at 0%, 25%, 50%, 75%, 100%, shown as light dotted grey horizontal lines. X axis: three categories, General ecommerce, CPG, Food retail, with a solid grey baseline at 0%. Three stacked series, bottom to top: Collection (red #EB483F), Delivery (pale pink #FBDAD9), Parcels (dark grey #535353). Legend at the left, top to bottom: Parcels (dark grey square), Delivery (pale pink square), Collection (red square). No printed values on the bars; estimates: General ecommerce Collection about 5%, Delivery about 2%, Parcels about 92%; CPG Collection about 15%, Delivery about 7%, Parcels about 78%; Food retail Collection about 37%, Delivery about 17%, Parcels about 46%. Thin white separators between stacked segments. No highlighted points.
Slide 25
Restaurants - arbitrage / Delivery cost versus labour and rent efficiency (dark kitchens) - if the density, food model and experience make sense / US restaurant spending, 2019 ($bn) / 400 / 300 / 200 / 100 / 0 / 2018 delivery / 2019 delivery / 2020 delivery / Take-away / On-premise / Source: Technomic, Company Data, Morgan Stanley, NRA / Benedict Evans / –– January 2021 / 25
Visuals: One vertical bar chart. Type: column chart. Title above plot: 'US restaurant spending, 2019 ($bn)' in bold sans-serif, left-aligned at x about 20.5%. Y axis: labelled 0, 100, 200, 300, 400 (units $bn, no axis title printed), range 0 to about 400, with dotted light grey horizontal gridlines at 100, 200, 300 and 400 and a solid mid-grey baseline at 0. X axis: categories 2018 delivery, 2019 delivery, 2020 delivery, Take-away, On-premise, with no axis title. Single series, no legend, no data labels printed. Values are not printed; estimates: 2018 delivery about 28, 2019 delivery about 32, 2020 delivery about 46, Take-away about 180, On-premise about 370. Bars: 2018, 2019 and 2020 delivery are red (approx #E94B3C); Take-away is dark grey #535353; On-premise is light grey #A7A7A7. No highlighted points beyond the colour coding. Bars are flat rectangles with no outline, evenly spaced, each about 6% of slide width wide.
Slide 26
Delivery employment already has doubled / Rebalancing and unbundling the logistics model - the USA added 225k delivery drivers in 2020 / US employment (000) / Warehouses / 1,400 / Delivery / 1,200 / 1,000 / 800 / 600 / 400 / 200 / 0 / 1990 / 2000 / 2010 / 2020 / Source: BLS / Benedict Evans — January 2021 / 26
Visuals: Chart: line chart titled US employment (000), with two series plotted monthly from 1990 to about 2021 (end of series at the right edge of the plot). Y axis: units thousands of persons (000), range 0 to 1,400, gridlines and labels at 0, 200, 400, 600, 800, 1,000, 1,200 and 1,400, drawn as light dotted grey horizontal lines. X axis: years 1990, 2000, 2010 and 2020 labelled under a thin solid grey baseline at 0. Series Warehouses: dark grey line (#545454), about 410 in 1990, about 480 in 2000, about 530 around 2001, about 510 in 2002, about 690 around 2008, about 630 around 2010, about 700 around 2013, about 900 around 2016, about 1,100 around 2018, a dip to about 1,120 near 2020 and about 1,290 at the end of the series. Series Delivery: red line (about #E8483F), about 370 in 1990, about 500 around 1995, about 640 around 2001, about 540 around 2003, about 500 around 2010, about 540 around 2013, about 650 around 2016, about 750 around 2018, about 890 around 2020 and about 1,070 at the end of the series. Legend: at top left of the chart, a short dark grey line segment with the label Warehouses above a short red line segment with the label Delivery; no legend box. No points are highlighted; the line strokes are about 2 px wide, and the Warehouses line is drawn over the Delivery line where they cross.
Slide 27
Oh yes - what about Amazon?
Amazon’s revenue grew 37% in 2020
Amazon annual revenue ($bn)
450
400
350
300
250
200
150
100
50
0
1995
2000
2005
2010
2015
2020
Source: Amazon
Benedict Evans
–– January 2021
27
Visuals: Line chart with markers, titled 'Amazon annual revenue ($bn)' in bold sans-serif above the plot. Y axis: revenue in $bn, linear, range 0 to 450, gridlines every 50, labelled 0, 50, 100, 150, 200, 250, 300, 350, 400, 450. X axis: years 1995 to 2020, labels every five years (1995, 2000, 2005, 2010, 2015, 2020), with one annual data point per year (26 points). Single series in red (about #EE4035) with a 3px-like solid line and filled circular markers of the same red. Values are not printed; estimated values (about) for each year: 1995 about 1, 1996 about 2, 1997 about 2, 1998 about 2, 1999 about 3, 2000 about 4, 2001 about 5, 2002 about 5, 2003 about 7, 2004 about 8, 2005 about 10, 2006 about 12, 2007 about 16, 2008 about 20, 2009 about 25, 2010 about 35, 2011 about 48, 2012 about 62, 2013 about 75, 2014 about 89, 2015 about 107, 2016 about 136, 2017 about 178, 2018 about 233, 2019 about 280, 2020 about 386. No legend. Highlighted points: none beyond the endpoint 2020 at the top right, which is the highest value. Gridlines are light grey dotted horizontal lines spanning the plot width. A thin grey horizontal baseline sits at 0. The chart is rendered as an image placed in a box with no border.
Slide 28
Ecommerce as logistics / What’s Amazon’s market? / US retail revenue by delivery model, 2019 ($bn) / 3,000 / 2,500 / 2,000 / 1,500 / 1,000 / 500 / Ecommerce / 0 / Could be parcels / Could be custom delivered or collected / Source: US Census / Benedict Evans / —— January 2021 / 28
Visuals: Stacked column chart. Title: 'US retail revenue by delivery model, 2019 ($bn)'. Y-axis: $bn, linear scale from 0 to 3,000 with labelled gridlines at 0, 500, 1,000, 1,500, 2,000, 2,500 and 3,000; gridlines are light grey dotted horizontal lines. X-axis: two categories, 'Could be parcels' and 'Could be custom delivered or collected', with a thin grey baseline at 0. Series: 'Ecommerce' (red #EB483F, bottom segment) and an unlabelled dark grey #535353 upper segment (the rest of the total). Bar 1 'Could be parcels': total about 2,650 (top about 2,650 on the axis, estimated), Ecommerce segment top about 550 (estimated; the bar top is about 2,650 and the red segment ends near 550), dark grey segment about 2,100 (estimated). Bar 2 'Could be custom delivered or collected': total about 1,800 (estimated), Ecommerce segment about 50 (estimated, thin red strip at the base), dark grey segment about 1,750 (estimated). The label 'Ecommerce' is printed in white inside the red segment of bar 1. No legend is printed. Bars are solid rectangles with a thin white separator line between the red and grey segments. No highlighted points.
Slide 29
Ecommerce as logistics / What’s Amazon’s market? / US retail revenue by delivery model, 2019 ($bn) / 3,000 / 2,500 / 2,000 / 1,500 / 1,000 / 500 / Other ecommerce / Amazon / 0 / Could be parcels / Could be custom delivered or collected / Source: US Census / Benedict Evans / –– January 2021 / 29
Visuals: Stacked column chart, titled 'US retail revenue by delivery model, 2019 ($bn)'. Y-axis: $bn, range 0 to 3,000, gridlines dotted every 500 at 0, 500, 1,000, 1,500, 2,000, 2,500, 3,000. X-axis categories: 'Could be parcels' and 'Could be custom delivered or collected'. Series, bottom to top: Amazon (red #EB483F), Other ecommerce (salmon #F5A39F), and an unlabelled dark grey segment (#535353). Column 1 'Could be parcels': Amazon segment about 190 (top about 200), Other ecommerce segment about 360 (from about 200 to about 555), dark grey segment about 2,110 (from about 555 to about 2,660). Column 2 'Could be custom delivered or collected': Amazon segment about 0 to 10 barely visible, other ecommerce about 40 (top about 55), dark grey segment about 1,740 (from about 55 to about 1,800). No values are printed on the segments; values are estimates. No legend; series are labelled directly inside the first column. No highlighted points. Columns are solid flat fills with thin white separators between segments. The baseline is a thin grey horizontal axis line at 0.
Slide 30
Ecommerce as logistics / Amazon has 35-40% of US ecommerce, but what’s the real market? / US retail revenue by delivery model, 2019 ($bn) / 3,000 / 2,500 / 2,000 / 1,500 / 1,000 / 500 / Grocery / Other ecommerce / Amazon / 0 / Could be parcels / Could be custom delivered or collected / Source: US Census / Benedict Evans –– January 2021 / 30
Visuals: Chart: stacked column chart, titled 'US retail revenue by delivery model, 2019 ($bn)'. Y-axis: $bn from 0 to 3,000 in steps of 500, with light grey dotted horizontal gridlines at each step. X-axis: two categories, 'Could be parcels' and 'Could be custom delivered or collected', with a thin grey baseline. Column 1 'Could be parcels' (about total 2,650): Amazon segment red about 0 to 190 (labelled 'Amazon'), Other ecommerce segment salmon about 190 to 550 (labelled 'Other ecommerce'), unlabelled dark grey segment about 550 to 2,650. Column 2 'Could be custom delivered or collected' (about total 1,790): thin salmon bottom segment about 0 to 50, Grocery mid-grey segment about 50 to 820 (labelled 'Grocery'), dark grey top segment about 820 to 1,790. No values are printed on the segments; the figures above are estimates from the axis. Annotation: a red arrow (#EB483F, about 2px line with filled arrowhead) runs from just right of column 1 at about 350 level upward to the right, pointing at column 2 at about 300 level, with a dark grey '?' glyph above its midpoint. No legend.
Slide 31
Meanwhile - bundling and unbundling
Amazon Marketplace is now ~60% of ecommerce GMV
Third party as share of Amazon GMV
70%
60%
50%
40%
30%
20%
10%
0%
2000
2005
2010
2015
2020
Source: Amazon, @BenedictEvans
Benedict Evans
–– January 2021
31
Visuals: One line chart. Title: Third party as share of Amazon GMV. Y axis: percentage share of Amazon GMV, ticks 0% to 70% in 10% steps, dotted light grey gridlines at each tick. X axis: years 2000 to 2020, labelled at 2000, 2005, 2010, 2015 and 2020, one data point per year. Single series in red with circular markers, values about: 2000 3%, 2001 6%, 2002 17%, 2003 22%, 2004 25%, 2005 28%, 2006 28%, 2007 29%, 2008 30%, 2009 31%, 2010 34%, 2011 38%, 2012 42%, 2013 46%, 2014 49%, 2015 51%, 2016 54%, 2017 56%, 2018 58%, 2019 59%, 2020 60%. Values are estimates read from the plot, none printed on the slide. No legend. No highlighted points beyond the uniform markers; the final point at 2020 sits at about 60%. Line rises steeply 2001 to 2003, flattens 2004 to 2009, then rises steadily to 2020.
Slide 32
Chinese supply chain bundles and unbundles? / Chinese suppliers use Amazon (and other marketplaces) to go direct to the end customer / Share of Amazon Top Sellers based in China / 50% / 40% / 30% / 20% / 10% / 0% / 2016 / 2017 / 2018 / 2019 / 2020 / Source: Marketplace Pulse / Benedict Evans — January 2021 / 32
Visuals: Vertical bar chart titled 'Share of Amazon Top Sellers based in China'. Y axis runs 0% to 50% in 10% steps with dotted light grey gridlines at each step; no axis title. X axis shows years 2016, 2017, 2018, 2019, 2020 with a thin grey baseline at 0%. Single series, bars in red #EB483F, evenly spaced, each about 6 percent of slide width. Printed values: none; estimated values from bar tops: 2016 about 16%, 2017 about 22%, 2018 about 26.5%, 2019 about 34%, 2020 about 42.5%. No legend. No highlighted points; all bars same colour.
Slide 33
But who needs Amazon? Shopify goes direct / Shopify has come from nowhere (well, Canada) to over $100bn of GMV in 2020 / Shopify GMV ($bn) / 100 / 80 / 60 / Q3 / 40 / Q2 / 20 / Q1 / 0 / 2014 / 2015 / 2016 / 2017 / 2018 / 2019 / Q1-Q3 2020 / Source: Shopify / Benedict Evans / —— January 2021 / 33
Visuals: Vertical bar chart titled 'Shopify GMV ($bn)'. Y-axis: 0 to 100 in steps of 20 with light dotted gridlines at 20, 40, 60, 80 and 100; units $bn. X-axis categories: 2014, 2015, 2016, 2017, 2018, 2019, Q1-Q3 2020. Bars are dark grey #535353 for 2014 through 2019; values are not printed, so approximately 4 for 2014, about 8 for 2015, about 16 for 2016, about 26 for 2017, about 41 for 2018, about 61 for 2019. The final bar Q1-Q3 2020 is a stacked red bar #EB483F split into three segments with thin white separators: Q1 at the bottom, about 17 tall, Q2 in the middle to about 48, and Q3 on top to about 78, each segment labelled in white text inside the bar. The Q1-Q3 2020 total is about 78 and is the only highlighted bar. No legend. Source line reads 'Source: Shopify'.
Slide 34
Why does Shopify matter?
A software tool that rides a structural shift in the market
“No-one can / compete with / Amazon”
“Wasn’t this / already solved?”
Brands and / consumers ready to / go direct
Benedict Evans —— January 2021 34
Visuals: Three filled circles of equal size (each about 22.1% wide and 39.3% tall of the slide, rendered as circles). Circle 1 at left is dark grey #535353 and holds the quote “No-one can compete with Amazon”. Circle 2 at centre is dark grey #535353 and holds the quote “Wasn’t this already solved?”. Circle 3 at right is red #EB483F and holds the text Brands and consumers ready to go direct. Text is white, centred in each circle, set in a serif face. No photographs, icons, logos or charts.
Slide 35
Lockdown drives a wider funnel / Consumers are broadening online shopping behaviour / US online product search by channel / Google / Amazon / Other / 100% / 75% / 50% / 25% / 0% / Before lockdown / During lockdown / Source: Activate / Benedict Evans / —— January 2021 / 35
Visuals: Stacked column chart titled 'US online product search by channel'. Y-axis: percentage of US online product search, 0% to 100%, gridlines dotted at 25% intervals, labels 0%, 25%, 50%, 75%, 100%. X-axis categories: 'Before lockdown' and 'During lockdown'. Series stacked bottom to top: Other (red #EB483F), Amazon (dark grey #535353), Google (light grey #A7A7A7). Before lockdown: Other about 14%, Amazon about 59% (from about 14% to about 73%), Google about 27% (from about 73% to 100%). During lockdown: Other about 37%, Amazon about 42% (from about 37% to about 79%), Google about 21% (from about 79% to 100%). Values are estimates; the slide prints no data values. Legend at top-left of chart in order Google, Amazon, Other, each with a small square swatch. No highlighted points. Thin white separators between stacked segments. Bars are boxed rectangles with no rounding.
Slide 36
As the internet moves up the funnel / From price comparison to expertise and recommendation / Relative search interest, UK / Best / Cheap / 125 / 100 / 75 / 50 / 25 / 0 / 2004 / 2005 / 2006 / 2007 / 2008 / 2009 / 2010 / 2011 / 2012 / 2013 / 2014 / 2015 / 2016 / 2017 / 2018 / 2019 / 2020 / 2021 / Source: Google Trends / Benedict Evans — January 2021 / 36
Visuals: Chart: line chart, titled Relative search interest, UK. Y axis: relative search interest, unitless index, range 0 to 125, gridlines and labels at 0, 25, 50, 75, 100 and 125, dotted light grey gridlines. X axis: years 2004 to 2021, one label per year, monthly data points. Series 1, Best (red line, about #E8443A): starts about 28 in early 2004, stays about 25 to 35 until about 2010, rises to about 53 in early 2011, about 70 in 2013, about 85 in 2016, about 90 in 2018, peaks at about 100 in 2020 and ends at about 97 in early 2021. Series 2, Cheap (dark grey line, about #4D4D4D): starts about 63 in 2004, peaks about 74 in late 2004, falls to about 30 to 40 by 2009 with a dip about 23 in early 2011, about 30 by 2014, about 25 in 2017, about 20 in 2019, dips to about 17 in 2020 and ends about 16 in early 2021. Legend: at top left of chart, red line marker labelled Best above dark grey line marker labelled Cheap. No highlighted points. Chart title and axis labels are the only text besides legend.
Slide 37
Accelerate the inevitable / The US is massively over-stored - Latam is massively under-stored / Mall penetration (GLA per 1000 people) / 2,500 / 2,000 / 1,500 / 1,000 / 500 / 0 / USA / Canada / Australia / UK / Chile / Mexico / Brazil / Source: Costar / Benedict Evans –– January 2021 / 37
Visuals: Bar chart (vertical, single series, red bars). Title: 'Mall penetration (GLA per 1000 people)'. Y-axis: 0 to 2,500 with labelled gridlines at 0, 500, 1,000, 1,500, 2,000 and 2,500 (unit: GLA per 1000 people); faint grey dotted horizontal gridlines at each labelled value; no axis title. X-axis: categories USA, Canada, Australia, UK, Chile, Mexico, Brazil, with a thin grey baseline at 0. Series values are not printed; approximate values read from bar heights: USA about 2,190; Canada about 1,580; Australia about 1,030; UK about 420; Chile about 180; Mexico about 160; Brazil about 70. No legend. No highlighted points; all bars the same red #EB483F, evenly spaced, each about 4.2% of slide width wide. No photographs, logos or icons.
Slide 38
Brands go digital, or go direct / B2B businesses learning new channels, and learning B2C / Ecommerce as % sales, 2020 / 30% / 25% / 20% / 15% / 10% / 5% / 0% / L'Oreal / Nestlé / P&G / Reckitt / Unilever / Hershey / Source: Companies / Benedict Evans / –– January 2021 / 38
Visuals: Vertical bar chart titled 'Ecommerce as % sales, 2020'. Y-axis runs 0% to 30% in 5% steps with light grey dotted gridlines at each step, labels right-aligned to the left of the plot. X-axis categories: L'Oreal, Nestlé, P&G, Reckitt, Unilever, Hershey, with a thin grey baseline at 0%. Series values: L'Oreal about 25% (highlighted in red #EB483F), Nestlé about 12%, P&G about 10%, Reckitt about 10%, Unilever about 8%, Hershey about 2%; all other bars dark grey #535353. No legend. Bars are flat rectangles with no labels above them; the highlighted point is the L'Oreal bar.
Slide 39
Nike goes direct
Nike has the brand, product and scale to go direct to its customers
Left Amazon in / 2017 after a 2 / year trial
40% revenue is / D2C and 22% is / Nike.com
#1 global fashion / site with 150m / uniques
Source: Nike, Similarweb
Benedict Evans — January 2021
39
Visuals: Three identical solid red filled circles in a row, each about 22.1% of slide width and 39.3% of slide height, with no outline, no shadow and no gradient. Each circle carries a centred white serif text label. The circles are not photographs, charts or logos; no other visual elements.
Slide 40
The ecommerce margin question
Ecommerce changes retail and brand leverage
Retailer
Fulfilment is an
extra cost added to
the fixed cost of
stores
↓
Big brand
Fulfilment is
cheaper than a
retailer’s 50%
margin
↑
New brand?
Marketing +
fulfilment versus
marketing +
retailer margin
?
Benedict Evans
—— January 2021
40
Visuals: Three white circles with red outlines, each containing centred text, each with a dark grey symbol below: a downward arrow (↓) under the Retailer circle, an upward arrow (↑) under the Big brand circle, and a question mark (?) under the New brand? circle. Circles are about 21.7% of slide width, outlines about 0.3% of slide height in red #E8453C. Arrows are dark grey #535353, down arrow solid with triangular head, up arrow solid with triangular head, question mark in serif type. No photographs, charts or logos.
Slide 41
How do you reach your customers? Why?
US brands & retailers spend $7-800bn to reach their customers
Retail rents?
$250bn
Parcels?
$130bn
Logistics
“How do I get it?”
Advertising?
$200bn
Discovery
“What do I want?”
Marketing?
$200bn
Returns?
25-50%
Source: Pitney Bowes, Zenith, Costar
Benedict Evans — January 2021
41
Visuals: Two solid red circles (#EB483F), each about 20.7% wide and 36.8% tall, with white serif labels inside. Two solid grey block arrows (#A7A7A7), each about 5.2% by 9.3%: the left one points right from the Logistics circle toward the centre column, and the right one points left from the Discovery circle toward the centre column. Between the arrows is a centred text stack of five labelled figures, no chart. No photographs, logos or icons.
Slide 42
Disrupted retail, meet / disrupted advertising / Benedict Evans — January 2021 / 42
Slide 43
Reshaping advertising and marketing / Yes, print and internet - but look at the top line / US advertising as % GDP / Internet / Magazines / Newspapers / Radio / TV / 1.50% / 1.25% / 1.00% / 0.75% / 0.50% / 0.25% / 0.00% / 1950 / 1960 / 1970 / 1980 / 1990 / 2000 / 2010 / 2019 / Source: McCann, Zenith, BLS, @BenedictEvans / Benedict Evans –– January 2021 / 43
Visuals: Stacked area chart titled 'US advertising as % GDP', showing US advertising as a percentage of GDP from 1950 to 2019. Y axis runs 0.00% to 1.50% in 0.25% steps with faint dotted horizontal gridlines at 1.25%, 1.00% and 1.50%. X axis labelled with years 1950, 1960, 1970, 1980, 1990, 2000, 2010, 2019. Five stacked series from bottom to top: TV (#DDDDDD, lightest grey), Radio (#A7A7A7), Newspapers (#424242, dark charcoal), Magazines (#686767), Internet (#EC473F, red, top layer). Total stack about 1.13% in 1950, peaking near 1.48% around 2000, falling to about 0.93% by 2019. Internet appears from about 1997 and rises to about 0.42% of GDP by 2000 before declining with the stack; by 2019 it spans roughly 0.53% to 0.93%, about 0.40% of GDP. TV is about 0.06% in 1950, about 0.52% at its 1986 high and about 0.32% in 2019. No individual printed data values are shown beyond axis ticks; the values above are estimates. Legend at upper left of chart listed top to bottom: Internet (red square), Magazines, Newspapers, Radio, TV (grey squares), with labels in dark grey. Internet is the highlighted series in red.
Slide 44
Does ‘online advertising’ really exist? / Platforms give efficient proprietary targeting. And then there’s everything else… / US online ad revenue, 2020 ($bn) / Search / Intent / Amazon / Intent / Facebook / Interest / Next 5 / Other? / 0 / 25 / 50 / 75 / 100 / 125 / Source: Company data, Zenith, GroupM, @BenedictEvans / Benedict Evans –– January 2021 / 44
Visuals: One horizontal stacked bar chart. Chart title: 'US online ad revenue, 2020 ($bn)'. Value axis: horizontal, labelled with ticks 0, 25, 50, 75, 100, 125 (units $bn, range 0 to 125), with thin dotted light grey vertical gridlines at each tick. Category axis: none printed; a thin solid grey vertical baseline at x 20.6%. Single bar (one row) spanning y 49.4% to 66.8%, divided into five segments in order left to right: Search Intent, about 55 (0 to about 55, #EB483F, red); Amazon Intent, about 14 (about 55 to about 69, #F0766F, coral); Facebook Interest, about 35 (about 69 to about 104, #F5A39F, light salmon); Next 5, about 5 (about 104 to about 109, #535353, dark grey); Other?, about 16 (about 109 to 125, #A7A7A7, mid grey). Values are estimates from bar lengths; the slide prints no numeric values for segments. No legend; segment names are printed inside the bars in white. Highlighted points: none. Segments separated by thin white hairlines.
Slide 45
Does ‘online advertising’ really exist?
Platforms give efficient proprietary targeting. And then there’s everything else…
US ad revenue, 2020 ($bn)
Online
Search
Amazon
Other
Offline
TV
Radio
Offline
0
25
50
75
100
125
Source: Company data, Zenith, GroupM, @BenedictEvans
Benedict Evans
––
January 2021
45
Visuals: One horizontal stacked bar chart. Type: horizontal stacked bar chart. Title: 'US ad revenue, 2020 ($bn)', bold, top-left above the plot. X-axis: value axis 0 to 125, unit $bn (stated in the chart title), tick labels 0, 25, 50, 75, 100, 125 with faint dotted vertical gridlines at each tick running from about y 36% to 80%. Y-axis: two categories, Online (upper bar) and Offline (lower bar), labels right-aligned to the left of the axis; a thin solid grey vertical axis line at x about 20.6%. Series (estimates marked about, as the slide prints no values per segment): Online bar totals about 125 — Search about 55 (red #EB483F), Amazon about 14 (coral #F0766F), Facebook about 35 (light salmon #F5A39F), an unlabelled dark segment about 6 (#535353), and Other about 15 (grey #A7A7A7). Offline bar totals about 87 — TV about 54 (grey #A7A7A7), Print about 15 (dark grey #535353), Radio about 11 (mid grey #6A6A6A), and an unlabelled light segment about 7 (#DCDCDC). Labels are printed inside segments in white sans-serif text, with the Online and Offline labels printed only on the Search, Amazon, Facebook, TV, Print and Radio segments. No legend. No highlighted points. Segments separated by thin white borders. Online bar is in red and pink tones; Offline bar is in grey tones, so the two categories are colour-contrasted.
Slide 46
Amazon’s sales tax
Amazon has built a $15bn+ ‘search ad’ business (retailers just call this marketing)
Amazon ‘Advertising & other’ revenue ($bn)
25
20
15
10
5
0
2014
2015
2016
2017
2018
2019
2020
Source: Amazon
Benedict Evans — January 2021
46
Visuals: One vertical bar chart. Title: ‘Amazon ‘Advertising & other’ revenue ($bn)’. Y axis: $bn, range 0 to 25, labelled ticks at 0, 5, 10, 15, 20, 25, with light grey dotted horizontal gridlines at each tick. X axis: years 2014 to 2020, one category each, with a solid grey baseline at 0. Single series of seven bars with no printed data labels; values are estimates: 2014 about 1.2, 2015 about 1.6, 2016 about 2.8, 2017 about 4.6, 2018 about 10.1, 2019 about 14.0, 2020 about 21.5. Bars are dark grey #535353 except the 2020 bar, which is highlighted in red #EB483F. No legend. Bars are flat with no outline, about 4.3% of slide width each, evenly spaced.
Slide 47
(Yes, these are big questions for ad agencies)
Source: AMC
Benedict Evans
–– January 2020
–– January 2021
47
Visuals: One photograph on the right: a man in a grey-blue glen check suit, white shirt with cuffs, and navy tie with yellow and blue diagonal stripes, leaning forearms on a polished wooden bar and looking left toward the edge of the frame, with a glass ashtray in front of him and a whisky glass on a coaster at the right edge. Behind him, out of focus, a second man in a tan shirt stands near an illuminated amber jukebox; the room has dark green walls, framed pictures and a dark wooden door. Lighting is low-key and warm, with amber practical lights and soft shadows. Dominant colours are dark olive green, brown wood, amber and slate blue-grey. The photo is full-bleed to the top, bottom and right edges, cropped at the right, unboxed, with no overlay or tint. No logos or icons.
Slide 48
The ‘cookie apocalypse’
The basis of aggregated interest targeting for 20 years is going away, with no clarity on a replacement
EU/CA + Apple & Google limit cookies
Privacy! But also: less relevance less ad revenue
Many proposals but no clarity on what comes next
Benedict Evans –– January 2021
48
Visuals: Three filled circles of equal size in a left-to-right row, each about 22% of slide width and 39% of slide height, centred vertically on the slide. Circle 1 is dark grey #535353 with white serif text 'EU/CA + Apple & Google limit cookies'. Circle 2 is dark grey #535353 with white serif text 'Privacy! But also: less relevance less ad revenue'. Circle 3 is red #EB483F with white serif text 'Many proposals but no clarity on what comes next'. Between circles 1 and 2, and between circles 2 and 3, sits a flat right-pointing block arrow in light grey #A7A7A7, about 5% of slide width and 9% of slide height, with a short rectangular shaft and a triangular head. No photographs, charts, logos or icons.
Slide 49
The problem with cookies / No-one would really defend the cookie model today. But… / Display advertiser spend by attribution / 100% / 7% / 8% / 10% / 75% / 15% / 8% / 1% / 50% / 25% / 0% / Ad spend / Agency / DSP / Demand side tech / 'Unknown' / SSP / Supply side tech / Publisher revenue / Source: ISBA/PwC / Benedict Evans / –– January 2021 / 49
Visuals: Waterfall chart titled 'Display advertiser spend by attribution', y-axis 0% to 100% in 25% steps with dotted horizontal gridlines at each step, x-axis categories left to right: Ad spend, Agency, DSP, Demand side tech, 'Unknown', SSP, Supply side tech, Publisher revenue. Series values as printed: Ad spend bar spans 0% to 100% (dark grey #535353, no label); Agency floating bar 7% (light pink, top near 100%); DSP 8% (light pink); Demand side tech 10% (light pink); 'Unknown' 15% (solid red, highlighted, label in white); SSP 8% (light pink); Supply side tech 1% (light pink, thin sliver); Publisher revenue bar spans 0% to about 51% (dark grey #535353, no label, top sits just above the 50% gridline). Floating bars step down from top left to lower right. Light pink bars are #F8D7D7 approximately, with dark grey labels #535353; the highlighted 'Unknown' bar is red about #E84A3F. No legend. Highlighted point: 'Unknown' 15% bar in red. No axis titles or units beyond percentage signs.
Slide 50
A ‘winners take most’ market? / Unclear how advertising will function outside of top sites and platforms / Platforms / Google/FB/Amazon can target internally / Big publishers / 1st party data: New York Times has the scale to track internally / Independents / No cross-site aggregation = much less money? / Benedict Evans –– January 2021 50
Visuals: Three identical white circles with thick red outlines, arranged in a horizontal row. Each circle contains a bold heading and a centred body text block. Circle 1 (left): heading 'Platforms', body 'Google/FB/Amazon can target internally'. Circle 2 (centre): heading 'Big publishers', body '1st party data: New York Times has the scale to track internally'. Circle 3 (right): heading 'Independents', body 'No cross-site aggregation = much less money?'. No photographs, charts or logos. Circles are flat with no shadow, red outline about #E8473F, roughly 0.3% of slide height stroke width. No values are printed.
Slides 51 to 134 continue in the full text file.
Download this deck
The hosted PDF of every library deck is free for readers of the SlideDeck Co newsletter. Join with your email and the viewer and download appear here.
Building a deck of your own? The SlideDeck Co Standard Deck is a slide library for business presentations: reviews, updates and plans.







