

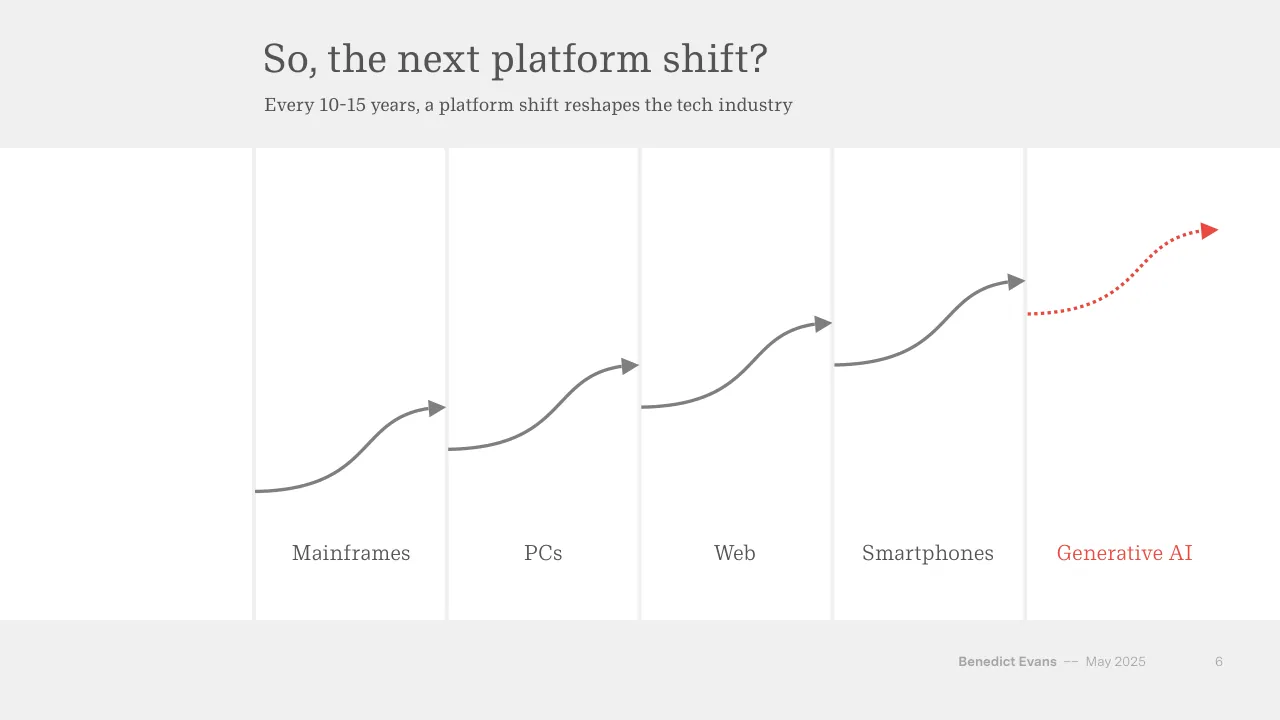
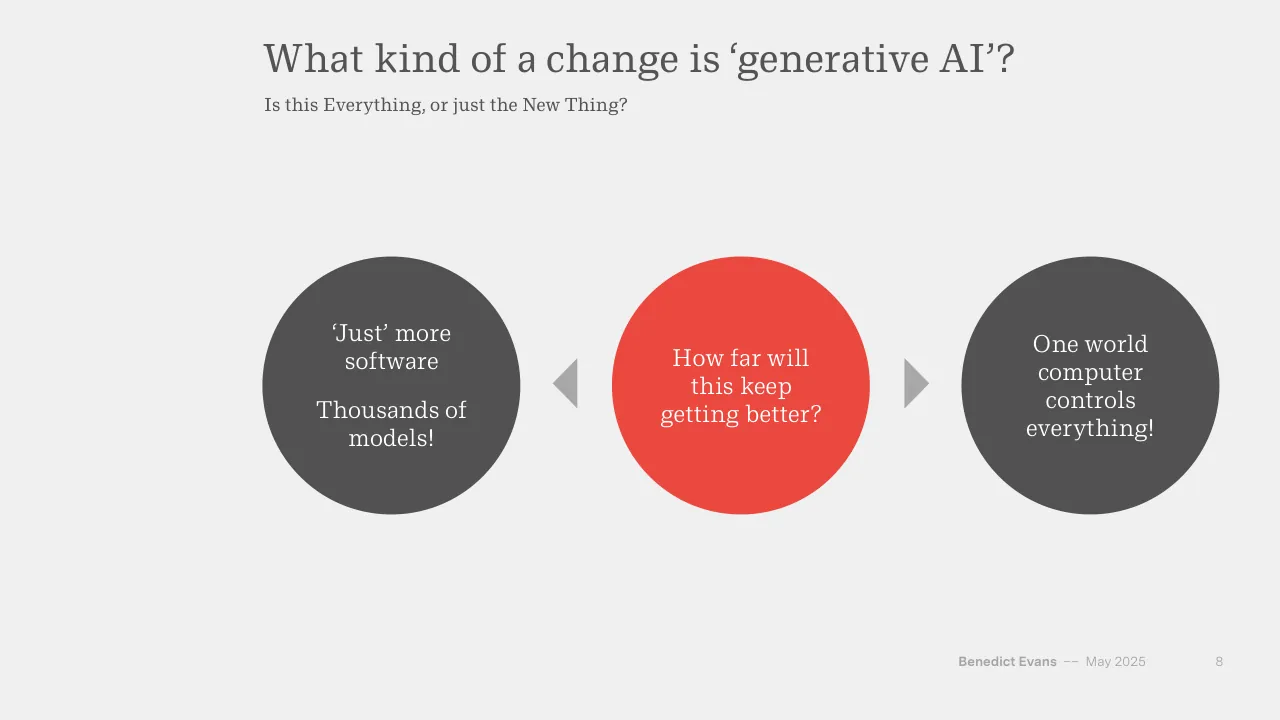
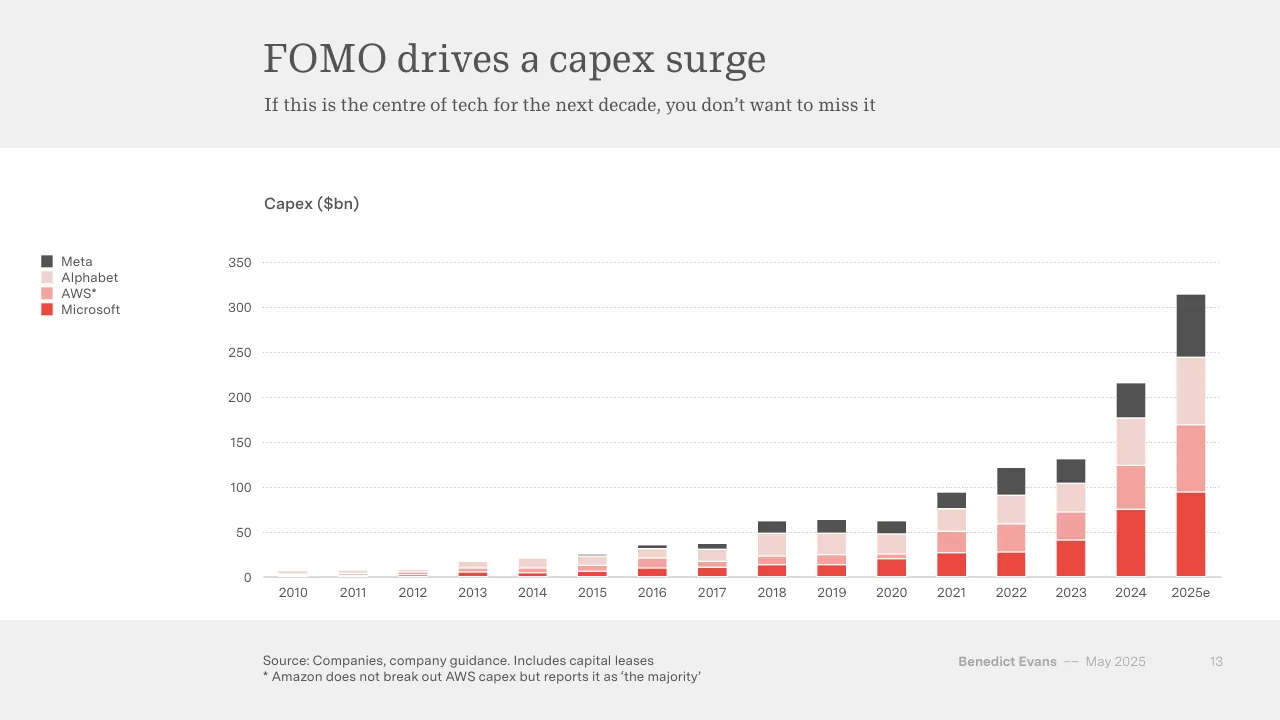
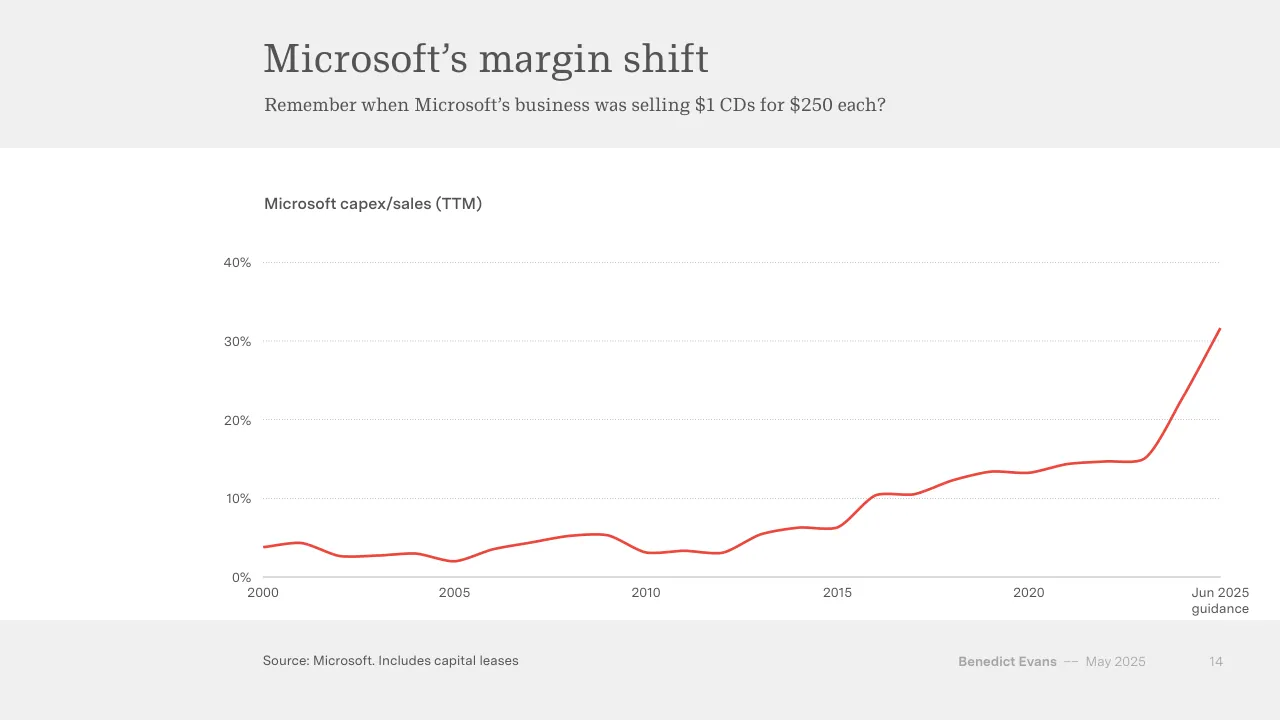
The deck opens with a title slide and a sequence of quotations about AI, framing the question of whether generative AI is just another platform shift or something larger. It then moves through named sections: model building, where the author examines capital spending, falling model prices, open source and the lack of obvious moats; deployment, where he argues that LLMs make software probabilistic and that enterprises face slow, uncertain adoption; and a closing section on how past platform shifts and new technologies have been absorbed, disrupted or redefined. Later slides cover startups unbundling incumbents, where advertising money flows, and how industries change over time. The deck ends with a short biography slide and a thank-you slide. Slides worth studying include the platform-shift timeline on slide 6, the simple three-circle framing on slide 8, the Microsoft margin chart on slide 14, and the large-number chart on slide 13, where data and short takeaway headlines carry the argument.
Slides worth studying
Questions about this deck
What does the Benedict Evans deck say about price changes for AI models?
Slide 18 is titled "Ongoing price collapse" and quotes "An LLM is the most expensive and fastest-depreciating asset in tech history." It shows price per MTOK ($) for model equivalence on a log scale from Dec 2022 to Dec 2024, sourced from the Stanford AI Index.
What does the Benedict Evans deck say about the surge in capital spending on AI?
Slide 13 is titled "FOMO drives a capex surge" and says "If this is the centre of tech for the next decade, you don't want to miss it." Its chart of capex ($bn) covers Meta, Alphabet, AWS and Microsoft from 2010 to 2025e.
What does the Benedict Evans deck say about how enterprises are adopting generative AI?
Slide 44 says "A quarter of CIOs have launched something - but 40% don't plan anything until at least 2026." Slide 43 adds that enterprise software takes time and comes with early disappointments.
How is the Benedict Evans deck structured into sections?
Slide 11 marks the "Model building" section and slide 26 marks the "Deployment" section. Slide 35 opens the closing discussion with the question "What's the standard pattern?" and lists the responses as absorb, innovate and disrupt.
Details
- Company: Benedict Evans
- Year: 2025
- Type: Conference talk
- Industry: Technology analysis
- Pages: 59
More from Benedict Evans
- Benedict Evans conference talk, 2026
- Benedict Evans conference talk, Autumn 2025
- Benedict Evans conference talk, 2023
- Benedict Evans conference talk, 2023
- Benedict Evans strategy presentation, 2022
- Benedict Evans conference talk, 2021
All Benedict Evans decks in the library
Review score: 8 out of 10, Strong
Presentation quality, judged with the SlideDeck Co review heuristic. Ask, evidence and idea merit are not rated here.
The deck has a clear argument that runs from framing (slides 2-10), through model building and deployment, to a closing 'no-one knows' stance, with section dividers and consistent takeaway titles such as 'FOMO drives a capex surge' (13). Charts are clean, sourced, and use red sparingly to point at the key series, and the three-circle device on slides 8 and 12 repeats a simple structure the audience learns quickly. Weaknesses are many near-empty quote slides and circle slides, small chart labels and tiny footers, a left margin that leaves dead space (6, 13), and a few weak pages such as 22, 38 and 41, where the image or screenshot adds little.
Worth keeping: Keep the action-style titles with a one-line subtitle, the restrained red-on-grey palette that highlights one series per chart, and the sourced, uncluttered charts like 13 and 14.
Most useful repair: Enlarge axis labels, legends and in-chart text on the chart slides, and make the screenshots on 38 and 41 legible or crop them to the one point that matters.
What would change the score: I would merge or cut some of the sparse quote and circle slides (4, 5, 9, 25, 50) and add a single annotation per chart to state the takeaway directly.
Confidence high. 59 of 59 pages inspected on contact sheets, 4 at readable size. Reviewed 2026-11-08. Model-assisted review (claude-sonnet-5-5).
Full text of the slides (59 slides)
Every slide's words and a description of its charts and images, so the deck can be searched and rebuilt. Also available as Markdown.
Slide 1
AI eats the world
Benedict Evans
May 2025
www.ben-evans.com
[hidden under the red box, not visible: Benedict Evans –– December 2020]
Visuals: none (the translucent panel and white rule are decorative shapes only; no photographs, charts, logos or icons)
Slide 2
“AI is whatever machines can’t do yet”
Larry Tesler, 1970
Benedict Evans
–– May 2025
2
Slide 3
Historically, once ‘AI’ works it’s just software
‘AI’ seems to mean whatever just started working, or maybe whatever almost works
Databases
1975: Super- / human memory! / 2025: software
Machine / learning
2015: AI! / 2025: software
LLMs
2025: AI! Super- / Intelligence! / 2035: software?
Benedict Evans
–– May 2025
3
Visuals: Diagram: three circles connected left to right by two solid grey right-pointing triangles (arrowheads). Circle 1 (left) is labelled 'Databases' with lines '1975: Super-human memory!' and '2025: software'. Circle 2 (centre) is labelled 'Machine learning' with lines '2015: AI!' and '2025: software'. Circle 3 (right) is labelled 'LLMs' with lines '2025: AI! Super-Intelligence!' and '2035: software?'. The first two circles have dark grey outlines; the third circle has a red outline and is visually emphasised. The circles are flat white fills with no shadow. The triangles are filled #A6A6A6 with no outline, pointing right, and sit in the gaps between circles (about x 43 to 45% and x 71 to 73%, y 50 to 57%). No photographs, charts or icons.
Slide 4
Yes, but…
“In my lifetime, I’ve seen two
demonstrations of tech that struck me as
revolutionary: the GUI and ChatGPT”
Bill Gates, March 2023
Benedict Evans –– May 2025 4
Slide 5
“The final race to AGI is afoot”
Sergey Brin, February 2025
Benedict Evans
–– May 2025
5
Slide 6
So, the next platform shift?
Every 10-15 years, a platform shift reshapes the tech industry
Mainframes
PCs
Web
Smartphones
Generative AI
Benedict Evans –– May 2025
6
Visuals: Five curved connector arrows, each drawn as a smooth S-curve rising from the lower-left of one column into the next, with the arrowhead at the right end. The first four arrows (Mainframes, PCs, Web, Smartphones) are solid mid-grey #808080 strokes of about 0.3% slide height with grey filled triangular arrowheads. The fifth arrow, leaving the Generative AI column from the left and rising to the upper right, is a red #EB483F dotted stroke with a red filled triangular arrowhead, marking the next shift. Each arrow starts at the bottom of the previous column's label area and climbs upward: Mainframes arrow starts near y 76% and ends near y 56%; PCs arrow starts near y 62% and ends near y 48%; Web arrow starts near y 56% and ends near y 42%; Smartphones arrow starts near y 50% and ends near y 36%; Generative AI arrow starts near y 42% and ends near y 27%. No photographs, logos or icons.
Slide 7
So, the next platform shift? Or more? / But if these models really do keep scaling, the change could be a lot bigger / ? / Mainframes / PCs / Web / Smartphones / Generative AI? / Benedict Evans / –– May 2025 / 7
Visuals: Five grey curved arrows and two red dotted arrows, drawn as a diagram of platform shifts. Grey solid arrows, each an S-shaped curve rising left to right with a filled triangular arrowhead, run from the bottom-left of the Mainframes column through the PCs, Web and Smartphones columns, each ending at the left edge of the next column; the Smartphones arrow ends at the left edge of the Generative AI column. From that point a red dotted line splits into two: one dotted curve rises steeply up and off the top of the slide with a filled red arrowhead at about 2% from the top; a second dotted curve rises gently to the right and ends in a filled red arrowhead at the right side of the Generative AI column. A red question mark sits in the wedge between the two red dotted arrows. No photographs, logos or icons.
Slide 8
What kind of a change is ‘generative AI’? / Is this Everything, or just the New Thing? / ‘Just’ more software / Thousands of models! / How far will this keep getting better? / One world computer controls everything! / Benedict Evans –– May 2025 / 8
Visuals: Three filled circles of equal size arranged left to right in a row: a dark grey circle at left, a red circle in the centre, and a dark grey circle at right. Between the circles are two small grey triangles, the left one pointing left between the left and centre circles and the right one pointing right between the centre and right circles. The circles are flat with no outline or shadow. No photographs, charts or logos.
Slide 9
“In from three to eight / years we will have a / machine with the general / intelligence of an average / human being” / Marvin Minsky, 1970 / “AI is whatever machines / can’t do yet” / Larry Tesler, 1970 / Benedict Evans / –– May 2025 / 9
Slide 10
What’s going on right now? / Two kinds of conversation - this is Something, but it might be Everything / Model Building + Software Deployment / “This will transform humanity!” / Benedict Evans –– May 2025 / 10
Visuals: Two solid filled circles of equal size (22.1% wide by 39.3% tall, so roughly 0.56 aspect-corrected circles) and one vertical dotted line. Left circle: solid red #EB483F, containing white serif text 'Model / Building / + / Software / Deployment' in centred stacked lines. Right circle: solid dark grey #535353, containing white serif text '“This will / transform / humanity!”' in centred stacked lines. Dotted divider: about 0.3% wide, dotted line in red #EB483F, running vertically from about y 31.6% to y 78% at x about 53%, midway between the circles. No photographs, icons or logos. No chart or table.
Slide 11
Model building / Benedict Evans –– May 2025 / 11
Slide 12
Two years of the model wars / Lots of investment, lots of progress, no apparent defensibility / Much more capital / Pricing collapse / Lots of new stuff - agents, multimodal, ‘reasoning’, MCP etc / No obvious moats / Open Source / Benedict Evans –– May 2025 / 12
Visuals: Three filled circles of equal size in a row. Circle 1 at x 19.5%, y 33.9%, 22.1% by 39.3%, solid #535353 dark grey, containing the white text 'Much more capital' and 'Pricing collapse'. Circle 2 at x 46.8%, same size and y, solid #535353, containing 'Lots of new stuff - agents, multimodal, ‘reasoning’, MCP etc'. Circle 3 at x 74.1%, same size and y, solid #EB483F red, containing 'No obvious moats' and 'Open Source'. All circles are flat with no outline, no shadow and no gradient. No photographs, logos or icons.
Slide 13
FOMO drives a capex surge
If this is the centre of tech for the next decade, you don’t want to miss it
Capex ($bn)
Meta
Alphabet
AWS*
Microsoft
350
300
250
200
150
100
50
0
2010
2011
2012
2013
2014
2015
2016
2017
2018
2019
2020
2021
2022
2023
2024
2025e
Source: Companies, company guidance. Includes capital leases
* Amazon does not break out AWS capex but reports it as ‘the majority’
Benedict Evans –– May 2025
13
Visuals: Stacked vertical bar chart titled Capex ($bn), with the y-axis running from 0 to 350 in steps of 50 and labelled in $bn, and the x-axis listing calendar years 2010 to 2024 plus 2025e (estimate). Four series stacked bottom to top: Microsoft (red #EE4B3E), AWS* (salmon #F4A29C), Alphabet (light pink #F2D5D1), Meta (dark grey #545454). No values are printed on the bars; approximate totals read from the chart: 2010 about 7; 2011 about 8; 2012 about 9; 2013 about 17; 2014 about 21; 2015 about 25; 2016 about 36; 2017 about 37; 2018 about 62; 2019 about 64; 2020 about 62; 2021 about 95; 2022 about 122; 2023 about 132; 2024 about 217; 2025e about 315. Approximate Microsoft segments: 2016 about 10, 2018 about 14, 2020 about 20, 2021 about 27, 2022 about 28, 2023 about 40, 2024 about 76, 2025e about 95. Approximate AWS segments: 2021 about 24, 2022 about 31, 2023 about 32, 2024 about 48, 2025e about 75. Approximate Alphabet segments: 2021 about 25, 2022 about 32, 2023 about 28, 2024 about 53, 2025e about 75. Approximate Meta segments: 2021 about 18, 2022 about 31, 2023 about 27, 2024 about 40, 2025e about 70. Legend at top left of chart in order Meta, Alphabet, AWS*, Microsoft, each with a small filled square. Dotted light grey horizontal gridlines at every 50 units. No highlighted points. The 2025e bar is the final bar and is labelled with the e suffix. Bars are boxed in the plot area with thin white separators between segments.
Slide 14
Microsoft’s margin shift / Remember when Microsoft’s business was selling $1 CDs for $250 each? / Microsoft capex/sales (TTM) / 40% / 30% / 20% / 10% / 0% / 2000 / 2005 / 2010 / 2015 / 2020 / Jun 2025 / guidance / Source: Microsoft. Includes capital leases / Benedict Evans / –– May 2025 / 14
Visuals: One line chart, titled 'Microsoft capex/sales (TTM)'. Y-axis: percentage, 0% to 40%, gridlines and labels at 0%, 10%, 20%, 30% and 40%. X-axis: years 2000 to Jun 2025 guidance, labelled at 2000, 2005, 2010, 2015, 2020 and 'Jun 2025 guidance' at the right end. Single series, a smooth red line about 3 pt wide, with no printed data values. Estimated values, marked 'about': 2000 about 3.8%; 2001 about 4.4%; 2002 about 2.7%; 2005 about 2.0% (the low point); 2008 about 5.2%; 2009 about 5.5%; 2010 about 3.2%; 2013 about 5.5%; 2015 about 6.3%; 2016 about 10.5%; 2019 about 13.4%; 2020 about 13.3%; 2023 about 14.8%; the line rises steeply to about 31.5% at Jun 2025 guidance. No legend. No highlighted points; the final point at the right edge is the endpoint of the line. Gridlines are thin dotted light grey lines. The horizontal axis at 0% is a solid thin grey rule.
Slide 15
The Nvidia moat / Nvidia tries to build a new Sun with custom compute and a software ecosystem. (This is also a TSMC chart) / Quarterly revenue ($bn) / Intel / Nvidia / 50 / 40 / 30 / 20 / 10 / 0 / 2000 / 2005 / 2010 / 2015 / 2020 / 2024 / Source: Companies / Benedict Evans / –– May 2025 / 15
Visuals: Line chart titled 'Quarterly revenue ($bn)'. Y-axis: revenue in $bn, range 0 to 50, labelled ticks at 0, 10, 20, 30, 40, 50, with faint dotted horizontal gridlines at each tick. X-axis: calendar years from 2000 to about 2025, labelled ticks at 2000, 2005, 2010, 2015, 2020, 2024, with a thin solid grey baseline at 0. Two series drawn as smoothed lines about 0.4% of slide height thick. Intel (dark grey #545454 line): about 8 in 2000, dipping to about 6.5 in 2001-2003, about 10 in 2008, about 7 in 2009, about 10.5 in 2010, about 13 in 2011, about 13.5 in 2013, about 15 in 2015, peaking about 20 around 2020 and 2022, about 15 in 2023, and about 14 at the end. Nvidia (red #E8453C line): about 0.2 from 2000 to 2007, about 1 in 2008-2013, about 2 in 2016, about 3 in 2018, about 8 in 2022, dropping to about 6 in 2023, then rising steeply to about 39 at the right edge after 2024. Legend at left: short dark grey line segment beside 'Intel' and short red line segment beside 'Nvidia', stacked vertically. No highlighted points or annotations. No values are printed on the chart itself, so all values are estimates.
Slide 16
Models themselves seem to be commodities
No apparent barriers to matching SOTA, and OpenAI’s first-mover lead has steadily eroded
Model quality (LMArena) by release date
OpenAI
All others
1,500
1,250
1,000
750
Dec 2022
Jun 2023
Dec 2023
Jun 2024
Dec 2024
Jun 2025
Source: Companies, LMArena
Benedict Evans
–– May 2025
16
Visuals: Scatter plot titled 'Model quality (LMArena) by release date'. Y axis: model quality score, unitless, range 750 to 1,500, labelled gridlines at 1,000, 1,250 and 1,500 (light dotted grey gridlines), baseline at 750 as a solid thin grey line. X axis: release date, Dec 2022 to Jun 2025, labelled at Dec 2022, Jun 2023, Dec 2023, Jun 2024, Dec 2024 and Jun 2025, with the baseline solid grey. Two series: OpenAI as red filled circles (#E8453C approx.) and All others as grey filled circles (#A6A6A6 approx.), each about 2% of slide width in diameter with a thin white outline, overlapping in places. Values are unlabelled; approximate readings: OpenAI points about 1,190 (Dec 2022), about 1,165 (Jun 2023), about 1,250 (Nov 2023), about 1,105 (Dec 2023), about 1,255 (Feb 2024), about 1,285 (Jun 2024), about 1,335 and 1,300 (Sep 2024), about 1,365 (Dec 2024), about 1,330 to 1,345 (Feb 2025), about 1,345 to 1,410 (Mar to May 2025); the highest grey points reach about 1,445 and 1,460 near May 2025, and the lowest grey points sit near 810 to 850 around mid 2023. Legend at left: a red dot labelled OpenAI above a grey dot labelled All others. No highlighted points beyond the red series colour.
Slide 17
DeepSeek just proves the point
Open source (plus leaky sanctions and $500m of capex) let a Chinese hedge fund rival the best labs
Model quality (LMArena) by release date
OpenAI
DeepSeek
All others
1,500
1,250
1,000
750
Dec 2022
Jun 2023
Dec 2023
Jun 2024
Dec 2024
Jun 2025
Source: Companies, LMArena
Benedict Evans
–– May 2025
17
Visuals: One scatter chart with a connected line series, titled 'Model quality (LMArena) by release date'. Y axis: model quality score (LMArena rating, no unit printed), range 750 to 1,500, labelled ticks at 750, 1,000, 1,250 and 1,500, with dotted light-grey horizontal gridlines at 1,000, 1,250 and 1,500 and a solid grey baseline at 750. X axis: release date, Dec 2022 to Jun 2025, labelled at Dec 2022, Jun 2023, Dec 2023, Jun 2024, Dec 2024 and Jun 2025, with about six months per label interval. Series: OpenAI, red (#E8473B) filled circles, about 25 points, several highlighted in the Dec 2024 to Apr 2025 cluster; DeepSeek, dark charcoal (#3F3F3F) filled circles joined by a thick dark charcoal line, about 12 points rising from about Aug 2024 at about 1,077 to about Dec 2024 near 1,300 and then flattening near 1,370 by about Apr 2025 (estimates; no values printed); All others, mid grey (#A6A6A6) filled circles with thin white outlines, about 110 points spanning roughly 800 to 1,450 with the densest group between 1,000 and 1,250. Legend at left: red dot OpenAI, dark dot joined by a line DeepSeek, grey dot All others. Highlighted points: the DeepSeek series is emphasised by its darker colour and connecting line; the most recent points (about Apr 2025, about 1,370 to 1,440) are the top right of the cluster. A placed raster image (421 by 250 pixels) sits over the upper right of the plot area at about x 69.2%, y 40.9%, width 21.9%, height 23.1%, with its content matching the scatter points in that region. Nothing is cropped or boxed, and there is no photograph or logo.
Slide 18
Ongoing price collapse / “An LLM is the most expensive and fastest-depreciating asset in tech history" / Price per MTOK ($) for model equivalence (log scale) / 100.0 / ChatGPT 4 / ChatGPT 4o / 10.0 / 1.0 / 0.1 / 0.0 / Dec 2022 / Jun 2023 / Dec 2023 / Jun 2024 / Dec 2024 / Source: Stanford AI Index / Benedict Evans / –– May 2025 / 18
Visuals: One line chart (log scale), drawn as a placed image occupying x 29.5% to 96.5%, y 34.3% to 82.4%. Title printed above plot: "Price per MTOK ($) for model equivalence (log scale)". Y axis: logarithmic, labelled 0.0 (baseline at bottom), 0.1, 1.0, 10.0, 100.0 (top gridline); units are dollars per million tokens (MTOK). X axis: time, labelled Dec 2022, Jun 2023, Dec 2023, Jun 2024, Dec 2024, with the plotted range running from roughly Oct 2022 to Dec 2024. Legend at left (x about 6%, y 37% to 40%): dark grey dot-and-line marker labelled ChatGPT 4; red dot-and-line marker labelled ChatGPT 4o. Series ChatGPT 4 (dark grey line, smoothed, with circular markers; values are not printed, so these are estimates): about 37 at about Oct 2022; about 3.2 at about Jun 2023; about 0.72 at about Oct 2023; about 0.5 at about Jan 2024; about 0.26 at about Jun 2024; about 0.13 at about Jul 2024; about 0.10 at about Aug 2024 (end). Series ChatGPT 4o (red line, smoothed, red circular markers; values not printed, estimates): about 7.5 at about Jun 2024 minus a little, placed near Apr to May 2024 start; about 6 at about Jun 2024; about 4.5 at about Aug 2024; about 2.2 at about Oct 2024; about 0.12 at about Nov 2024; about 0.06 at about Dec 2024 (end). No points are highlighted differently; all markers are the same size. Gridlines are light dotted horizontal lines at each labelled decade; the x axis is a thin solid grey baseline at 0.0. The second placed image (x 71.7% to 96.6%, y 34.4% to 82.4%) overlaps the right portion of the chart area and carries no separate content beyond the chart itself.
Slide 19
“The Jevons Paradox!” / Economics for beginners: lower prices generally mean more use, but not necessarily more revenue or profits / Global mobile industry since 2010 (indexed, log scale) / Mobile data traffic / Telecoms stocks / 1,000,000 / 100,000 / 10,000 / 1,000 / 100 / 10 / 1 / 2010 / 2015 / 2020 / 2024 / Source: Ericsson, MSCI World Telecommunications index / Benedict Evans / –– May 2025 / 19
Visuals: One line chart. Type: line chart with two series on a logarithmic y-axis. Title: 'Global mobile industry since 2010 (indexed, log scale)'. Y-axis: logarithmic, indexed value, ticks labelled 1, 10, 100, 1,000, 10,000, 100,000 and 1,000,000, with a dotted light grey gridline at each tick; range 1 to 1,000,000 (1 at the bottom baseline, 1,000,000 at the top gridline). X-axis: years from 2010 to 2024, labelled 2010, 2015, 2020 and 2024, one data point per year, with a solid mid-grey baseline at value 1. Series 1, 'Mobile data traffic', red line (about #E8453C), about 2.5 pt thick: 2010 = 100 (indexed start), 2011 about 250, 2012 about 650, 2013 about 1,400, 2014 about 2,700, 2015 about 4,000, 2016 about 6,000, 2017 about 11,000, 2018 about 22,000, 2019 about 34,000, 2020 about 50,000, 2021 about 68,000, 2022 about 95,000, 2023 about 120,000, 2024 about 150,000 (values estimated from the plotted line; no values printed). Series 2, 'Telecoms stocks', dark grey line (about #4A4A4A), about 2.5 pt thick: 2010 = 100 (indexed start), 2011 about 95, 2012 about 100, 2013 about 115, 2014 about 115, 2015 about 110, 2016 about 112, 2017 about 118, 2018 about 110, 2019 about 130, 2020 about 160, 2021 about 170, 2022 about 125, 2023 about 170, 2024 about 240 (estimated). Legend: top-left of chart, two entries with short line keys, red key for Mobile data traffic and dark grey key for Telecoms stocks; no highlighted points or annotations.
Slide 20
“Better, faster, cheaper: pick two”
Dozens of models trading cost versus performance, and pushing towards the edge
Model quality (LMArena) versus price per million output tokens (USD), March 2025
OpenAI
DeepSeek
Others*
1,500
1,400
1,300
1,200
1,100
$0
$25
$50
$75
$100
$125
$150
Source: Companies, LMArena
Benedict Evans
–– May 2025
20
* Google, Meta, Amazon, Anthropic, Alibaba, Mistral, xAI
Visuals: One scatter chart. Type: scatter plot. Title printed above the plot: 'Model quality (LMArena) versus price per million output tokens (USD), March 2025'. X axis: 'price per million output tokens (USD)' with tick labels $0, $25, $50, $75, $100, $125, $150 (linear, range about $0 to $150, grey tick labels, no axis title printed). Y axis: model quality score with tick labels 1,100, 1,200, 1,300, 1,400, 1,500 (range about 1,100 to 1,530, no axis title printed). Horizontal dotted light grey gridlines at 1,200, 1,300, 1,400 and 1,500; solid thin grey baseline at 1,100 along the x axis. Legend at left: red dot OpenAI, dark grey dot DeepSeek, mid grey dot Others*. Series values are not printed, so all values are estimates marked about. OpenAI (red, #E8403A-like, about 5 points): about $10 at about 1,365; about $4.5 at about 1,304; about $0.7 at about 1,272; about $60 at about 1,352; about $150 at about 1,411 (the rightmost point, the highest-priced model). DeepSeek (dark grey #3A3A3A, 2 points): about $2 at about 1,362; about $1 at about 1,318. Others* (grey #AAAAAA, about 30 points, clustered): about $10 at about 1,440; about $0.5 at about 1,357; about $6 at about 1,336; about $10 at about 1,302; about $15 at about 1,308; about $15 at about 1,283; about $3.5 at about 1,267; about $3 at about 1,246; about $4 at about 1,236; about $8 at about 1,252; about $1 at about 1,282; about $1 at about 1,257; about $0.5 at about 1,248; about $0 at about 1,307; about $0.5 at about 1,218 and 1,212; about $0 at about 1,197, 1,190 and 1,177. No points are highlighted beyond their colour; markers are filled circles about 1.5% of slide width with thin white outlines. Points overlap heavily near $0 to $2 and 1,170 to 1,310.
Slide 21
“Better, faster, cheaper: pick two”
Dozens of models trading cost versus performance, and pushing towards the edge
Model quality (LMArena) versus price per million output tokens (USD), March 2025
1,500
1,400
1,300
1,200
1,100
$0
$25
$50
$75
$100
$125
$150
Source: Companies, LMArena
* Google, Meta, Amazon, Anthropic, Alibaba, Mistral, xAI
Benedict Evans
–– May 2025
21
Visuals: Chart: scatter plot with a fitted red curve, titled 'Model quality (LMArena) versus price per million output tokens (USD), March 2025'. X axis: price per million output tokens in USD, range $0 to $150, labelled ticks at $0, $25, $50, $75, $100, $125, $150; no axis title printed. Y axis: model quality score (LMArena rating, unitless), range 1,100 to 1,500, labelled ticks at 1,100, 1,200, 1,300, 1,400, 1,500; horizontal dotted gridlines at each 100-point tick; solid thin grey baseline at 1,100 along the x axis. Series 1: about 30 light grey circular markers (#D9D9D9 with white outline) with no printed values; estimated positions: about $0.3 at 1,177, about $0.3 at 1,195, about $0.3 at 1,210, about $0.4 at 1,215, about $0.4 at 1,272, about $0.5 at 1,308, about $0.5 at 1,358, about $1.5 at 1,250, about $1.5 at 1,258, about $1.5 at 1,320, about $2.5 at 1,363, about $3 at 1,246, about $3.5 at 1,268, about $4 at 1,305, about $4 at 1,237, about $6 at 1,336, about $8 at 1,253, about $10 at 1,440, about $10 at 1,366, about $10 at 1,303, about $15 at 1,310, about $15 at 1,283, about $60 at 1,353, about $150 at 1,407. Series 2: one red (#FF4B43 approximately) smooth fitted curve line about 4 pt thick rising steeply from about $0 at 1,220 to about $20 at 1,340 then flattening to about $150 at 1,389; no legend. No points are highlighted in a different colour. No legend is shown.
Slide 22
“Feeds & speeds” and a lot of acronyms
Hundred of models, dozens of benchmarks and acronyms - MTOK replaces MHz
PC Magazine Network Edition December 7 1993 cover
Maximum PC January 2002 cover
PC Magazine October 21 1997 cover
Benedict Evans
–– May 2025
22
Visuals: Three photographs of magazine covers, each a scanned front cover in portrait orientation, shown whole and not cropped, each with a soft drop shadow. Left cover: PC Magazine 'Network Edition', dated December 7 1993, Volume 12 Number 21, $2.95. It has a red PC masthead, a printer photo, 'FIRST LOOKS: Get Stunning Color Output From Canon's N... $719 Ink Jet', a blue-tinted 'Blazing Video!' item, a 'Network Management' item, and a large blue '486 BUYERS' GUIDE' cover line with the subhead 'PC Labs Tests 191 of the Fastest PCs Money Can Buy'. A yellow 'THE' badge and a red-and-yellow 'NETWORK EDITION' sticker sit on the masthead; a column of beige '486' desktop PC photos runs down the right edge, partly hidden by the centre cover. Centre cover: Maximum PC, January 2002, yellow background with white sunburst rays, a black 'MAXIMUM PC' masthead, the white headline 'THE SPEED ISSUE', a grey beige desktop tower PC photo at the centre-bottom, a barcode at bottom right and the text 'Quick, Quicker & Quickest - the test results have spoken!'. Right cover: PC Magazine, October 21 1997, Vol. 16 No. 18, white background with a red PC masthead, blue 'Reduce Your PC Expenses' headline, a large black '56K' with red 'MODEMS', an orange and blue modem photograph with motion blur and the label 'SupraExpress 56'. The composition has the covers arranged in a fanned, overlapping row with the centre cover fully visible and the side covers partly hidden. Lighting is flat and even, as on a scan. Dominant colours: yellow, blue, red, black, white, orange.
Slide 23
Product, brand or distribution? / The models may be commodities, but ChatGPT is the only ‘AI’ brand with consumer awareness / Apple app store ranking, USA / ChatGPT / CoPilot / Gemini / Perplexity / Claude / 1 / 50 / 100 / 150 / 200 / 250 / Jun 2023 / Dec 2023 / Jun 2024 / Dec 2024 / May 2025 / Source: SimilarWeb / Benedict Evans –– May 2025 / 23
Visuals: One line chart, titled 'Apple app store ranking, USA'. Type: line chart with an inverted vertical axis. Y axis: app store rank, 1 at top to 250 at bottom, with labelled ticks at 1, 50, 100, 150, 200 and 250, and light dotted horizontal gridlines at each tick. Note: the measured text for the tick labels reads '-50', '-100', '-150', '-200' and '-250', but the rendered slide shows positive values 50 to 250. X axis: date, from Jun 2023 to May 2025, with labelled ticks at Jun 2023, Dec 2023, Jun 2024, Dec 2024 and May 2025; a thin grey baseline sits at the bottom of the plot at rank 250. Series, all with no printed data values: ChatGPT, solid red line (about #E8473B) hovering near rank 1 across the whole period, dipping to about rank 20 to 45 in late 2023 and briefly in early 2025. CoPilot, solid black line, spiking in sharp drops to about rank 135 to 200 at several points between late 2023 and mid 2024, then many deep drops to about rank 110 to 210 in April and May 2025. Gemini, solid mid-grey line (about #AAAAAA), first appearing at about rank 20 in Dec 2024, falling to about rank 60 to 135 in early 2025 and ending near rank 60 in May 2025. Perplexity, sparse dark grey dots, appearing around rank 110 to 150 in early 2025 and in a dense cluster of drops to about rank 200 in late April and May 2025. Claude, pale grey line (about #D9D9D9), a short segment near rank 60 to 145 around Jun 2024. Legend at left, top to bottom: ChatGPT (red line swatch), CoPilot (black line swatch), Gemini (grey line swatch), Perplexity (small dot), Claude (pale grey line swatch). No highlighted points.
Slide 24
‘Big Tech’ strategies: “how do we use this?”
Incumbents always try to absorb the new thing into their existing strategies
Build a hardware platform
Nvidia
Make it a commodity
Amazon, Meta
Sell the APIs
Amazon, Google, Microsoft
Make it a feature
Google, Meta, Microsoft, Apple
Benedict Evans –– May 2025 24
Visuals: Four circles (outline-stroked ellipses with white fill), no photographs or charts. Circle 1 (left) has a red stroke, about #E84C3D, approximately 0.3% of slide width thick; circles 2, 3 and 4 have dark grey strokes about #545454 of the same thickness. Each circle is about 21.7% of slide width in diameter, centred vertically around y 53%. Circle 1 at x 4.0 to 25.7; circle 2 at x 27.5 to 49.2; circle 3 at x 51.0 to 72.7; circle 4 at x 74.5 to 96.2. Circle 1 contains 'Build a / hardware / platform' bold with 'Nvidia' beneath; circle 2 contains 'Make it a / commodity' bold with 'Amazon, Meta' beneath; circle 3 contains 'Sell the APIs' bold with 'Amazon, / Google, / Microsoft' beneath; circle 4 contains 'Make it a / feature' bold with 'Google, Meta, / Microsoft, Apple' beneath. No shadows or gradients.
Slide 25
But what does this mean for the rest of us?
How many acronyms do you need to care about if you’re not an Nvidia shareholder?
Massive / investment and / FOMO in tech
Models getting / better and / cheaper
Models are / commodities, / for now
Benedict Evans –– May 2025 25
Visuals: Three filled circles of equal size in a row, each about 22.1% of slide width and 39.3% of slide height. Left circle dark grey #535353 with white serif text 'Massive / investment and / FOMO in tech'. Middle circle dark grey #535353 with white serif text 'Models getting / better and / cheaper'. Right circle red #EB483F with white serif text 'Models are / commodities, / for now'. No photographs, charts or icons; the circles are flat with no outline or shadow.
Slide 26
Deployment
Benedict Evans –– May 2025 26
Slide 27
From deterministic to probabilistic software / LLMs change what we can expect from software / Traditional / software / Deterministic / Tasks that are / easy to explain to / a computer / Machine / learning / Probabilistic / Tasks that are / hard to explain / to a computer / LLMs / Probabilistic / Tasks that are / easy to explain / to an intern? / Benedict Evans / –– May 2025 / 27
Visuals: Three circles and two arrow shapes, no photographs or charts. Circle 1 (Traditional software) has a dark grey #545454 outline about 0.3% of slide height thick, white fill, centred at about x 30.8%, y 53.0%, diameter about 40% of width. Circle 2 (Machine learning) has the same dark grey outline and white fill, centred near x 58.0%, y 53.0%. Circle 3 (LLMs) has a red outline, about #E84B3C, same size and white fill, centred near x 85.2%, y 53.0%. Between circles 1 and 2 is a solid grey #A6A6A6 right-pointing isosceles triangle at about x 43.0%, y 49.8%, w 1.9%, h 6.8%. Between circles 2 and 3 is an identical grey triangle at about x 70.5%, y 49.8%. No logos, icons or images.
Slide 28
That sounds great, but…
What specifically can we do with tech
that can automate things computers
could never do before?
If the tech might get it wrong?
Benedict Evans –– May 2025 28
Slide 29
What do we do with this? How?
For most people in most kinds of job, it’s not easy to work out what do with an LLM
Blank screen
problem - what
do I want?
How do I ask,
control, steer,
explain, iterate?
What kind of
errors are OK?
Where do we
put the human
in the loop?
Benedict Evans
–– May 2025
29
Visuals: Three filled circles of equal size (each about 22.1% of slide width by 39.3% of slide height, rendered as true circles). Circle 1 (left): dark grey #535353, no outline, containing white text 'Blank screen / problem - what / do I want?'. Circle 2 (centre): dark grey #535353, no outline, containing white text 'How do I ask, / control, steer, / explain, iterate?'. Circle 3 (right): red #EB483F, no outline, containing white text 'What kind of / errors are OK? / Where do we / put the human / in the loop?' with a paragraph gap between 'errors are OK?' and 'Where do we'. No photographs, icons, logos, charts or diagrams; no arrows or connecting lines. Shapes are flat with no shadow or gradient.
Slide 30
Do we use LLMs to control all of our / traditional software?
Or are LLMs just another API to build / software?
Benedict Evans –– May 2025 30
Slide 31
Do chatbots have product-market fit? Who for?
If this is life-changing, why is WAU/DAU so bad? Is this just a matter of time, or is this a product problem?
How many people use generative AI chatbots in the USA?
Weekly active
Daily active
40%
30%
20%
10%
0%
Pew, Aug 2024
CCIA, Nov 2024
NBER RPS, Nov 2024
NBER SWAA, Dec 2024
Bain, Dec 2024
KPMG, Dec 2024
Source: Consumer surveys conducted as of date shown
Benedict Evans
–– May 2025
31
Visuals: Chart: stacked vertical bar chart. Title: How many people use generative AI chatbots in the USA? Y axis: percentage of people, 0% to 40%, gridlines at 10% intervals (dotted light grey lines at 10, 20, 30, 40%), no unit label beyond the % sign. X axis: six survey sources as categories, labels: Pew, Aug 2024 / CCIA, Nov 2024 / NBER RPS, Nov 2024 / NBER SWAA, Dec 2024 / Bain, Dec 2024 / KPMG, Dec 2024. Series 1 (bottom, red): Daily active, #EB483F. Series 2 (top, dark grey): Weekly active, #535353. Values are not printed on the slide; estimates: Pew daily about 11%, weekly about 26% (total); CCIA daily about 13%, weekly about 29% (total); NBER RPS daily about 9%, weekly about 32% (total); NBER SWAA daily about 7%, weekly about 34% (total); Bain daily about 12%, weekly about 31% (total); KPMG daily about 12%, weekly about 24% (total). Legend at upper left of chart: dark grey square labelled Weekly active above red square labelled Daily active. Bars have thin white separator lines between the two segments. No highlighted points. Dotted gridlines run horizontally across the plot; the 0% baseline is a solid thin grey line.
Slide 32
Corporate hesitation / For enterprises, use cases are easier to see but implementation is hard / Enterprise reasons to delay LLM deployment, top three choices (December 2024) / 50% / 40% / 30% / 20% / 10% / 0% / Security & privacy / Expertise / Error rates / ROI unclear / Data not ready Intellectual property / rights / Regulation / Use cases / Source: Bain / Benedict Evans –– May 2025 / 32
Visuals: Chart: vertical bar chart, untitled axis labels, with the chart title 'Enterprise reasons to delay LLM deployment, top three choices (December 2024)'. Y-axis: percentage of respondents, 0% to 50%, gridlines every 10%, dotted light grey (#B0B0B0, about 0.5 pt). X-axis: categories, no unit, baseline solid grey line. Seven bars? No: eight bars, all with about values because no values are printed. Security & privacy: about 44%, dark grey #535353. Expertise: about 42%, #535353. Error rates: about 39%, #535353. ROI unclear: about 29%, red #EB483F, highlighted. Data not ready: about 27%, #535353. Intellectual property rights: about 27%, #535353. Regulation: about 25%, #535353. Use cases: about 18%, red #EB483F, highlighted. Legend: none. Highlighted points: the ROI unclear and Use cases bars are red. Bars are rectangles with square corners, width about 3.8% of slide width, evenly spaced.
Slide 33
The future always takes time / Cloud is old and boring - but still only 30% of workflows / Enterprise workloads in public cloud / Expected in 3 years / Today / 60% / 50% / 40% / 30% / 20% / 10% / 0% / Dec 2014 / Dec 2015 / Dec 2016 / Dec 2017 / Dec 2018 / Dec 2019 / Dec 2020 / Dec 2021 / Mar 2023 / Jun 2024 / Source: Goldman Sachs CIO Survey / Benedict Evans / –– May 2025 / 33
Visuals: Line chart titled 'Enterprise workloads in public cloud', with no axis titles. Y-axis: percentage, 0% to 60% in 10-point steps, with light dotted horizontal gridlines at each step and a solid grey baseline at 0%. X-axis: time from Dec 2014 to about Sep 2024 on a roughly uniform time scale, labelled Dec 2014, Dec 2015, Dec 2016, Dec 2017, Dec 2018, Dec 2019, Dec 2020, Dec 2021, Mar 2023 and Jun 2024. Two smoothed curved series. Series 1, 'Expected in 3 years', dark grey line (#4F4F4F) about 2.5 pt thick: about 9% at Dec 2014, about 14% mid-2015, about 16% at Dec 2015, about 19% mid-2016, about 38% at Dec 2016, about 33% mid-2017, about 35% at Dec 2017, about 34% mid-2018, about 38% at Dec 2018, about 36% mid-2019, about 43% at Dec 2019, about 42% in 2020, about 40% at Dec 2020, about 42% at Dec 2021, about 51% at Mar 2023, about 47% late 2023, about 47.5% in early 2024, about 46% at Jun 2024. Series 2, 'Today', red line (#E8473F) about 2.5 pt thick: about 4% at Dec 2014, about 6% at Dec 2015, about 18% at Dec 2016, about 20% mid-2017, about 19% at Dec 2017, about 18% mid-2018, about 26% at Dec 2018, about 19% mid-2019, about 23% at Dec 2019, about 22% in 2020, about 21% at Dec 2020, about 22% at Dec 2021, about 31% at Mar 2023, about 29% late 2023, about 29.5% in early 2024, about 28% at Jun 2024. Legend at upper left of the chart: a short dark grey dash followed by 'Expected in 3 years', and a short red dash followed by 'Today'. No highlighted points or annotations. Data points are not printed on the slide, so all values are estimates.
Slide 34
It’s always different
Every platform shift looks like fundamental discontinuity
“What’s a use-case for 3G?”
Smartphones replace
PCs at 5-10x the scale
“Why would anyone trust
Amazon with their data?”
All new software is
built on the cloud
“LLMs are slow, expensive
and unpredictable”
True, but…
Benedict Evans
–– May 2025
34
Visuals: Three identical red dotted arrows, each a horizontal dotted line with a solid filled triangular arrowhead at its right end, running from about x 49.4% to 65% of the slide width. Row 1 arrow at about y 30.3%, row 2 at about y 53.0%, row 3 at about y 75.8%. Dotted line is red #E94B3C with round dots, roughly 0.3% of slide height thick. No photographs, charts or logos.
Slide 35
What’s the standard pattern?
How do we always deploy new technologies?
Absorb
Make it a feature
Automate obvious
use-cases
Innovate
New products,
bundling and
unbundling
Disrupt
Redefine the
question
Benedict Evans
–– May 2025
35
Visuals: Three white filled circles of equal size (each about 21.7% of slide width by 38.5% of slide height) with thin dark grey outlines (#545454, about 2 px). The first and second circles have dark grey outlines; the third circle has a red outline (#E94B3C-like, about 2 px). Between circles are two solid grey right-pointing triangles (#A6A6A6), one between circle 1 and 2 at about x 43.2% to 45.1%, y 49.8% to 56.6%, and one between circle 2 and 3 at about x 70.7% to 72.6%, same vertical position. Circle contents: 'Absorb' (bold heading), 'Make it a feature', 'Automate obvious use-cases'; 'Innovate' (bold heading), 'New products, bundling and unbundling'; 'Disrupt' (bold heading), 'Redefine the question'. No photographs, charts or logos.
Slide 36
Do you have that use case?
"VisiCalc took 20 hours of work for some people
and turned it out in 15 minutes” - Dan Bricklin
Now, imagine a lawyer seeing it: “that’s very
clever, but I don’t have that use case”
Source: Computer History Museum
Benedict Evans
–– May 2025
36
Visuals: One photograph, a black-and-white product photo of an Apple II personal computer, placed in the right half at x 46.8%, y 0%, w 53.2%, h 100%, full-bleed to the top, bottom and right edges and cropped at the right edge (a Disk II floppy drive unit is cut off by the frame). Subject: an Apple II beige case with a keyboard in the foreground, the Apple logo badge on the front of the keyboard base, and a CRT monitor at the rear. The monitor screen shows a VisiCalc spreadsheet in monospaced text with a title line 'FINANCIAL HIGHLIGHTS', 'APPLE COMPUTER, INC', 'FOR THE FISCAL YEARS ENDING SEPTEMBER', 'DOLLARS AND SHARES IN THOUSANDS', column headers '1982' and '1983', and rows including NET SALES, NET INCOME, EARNINGS PER SHARE, PRE-TAX RETURN ON NET SALE, and CASH AND CASH EQUIVALENTS / ACCOUNTS RECEIVABLE with numeric values. Composition: three-quarter view from the front-left, the computer occupying most of the frame, dark grey gradient background darkening toward the top-left and top-right corners. Lighting: soft, directional light from the upper left, producing a shadow beneath the keyboard. Dominant colours: greys and off-white, with a black screen. No overlay or tint.
Slide 37
“I have that use case!”
Immediately, obviously useful for some professions and some workflows…
Coding
Errors easy to see
30%+ efficiency gains already
Marketing
Errors easy to see
Many possible answers
Customer support
(Use with caution)
Early adopters
(Always a limited market)
Benedict Evans –– May 2025 37
Visuals: Four identical circles (ellipses) in a single row, each white (#FFFFFF) with a thin red outline (about #E8473F, roughly 0.3% of slide height). Circle 1 (Coding) spans x 4.0% to 25.7%, y 34.3% to 72.8%. Circle 2 (Marketing) spans x 27.5% to 49.2%, y 34.0% to 72.5%. Circle 3 (Customer support) spans x 51.0% to 72.7%, y 34.3% to 72.8%. Circle 4 (Early adopters) spans x 74.5% to 96.2%, y 34.3% to 72.8%. Each circle contains centred text only; there are no photographs, icons, charts or logos. Flat fills with no shadows or gradients.
Slide 38
AI coding as the new AWS?
“Vibe coding” as the new abstraction layer, after / AWS, libraries, operating systems…
A new step change reduction in software / creation costs?
Benedict Evans
–– May 2025
38
Tech
Y Combinator startups are fastest growing, most profitable in fund history because of AI
Published Sat, Mar 15 2025·11:17 AM EDT Updated Fri, Mar 21 2025·2:34 PM EDT
Kate Rooney
@KROONEY
WATCH LIVE
KEY POINTS
Y Combinator CEO Garry Tan says for about a quarter of the current YC startups, 95% of the code was written by AI.
“What that means for founders is that you don’t need a team of 50 or 100 engineers,” Tan said. “You don’t have to raise as much. The capital goes much longer.”
The winter 2025 batch of YC companies in aggregate grew 10% per week, he said.
Silicon Valley’s earliest stage companies are getting a major boost from artificial intelligence.
Back to the main blog
January 16, 2025
Series B and Automa…
We’ve raised $105M to further our mission…
Posted By Anysphere Team / 1 minutes read
Anysphere is an applied research lab work… / is to build the engineer of the future: a hu… / magnitude more effective than any one pr… / very start of that, and our ambition stretc… / of programming where invention is effortle…
To help us get there, we’re announcing tod… / funding from Thrive Capital, Andreessen H… / investors. The new funding will help us exp… / research -- on systems, models, and produ…
Central to our approach is achieving real-w… / that Cursor is now used by millions of proc… / proprietary models now generate more co…
Visuals: Two screenshots of browser windows, overlapping, both with a soft drop shadow and rounded window corners. Back window (Cursor): a dark-grey browser chrome with red, yellow and green traffic-light dots at top left, an address bar reading cursor.com with a padlock icon, and a black web page showing the Cursor logo at top left, a hamburger menu icon at top right, a grey monospace link ← BACK TO THE MAIN BLOG, the date JANUARY 16, 2025, a large white sans headline Series B and Automa… cropped by the front window, a grey standfirst We’ve raised $105M to further our mission…, a small circular avatar with a yellow and green pattern and the grey monospace byline Posted By Anysphere Team / 1 minutes read, then grey body paragraphs cut off by the front window. Front window (CNBC): light grey browser chrome with traffic-light dots, an address bar reading cnbc.com with a blue eye icon and padlock, then a navy #0A2A5E header bar holding the NBC peacock logo with the CNBC wordmark in white at left, and at right a red dot LIVESTREAM label, a search magnifier icon and SIGN IN in white. Below the header: a blue TECH label, a bold black headline, a grey small-caps timestamp line, a circular black-and-white portrait photo of Kate Rooney with her name in bold serif and handle @KROONEY in blue, a red WATCH LIVE button at right, a thick blue rule, a navy KEY POINTS heading, three bulleted points with navy bullets, a thin grey divider, and a serif standfirst at bottom. The front window's bottom edge is near 80% of the slide height, and its right edge is near 97% of slide width. The portrait is a head-and-shoulders crop, shown inside a circle.
Slide 39
For everyone else… / “It’s not the customer’s job to know what / they want. It’s our job to show it to them” / Steve Jobs / Benedict Evans –– May 2025 / 39
Slide 40
Digital transformation!
Dig into boring back-office processes and look for things to automate
Accenture reported new quarterly ‘generative AI’ bookings ($m)
1,500
1,000
500
0
Feb 2023
May 2023
Aug 2023
Nov 2023
Feb 2024
May 2024
Aug 2024
Nov 2024
Feb 2025
Source: Accenture
Benedict Evans
–– May 2025
40
Visuals: Line chart with smoothed red line and circular red markers at nine points, no fill under the line. Title: 'Accenture reported new quarterly ‘generative AI’ bookings ($m)'. Y axis: $m, range 0 to 1,500, gridlines at 0 (baseline solid grey), 500, 1,000 and 1,500 as dotted light grey lines; labels 0, 500, 1,000, 1,500. X axis: quarterly-spaced labels Feb 2023, May 2023, Aug 2023, Nov 2023, Feb 2024, May 2024, Aug 2024, Nov 2024, Feb 2025. Series values (about, read from the chart; no values printed): Feb 2023 about 0, May 2023 about 100, Aug 2023 about 200, Nov 2023 about 460, Feb 2024 about 650, May 2024 about 900, Aug 2024 about 1,000, Nov 2024 about 1,200, Feb 2025 about 1,400. No legend. No highlighted points beyond uniform markers.
Slide 41
Startups create use cases & unbundle incumbents / Unbundling Excel, Email and Oracle / bloop. / AI Powered / Legacy Code / Conversion That / Produces / Readable Java / Broadening the modernisation paths available and / helping to solve legacy code for the long term / bloop.ai / ycombinator.com / Vantel Stockholm, Stockholm County, Sweden / AI Software for Commercial Insurance Brokers / W25 / FINTECH / INSURANCE / Fira San Francisco, CA, USA / Agentic AI platform for investment firms / W25 / B2B / FINANCE AND ACCOUNTING / assistant-ui San Francisco, CA, USA / Open Source React.js Library for AI Chat / W25 / B2B / INFRASTRUCTURE / Artifact Atlanta, GA, USA / Cursor for hardware design, starting with electrical systems / W25 / B2B / ENGINEERING, PRODUCT AND DESIGN / Axal San Francisco, CA, USA / Fix software architecture with AI / W25 / B2B / ENGINEERING, PRODUCT AND DESIGN / Dex San Francisco, CA, USA / The AI Browser Copilot / W25 / CONSUMER / symphonica.com / Start for Free / LOG IN / Symphonica / Moving Telecom OSS to the Cloud / Symphonica is a revolutionary AI-Driven, No-Code OSS for Cloud-Native Orchestration, Activation & Provisioning in Telecom Companies / Symphonica connects any BSS to any network technology or cloud service with just a few clicks. Join dozens of agile telecom companies that use Symphonica to create, test and launch new TM Forum-certified automation workflows and network connectors in minutes. / TALK WITH AN EXPERT / Launch New Services Immediately with Symphonica OSS / Benedict Evans / –– May 2025 / 41
Visuals: Three macOS-style browser window mockups with soft drop shadows and rounded window corners, each with red, yellow and green traffic-light dots at top left and a URL bar. Left window (bloop.ai, back, x 18.4 percent, y 22.5 percent, w 29.4 percent, h 60.4 percent): dark near-black navy page #10131C with white bold bloop. wordmark at top left and hamburger icon at top right; large centred bold grey sans-serif headline in light grey #C8CCD4 fading to darker grey at the edges, five lines of text; smaller grey subtitle in #9AA0AA beneath; the headline is clipped at the right edge of the window and continues under the centre window. Centre window (Y Combinator directory, front, x 42.4 percent, y 27.7 percent, w 29.4 percent, h 60.4 percent): off-white #FBFAF5 list background with thin light grey row dividers; six company rows, each with a round logo at left, bold company name, small location, one-line description, and small grey tag chips. Company logos: Vantel, a navy angular outline mark on white; Fira, a white stacked-bar mark on black circle; assistant-ui, a white chat-bubble mark on black circle; Artifact, a purple letter A mark on near-black circle; Axal, a white fork-arrow mark on black circle; Dex, a white stylised D mark on near-black circle. Each row has a small orange W25 badge. Right window (symphonica.com, back, x 66.2 percent, y 22.5 percent, w 29.4 percent, h 60.4 percent): white navigation bar with hamburger icon, blue Symphonica wordmark, search icon, Start for Free link and outlined LOG IN button in blue; below is a full-width violet-blue #6B5CF0 hero block with centred white text and a white rounded button labelled TALK WITH AN EXPERT in violet text; below that a pale grey-white band with violet headline text. Lighting is flat, screenshots are shown whole, not cropped to a photo frame, and they are unshaded rectangles with no overlay tint.
Slide 42
(Almost) every new startup is AI / The coming wave of AI startups unbundling Excel, email and Oracle / Y Combinator startups by field / Other / AI / 500 / 400 / 300 / 200 / 100 / 0 / W 2015 / W 2016 / W 2017 / W 2018 / W 2019 / W 2020 / W 2021 / W 2022 / W 2023 / W 2024 / F/W 2025 / Source: Y Combinator / Benedict Evans / –– May 2025 / 42
Visuals: One stacked column chart titled 'Y Combinator startups by field'. Type: stacked vertical column chart, 21 columns, two-tone. Y axis: numbers, no unit label, range 0 to 500 with labelled ticks at 0, 100, 200, 300, 400, 500, faint dotted horizontal gridlines at each tick. X axis: categories labelled every second column: W 2015, W 2016, W 2017, W 2018, W 2019, W 2020, W 2021, W 2022, W 2023, W 2024, F/W 2025 (one label per year, the other column of each year unlabelled), thin grey baseline. Series: AI (bottom segment, red #E84A3C) and Other (top segment, dark grey #535353); thin white separator line between segments. No printed data values; approximate values read from bar heights (AI / Other total, estimates marked about): W2015 first column about 15 / about 108 total; second about 4 / about 102; W2016 about 14 / about 120; about 22 / about 100; W2017 about 20 / about 115; about 22 / about 123; W2018 about 24 / about 145; about 19 / about 131; W2019 about 24 / about 196; about 24 / about 173; W2020 about 35 / about 227; about 24 / about 207; W2021 about 48 / about 335; about 69 / about 393; W2022 about 67 / about 401; about 51 / about 234; W2023 about 84 / about 270; about 164 / about 219; W2024 about 193 / about 253; about 212 / about 255; F/W2025 about 228 / about 259. Legend at upper left of plot, outside it at x 4.8%: dark grey square labelled Other above a red square labelled AI, square markers about 1.5% of slide width. Highlighted points: none.
Slide 43
Everyone has a pilot
Enterprise software takes time, and come with early disappointments
Enterprise use case adoption rates for generative AI: February, July & December 2024
Development/Pilot
Production
70%
60%
50%
40%
30%
20%
10%
0%
Software
Customer
Marketing
Knowledge
Operations
IT
Finance
Sales
HR
Legal
service
workers
Source: Bain
Benedict Evans
–– May 2025
43
Visuals: Stacked column chart. Title: 'Enterprise use case adoption rates for generative AI: February, July & December 2024'. Y axis: percent of adoption, range 0% to 70%, gridlines every 10% drawn as light grey dotted lines, labels 0% to 70% at left. X axis: 10 categories with three columns each (February, July, December order from left to right within each group), category labels Software, Customer service, Marketing, Knowledge workers, Operations, IT, Finance, Sales, HR, Legal. Each column is a stack: lower segment Production in red, upper segment Development/Pilot in dark grey #535353, separated by thin white gaps. Values are not printed on the slide, so these are estimates: Software Feb production about 21%, total about 56%; Jul production about 25%, total about 66%; Dec production about 29%, total about 68%. Customer service Feb about 18% / 51%; Jul about 25% / 62%; Dec about 23% / 59%. Marketing Feb about 11% / 49%; Jul about 14% / 53%; Dec about 17% / 55%. Knowledge workers Feb about 10% / 47%; Jul about 16% / 54%; Dec about 19% / 58%. Operations Feb about 8% / 42%; Jul about 9% / 48%; Dec about 15% / 52%. IT Feb about 12% / 40%; Jul about 18% / 48%; Dec about 24% / 60%. Finance Feb about 10% / 37%; Jul about 6% / 24%; Dec about 7% / 35%. Sales Feb about 3% / 23%; Jul about 14% / 48%; Dec about 14% / 55%. HR Feb about 4% / 22%; Jul about 4% / 20%; Dec about 7% / 30%. Legal Feb about 4% / 18%; Jul about 5% / 22%; Dec about 9% / 34%. Legend at upper left of chart: dark grey square with 'Development/Pilot' above red square with 'Production'. No highlighted points.
Slide 44
The future can take time / A quarter of CIOs have launched something - but 40% don’t plan anything until at least 2026 / CIO expected timing for first LLM projects in production, March 2025 / Already deployed / at least one project / H1 2025 / H2 2025 / 2026 / Later or no plan / 0% / 25% / 50% / 75% / 100% / Source: Morgan Stanley CIO Survey / Benedict Evans / –– May 2025 / 44
Visuals: Chart: a single 100% horizontal stacked bar, drawn as one bar of five segments. Chart title: CIO expected timing for first LLM projects in production, March 2025. Horizontal axis runs 0% to 100% with labelled ticks at 0%, 25%, 50%, 75% and 100%, shown as light grey dotted vertical gridlines; no axis unit beyond percentage of CIOs. Vertical axis line at 0% is a thin solid grey line. Segments left to right with their labels and approximate widths read from the axis: Already deployed at least one project, red segment about 0% to 26% (labelled with no printed value); H1 2025, pale pink segment about 26% to 36%; H2 2025, black segment about 36% to 61%; 2026, dark grey segment about 61% to 71%; Later or no plan, mid grey segment about 71% to 100%. The segments have thin white separators. No legend; segment labels sit inside each segment. No values are printed on the segments, so widths are estimates from the axis. Highlighted point: none. Subtitle states 40% do not plan until at least 2026 and a quarter have launched something.
Slide 45
Platform shifts mean more tools
SaaS means the typical large enterprise now uses 4-500 apps
Mainframes / One app
PCs / Dozens of apps
Web/Mobile / Hundreds of apps
LLMs / What else can we automate?
Benedict Evans –– May 2025 45
Visuals: Four circles in a horizontal sequence, left to right: (1) dark grey #535353 circle with white text 'Mainframes / One app'; (2) dark grey #535353 circle with white text 'PCs / Dozens of apps'; (3) dark grey #535353 circle with white text 'Web/Mobile / Hundreds of apps'; (4) red #EB483F circle with white text 'LLMs / What else can we automate?'. Between each pair of circles is a small solid light-grey (#A6A6A6) right-pointing triangular chevron, about 2.5% of slide width wide and 6% of slide height tall, pointing right, with no outline. The circles are equal in size (about 16.2% wide by 28.8% tall, so they are ovals rendered as circles), evenly spaced at 20% intervals, with no outlines or shadows. Nothing is photographic; no images, icons or logos.
Slide 46
Is this a CIO question? CFO? CEO?
Is this an Accenture question? Or a Bain/ BCG/McKinsey question?
Is this top line or bottom line change? Or a disruptive, existential threat?
Benedict Evans –– May 2025 46
Slides 47 to 59 continue in the full text file.
Download this deck
The hosted PDF of every library deck is free for readers of the SlideDeck Co newsletter. Join with your email and the viewer and download appear here.
Building a deck of your own? The SlideDeck Co Standard Deck is a slide library for business presentations: reviews, updates and plans.







