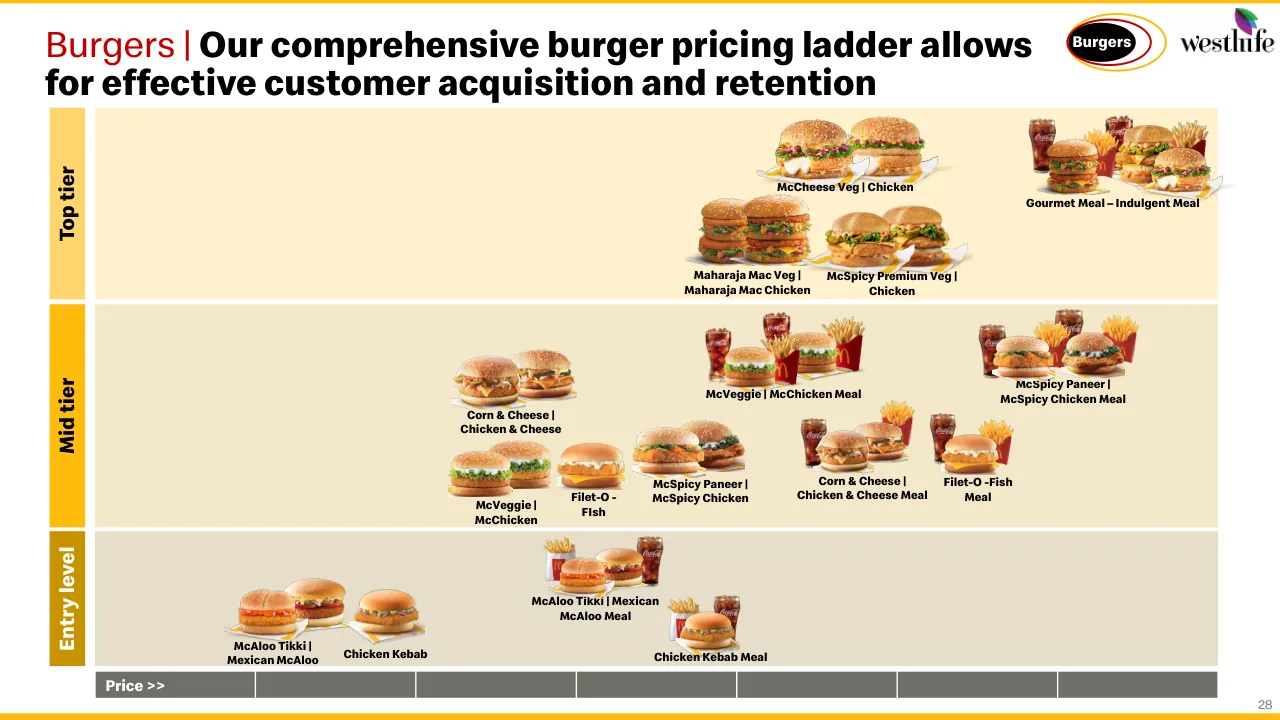
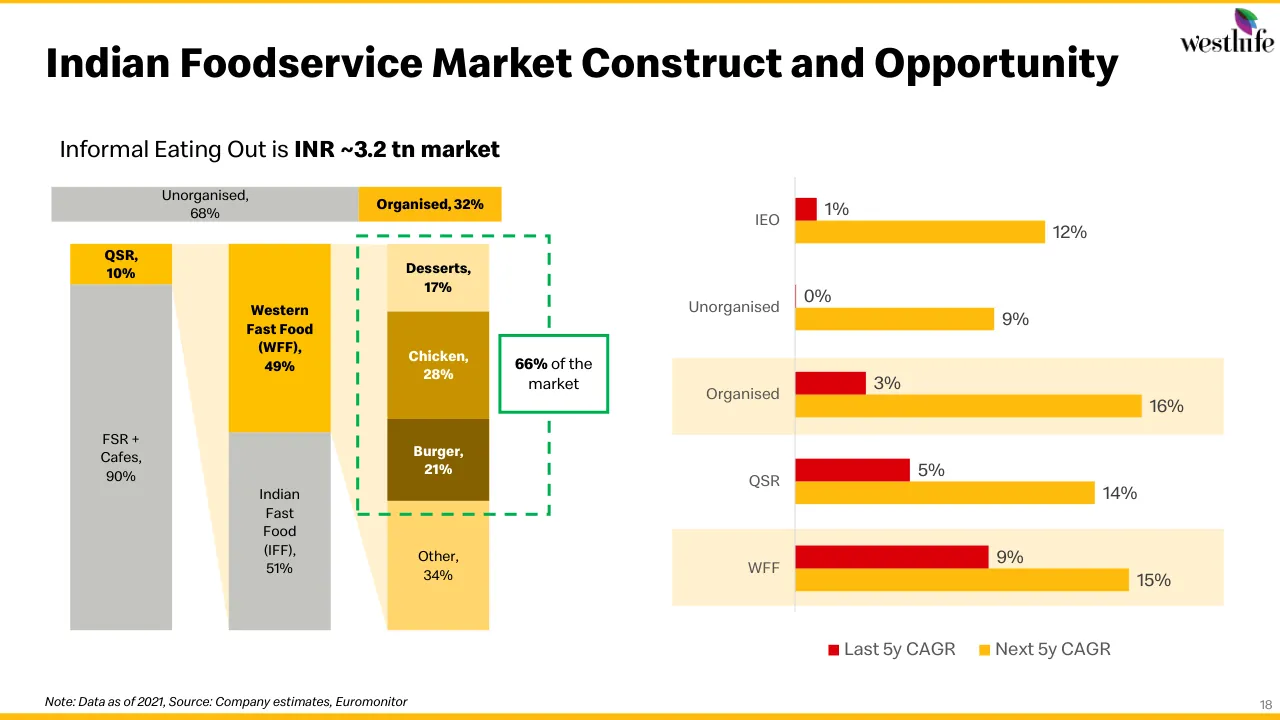
The deck opens with a title slide for the Strategy Day held on December 1, 2022, followed by a safe harbour disclosure and a short note on the company's new name. It then sets out the vision and mission, values, and the success enablers that underpin the strategy. A scorecard reviews performance against the earlier Vision 2022 targets on sales, profitability, and network expansion. Five success drivers follow: menu management, omnichannel, network expansion, cost saving, and capital efficiency. The middle sections cover industry trends, the foodservice market structure, and a menu strategy built around burgers, chicken, and coffee. The deck then presents Vision 2027 across four pillars: meals leadership, omnichannel, network expansion, and operating performance. It closes with long-term value creation levers, governance and leadership, ESG initiatives, and a summary of 2027 targets with a thank-you and investor relations contact. Slides worth studying include the Vision 2022 scorecard on slides 6 and 7, the pricing ladder on slide 28, and the market construct on slide 18.
Slides worth studying
Questions about this deck
What are the four pillars of the Vision 2027 strategy in the Westlife Foodworld deck?
Slide 21 sets out Vision 2027 across four pillars: Meals Strategy, Omnichannel Strategy, Faster than ever Network Expansion, and Lead with performance. Each pillar has a short description of its aim on the same slide.
How many slides does the Westlife Foodworld presentation have?
The Westlife Foodworld deck has 84 pages. Slide 1 is the title slide for the Strategy Day held on December 1, 2022.
What does the Westlife Foodworld deck say about revenue against the Vision 2022 target?
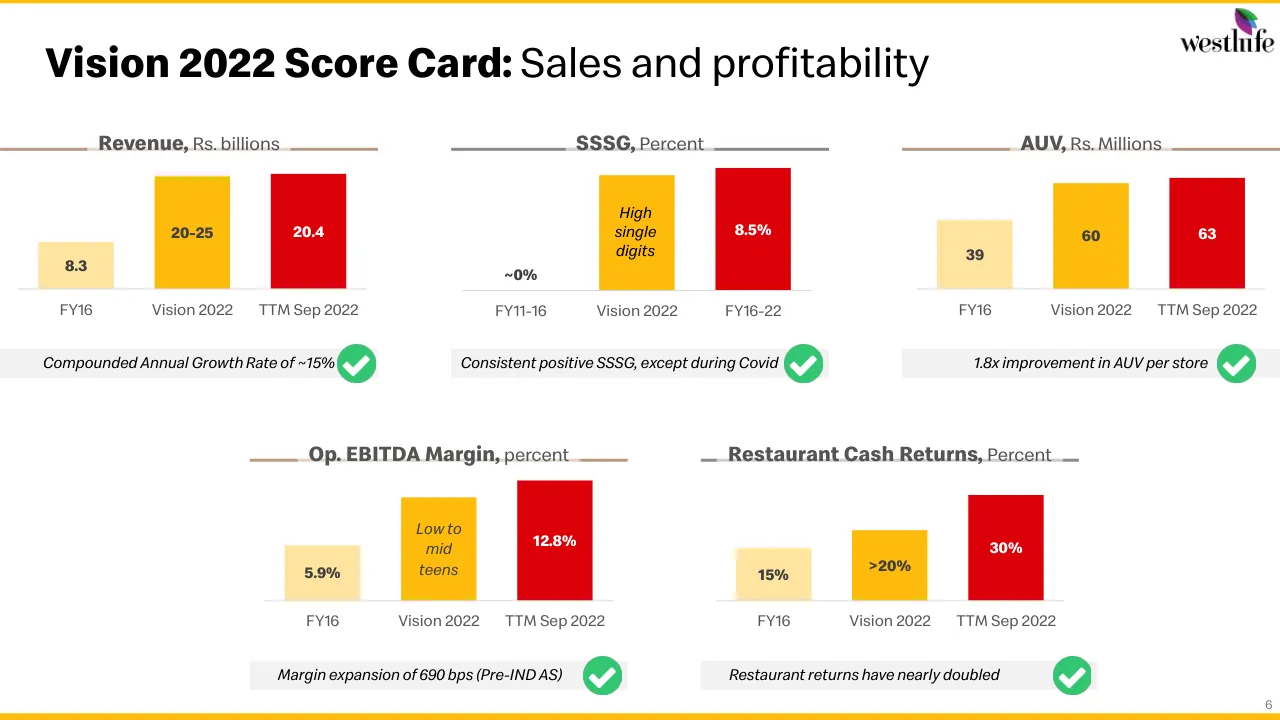
Slide 6, the Vision 2022 Score Card for sales and profitability, shows revenue of 20.4 Rs. billions for TTM Sep 2022 against a Vision 2022 target of 20-25 Rs. billions. The same slide shows FY16 revenue of 8.3 Rs. billions.
What market size does the Westlife Foodworld deck give for Indian foodservice?
Slide 18, titled Indian Foodservice Market Construct and Opportunity, states that Informal Eating Out is an INR ~3.2 tn market. The slide shows the split as Unorganised 68% and Organised 32%, with data as of 2021.
Details
- Company: Westlife Foodworld
- Year: 2022
- Type: Strategy presentation
- Industry: Restaurants / QSR
- Pages: 84
Review score: 7 out of 10, Effective
Presentation quality, judged with the SlideDeck Co review heuristic. Ask, evidence and idea merit are not rated here.
The deck has a clear route: a Vision 2022 scorecard on slides 6 and 7, five success drivers, market context, then Vision 2027 with a repeating four-pillar divider (slides 21, 22, 35, 51, 69) that keeps an 84-page investor deck navigable. Action titles, a consistent yellow and red palette, and clean charts such as slide 6 make most pages readable, and the photo-led store pages add real visual interest. Weaknesses are consequential: slide 28 has no price axis labels so the ladder cannot be read, slide 18 mixes shades and tiny labels, and the animation-step duplicates (slides 38 and 39, 43, 46, 49) and the full-bleed photo runs (slides 61 to 68) add pages with no argument. Many mid-deck slides carry small body text and dense charts that suit a read-ahead document more than a live room.
Worth keeping: Keep the scorecard format on slides 6 and 7 with the target and actual bars and the green check callouts, and the highlighted pillar divider that tells the audience where they are in the Vision 2027 section.
Most useful repair: Remove the build-step duplicates on slides 38, 39, 43, 46 and 49, add price values or a labelled axis to the ladder on slide 28, and caption or trim the unlabelled store photo run so each image carries a point.
What would change the score: I would raise the smallest chart labels and body text on slides 10 to 12, 18 and 57 to a size readable in a room, and reduce text on the densest slides to one message each.
Confidence medium. 72 of 84 pages inspected on contact sheets, 4 at readable size. Reviewed 2026-11-08. Model-assisted review (claude-sonnet-5-5).
Full text of the slides (84 slides)
Every slide's words and a description of its charts and images, so the deck can be searched and rebuilt. Also available as Markdown.
Slide 1
Westlife Foodworld
Hardcastle Restaurants Pvt. Ltd.
Strategy Day
December 1, 2022
Visuals: One illustration: a partial golden arch, the left and right legs of a letter-M-style arch, cropped at the top-left, top-centre and bottom edges. The arch is a flat, solid yellow-orange shape with no gradient or shading, placed on the left of the slide and extending from about 8% to the bottom edge. It is cropped by the slide edges (full-height bleed at the bottom) rather than boxed. Lighting is flat; the composition is graphic, with the two arch peaks at the top and legs running down to the bottom edge. A thin red horizontal rule sits between the subtitle and 'Strategy Day' as a graphic accent.
Slide 2
Safe harbour disclosure
This presentation contains forward-looking statements that represent our beliefs, projections and predictions about future
events or our future performance. Forward-looking statements can be identified by terminology such as “may,” “will,” “would,” “could,” “should,” “expect,” “intend,” “plan,” “anticipate,” “believe,” “estimate,” “predict,” “potential,” “continue” or the negative of these terms or other similar expressions or phrases. These forward-looking statements are necessarily subjective and involve known and unknown risks, uncertainties and other important factors that could cause our actual results, performance or achievements or industry results to differ materially from any future results, performance or achievement described in or implied by such statements. The forward-looking statements contained herein include statements about the business prospects of Westlife Foodworld Ltd (‘WFL’), its ability to attract customers, its affordable platform, its expectation for revenue generation and its outlook. These statements are subject to the general risks inherent in WFL’s business. These expectations may or may not be realized. Some of these expectations may be based upon assumptions or judgments that prove to be incorrect. In addition, WFL’s business and operations involve numerous risks and uncertainties, many of which are beyond the control of WFL, which could result in WFL’s expectations not being realized or otherwise materially affecting the financial condition, results of operations and cash flows of WFL. Additional information relating to the uncertainties affecting WFL’s business is contained in its filings with various regulators and the Bombay Stock Exchange (BSE). The forward-looking statements are made only as of the date hereof, and WFL does not undertake any obligation to (and expressly disclaims any obligation to update any forward-looking statements to reflect events or circumstances after the date such statements were made, or to reflect the occurrence of unanticipated events.
Note: The data and information shared in this presentation will not necessarily be shared or updated every quarter or in other periodic communication.
2
Slide 3
westlife / Westlife Foodworld Limited / Formerly Westlife Development Ltd. / Aligning and harmonizing the company’s name / more closely with the nature of business activities / Vast / Menu / Glocal / Experience / Disciplined / Approach / Renewed / Vigor
Visuals: Logo: the Westlife leaf mark (four overlapping leaf shapes in green, blue, purple and dark brown-grey) above the grey lowercase wordmark westlife. Illustration: a flat-style cartoon young man in a black cap with a yellow arch logo, black t-shirt, navy trousers, skin tones #F4B7AC, raising a yellow megaphone in his right hand (raised arm up-right) and clenching his left fist at his side, with three short dark-navy speed lines beside the megaphone; full-height, unboxed, placed over the yellow panel, shown from knee-up to foot-level in a portrait frame. Icons: a green circle (#4CAF50) with a blue check mark, placed left of the call-out text. Four gold five-point stars (about #FBC35A) as bullet markers, one per label pair. Decorative: a yellow gradient blob top-left corner, a bright yellow dot top-centre-right (about #FFEB00 fading to #FFC000), a second yellow dot bottom-right, and a large soft yellow gradient blob behind the figure.
Slide 4
Vision & Mission
“
To be a modern, relevant & progressive food and food tech company delivering long-term
prosperity and wellbeing for our customers, our people, our communities and our
shareholders
”
Success Enablers
Building Blocks
Execution
Proficiency
Strategic
Proficiency
Talent Proficiency
Values
Serve
Inclusion
Integrity
Community
Family
4
Visuals: Four icon-and-label pills in the Success Enablers panel: (1) white line icon of three stacked cubes beside 'Building Blocks' on red #C00000; (2) white line icon of a gear with a check mark beside 'Execution Proficiency' on brown #947356; (3) white line icon of a gear with a chess piece and star beside 'Strategic Proficiency' on amber #FFBC0D; (4) white line icon of two hands holding a star beside 'Talent Proficiency' on dark gold #C99100. Five value icons in the Values panel: Serve, a pair of hands forming a heart, one orange-tan and one brown, with red and yellow cuffs; Inclusion, three stylised people in a triangle (orange top, green, brown, red and tan figures); Integrity, a yellow compass rose with a red and yellow needle and small green and blue points; Community, a yellow house roof over three figures in yellow, light blue, maroon and red; Family, a yellow stool with a red centre bar and light blue and green legs. Quote marks are red Speedee bold glyphs. Logo: westlife wordmark in black serif with a purple, green and magenta leaf mark above the 'f'. No photographs, charts or tables; all imagery is flat vector icons, unshadowed and unboxed.
Slide 5
Recap of Vision 2022
GROW MARKET SHARE &
MARGIN
BROADENING ACCESSIBILITY
OF BRAND MCDONALD'S
GROW BASELINE SALES
• Sales of Rs 20 bn – Rs 25 bn
• Take EBITDA margin to low to
mid teens
• Restaurant level cash on cash
returns of >20%
• High single digit SSSG%
• McCafé: 75 to 300-350
• McDelivery: 124 to 300-325
• 80-100 EoTF restaurants
• Leverage other models and
menu in the future
• 400 – 500 restaurants
Presence in 45+ cities
• Investment of Rs 5+ billion
5
Visuals: Three flat icons in red (#D92027) and yellow (#FFC000). Left icon: a red donut chart with a segment separated by a gap and one segment filled with yellow diagonal stripes on white. Centre icon: a red rising arrow over three red rounded-rectangle bars of increasing height, with a yellow circle containing a red dollar sign above the tallest bar. Right icon: a red map pin containing a white and yellow burger, with red dashed motion lines on either side of the pin's tip. Between columns 1 and 2 a solid black equals sign made of two horizontal bars. Between columns 2 and 3 a solid black plus sign. Top-right logo: the Westlife wordmark in black serif lowercase with a multicoloured leaf mark (purple, green, yellow) above it.
Slide 6
Vision 2022 Score Card: Sales and profitability
Revenue, Rs. billions
8.3
20-25
20.4
FY16
Vision 2022
TTM Sep 2022
Compounded Annual Growth Rate of ~15%
SSSG, Percent
High
single
digits
8.5%
~0%
FY11-16
Vision 2022
FY16-22
Consistent positive SSSG, except during Covid
AUV, Rs. Millions
39
60
63
FY16
Vision 2022
TTM Sep 2022
1.8x improvement in AUV per store
Op. EBITDA Margin, percent
5.9%
Low to
mid
teens
12.8%
FY16
Vision 2022
TTM Sep 2022
Margin expansion of 690 bps (Pre-IND AS)
Restaurant Cash Returns, Percent
15%
>20%
30%
FY16
Vision 2022
TTM Sep 2022
Restaurant returns have nearly doubled
6
Visuals: Five vertical bar charts, each with three bars sharing a flat baseline, no axes, gridlines or legend. Bars are labelled with values inside or above them and the category labels sit under the baseline. Chart 1 'Revenue, Rs. billions': FY16 8.3 (pale yellow bar), Vision 2022 20-25 (yellow bar), TTM Sep 2022 20.4 (red bar). Chart 2 'SSSG, Percent': FY11-16 ~0% (no bar, value label only), Vision 2022 'High single digits' (yellow bar, text inside), FY16-22 8.5% (red bar, tallest of this chart). Chart 3 'AUV, Rs. Millions': FY16 39 (pale yellow), Vision 2022 60 (yellow), TTM Sep 2022 63 (red). Chart 4 'Op. EBITDA Margin, percent': FY16 5.9% (pale yellow), Vision 2022 'Low to mid teens' (yellow, text inside), TTM Sep 2022 12.8% (red). Chart 5 'Restaurant Cash Returns, Percent': FY16 15% (pale yellow), Vision 2022 >20% (yellow), TTM Sep 2022 30% (red). Highlighted points: the TTM Sep 2022 bars are red in every chart. Five green circular check badges (about 3% by 5.3%) with white check marks sit at the right end of each callout strip, one per chart. The Westlife logo (a multicoloured leaf above the wordmark) is in the top-right corner.
Slide 7
Vision 2022 Score Card: Network expansion / westlife / Number of stores / 400-500 / 337 / 236 / FY16 / Vision 2022 / As on Sep 2022 / Pace slowed during Covid, but on track now / Number of cities / 52 / 45+ / 30 / FY16 / Vision 2022 / As on Sep 2022 / Expansion into smaller towns / Investment, Rs. Billions / 5.2+ / 5+ / 4.7 / FY 11-16 / Vision 2022 / Last 5y / Consistent investments in store network / Number of McCafés / Penetration / 81% / 70-75% / 300-350 / 274 / 32% / 75 / FY16 / Vision 2022 / As on Sep 2022 / Achieved the targeted penetration levels / EOTF restaurants / Penetration / 48%* / 138 / 80-100 / 0 / FY16 / Vision 2022 / As on Sep 2022 / Rapid expansion of EOTF stores / * Percentage of total eligible store base / McDelivery restaurants / Penetration / 87% / 65-75% / 300-325 / 292 / 53% / 124 / FY16 / Vision 2022 / As on Sep 2022 / Achieved the targeted penetration levels / 7
Visuals: Six simple vertical bar charts with no axes, gridlines or y-scale; the x-axis is a thin light grey baseline under each chart with category labels beneath. Panel 1 'Number of stores': FY16 236 (light yellow bar), Vision 2022 400-500 (yellow bar), As on Sep 2022 337 (red bar). Panel 2 'Number of cities': FY16 30 (light yellow), Vision 2022 45+ (yellow), As on Sep 2022 52 (red, tallest bar in its panel). Panel 3 'Investment, Rs. Billions': FY 11-16 4.7 (light yellow), Vision 2022 5+ (yellow), Last 5y 5.2+ (red). Panel 4 'Number of McCafés' has two series: store counts FY16 75 (light yellow), Vision 2022 300-350 (yellow), As on Sep 2022 274 (red); and penetration callouts 32%, 70-75%, 81%, with a 'Penetration' label box at the upper left. Panel 5 'EOTF restaurants': FY16 0 (no bar, label sits on baseline), Vision 2022 80-100 (yellow), As on Sep 2022 138 (red, tallest); penetration callout 48%* sits above the red bar, with a 'Penetration' label box at upper left. Panel 6 'McDelivery restaurants': FY16 124 (light yellow), Vision 2022 300-325 (yellow), As on Sep 2022 292 (red); penetration callouts 53%, 65-75%, 87%, with a 'Penetration' label box at upper left. Bar values are printed inside or on top of bars; no estimates are needed except the FY16 bars of panel 4 and panel 6, whose heights are about read from the image. Highlighted points: none beyond the colour coding by series. Legend: none. Colour coding: light yellow = FY16 or earliest year, yellow = Vision 2022 target, red = as on Sep 2022 or latest. Penetration callouts are white rounded rectangles with tan outlines, sitting over the bars. Check icons: grey check circle (stores), green check circles (cities, investment, EOTF), tan/beige check circles (McCafés, McDelivery). Logo: westlife wordmark with a multicoloured leaf icon (purple, teal, green, red) top-right. Footnote asterisk note is text only.
Slide 8
Success drivers
2
Omnichannel
approach
4
Cost
optimization
1
Menu
management
3
Network
expansion
5
Capital
efficiency
8
Visuals: Five-step wave graphic with no chart data. Five thick semicircular arc bands, each about 19.3% wide and 17.1% high, form a continuous S-shaped wave running left to right. Arc colours step from dark gold #C99100 (step 1) through bright yellow #FFBC0D, light gold #FFD76E and pale yellow #FFE49E to very pale cream #FFF2CF (step 5). Each arc band is a solid fill with flat ends, and the arcs join where they meet. Five solid circles sit in the troughs and crests of the wave, each about 10% wide and 17.7% high, filled with the same colour sequence as the arcs. Each circle holds a black line-art icon (outline strokes, no fill): icon 1 is a fast-food meal with a burger, a soda cup with straw and a carton of fries; icon 2 is a delivery rider on a scooter with a parcel box; icon 3 is a storefront with a striped awning, a door, a window and a small table with a stool; icon 4 is two downward arrows above a dollar coin; icon 5 is a gear enclosing an upward bar chart. Step numbers are outlined numerals in a fill that matches each step's colour, with a thin dark outline: 1 in #C99100, 2 in #FFBC0D, 3 in #FFD76E, 4 in #FFE49E, 5 in #FFF2CF.
Slide 9
Recap: Sales growth drivers
In 2018, we
highlighted that
Menu, McCafe, In-
store Experience and
Delivery, will drive
average sales per
store to over
Rs. 60mn
Levers for driving sales growth
Brand extensions enable us to capture growth from multiple segments
AUV growth (Rs in million)
46
4-5
4-5
4.8-5.3
60-63
Current AUV
Delivery
McCafe
In-store
(Experience + Menu)
Target AUV
westhlife
9
Visuals: A pasted screenshot of a waterfall chart from a McDonald's presentation, placed as a boxed image with a thin light-grey border and a faint drop shadow. Top band: a solid crimson red (#B00020) banner containing the white sans-serif heading 'Levers for driving sales growth' and subtitle 'Brand extensions enable us to capture growth from multiple segments', with a small yellow McDonald's arch logo at the right end of the banner. Chart: waterfall, titled 'AUV growth (Rs in million)' in dark grey text centred above the plot. Categories on the x-axis, left to right: 'Current AUV', 'Delivery', 'McCafe', 'In-store (Experience + Menu)', 'Target AUV'. Bars: 'Current AUV' is a purple (#6A0A7A) column labelled 46, rising from the baseline; 'Delivery' is a blue (#4F90D0) floating bar labelled 4-5; 'McCafe' is a blue floating bar labelled 4-5; 'In-store' is a blue floating bar labelled 4.8-5.3; 'Target AUV' is a green (#5CBB4A) column labelled 60-63. No y-axis values, no axis ticks, no legend, no gridlines; the x-axis is a thin grey baseline with small tick marks. Bottom of the screenshot has a crimson red band with a small Westhlife logo in a white rounded tab overlapping its right end. The tan panel contains no imagery.
Slide 10
Success drivers
1
|
Menu management driven by robust consumer insights
westhlife
Average Sales Per Store, Rs. millions
FY16
39
80% of incremental AUV
Core Burgers
6
Core Burgers
• Building on iconic burger platforms: McAloo Tikki, McSpicy, McVeggie, McChicken
• Product extensions & LTOs: Flavors Without Borders, Battle of Spicy, Naan, Rice bowls etc.
• New Product platforms: American Cheese Supreme, Maharaja Mac, Gourmet collection
Combos & Meals
8
Combos and Meals
Driving acquisition and retention through:
• Snacking combos: McSaver Snacks @59, Happy Price Combos (F&B bundling)
• Meal upgrades: Free fries to Burger + Coke etc.
McCafe
5
Gourmet + Chicken
4
Others
1
Coffee
• Coffee habit building: Hot + Cold coffee combos, Value offers (2 coffees @ 149; Coffee + breakfast sandwich @ 129)
• Brand building: McBreakfast platform to compliment Coffee, memories campaign with McCafe, Barista certifications etc.
Current
63
Snacking Leadership
Note: Current period refers to 12 months ended September 2022
10
Visuals: Horizontal bar chart titled 'Average Sales Per Store, Rs. millions' (the Rs. millions unit label is in regular weight). Categories top to bottom: FY16 (bar value 39, brown #947056-like fill, starts at baseline), Core Burgers (increment 6, yellow), Combos & Meals (increment 8, yellow), McCafe (increment 5, yellow), Gourmet + Chicken (increment 4, yellow), Others (increment 1, yellow, very thin), Current (value 63, red #DB0007 full bar from baseline). Bars are floating increments for the four-to-six yellow bars, each offset to the right of the baseline, with value labels inside or beside each bar. Value labels: 39 (white, inside brown bar), 6, 8, 5, 4, 1 (dark, in yellow), 63 (white, inside red bar). No axis ticks, no numeric scale, no gridlines; a thin grey vertical baseline at x about 23.5%. A green dashed rounded rectangle (#00A651-like green, about 1.5 pt dashes) encloses the Core Burgers, Combos & Meals and McCafe rows and runs from x 1.5% to 36.5%, y 19.5% to 62%. A white callout box with a green border (#00A651-like, about 1 pt) reads '80% of incremental AUV' and has a green connector line from its bottom edge to the dashed box at x about 36.5%. Legend: none. Highlighted points: the dashed green group and the red Current bar. Photographs: a burger photo (two burgers, one McSpicy-style patty with cheese and tomato on a white wrapper, with lettuce and onion, on a plain white background, soft even lighting, cutout, no overlay, neatly boxed without border) beside the Core Burgers card; a photo of a McSaver-style burger with fries and a McAloo-style wrap on a white background beside the Combos and Meals card; a photo of three McCafe mugs (brown, with latte art), a pancake and a breakfast sandwich, warm lighting, on white, beside the Coffee card. The Westlife logo is a green-and-purple leaf above the wordmark 'westlife' in black serif type.
Slide 11
Success drivers / 2 | Omni Channel strategy premised on Consumer Convenience / westlife / Average Sales Per Store, Rs. millions / FY16 / 39 / In Store / 3 / Delivery / 20 / Drive-thru + OTG / 1 / Current / 63 / Note: Current period refers to 12 months ended September 2022 / On-premise Strategy / ▪ Convenience led digital experience through Self / Ordering Kiosks and Mobile / Apps / ▪ Creating globally consistent Experience Of The Future / (EOTF) with modern ambience, / table service, kid play places and / family seating spaces / On-Premise Digital / Sales / 30-35% / 0% / FY16 / Current / Off-premise Strategy / McDelivery / ▪ Invested in digital capabilities - / team, technology and analytics / ▪ Built relevant future ready / infrastructure with seamless / instore integration and own riders / ▪ Strengthened relationships with / 3POs / ▪ Focused packaging initiatives to / drive beverages penetration / Off-premise / Contribution / 44% / 11% / FY16 / Current / 11
Visuals: Horizontal bar chart titled Average Sales Per Store, Rs. millions (unit Rs. millions, no printed axis scale or range; the category axis is a vertical grey line at about x 15.5). Categories top to bottom with labelled values: FY16 39 (brown bar #947356, white label inside bar); In Store 3 (small yellow bar #FFBC0D, label 3 beside it); Delivery 20 (yellow bar #FFBC0D, label 20 inside); Drive-thru + OTG 1 (thin yellow bar, label 1 to its right); Current 63 (red bar #DB0007, white label inside, the bar is about 15 percent of width). A green dashed rectangle (#00A651 style green) highlights the In Store and Delivery rows. No legend. Right top chart On-Premise Digital Sales: two columns on a thin grey baseline, FY16 labelled 0% with no bar, Current a tall red column #DB0007 labelled 30-35% in white bold italic at its top. Right bottom chart Off-premise Contribution: FY16 yellow column #FFBC0D about 11% (short, label above it, values about 11 percent), Current red column #DB0007 labelled 44%, both on a thin grey baseline. Photograph: a self-ordering kiosk at the McDonald's-style restaurant, a white floor-standing kiosk with a vertical touchscreen showing burger menu images and a card reader below, beside a tall yellow sign reading ORDER HERE in black vertical letters, with a glass window and warm wood-toned interior behind; warm lighting; dominant colours white, yellow and brown; cropped to a tall rectangle with small rounded corners. Logo: red circle with yellow M arches and a dotted white trail, with McDelivery wordmark in black below it. Logo: westlife, a multicoloured stylised leaf (purple, green and orange) above a black lowercase wordmark.
Slide 12
Success drivers / 3 / | / Network Expansion / No. of stores / No. of cities / South vs West / Smaller town stores / Enhanced penetration in / Small and Emerging towns / Carried out a massive store / modernization drive / Continued investments in / volume driving large store / formats / 236 / 337 / FY16 / Current / 30 / 52 / FY16 / Current / South / West / 60% / 40% / 60% / 40% / FY16 / Current / Metros + T1 / Other / 19% / 81% / 26% / 74% / FY16 / Current / EOTF / McCafés / Drive Thrus / Delivery Stores / 0 / 138 / 75 / 274 / 59 / 68 / 124 / 292 / FY16 / Current / FY16 / Current / FY16 / Current / FY16 / Current / Rs 5.2+ bn / Invested in Network / Expansion and / Reimaging / Funded through / Internal accruals / 12
Visuals: Eight bar charts, each with a bold grey heading and two columns labelled FY16 and Current, no y-axis, no units, no gridlines, one thin light-grey baseline under each chart. 1) No. of stores: FY16 236 (yellow), Current 337 (red). 2) No. of cities: FY16 30 (yellow), Current 52 (red). 3) South vs West, 100% stacked: FY16 South 40% (yellow, bottom) and West 60% (red, top); Current South 40% and West 60%; legend South (yellow square) and West (red square); thin grey connector lines join the top and bottom edges of the stacks between the two columns. 4) Smaller town stores, 100% stacked: FY16 Metros + T1 81% (yellow, bottom) and Other 19% (red, top); Current Metros + T1 74% and Other 26%; legend Metros + T1 (yellow) and Other (red); a thin grey diagonal connector runs from the top of the FY16 yellow segment to the top of the Current yellow segment. 5) EOTF: FY16 0 (no bar), Current 138 (red). 6) McCafés: FY16 75 (yellow), Current 274 (red). 7) Drive Thrus: FY16 59 (yellow), Current 68 (red). 8) Delivery Stores: FY16 124 (yellow), Current 292 (red). No values are estimated; all printed values are exact. Bar colours: yellow #FFBC0D and red #DB0007 throughout. Three icons: green circles (#4CAF50 about) each containing a blue (#2196F3 about) checkmark, one beside each of the three bullets. One Westlife logo at top-right: a stylised leaf in purple, green and red above the black serif wordmark 'westlife'. A downward-pointing tan triangle (#B89A7E about) sits between 'Reimaging' and 'Funded through' inside the call-out box.
Slide 13
Success drivers
4 | Cost Saving Initiatives
westhlife
Food & Paper
Distribution
Utilities & Maintenance
Employee costs
~Rs 550 mn
Cost Savings
(Implemented or Identified in Wave 1)
13
Visuals: Four line icons in a 2x2 grid on the left, all black outline pictograms on white, each sitting above a pastel label tile. Top-left icon: a takeaway food box stacked on a cardboard carton with a bag/cup shape above it (Food & Paper). Top-right icon: a megaphone held in front of a laptop, with a play button circle, a document, a Facebook 'f' square and an Instagram camera square arranged around it (Distribution). Bottom-left icon: a lightning bolt inside a circular pair of arrows, representing energy cycle (Utilities & Maintenance). Bottom-right icon: a group of three stylised people with a gear above the centre figure (Employee costs). Right side is a filled call-out panel with a thick red vertical bar on its left edge; no photographs. Icons are black, about 1.5 pt stroke, unfilled.
Slide 14
Success drivers / 4 / | / Improving Profitability / FY16 / Product Mix / Net pricing / Cost Savings and / Operating Leverage / Royalty / Current / 5.9% / 1.4% / 1.8% / 3.7% / 0.0% / 12.8% / Note: Pre-IND AS Operating EBITDA Margin / 14
Visuals: One waterfall (bridge) chart, rendered as an image, with the title none and no visible y-axis or gridlines. Categories left to right: FY16, Product Mix, Net pricing, Cost Savings and Operating Leverage, Royalty, Current. Values are printed above each bar: FY16 5.9% (bold), Product Mix 1.4%, Net pricing 1.8%, Cost Savings and Operating Leverage 3.7%, Royalty 0.0%, Current 12.8% (bold). Bars: FY16 is a solid brown total bar about #957558 reaching about 5.9%. Product Mix, Net pricing and Cost Savings floating increments are yellow #FFBC0D, stepping up from the FY16 top. Royalty is a zero-height step with a grey connector line. Current is a light green total bar about #CBDB8A reaching 12.8%, the tallest bar and its value is bold. Thin light grey connector lines link each bar top to the next bar. A grey horizontal baseline runs under the bars. Category labels are grey #595959 below the baseline. The chart is not cropped, boxed or tinted and has no legend. Highlighted points are the bold 5.9% and 12.8% totals. The Westlife logo is a small leaf icon in purple, green and blue above the black serif wordmark westlife.
Slide 15
Success drivers
5
|
Capital Efficiency
Restaurant Cash Returns
~Rs 32-40 mn
~Rs 25 mn
Drive Thru
Delivery
EOTF
McCafe
Base
FY16
15%
Improved ROP
9%
FY16
Current
Optimized base cost despite inflation
Added returns accretive new levers
of growth
30%
Optimised CAPEX
5%
Volume and cultural sensitivities
focused design
Current
Note: Current period refers to 12 months ended September 2022
15
Visuals: Left: a horizontal floating-bar waterfall titled 'Restaurant Cash Returns' with no axis numbers, categories listed top to bottom as FY16, Improved ROP, Optimised CAPEX, Current. Bars are drawn on a thin vertical grey axis line. FY16 bar is brown #B69A81 labelled 15%. Improved ROP bar is yellow #FFBC0D labelled 9%, starting at about 27% of the slide width. Optimised CAPEX bar is yellow labelled 5%, about 3.5% wide, positioned at the right end of the plot area. Current bar is solid dark red #C00000 labelled 30% in bold white, spanning the full width from the axis. The Optimised CAPEX row is enclosed by a dashed green rectangle and a green connector line runs from that box's right edge, elbowing up to the right-hand dashed box. Right: a stacked column chart with two columns over a thin grey baseline. FY16 column is a single solid yellow #FFBC0D bar, labelled by the callout '~Rs 25 mn'. Current column is stacked bottom to top: Base yellow #FFBC0D (largest), McCafe red #D90000, EOTF yellow-green #A9C23F, Delivery blue #4BA3D6 (thin), Drive Thru brown #B69A81 (top), labelled by the callout '~Rs 32-40 mn'. A thin grey leader line joins the top of the FY16 column to the top of the Current column. Legend at right, top to bottom: Drive Thru, Delivery, EOTF, McCafe, Base, each with a small square swatch in the segment colour. Axis labels FY16 and Current sit under the columns. No axis values or ranges are printed. Three green circular check icons with blue check marks precede the bullets. Logo: Westlife wordmark in black serif with a purple, magenta and green leaf motif above the 'i'.
Slide 16
Industry Trends
& Market Opportunity
Slide 17
Emerging trends and tailwinds
Favourable / demographics
Shift towards / consumption vs / saving
Increasing / urbanization and / 'rurban' India
Rising value of / convenience
Rising aspirations / and / premiumization
Nuclearization / of families
Increasing / frequency of / eating out
Increasing digital / penetration
Increased / preference of / hygiene
Favorable funding / landscape for / aggregators
India likely to surpass China to become most populous / country in the world around 2025
Only ~ 35% of the Indian population lives in cities vs / 60% for China and 80-85% for USA
Consumers in tier 2 and tier 3 cities order food 'multiple / times a week', higher vs metros and tier 1 cities
Functional needs replace celebratory reasons to order / food across income segments
India bought 17 crores (170mn) smartphones in 2021
61% surveyed population watches online video content / like YouTube/OTT on their mobile/home TV.
UPI payment crossed Rs 11 lakh crore (~$140 bn) / milestone in Sep'22
Source: Online media, MiraeAsset, BCG, HSBC, Axismyindia, NPCI
17
Visuals: Ten black line-art icons, each sitting on a filled yellow circle (#FDB913) offset to the lower right of the icon. Left column, top to bottom: group of people (Favourable demographics); smartphone with shopping bag and hand (Shift towards consumption vs saving); city skyline with wifi symbol (Increasing urbanization and rurban India); clock with 24 badge (Rising value of convenience); diamond with sparkles (Rising aspirations and premiumization). Middle column, top to bottom: parents with two children (Nuclearization of families); plate with fork and spoon (Increasing frequency of eating out); devices with globe, monitor, wifi and power symbol (Increasing digital penetration); shield with medical cross (Increased preference of hygiene); scooter rider with delivery box (Favorable funding landscape for aggregators). Each icon is about 4.7% wide and 8.4% tall, unboxed, with no photographs. Right column has seven thin yellow horizontal rules, full text rows, no charts. Top-right logo is the Westlife wordmark in black serif lettering with a stylised leaf in purple, green and yellow above the 'i'.
Slide 18
Indian Foodservice Market Construct and Opportunity / Informal Eating Out is INR ~3.2 tn market / Unorganised, 68% / Organised, 32% / QSR, 10% / Western Fast Food (WFF), 49% / Desserts, 17% / Chicken, 28% / Burger, 21% / Other, 34% / FSR + Cafes, 90% / Indian Fast Food (IFF), 51% / 66% of the market / IEO / Unorganised / Organised / QSR / WFF / 1% / 12% / 0% / 9% / 3% / 16% / 5% / 14% / 9% / 15% / Last 5y CAGR / Next 5y CAGR / Note: Data as of 2021, Source: Company estimates, Euromonitor / 18
Visuals: Diagram on the left: a funnel-style stacked breakdown. Top row: a grey bar labelled Unorganised, 68% (x 4 to 28%) beside a yellow bar labelled Organised, 32% (x 28 to 39%), both about 4.8% tall at y 26%. Below them, three columns linked by pale yellow #FFF2CF tapered connector shapes that widen from each column to the next. Column 1 (x 5.5 to 13.5%): a yellow #FFC000 cap labelled QSR, 10% (y 33.9 to 39.5%) over a grey #C4C4C0 block labelled FSR + Cafes, 90% (y 39.5 to 87.5%). Column 2 (x 17.9 to 25.9%): a yellow #FFC000 block labelled Western Fast Food (WFF), 49% (y 33.9 to 60.1%) over a grey #C4C4C0 block labelled Indian Fast Food (IFF), 51% (y 60 to 87.5%). Column 3 (x 30.3 to 38.3%), the Western Fast Food breakdown: Desserts, 17% in pale #FFE49E (y 33.9 to 43.3%); Chicken, 28% in ochre #C99100 (y 43.2 to 58.2%); Burger, 21% in dark brown #866100 (y 58.2 to 69.6%); Other, 34% in light gold #FFD76E (y 69.6 to 87.6%). A dashed green (#00A651 approx.) rectangle, about 2 pt stroke, surrounds the Chicken and Burger segments and extends slightly beyond them (approx. x 27.9 to 42.9%, y 32.6 to 71.4%). Beside it, a white box with a green (#00A651 approx.) border of about 2 pt contains the text 66% of the market, linked visually to the dashed rectangle. Chart on the right: a horizontal clustered bar chart with no visible numeric axis or gridlines; a thin grey vertical baseline at x about 62% runs from y 27% to 96%. Categories from top to bottom: IEO, Unorganised, Organised, QSR, WFF. Series 1 Last 5y CAGR in red #DB0007: IEO 1%, Unorganised 0%, Organised 3%, QSR 5%, WFF 9%. Series 2 Next 5y CAGR in yellow #FFBC0D: IEO 12%, Unorganised 9%, Organised 16%, QSR 14%, WFF 15%. Each value is printed at the bar end in dark grey #404040. Organised and WFF rows sit on pale #FFF2CF full-width bands. Legend at bottom centre: red square then Last 5y CAGR, yellow square then Next 5y CAGR, grey #595959 text. No photographs or icons apart from the logo.
Slide 19
We cater to various market segments through our unique business model
Multi-Category
Burgers
Sides
Coffee
Wraps
Desserts
Shakes,
Smoothies
& Coolers
Chicken
Multi-Daypart
Breakfast
Snacks
Meals
Multi-Channel
On the Go
Dine in
Takeaway
Drive thru
Delivery
Multi Brand Extensions
McCafé
McBreakfast
Exclusive Menu from 7AM-12AM
McDelivery
Total Addressable Market is Rs +200 bn
Note: All India TAM; Source: Company estimates, Euromonitor
19
Visuals: Central circular cycle diagram made of four block arrows forming a loop around a red square McDonald's arch logo. Top arrow, tan #B69A81 with dark gold #C99100 shadow side, points right, carrying a line icon of a drink, fries and burger. Right arrow, yellow #FFBC0D with olive shadow, points down, carrying a clock-check icon. Bottom arrow, lime #A9C23F with teal #317A9E shadow, points left, carrying a rosette-star icon. Left arrow, blue #4C9FC8 with brown #947356 shadow, points up, carrying a box-and-hand delivery icon. Central logo: red square #DA291C with yellow arches #FFBC0D and a white border and soft drop shadow. Category photographs are cutouts on white with no boxes: double burger, nuggets and fries, wrap, fried chicken, iced coffee cups, a dessert cup with brownie, a McCafe shake with chocolate chips, and a plate of breakfast muffin with coffee, a meals tray with Coca-Cola cups, fries and burger, and a snack burger with Coke. Multi-Channel icons in red and blue line style: on-the-go figure with map pin, dine-in table with chairs, takeaway bag figure at a McDonald's kiosk, drive-thru car at window, delivery scooter with home pin. Brand logos: McCafé wordmark in dark brown #6B1E12 on a pale tan swoosh, McBreakfast yellow-orange rectangle, McDelivery yellow rounded square icon with red arches. Westlife logo at top right in black serif with a purple and green leaf mark.
Slide 20
Vision 2027
Visuals: Two large yellow arches of a stylised M-shaped golden arch mark, cropped by the right and bottom edges of the slide, rising from the red band at the bottom. The left arch's apex sits near the horizontal centre-right at about 62% across and the right arch is cut off at the right edge. The arches are solid #FFBC0D with no outline, no shadow and no gradient. The arch mark is full-bleed to the bottom-right and overlaps the tan panel and the red band. No photograph, chart or table.
Slide 21
Vision / 2027 / 01 / Meals Strategy / Achieve market leadership in core day parts through brand relevance / led by menu innovation and marketing / 02 / Omnichannel Strategy / Integrate various channels and touchpoints to a One McDonald’s / platform in order to provide consumers a seamless experience / 03 / Faster than ever Network Expansion / Penetrate unserved geographies and fortify existing markets with / renewed aggression / 04 / Lead with performance / Targeting superior business performance and operating efficiency / through execution excellence / 21
Visuals: Photograph: an interior view of a McDonald’s restaurant, showing a dessert counter with a 'DESSERTS' sign, a golden arches logo at upper left, a small 'Take Away' sign, warm ceiling lights, wooden seating and potted plants. It is shown at full height in the left panel, cropped at the right by the curved overlay, with dark-brown and black tones and warm amber highlights. Overlay: a large curved gold tint (about #B8901C to #D9A620, semi-transparent, roughly 70% opacity) covers the photo and gives it a warm yellow cast; its right edge is a convex arc with a soft grey drop shadow to the right. Numbered circles: four filled slate-blue circles (#405666), each with a thin gold rim (about #C9A227) offset to the lower right, containing the numbers 01, 02, 03 and 04 in white bold type. Logo: the Westlife logo at top right, a stylised multicoloured leaf (green, magenta and purple) above the black serif wordmark 'westlife'. Lines: four thin light-grey horizontal rules (about #D9D9D9, 1 pt) under items 01 to 03, spanning x 48.8 to 93.4%. Bars: thin gold (#F5B800) bars along the top and bottom edges.
Slide 22
Vision
2027
01
Meals Strategy
Achieve market leadership in core day parts through brand relevance
led by menu innovation and marketing
02
Omnichannel Strategy
Integrate various channels and touchpoints to a One McDonald’s
platform in order to provide consumers a seamless experience
03
Faster than ever Network Expansion
Penetrate unserved geographies and fortify existing markets with
renewed aggression
04
Lead with performance
Targeting superior business performance and operating efficiency
through execution excellence
22
Visuals: Photograph: interior of a McDonald's restaurant, dark and blurred, showing a 'DESSERTS' sign with the golden McDonald's arches, a 'Take Away' sign, plants and a wooden bench-style seating area. It is full-height, cropped to the left panel, and covered by a semi-transparent gold-to-amber tint (about 60 to 70 percent opacity) so the image reads as dark olive-gold. The right edge is a convex curve that bulges toward the centre of the slide. Four numbered circles (01 to 04) sit on the curve's edge and on the right column, each a dark slate disc with a thin gold offset ring. Highlight: a pale yellow chevron-tipped block behind item 01 pointing right. Logo: westlife wordmark in black serif with a multicolour leaf icon (green, purple, magenta) above the 'st' letters, top right.
Slide 23
We have built menu relevance across customer occasions and day parts / Indian IEO market construct / Market leaders in snacking / Only WFF player in the segment / Snacking / Morning / Late night / Meals (Lunch+Dinner) / McFLURRY LOVE IT TO / Enhanced meals offerings: / • Gourmet burger meals: new range of indulgent, more filling burgers / • Value for money burger meals at various price points / • Chicken-led meals through the McSpicy Fried Chicken / Continued leadership in snacking: / • McDonald’s as the ultimate snacking choice / • Wide range of snacking options / • Safer and tastier options compared to roadside vendors / Graphs for representation purpose only, not to scale / 23
Visuals: Composite diagram titled 'Indian IEO market construct' made of four panels. Top-left panel: solid red #DB0007 labelled 'Snacking' with a gold #1 medal icon and the italic label 'Market leaders in snacking'; it contains a crispy chicken sandwich in a bun with lettuce and tomato on white paper beside a red fries carton with yellow M logo (left), and a group of four cafe mugs (brown with latte foam, green, navy and dark brown) on a dark chocolate slab with coffee beans (right). Bottom-left panel: solid tan #B39A80 labelled 'Morning' with an orange-yellow 'EXCLUSIVE' rosette badge and the italic label 'Only WFF player in the segment'; it shows an egg and cheese muffin sandwich, a golden hash brown patty and a brown McCafe cup with white McCafe logo on white paper. Bottom-right narrow panel: solid green #00B050 labelled 'Late night' with a gold #1 medal icon; it shows a beige iced frappe with whipped cream and straw, a chicken burger with green lettuce, and a red fries carton. Large right panel: solid yellow #FFBC0D labelled 'Meals (Lunch+Dinner)' containing a gourmet double-patty burger with sesame bun, cheese and lettuce, a red fries carton and a cola cup with straw; below it a meal of two cola cups, fried chicken drumsticks and wings in a red carton and popcorn-style nuggets in a cardboard tray; and a blue paper McFlurry cup with a McDonald's arch logo and Oreo cookie pieces. A small red circle sits partly behind the burger. Gold and red orthogonal connector lines link the text column to the burger photo and to the snacking mugs. Photos are not cropped, sit on white or cream paper wraps, and are lit evenly from the front with soft shadows. Medal icons: a gold #1 medal with red, white and blue ribbon at top-left of the Snacking panel and a second identical medal at the top of the Late night panel. Footnote text is not a visual.
Slide 24
Meals dayparts present the largest growth opportunity / in the next 5 years
Mealtimes will represent ~67% of India’s Dine-out spend in the next 5 years
27%
Breakfast
Lunch/Dinner
67%
Snack
2%
Coffee
4%
Source: Company estimates
24
Visuals: Pie chart, untitled, with no axes, no series name and no units shown. Four slices, clockwise from the top: Lunch/Dinner 67% (red #DB0007, the largest slice, occupying the left and bottom-left of the pie), Snack 27% (green #A9C23F, upper-right), Coffee 2% (blue #4C9FC8, thin sliver at lower-right), Breakfast 4% (yellow #FFBC0D, thin wedge at bottom). Slices are separated by thin white edges. Data labels sit outside the pie: 27% upper-right, 67% left, 2% lower-right, 4% below the Breakfast wedge, all in dark grey #404040. Legend on the right with square swatches in the slice colours and labels in grey #595959, listed top to bottom Breakfast, Lunch/Dinner, Snack, Coffee. No highlighted points. Logo: Westlife logo top-right, a stylised leaf mark in green, purple and yellow above the lowercase wordmark 'westlife' in black serif.
Slide 25
Targeted focus on Lunch and Dinner dayparts to build
meals leadership
westhlife
Commit to the Core
2.3x
2.2x
2.1x
2.0x
1.6x
Burgers
Indulge in the cheesy, spicy, deliciousness.
Try the new
Gourmet Burger COLLECTION
Chef's Special Gourmet Burgers
Chicken
McSpicy Fried Chicken Chicken that is spicy to the last bite.
Coffee
Meals Leadership
Maximize our Marketing
Family Marketing
Brand Trust
Breakfast
Lunch
Snacks
Dinner
Late Night
(6am - 11am) (11am - 3pm) (3pm - 7pm) (7pm - 10pm) (10pm - 4am)
25
Visuals: Bar chart (vertical, five columns) with title none and no axis titles. Categories left to right: Breakfast (6am - 11am), Lunch (11am - 3pm), Snacks (3pm - 7pm), Dinner (7pm - 10pm), Late Night (10pm - 4am). Values: Breakfast 1.6x, Lunch 2.2x, Snacks 2.0x, Dinner 2.3x, Late Night 2.1x; value labels sit above each bar in bold black. Bar colours: Breakfast, Snacks and Late Night yellow #FFBC0D; Lunch and Dinner red #C00000 (highlighted). Green circular check-mark icons with blue ticks (about #4CAF50 fill, #2196F3 tick) sit above the Lunch and Dinner bars. No legend. Right panel: three product photographs with labels Burgers, Chicken and Coffee; Burgers shows two sesame burgers with lettuce and cheese on a dark background with overlaid promotional text; Chicken shows McSpicy fried chicken pieces in a red bowl with overlaid text; Coffee shows four McCafe beverages (iced drink, latte cups, mason-jar drink, frappe) on a wooden table, warm lighting, dark brown background. Bottom panel: two framed family dining photographs (Family Marketing and Brand Trust) with grey caption bands at the bottom, showing people seated in restaurant interiors with warm lighting.
Slide 26
Robust menu strategy going forward to drive business / growth / BURGERS / CHICKEN / COFFEE / McCafé / McCafé / McCafé / westlife / 26
Visuals: Nested ellipse (Venn-style) diagram of three concentric-offset ovals with black outlines, back to front: outermost large oval with a blurred warm amber/gold bokeh background at top and a wooden-plank table surface at bottom; middle oval with beige/tan fill (#F0DDC0 approx.) containing the chicken area; innermost oval with dark brown blurred background containing a burger. Labels: 'BURGERS' in black bold capitals on a yellow (#FFC20E approx.) rounded rectangle at upper left of the burger oval; 'CHICKEN' in white bold capitals on a red (#E31B23 approx.) rounded rectangle above the chicken pile; 'COFFEE' in yellow bold capitals on a dark brown (#3A1E10 approx.) rounded rectangle at upper right. Photograph of a sesame seed burger with jalapeños, green lettuce, orange sauce and a pale yellow cheese/sauce layer on white paper, lit from front, neutral-warm lighting, cropped inside the inner oval. Photograph of fried chicken drumsticks and pieces in a yellow and white striped box on a wooden board with a white sheet below, warm lighting, cropped by the middle oval edge on right. Photograph of an iced coffee in a glass mug with ice cubes and a 'McCafé' logo in white script, and behind it a brown ceramic mug with latte art and 'McCafé' printed on it, on a wooden table with coffee beans, cropped by the outer oval edge on right.
Slide 27
Burgers | We have built burger leadership through burger / offerings for all occasions / Burgers / westlife / Classic burgers / Indulgent burgers / Burger meals / Core, iconic burgers that are / bestsellers on the menu and have / become staples for burger lovers in the / country / A new range of premium, indulgent, / and more filling burgers which are / suited to the flavor trends in the / market / Bundles and add-ons to help choose / from a host of pocket-friendly and / delicious combos, and create / wholesome burger meals / 27
Visuals: Three photographs of McDonald's style food on white backgrounds, all with no boxing or frames beyond the card outlines. Column 1 (Classic burgers): two burgers on a yellow-striped white paper sheet; the back burger has a sesame bun top, a crispy orange-brown patty with red-orange sauce and sliced red onion; the front burger has a sesame bun, a white sauce layer, shredded green lettuce and a golden crispy chicken patty on a plain bottom bun, lit from above, with warm orange-brown tones. Column 2 (Indulgent burgers): two stacked burgers on a yellow-striped paper; the back burger has a sesame bun, a crispy patty with melted white cheese sauce visible at the bottom, green lettuce and sliced green jalapenos; the front burger has a plain bun, a crispy chicken patty, orange cheese slice, sliced green jalapenos, lettuce, white sauce and an orange sauce on the bottom bun. Column 3 (Burger meals): a meal composition with a McCafe iced coffee in a brown cup with whipped cream topping at the top left, a McCafe brown iced drink in a dark cup, a Coca-Cola glass with ice at the top, a red carton of golden fries at the right, a chicken burger and a second burger in the centre, golden nuggets with a sauce cup and a blue McFlurry cup with black cookie pieces at the bottom right, with scattered coffee beans at the lower left; lighting is soft and even from the front, with dominant colours of golden brown, red, white and blue. Overlays: none. Icons: none. Logo: Burgers oval with a black filled ellipse, white bold Burgers text, red inner ring and yellow outer ring; westlife wordmark in dark serif lettering with a purple and green leaf above the letter i.
Slide 28
Burgers | Our comprehensive burger pricing ladder allows
for effective customer acquisition and retention
Burgers
Top tier
McCheese Veg | Chicken
Gourmet Meal – Indulgent Meal
Maharaja Mac Veg |
Maharaja Mac Chicken
McSpicy Premium Veg |
Chicken
Mid tier
McSpicy Paneer |
McSpicy Chicken Meal
McVeggie | McChicken Meal
Corn & Cheese |
Chicken & Cheese
McVeggie |
McChicken
Filet-O -
Fish
McSpicy Paneer |
McSpicy Chicken
Corn & Cheese |
Chicken & Cheese Meal
Filet-O -Fish
Meal
Entry level
McAloo Tikki | Mexican
McAloo Meal
McAloo Tikki |
Mexican McAloo
Chicken Kebab
Chicken Kebab Meal
Price >>
28
Visuals: Diagram-style pricing ladder with 40+ food photographs of burgers, wraps, fries and drinks, each with a bold black caption beneath. Photos sit on a cream/yellow band per tier, rising in the top tier and stepping left to right by price. Top tier: McCheese Veg | Chicken pair (top centre); Gourmet Meal – Indulgent Meal (top right, boxed meal with two burgers, fries and Coca-Cola cups); Maharaja Mac Veg | Maharaja Mac Chicken (centre); McSpicy Premium Veg | Chicken (centre right). Mid tier: Corn & Cheese | Chicken & Cheese (centre); McVeggie | McChicken (lower centre); Filet-O-Fish (centre); McSpicy Paneer | McSpicy Chicken (centre); McVeggie | McChicken Meal (centre right, with Coca-Cola and fries); McSpicy Paneer | McSpicy Chicken Meal (right); Corn & Cheese | Chicken & Cheese Meal (right, with Coca-Cola and fries); Filet-O-Fish Meal (right, with Coca-Cola and fries). Entry level: McAloo Tikki | Mexican McAloo (left pair of burgers); Chicken Kebab (single burger, left); McAloo Tikki | Mexican McAloo Meal (centre, with fries and Coca-Cola); Chicken Kebab Meal (centre right, with fries and Coca-Cola). Photos are product shots on white backgrounds, with soft shadows, bright even studio lighting, warm orange-brown bun and red and green tones, and no cropping, full-bleed or boxing. No logos or icons other than the Burgers and westlife logos.
Slide 29
Chicken | Chicken-forward products are key to winning / the QSR market in South India / Chicken / westlife / What percentage of / population eats Meat? / 30% 44% 58% 72% 86% 100% / 77% of population eats / chicken, fish & other meat / 83% Men 71% Women / 77% / 74% in 2015-16 / 77% in 2019-21 / 95% of consumers in South India are Non- / Vegetarians / This set of consumers prefer a piece of / spicy fried chicken (on the bone) / New chicken product launches in the / last 5 years have helped boost AUV in / South because of product and brand / relevance / Average Daily Sales / 1.8x / 1.5x / 1.x / FY16 / West (Current) / South (Current) / Source: National Family Health Survey 5, statsofindia.in / 29 / Map labels: 100.0 Lakshadweep / 99.8 Nagaland / 99.8 Mizoram / 99.7 Arunachal / 99.7 Manipur / 99.6 Tripura / 99.5 AN Islands / 99.5 Meghalaya / 99.5 Assam / 99.2 Bengal / 98.5 Kerala / 97.6 Puducherry / 96.4 Tamil Nadu / 96.1 Andhra Pradesh / 96.0 Goa / 95.8 Odisha / 95.6 Telangana / 94.8 Jharkhand / 90.6 Sikkim / 88.7 Bihar / 88.0 J&K / 86.5 Ladakh / 86.2 Chhattisgarh / 81.2 Karnataka / 81.0 DNHDD / 77.4 Maharashtra / 77.1 India / 74.8 Uttarakhand / 68.3 Delhi / 61.9 Chandigarh / 59.8 Uttar Pradesh / 56.5 Himachal / 51.2 Madhya Pradesh / 45.1 Punjab / 44.9 Gujarat / 32.0 Haryana / 31.4 Rajasthan
Visuals: Choropleth-style map of India titled 'What percentage of population eats Meat?' with a legend bar from 30% to 100% in red shades (30%, 44%, 58%, 72%, 86%, 100%). Each state is labelled with its percentage; state values are: LA 87%, JK 88%, HP 57%, PB 45%, UK 75%, HR 32%, DL 68%, RJ 31%, UP 60%, BR 89%, SK 91%, AR 99.7%, AS 99.5%, NL 99.8%, ML 99.5%, MN 99.7%, MZ 99.8%, TR 99.6%, WB 99.2%, JH 95%, OD 96%, CG 86%, MP 51%, GJ 45%, DH 81%, MH 77%, GA 96%, KA 81%, TS 96%, AP 96%, TN 96%, KL 99%, PY 98%, AN 99.5%, LD 100.0%. Left of the map is a vertical stacked red-to-cream bar list of 36 region labels with values (see text). Key callouts: 77% of population eats chicken, fish and other meat; 83% men; 71% women; 74% in 2015-16; 77% in 2019-21. Map has a small red square icon at bottom-right of the map area. Bar chart titled 'Average Daily Sales' with no axis, no value axis labels, no legend and no gridlines. Three columns with labelled values: FY16 1.x (yellow #FFBC0D, about 1x height), West (Current) 1.5x (yellow #FFBC0D), South (Current) 1.8x (red #DB0007, tallest). A thin tan (#B69A81) curved connector arrow runs from above FY16 across horizontally to above South (Current) with an arrowhead pointing right, indicating growth from 1.x to 1.8x. Baseline is a light grey horizontal line under the bars. Photograph or illustration: none beyond the map.
Slide 30
Chicken | A comprehensive chicken portfolio would enable / us to enhance product relevance in the South / Chicken / westlife / Three Tiers of Chicken Burgers and Wraps / Boneless / Bone-in / Top / Tier / McSpicy Chicken Premium / McCheese / Chicken / Chicken / Maharaja Mac / Chicken McNuggets / Big Spicy Chicken Wrap / Mid / Tier / McSpicy / Chicken / Chicken & Cheese / McChicken / Chicken Strips / Entry / level / Chicken Kebab / McSpicy / Fried / Chicken wings / McSpicy Fried / Chicken / 30
Visuals: Photographs of fast-food items on white or cream wrapper paper, cut out with no background, arranged in tiers. Left tier area: McSpicy Chicken Premium burger (top, lettuce, cheese, sauce, sesame bun), McCheese Chicken burger (top, sesame bun, lettuce, sauce), Chicken Maharaja Mac (top, stacked patties, cheese, lettuce, tomato, sesame bun), Big Spicy Chicken Wrap (mid, wrapped sandwich in a wrapper, tomato and lettuce visible, cut diagonally), McSpicy Chicken (mid, crispy fillet burger with lettuce and white sauce), McChicken (mid, patty with shredded lettuce and white sauce on bun), Chicken & Cheese (mid, burger with cheese, sliced pickles and onion), Chicken Kebab (entry, burger with red onion and sauce on wrapper). Boneless column: Chicken McNuggets (golden nuggets in a pile on wrapper with a sauce cup) and Chicken Strips (golden breaded strips piled). Bone-in column: McSpicy Fried Chicken bucket (fried pieces in a cardboard bucket on a tray, orange-brown) and McSpicy Fried Chicken wings (two fried wings on wrapper). Lighting is even studio light, dominant colours are golden brown and orange with white backgrounds. Images are full-colour, not cropped, with no overlay. Logos: a red and black oval Chicken logo with a yellow outline, and the westlife logo (serif wordmark with a purple and green leaf mark).
Slide 31
Chicken | McDonald’s commands the chicken market
globally, with an extensive library of iconic products
Chicken
Westhlife
Taiwan
BLT Spicy Crispy
Chicken Leg Burger
Original Wheat Crispy
Chicken Wings
Spicy Crispy Chicken
Drumsticks
Spicy Crispy Chicken
Wings
UK
Chicken Selects®
Japan
Shaka-Chicki
Chicken Crisp Muffin
Gohan Chicken
Hong Kong
Grilled Chicken Twisty
Pasta
Honey BBQ Crispy
Thighs
Indonesia
Spicy Chicken Fingers
Spicy Chicken Bites
PaNas 2 Ayam Kimchi
USA
Deluxe Crispy Chicken
Sandwich
Malaysia
GCB - Grilled Chicken
Burger
Ayam Goreng
McD™
Italy
Salad with Crispy
Chicken Breast
Singapore
Grilled Chicken Salad
Buttermilk Crispy
Chicken
Breakfast Wrap
Chicken Sausage
31
Visuals: Twenty-three product photographs of McDonald’s chicken items, each on a white background with no crop or tint, arranged within the dashed country panels. Taiwan: BLT Spicy Crispy Chicken Leg Burger (burger with lettuce, tomato, bacon, red sauce, bun); Original Wheat Crispy Chicken Wings (golden fried wings, cluster); Spicy Crispy Chicken Drumsticks (two fried drumsticks, one with a bite out); Spicy Crispy Chicken Wings (fried wing pieces). UK: Chicken Selects (three breaded strips with a dip pot of white sauce to the right). Japan: Shaka-Chicki (fried chicken piece in a white paper box with orange logo), Chicken Crisp Muffin (crisp chicken patty in a muffin bun), Gohan Chicken (chicken patty burger with cheese, lettuce, bun). Hong Kong: Grilled Chicken Twisty Pasta (bowl of pasta, corn and grilled chicken pieces), Honey BBQ Crispy Thighs (fries, Coca-Cola cup and fried thigh and drumstick with Chinese label). USA: Deluxe Crispy Chicken Sandwich (burger with lettuce, tomato, golden bun). Malaysia: GCB Grilled Chicken Burger (bun, lettuce, grilled patty, dark sauce), Ayam Goreng McD (dark fried chicken pieces). Italy: Salad with Crispy Chicken Breast (salad bowl in a green-camouflage box). Indonesia: Spicy Chicken Fingers (three fries-shaped pieces in red fries carton), Spicy Chicken Bites (nuggets in branded paper sleeve), PaNas 2 Ayam Kimchi (fried chicken, rice and kimchi on a plate, cup of drink, yellow BARU badge). Singapore: Grilled Chicken Salad (bowl of greens, tomato, grilled chicken slices), Buttermilk Crispy Chicken (burger with buttermilk fried patty and cheese), Breakfast Wrap Chicken Sausage (wrap in blue sleeve, chicken sausage). Logos: Chicken badge (black and red ellipse with yellow outer ring and white Chicken text) top right; Westlife logo (purple-green leaf with black serif wordmark) top right corner. Lighting is flat, even studio lighting; the dominant colours are golden fried browns, greens and white, with yellow and red accents.
Slides 32 to 84 continue in the full text file.
Download this deck
The hosted PDF of every library deck is free for readers of the SlideDeck Co newsletter. Join with your email and the viewer and download appear here.
Preparing a strategy presentation of your own? The SlideDeck Co Consulting Deck is a slide library with a statement of work and a worked client case.