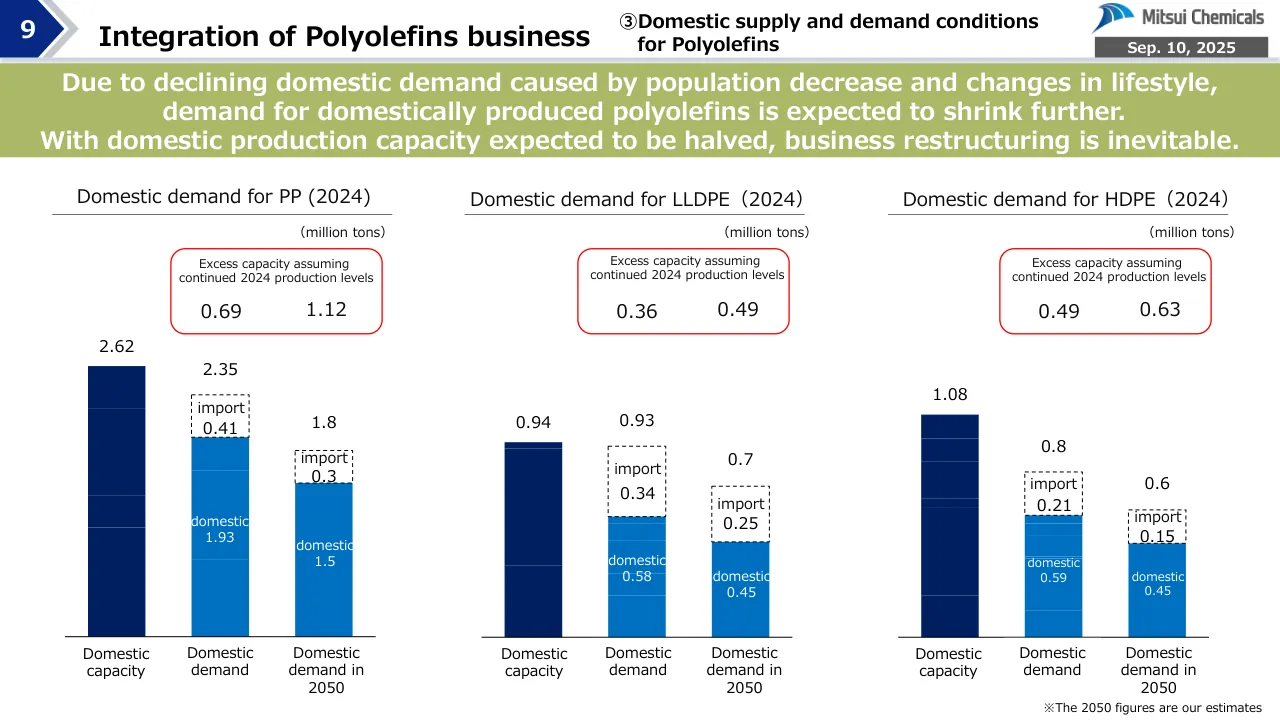
The deck opens with a cover and contents page that divide the talk between the group's portfolio transformation, led by the CEO, and a business strategy section for Basic & Green Materials, presented by a senior executive. It then outlines the aims of a planned split and the strategic position of a polyolefins integration with Sumitomo Chemical and Idemitsu Kosan, using a one-page map of plant closures, restructuring steps and partner collaborations. The middle section follows the business case in order: domestic polyolefin demand against capacity, the history of consolidation, the earnings trend of the existing joint venture, the ownership and business outline of the deal, integration synergies, green feedstock sourcing, and the profitability baseline. A business plan section links these to a 2030 operating income target and a cumulative cash flow bridge. The deck closes with a short vision statement and a standard forward-looking statements disclaimer. Several slides merit close study. The demand and capacity slide uses simple bar comparisons to show the excess-capacity argument at a glance.
Slides worth studying
Questions about this deck
How many slides does the Mitsui Chemicals Basic & Green Materials business strategy deck have?
The deck has 17 slides. Slide 1 is the cover and slide 17 carries the forward-looking statements disclaimer and closing messages.
What does the Mitsui Chemicals deck say about the 2030 operating income target for Basic & Green Materials?
Slide 15 states that B&GM business will achieve 36 billions of yen of operating income before special items in 2030 by promoting the second phase of restructuring and bolstering downstream businesses. The same slide lists a 2030 ROIC of around 6.5%.
What does the Mitsui Chemicals deck say about domestic polyolefin demand and capacity?
Slide 9 says that due to declining domestic demand caused by population decrease and changes in lifestyle, demand for domestically produced polyolefins is expected to shrink further. It also says that with domestic production capacity expected to be halved, business restructuring is inevitable.
What integration synergies does the Mitsui Chemicals deck expect from the polyolefins integration?
Slide 12 says the company will generate integration synergies worth more than 8 billion yen through initiatives including consolidation of facilities and product lines. The same slide also notes a goal to improve ROIC in the polyolefins business by 1-2% compared to the current level.
Details
- Company: Mitsui Chemicals
- Year: 2025
- Type: Strategy presentation
- Industry: Chemicals
- Pages: 17
More from Mitsui Chemicals
All Mitsui Chemicals decks in the library
Review score: 6 out of 10, Needs substantial work
Presentation quality, judged with the SlideDeck Co review heuristic. Ask, evidence and idea merit are not rated here.
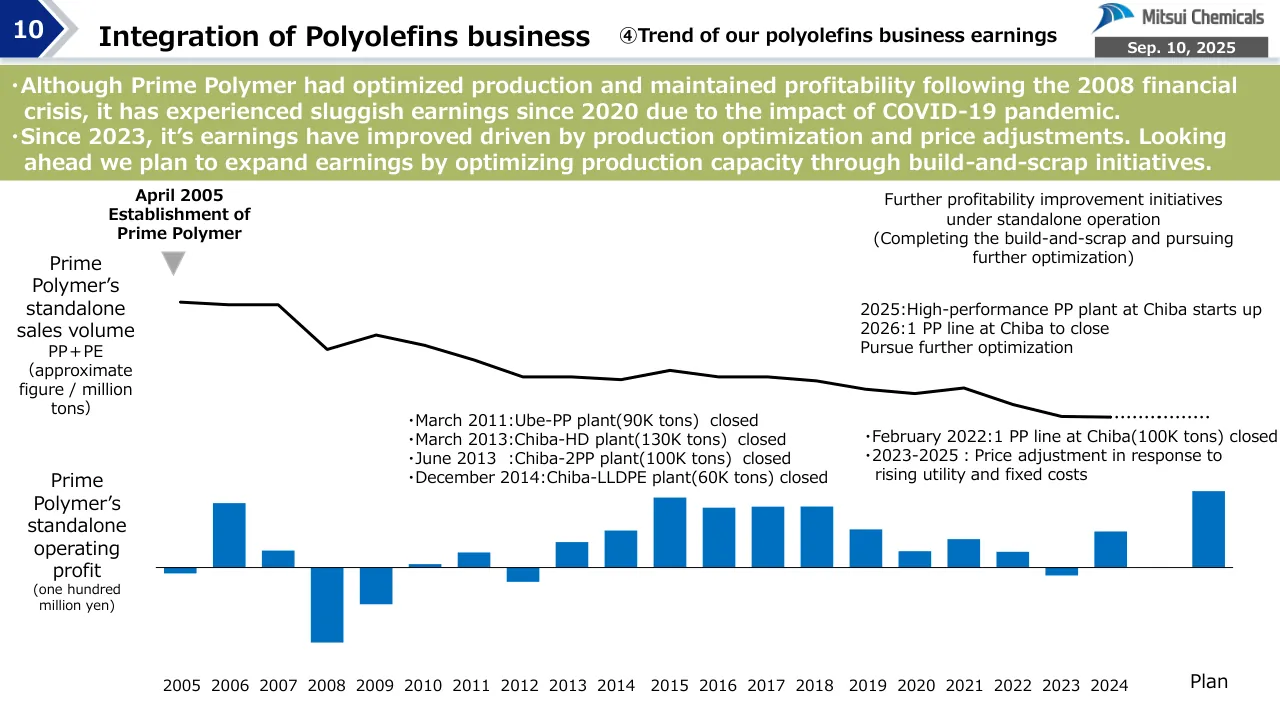
The route is clear: slides 4 and 5 state the aim, 7 to 12 build the business case, and 13 to 15 close on the plan, and every content slide has a full-sentence takeaway banner. But the execution is uneven. Slides 3, 5, 11, 12, 13 and 15 are dense text, tables and tiny diagrams that cannot be read in a briefing, and slide 12's synergy table and slide 15's table are close to unreadable. The charts on slides 9, 10 and 14 are readable, though slide 9 repeats the same chart three times with small labels clipped inside bars, and slide 14's waterfall has no running totals or connectors, so the core can be recovered but needs substantial revision.
Worth keeping: Keep the consistent header with slide number, the green takeaway banner on every content slide, and the simple three-bar comparison on slide 9.
Most useful repair: Rebuild slides 5, 12, 13 and 15 so each carries one message with larger type and a simpler diagram or table, and fix the clipped labels in the slide 9 bars and the waterfall on slide 14.
What would change the score: I would cut slide 3 and the repeated contents pages 2 and 6 to a single agenda, and break the dense slides into fewer-point pages with the key number as the visual focus.
Confidence high. 17 of 17 pages inspected on contact sheets, 4 at readable size. Reviewed 2026-11-08. Model-assisted review (claude-sonnet-5-5).
Full text of the slides (17 slides)
Every slide's words and a description of its charts and images, so the deck can be searched and rebuilt. Also available as Markdown.
Slide 1
0→1 MAKE IT HAPPEN
Business Strategy Presentation
focused on the integration of
Polyolefins business
Basic & Green Materials
Mitsui Chemicals
Group
IZAWA Kazumasa
伊澤 一雅
Senior Managing Executive Officer
Business Sector President, Basic & Green Materials Business Sector
Sep. 10, 2025
Visuals: Four graphics. (1) The '0→1 MAKE IT HAPPEN' wordmark, top-left: the words MAKE IT HAPPEN in bold condensed grey capitals with the numerals 0 and 1 and a blue arrow between them. (2) The Mitsui Chemicals Group corporate logo at left-centre: a stylised swoosh of three curved bands shading from dark navy at the lower left to bright cyan at the upper right, next to the wordmark 'Mitsui Chemicals' in bold grey sans-serif and 'Group' in lighter grey beneath. (3) A blue chevron graphic filling the right side of the slide, a solid #0D2C84 field whose left edge is a V-shaped notch pointing right. (4) A small image placed at the top right within the blue area at x 79.5%, y 2.7%, w 18.1%, h 4.3%; no visible content is rendered in it. No photographs, charts or tables.
Slide 2
Contents / The aims and strategic positioning of the / integration of Polyolefins business related to the / direction of Mitsui Chemicals Group’s business / portfolio transformation / CEO HASHIMOTO Osamu / Business Strategy of Basic & Green Materials / ・ / The integration of Polyolefins business / ・ / Business Plan / Senior Managing Executive Officer / IZAWA Kazumasa / Sep. 10, 2025
Visuals: A large white hexagon with a soft grey drop shadow and a white border, filled with a subtle diagonal gradient from white at top-left to pale blue-grey #D0D9E2 at bottom-right. Two black/grey right-pointing triangle bullets (play-style markers) sit beside the first and second contents items. Top-right has the Mitsui Chemicals logo: a blue swoosh/arc icon followed by the grey wordmark 'Mitsui Chemicals'. No charts, tables or photographs.
Slide 3
3
Approach to Pursuing Business Portfolio Transformation
Sep. 10, 2025
VISION 2030
Current phase onward
~2030
Specialty chemicals
domains
L&HC
Mobility
ICT
Active investment
& returns
Organic growth
New businesses + M&A
Ophthalmic lens
materials
Agrochemical
products
TAFMER™/ADMER™
ICROS™ Tape
APEL™
Ophthalmic lens materials
& coating materials
Agrochemical products
Automotive-related and
other materials
Monomaterials
Semiconductor-related
materials
Optical-related materials
Around existing areas
of focus
Medical solutions
Semiconductor & assembly
solutions
Relating to solutions
Becoming a high-growth,
high-profitability
global specialty company
Proactively invest resources including M&A that will help
accelerate growth and pursue global expansion
Carry out restructuring and portfolio transformation for businesses
with profitability and capital efficiency issues
B&GM
Speeding up restructuring
Bolstering downstream businesses
PH TDI High-performance PP
PTA/PET PE/PP High-performance MDI Catalysts
Becoming a strong basic and
green materials company
that supports Japanese industry
Decarbonization Biomass Recycling CCU
Ammonia firing Bio-based hydrocarbons Chemical recycles Carbon Neutral Research Center
Green Sustainable
Chemicals Division
Step up efforts to advance
regional and multi-company collaborations
Visuals: Icons and logos only, no photographs or charts. (1) Mitsui Chemicals logo at top right: a blue swoosh mark above or beside the grey wordmark 'Mitsui Chemicals'. (2) L&HC icon: a white line icon of a heart containing a person figure with a curved arrow below, on a dusty pink tile. (3) Mobility icon: a white line icon of a vehicle seat or car interior with a person and sound waves, on a teal-blue tile. (4) ICT icon: a white line icon of a rounded square device with a node and connected dots, on a golden tile. (5) B&GM icon: a white line icon of a factory with a circular arrow around it, on a light olive tile. All icons are white line art, no outlines, no shadows.
Slide 4
4 / Ideal Vision for the B&GM Business / Aiming to build a globally competitive, Japan-leading business entity / through transformation and collaborations with other companies / Sep. 10, 2025 / Aims of the split / Create in the petrochemical sector a Japan-leading green chemical business entity with a competitive edge against imports, through accelerated transformation and collaborations with other companies / Enable the specialty chemicals domains and the B&GM business – each requiring a different speed of decision-making – to execute strategies under their own governance structures / Support Japanese industry through contributions to economic security, enhanced quality of life via further performance improvements to materials, carbon neutrality, and other initiatives / While we will strive to realize this ideal vision as early as possible, the business will be split off by around 2027. / Ideal vision / L&HC / Mobility / ICT / B&GM / A strong basic & green materials company that supports Japanese industry / Competitors, etc. / Transformation & collaborations with other companies
Visuals: Diagram on the right: a rounded white box outlined in dark blue (#223F99) containing the Mitsui Chemicals logo (swoosh symbol and wordmark, dark grey wordmark) at its top centre, and four labelled boxes in a 2 by 2 arrangement: L&HC (pink #DCB1B1, white bold text) top left, Mobility (steel blue #679BB0, white bold text) top right, ICT (gold #D8A73A, white bold text) bottom left, and B&GM as a dashed green (#ABB867) outlined box with no fill and grey (#767171) bold text at bottom right. A solid grey (#7F7F7F) down-arrow runs from the blue-outlined box to a large green (#ABB867) rounded rectangle with a red dotted border (#C00000) labelled A strong basic & green materials company that supports Japanese industry. A pink-red curved arrow runs from the B&GM label down to the green rectangle's right side. Below, a grey up-arrow points from a white rounded box with a grey (#7F7F7F) border and grey text Competitors, etc. into the green rectangle, with red text Transformation & collaborations with other companies beside it. The left box has no visual besides text and the green header bar; the green right-pointing chevron arrow sits between the two panels.
Slide 5
5 / The strategic positioning of the integration of Polyolefins business / Sep. 10, 2025 / Take the first step toward strengthening Polyolefins business for a strong company that supports Japanese industry / Competitors, etc. / Substantial progress made with internally driven restructuring / Second phase of restructuring (FY25~) / PH Japan / Closure of Ichihara plant end of Oct. FY25 / Stable supply network through collaboration with other companies / PH Overseas / Transfer of Equity Method in China / (Withdrawal from all the global sites ) / PO Japan / High-performance PP plant starts up FY25 / 1PP line at Chiba to close FY26 / Business integration (Sumitomo Chemical ・ Idemitsu Kosan ・ Mitsui Chemicals)FY26★ / MDI Overseas / Study into next production increase for debottlenecking / TDI Japan / Plant downsizing (120Kt ⇒ 50Kt July. FY25) ★ / Crackers / Study into consolidation at Chiba LLP(FY27) / Establish a LLP for the collaboration among three companies in west Japan Aug. FY25 ★ / Accelerate the study into optimal production / Further Transformation & / collaborations with other companies / Highly capital-efficient / PH chain / Highly capital- / efficient strong / polyolefins business / High-profitability / Polyurethane / business centered / on high-performance / MDI / Competitive Green / Crackers / A strong / basic & green / materials / company / that supports / Japanese / industry / Becoming a strong / business entity / able to support / domestic industry
Visuals: Mitsui Chemicals logo at top right: a blue-grey wave or swoosh mark with the wordmark Mitsui Chemicals in dark grey. A large right-pointing block arrow in blue #5B9BD5 with its shaft spanning about x 53 to 72 percent and its triangular tip at about x 82 percent, running from about y 35 to y 97 percent, sitting behind the four centre boxes. A small grey double-headed vertical arrow (#7F7F7F) between the Competitors box and the Further Transformation text at about x 76 percent, y 27 to 36 percent. Red five-point stars (#C00000 or #CF5C5C) beside Plant downsizing, Aug. FY25 in the Crackers row, the Business integration line, and at about x 54 percent, y 20 percent next to Competitors, etc. Thin black bracket outlines frame the text Becoming a strong business entity able to support domestic industry. No photographs or charts.
Slide 6
Contents
The aims and strategic positioning of the
integration of Polyolefins business related to the
direction of Mitsui Chemicals Group’s business
portfolio transformation
CEO HASHIMOTO Osamu
Business Strategy of Basic & Green Materials
・ The integration of Polyolefins business
・ Business Plan
Senior Managing Executive Officer
IZAWA Kazumasa
Sep. 10, 2025
Visuals: A large white-to-pale-blue gradient hexagon with a thin white outline and a soft grey drop shadow, pointed left and right, spanning about 8% to 88% of slide width and nearly the full height. Two small triangular play-arrow markers: a grey right-pointing triangle beside the first item and a black right-pointing triangle beside the second item, both about 5% of slide width. The Mitsui Chemicals logo at top right: a blue swoosh mark followed by the dark grey wordmark 'Mitsui Chemicals'. A dark grey date bar beneath the logo reads 'Sep. 10, 2025' in white. The hexagon gradient runs from white at upper left to pale steel blue (#D0D9E2) at lower right.
Slide 7
7 / Integration of Polyolefins business / ①Polyolefin’s contribution to the domestic industry / Mitsui Chemicals / Sep. 10, 2025 / Polyolefins are made from naphtha produced by petroleum refining and their applications are extend / across various industrial sectors. They are highly important materials from the perspective of economic / security and essential products for domestic industry. / ※source:Based on data from The Japan Plastics Industry Federation and statistics from Japan Petrochemical Industry Association, certain data have been partially estimated in-house. / 1,800 / 1,600 / 1,400 / 1,200 / 1,000 / 800 / 600 / 400 / 200 / 0 / (million tons) / Gross domestic / production of / plastics / 8.4 / 46% / PP / 1.93 / PE / 1.94 / propylene / 2.99 / ethylene / 4.99 / naphtha / Petroleum refining / Cracker / Plastics / Applications of Polyolefins / (million tons) / Films / 1.00 / Laminates / 0.22 / Flat yarn / 0.03 / Injection molding / 1.23 / Blow molding / 0.23 / Fiber / 0.08 / Pipes / 0.06 / Extrusion molding / 0.19 / Electric wire sheathing / 0.04 / Others / 0.53 / ※source:Japan Petrochemical Industry Association / Relevant Industry / Automotive / instrument panel, bumper etc. / Electric Materials / materials for Lithium-ion battery, control units etc. / Medical Instruments / syringe, dialyzer, infusion bag etc. / Cosmetics・Foods / various containers / Agriculture / films, irrigation pipes / Construction / electric wire sheathing, various pipes / ※The data of 2024 excluding propylene from Olefin Conversion Unit and Fluid Catalytic Cracking
Visuals: Stacked bar chart titled with unit '(million tons)', with a vertical axis from 0 to 1,800 in steps of 200 (labels 0, 200, 400, 600, 800, 1,000, 1,200, 1,400, 1,600, 1,800 at the left, grey #595959 bold) and horizontal gridlines in light grey. Two columns: Cracker, with segments ethylene 4.99 (light blue #CAEEFB, bottom, red outline), propylene 2.99 (pink #F2CFEE, red outline), then unlabelled segments in grey #D9D9D9, salmon #F6C6AD and light green #D9F2D0 up to about 1,650 (no printed values, about); Plastics, with PE 1.94 (light blue #CAEEFB, bottom), PP 1.93 (pink #F2CFEE), and unlabelled grey segments above (about) up to the 8.4 total labelled in a red-outlined callout box reading Gross domestic production of plastics 8.4. A red-outlined bracket beside the Plastics column points to '46%' in bold red #FF0000 inside a dark grey outlined box. Thin blue connector lines run from the Plastics column top to the applications table and from its base to the table footnote. Right of the chart is a table 'Applications of Polyolefins' with header '(million tons)' and rows: Films 1.00; Laminates 0.22; Flat yarn 0.03; Injection molding 1.23; Blow molding 0.23; Fiber 0.08; Pipes 0.06; Extrusion molding 0.19; Electric wire sheathing 0.04; Others 0.53. Photos: a petrochemical plant with distillation columns and pipes on white background (left top, full colour, boxed); a dusk aerial of a refinery with storage tanks glowing under orange-to-blue sky (left, boxed); an inset of tall columns and pipework over a grey sky (on the chart, boxed); a grid of 12 photographs in two columns: automotive interior dashboard, silver sports car, reel of film and electronic components, Li-ion battery pack with orange cables, syringes on blue, medical dialysis equipment, cosmetic tubes and bottles, brown pouch with coffee beans, green crop row with pipe, blue sky over greenhouse, power line insulators on blue sky, blue PVC pipes. Logo: Mitsui Chemicals (blue swoosh and grey wordmark) at top right.
Slide 8
8 / Integration of Polyolefins business / ②Trend of reorganization among domestic / polyolefins manufacturers / Mitsui Chemicals / Sep. 10, 2025 / Although domestic polyolefins makers have promoted reorganization and consolidation, / consolidation has not progressed as much as in oil refinery industry(4 companies) and steel / industry (3 blast furnace steelmakers), and as a result, excess capacity remains unresolved. / Trend of domestic production of PP / PE / (million tons) / As of September 1994 / As of April 2025 / Mitsui Petrochemical Industries (PE、PP) / Idemitsu Petrochemical Co., Ltd.( 〃 ) / Sumitomo Chemical Co., Ltd.( 〃 ) / Mitsubishi Petrochemical Co., Ltd.( 〃 ) / Mitsubishi Kasei Corporation ( 〃 ) / Tonen Chemical Corporation ( 〃 ) / Showa Denko K.K. ( 〃 ) / reorganization / Nippon Petrochemicals Co., Ltd. ( 〃 ) / Tosoh Corporation ( 〃 ) / consolidation / Asahi Chemical Industry Co., Ltd.( 〃 ) / Chisso Corporation ( 〃 ) / Ube Industries Ltd. ( 〃 ) / Maruzen Polymer Co., Ltd. (PE ) / Nippon Unicar Company Limited (PE ) / DuPont-Mitsui Polychemicals Co., Ltd. (PE) / Mitsui Toatsu Chemicals ( PP) / Tokuyama Corporation ( PP) / Prime Polymer Co., Ltd. (PE、PP) / SUMITOMO CHEMICAL COMPANY, LIMITED (PE、PP) / Japan Polyethylene Corporation (PE ) / Japan Polypropylene Corporation ( PP) / SunAllomer Ltd. ( PP) / Tosoh Corporation (PE ) / Asahi kasei Corp. (PE ) / KEIYO POLYETHYLENE CO., LTD. (PE ) / UBE-MARUZEN POLYETHYLENE CO., LTD. (PE ) / ENEOS NUC Corporation (PE ) / Dow-Mitsui Polychemicals Company, Ltd. (PE ) / ※product capacity : fiscal year-end 2023 / PE : 15 companies(3.55 million tons/year) / PE : 9 companies(3.23 million tons/year) / PP : 14 companies(2.58 million tons/year) / PP : 4 companies(2.62 million tons/year) / ※source: The Japan Plastics Industry Federation / ※source:Japan Petrochemical Industry Association / 1997 / 2.85 / (100%) / PP / 2024 / 1.93 / (70%) / Low density PE / (including EVA) / 2.05 / (〃) / 1.28 / (64%) / High density PE / 1.31 / (〃) / 0.66 / (50%) / 97 99 01 03 05 07 09 11 13 15 17 19 21 23 / 0 1 2 3 4 5 6
Visuals: Chart: stacked area chart titled Trend of domestic production of PP / PE, unit (million tons). Y axis from 0 to 6 in steps of 1 with light grey horizontal gridlines at each step. X axis is calendar years 1979 to 2023 labelled 97, 99, 01, 03, 05, 07, 09, 11, 13, 15, 17, 19, 21, 23 (no printed values for individual years). Three stacked series, bottom to top: High density PE in light sky blue #96DCF8, from 0 to about 1.3 in 1997 and about 0.66 in 2024; Low density PE (including EVA) in pale blue #CAEEFB, from the top of the high density band to about 3.1 in 1997 (total 2.05 above high density) and about 1.28 above the high density band in 2024; PP in pale pink #F2CFEE, the top band, about 2.85 in 1997 (total for the year 2.85, 100%) and 1.93 in 2024 (70%). Printed labels: 1997 2.85 (100%) in black at upper left; PP label in black mid chart; 2.05 (〃) in blue #32ACE7 over low density PE; 1.31 (〃) in blue #0000FF over high density PE; 2024 1.93 (70%) in magenta #FF66FF at right; 1.28 (64%) in blue #32ACE7 at right; 0.66 (50%) in blue #0000FF at right. Black double-headed vertical arrows mark each band at the 1997 and 2024 positions. Legend: none; the bands are labelled directly. Highlighted points: the 1997 and 2024 columns are marked by the arrows. Grey arrow: a solid grey right-pointing block arrow #BBBCBC between the two lists, with a black bold label reorganization above and consolidation below. Logo: Mitsui Chemicals blue swoosh emblem with dark grey wordmark at top right.
Slide 9
9
Integration of Polyolefins business
③Domestic supply and demand conditions
for Polyolefins
Sep. 10, 2025
Due to declining domestic demand caused by population decrease and changes in lifestyle,
demand for domestically produced polyolefins is expected to shrink further.
With domestic production capacity expected to be halved, business restructuring is inevitable.
Domestic demand for PP (2024)
(million tons)
Excess capacity assuming
continued 2024 production levels
0.69 1.12
2.62
2.35
import
0.41
domestic
1.93
1.8
import
0.3
domestic
1.5
Domestic
capacity
Domestic
demand
Domestic
demand in
2050
Domestic demand for LLDPE(2024)
(million tons)
Excess capacity assuming
continued 2024 production levels
0.36 0.49
0.94
0.93
import
0.34
domestic
0.58
0.7
import
0.25
domestic
0.45
Domestic
capacity
Domestic
demand
Domestic
demand in
2050
Domestic demand for HDPE(2024)
(million tons)
Excess capacity assuming
continued 2024 production levels
0.49 0.63
1.08
0.8
import
0.21
domestic
0.59
0.6
import
0.15
domestic
0.45
Domestic
capacity
Domestic
demand
Domestic
demand in
2050
※The 2050 figures are our estimates
Visuals: Three vertical stacked column charts, each titled with the product and 2024 (PP, LLDPE, HDPE), unit '(million tons)'. Each chart has three columns on a baseline with no visible y-axis or gridlines apart from faint horizontal lines inside the dark bars. Columns per chart: Domestic capacity (solid dark navy #002060 bar, no internal label, total printed above), Domestic demand (mid blue #0070C0 lower segment labelled domestic, with a dashed-outline box above labelled import, total printed above), Domestic demand in 2050 (same stacking, total printed above). PP: capacity 2.62; demand total 2.35 = domestic 1.93 + import 0.41; 2050 total 1.8 = domestic 1.5 + import 0.3. LLDPE: capacity 0.94; demand total 0.93 = domestic 0.58 + import 0.34; 2050 total 0.7 = domestic 0.45 + import 0.25. HDPE: capacity 1.08; demand total 0.8 = domestic 0.59 + import 0.21; 2050 total 0.6 = domestic 0.45 + import 0.15. Each chart has a red rounded-rectangle box titled 'Excess capacity assuming continued 2024 production levels' with two unlabelled values: PP 0.69 and 1.12; LLDPE 0.36 and 0.49; HDPE 0.49 and 0.63. No legend. No highlighted points. Japanese labels (国内能力, 国内需要, 50年需要) are set beneath the English category labels and are not visible.
Slide 10
10 / Integration of Polyolefins business / ④Trend of our polyolefins business earnings / Mitsui Chemicals / Sep. 10, 2025 / ・Although Prime Polymer had optimized production and maintained profitability following the 2008 financial / crisis, it has experienced sluggish earnings since 2020 due to the impact of COVID-19 pandemic. / ・Since 2023, it’s earnings have improved driven by production optimization and price adjustments. Looking / ahead we plan to expand earnings by optimizing production capacity through build-and-scrap initiatives. / April 2005 / Establishment of / Prime Polymer / Further profitability improvement initiatives / under standalone operation / (Completing the build-and-scrap and pursuing / further optimization) / Prime / Polymer’s / standalone / sales volume / PP+PE / (approximate / figure / million / tons) / 2025:High-performance PP plant at Chiba starts up / 2026:1 PP line at Chiba to close / Pursue further optimization / ・March 2011:Ube-PP plant(90K tons) closed / ・March 2013:Chiba-HD plant(130K tons) closed / ・June 2013 :Chiba-2PP plant(100K tons) closed / ・December 2014:Chiba-LLDPE plant(60K tons) closed / ・February 2022:1 PP line at Chiba(100K tons) closed / ・2023-2025:Price adjustment in response to / rising utility and fixed costs / Prime / Polymer’s / standalone / operating / profit / (one hundred / million yen) / 2005 2006 2007 2008 2009 2010 2011 2012 2013 2014 2015 2016 2017 2018 2019 2020 2021 2022 2023 2024 / Plan / 600 / 500 / 400 / 300 / 200 / 100 / 0 / -100 / -200 / 180 / 130 / 80 / 30 / -20 / -70
Visuals: Line chart (upper): black line of about 2.5% slide-height stroke, plotted from the left axis of sales volume PP+PE; it starts at about 2005 at a high level, drops to a plateau, has a step down near 2008, bumps up near 2009, falls steadily through 2012 to 2013, dips slightly around 2015, is flat 2016 to 2018, declines through 2019 to 2023, then a dotted extension runs to the right edge of the plot after 2024. Values are printed only as axis ticks 600, 500, 400, 300, 200, 100, 0 on the left and 180, 130, 80, 30, -20, -70 on the right, so no data labels exist; series values are about and not printed. Grey downward triangle marker (about #AAAAAA) above the 2005 start point marks the April 2005 establishment of Prime Polymer. Bar chart (lower): vertical bars in blue #0070C0, one per year 2005 to 2024 with the Plan column at far right, with a thin black horizontal zero baseline. Values are not printed; estimates in units of one hundred million yen read from left axis ticks: 2005 about -12, 2006 about 139, 2007 about 36, 2008 about -160, 2009 about -79, 2010 about 7, 2011 about 32, 2012 about -29, 2013 about 54, 2014 about 79, 2015 about 151, 2016 about 129, 2017 about 132, 2018 about 132, 2019 about 82, 2020 about 35, 2021 about 60, 2022 about 33, 2023 about -18, 2024 about 78, Plan about 165 (no bar in the gap between 2024 and Plan). Y-axis: left ticks 600 to -200 for the line chart and 200 to -200 for bars; the scale is printed only as ticks. Highlighted points: none. Legend: none. Annotations: four bullet lines of plant closures and one bullet line of February 2022 closure and 2023-2025 price adjustment are placed over the plot area; the 2025 and 2026 notes and Further profitability improvement text sit in the upper right.
Slide 11
11
Integration of Polyolefins business
⑤Outline of the integration
Sep. 10, 2025
Integrated domestic polyolefins business of SUMITOMO CHEMICAL COMPANY, LIMITED (“SUMITOMO”) into Prime Polymer Co., Ltd.(“PRM”). SUMITOMO will acquire a stake in PRM as a shareholder.
Outline of PRM
Company name
Prime Polymer Co., Ltd.
Domestic sites
Head office(Tokyo), Sales office(Nagoya, Osaka) Fundamental Research Laboratory, Packaging and Industrial Materials Laboratory, Automotive Materials Laboratory, Ichihara Works, Anesaki Works, Osaka Works,
Affiliated Companies
Evolue Japan Co., ltd.(“Evolue Japan”) Prime Evolue Singapore Pte. Ltd. Tokuyama Polypropylene Co., Ltd.(“Tokuyama PP”)
Established
April 1, 2005
President and Vice president
YOSIZUMI Fumio, President YAMADA Eiichiro, Executive Vice President
Capital
20 billions of yen(Mitsui Chemicals(“Mitsui”) 65% ; Idemitsu Kosan(“Idemitsu”) 35%)
Sales Revenue
286.3 billions of yen(Standalone PRM, FY 24)
Production Capacity
PP:1.26 million tons/year(including Tokuyama PP ) PE:0.55 million tons/year(including Evolue Japan)
Number of Employees
710(as of the end of March 2025)
SUMITOMO’s business to be integrated
Business
・Domestic PP business(including PP-CPD business) ・Domestic LLDPE business(including Evolue Japan) ※excluding domestic LDPE business, overseas affiliated companies*
Sites
Head office(Tokyo), Branch office(Nagoya) Chiba Works, EGM laboratory
Sales revenue
101 billions of yen(FY 24)
Production Capacity
PP :0.33 million tons/year PE :0.17 million tons/year
Number of Employees
Approximately 200
*・PO business in Singapore and Saudi Arabia
・PP-CPD business in Thailand, Europe and the US
・Integrated SUMITOMO’s business listed above into PRM
・SUMITOMO will acquire PRM’s shares for consideration
【Investment ratio in PRM】
・Before integration : Mitsui 65%, Idemitsu 35%
・After integration : Mitsui 52%, Idemitsu 28%, SUMITOMO 20%
Visuals: Two tables and one block arrow. The left table, Outline of PRM, has two columns (a label column with #F4F4EA fill and a value column with white fill) and 10 rows: Company name; Domestic sites; Affiliated Companies; Established; President and Vice president; Capital; Sales Revenue; Production Capacity; Number of Employees. The right table, SUMITOMO’s business to be integrated, has two columns and 5 rows: Business; Sites; Sales revenue; Production Capacity; Number of Employees, with values as listed in the text. The large grey block arrow (#BBBCBC) points left from the bottom of the right table toward the left table, with a downward stem beneath the table, and has no labels. Logo: Mitsui Chemicals (blue-grey swoosh mark with wordmark) in the top-right. No photographs or charts.
Slide 12
12
Integration of Polyolefins business
⑥Integration synergy
Sep. 10, 2025
We will realize profitability improvement and increased capital efficiency in polyolefins business by generating integration synergies worth more than 8 billion yen through initiatives including consolidation of facilities and product lines. (Post-integration, we aim to improve ROIC in our polyolefins business by 1-2% compared to the current level.)
Cost reduction effects through rationalization and related initiatives
(billions of yen)
Items
Intended effects
Optimization of production capacity
・Additional actions to close and consolidate facilities
⇒ PP : 1 line, PE : 1 line
about 4
Consolidation of product lines / productivity improvement
about 2
Reduction of administration functions etc.
about 2
Amount of synergies
about 8
We will strive to realize synergy effects
exceeding 8 billion yen by further initiatives.
Future profitability improvement
initiatives independently by PRM
(Completing of build-and-scrap of PP,
further optimization)
・2025: High-performance PP plant at Chiba
starts up
・2026:1 PP line at Chiba to close
Pursue further optimization
Integration synergy
with SUMITOMO
・Additional closure :1 PP / 1 PE line at Chiba
・Consolidation of product lines, productivity
improvement, reduction of administration
functions, etc.
・February 2022:1 PP line at Chiba(100K tons) closed
・2023~2025:Price adjustment in response to rising
utility and fixed costs
SUMITOMO’s earnings
+Integration synergy
2016 2017 2018 2019 2020 2021 2022 2023 2024
Future
vision
Visuals: Chart: vertical column chart with no chart title and no printed y-axis values, ranges or units. Categories along the baseline: 2016, 2017, 2018, 2019, 2020, 2021, 2022, 2023, 2024, Future vision. Series are blue #0070C0 columns, all positive except 2023 which is a small negative bar below the baseline. Estimated heights (about, no values printed): 2016 about 8.4 units, 2017 about 8.5, 2018 about 8.6, 2019 about 5.5, 2020 about 2.0, 2021 about 3.2, 2022 about 2.0, 2023 about -0.8 (below baseline), 2024 about 4.6. The Future vision column is a stacked column: a blue #0070C0 base up to about 11.4 units from baseline and a light blue #B4C7E7 top segment with a black outline (about 8.1 units) labelled 'SUMITOMO’s earnings +Integration synergy' with a thin leader line from the label to the segment. Annotations text on the chart: 'February 2022:1 PP line at Chiba(100K tons) closed' and '2023~2025:Price adjustment in response to rising utility and fixed costs'. No legend and no highlighted points beyond the light blue segment. Table: two columns, 'Items' (black header, white bold text) and 'Intended effects' (black header, white bold text); rows: 'Optimization of production capacity' with sub-bullet '・Additional actions to close and consolidate facilities' and '⇒ PP : 1 line, PE : 1 line' | 'about 4'; 'Consolidation of product lines / productivity improvement' | 'about 2'; 'Reduction of administration functions etc.' | 'about 2'; 'Amount of synergies' (right-aligned in the first column) | 'about 8'. Row fills alternate #D9D9D9 and #F2F2F2 in the body; values right-aligned. Logo: Mitsui Chemicals logo at top right, a blue and dark blue swoosh mark with the wordmark 'Mitsui Chemicals' in dark grey. Icons: none. Photographs: none. Other: the olive banner, a white rectangle box with a black outline containing the closing statement.
Slide 13
13 / Integration of Polyolefins business / ⑦Accelerating green transformation by / business integration / Mitsui Chemicals / Sep. 10, 2025 / The renewed PRM aims to become a true prime solution partner for customers in the emerging green society by combining 'Green raw material supply capability by the three investing companies', 'Technologies and channels of PRM(before integration)', 'Technologies and channels from SUMITOMO'. / Sales of products derived from green raw materials / Customers, Consumers / Three investing companies / Supply green raw materials / Renewed PRM / Production・ distribution・ consumption・ disposal / Idemitsu / Waste plastic pyrolysis facility →chemical recycled naphtha / SAF manufacturing facility →bio-based naphtha / Crackers (Product raw materials) / PP・PE plants (Product PO resins) / Sales of high-value-added recycled products / Capture / Capture(chemical recycling) / Products derived from green raw materials (Biomass, Chemical recycling) / PRM(before integration) / SUMITOMO / Enhance our ability to provide solutions through diversification of raw material lineup / High-value-added recycled products (Mechanical recycling) / PRM(before integration) / SUMITOMO / Enhance our ability to develop technologies and markets through proprietary technologies and channel integration / Mitsui, SUMITOMO / ・imported bio-based naphtha / ・chemical recycled naphtha
Visuals: Process diagram with arrows: (1) small pale green block arrow from an industrial icon-like illustration of Idemitsu facility to a photo of crackers; (2) pale green block arrow labelled 'Supply green raw materials' from crackers photo to photo of PP・PE plants; (3) pale green block arrow labelled 'Sales of products derived from green raw materials' from the plants area to the ellipse 'Customers, Consumers'; (4) bright cyan (#00FFFF) block arrow labelled 'Sales of high-value-added recycled products' from plants to customers; (5) cyan curved arrow labelled 'Capture' running from customers back toward the plants, with darker teal (#00CDCD) shading; (6) large sage-green (#9EB491) curved return arrow labelled 'Capture(chemical recycling)' running from the customers ellipse area back under the diagram to the Idemitsu side with a pale green arrowhead. Photo 1: crackers, a refinery-type plant with tall grey columns, pipework and a red-and-white striped stack, under bright overcast sky, full-colour, rectangular, not cropped. Photo 2: PP・PE plants, an aerial-style photo of a petrochemical plant with towers, pipes and a road and river at the bottom, bright daylight, rectangular box, not cropped. Illustration: small grey and orange industrial plant icon with tanks, stacks and pipes at left above the Idemitsu label. Photo 3: a tanker ship in blue water with red hull stripe, aerial top-down view, rectangular, bottom-left. Two comparison panels: left panel with pale green header (#C5E0B4) and dark green border, with logos Prasus (green swirl mark and black wordmark) × Meguri (teal swoosh and black wordmark 'CIRCULARITY FOR ALL') and a pink (#FF99FF-like) large X between them; right panel with cyan header (#00FFFF) and navy border, with logos Re'PRM (red and orange swirl and black wordmark) × Meguri (teal swoosh, 'CIRCULARITY FOR ALL') and a pink X between them. Logos: Mitsui Chemicals (blue swoosh mark and grey wordmark) top right. No charts or tables.
Slide 14
14
Business plan of Basic & Green Materials business
①Profitability of Basic & Green
Materials business
Sep. 10, 2025
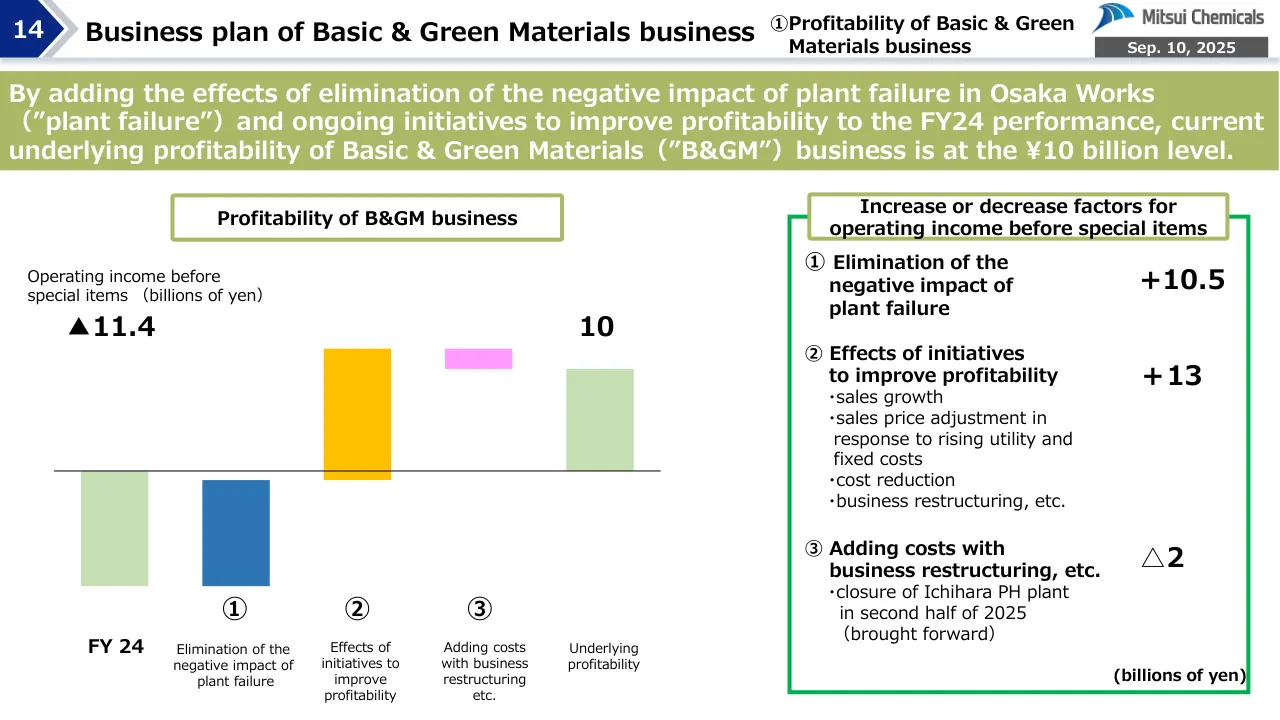
By adding the effects of elimination of the negative impact of plant failure in Osaka Works
(”plant failure”)and ongoing initiatives to improve profitability to the FY24 performance, current
underlying profitability of Basic & Green Materials(”B&GM”)business is at the ¥10 billion level.
Profitability of B&GM business
Operating income before
special items (billions of yen)
▲11.4
10
①
②
③
Increase or decrease factors for
operating income before special items
① Elimination of the
negative impact of
plant failure
+10.5
② Effects of initiatives
to improve profitability
・sales growth
・sales price adjustment in
response to rising utility and
fixed costs
・cost reduction
・business restructuring, etc.
+13
③ Adding costs with
business restructuring, etc.
・closure of Ichihara PH plant
in second half of 2025
(brought forward)
△2
(billions of yen)
FY 24
Elimination of the
negative impact of
plant failure
Effects of
initiatives to
improve
profitability
Adding costs
with business
restructuring
etc.
Underlying
profitability
Visuals: Waterfall chart titled 'Profitability of B&GM business' in a white box with olive outline. Y-axis label 'Operating income before special items (billions of yen)', no visible axis scale or numeric tick range. Bars left to right: FY 24 starts at about -11.4 billion (light green #C5E0B4, printed value ▲11.4 above top-left, bar hangs below the baseline, about 16 percent of slide height tall); step ① Elimination of the negative impact of plant failure, about +10.5 (dark blue #2E75B6, labelled ①, floats from about -11.4 to about -0.9); step ② Effects of initiatives to improve profitability, about +13 (amber #FFC000, labelled ②, rises above baseline); step ③ Adding costs with business restructuring, etc., about -2 (pink #FF99FF, labelled ③, small bar just above baseline); final bar Underlying profitability, 10 (light green #C5E0B4, printed value 10 above it, rises above baseline). A thin black horizontal baseline runs across the chart at zero. Circled numbers ①②③ sit under the step bars. Right panel: green outlined box (#00B050) with three numbered factors and printed values +10.5, +13, △2 in bold black, and the unit (billions of yen) at bottom right. Legend: none.
Slide 15
15 / Business plan of Basic & Green Materials business / ②Toward the target operating / income before special items / Sep. 10, 2025 / B&GM business will achieve 36 billions of yen of operating income before special items in 2030 by / promoting the second phase of restructuring and bolstering downstream businesses. / Integration with SUMITOMO is an important item to the initiatives above. / Making the B&GM business / self-sustaining / Cumulative cash flow / plan from FY25 to FY30 / Current underlying / profitability / 10 / Pursue / investments / for a green / transition / Free / cash / flow / Operating / cash flow / Investing / cash flow / Investments / to maintain / production / & pursue / restructuring / Business / Ideal state / 2025~2030 / Promoting the second phase of / restructuring and bolstering / downstream business / Improving / profitability / (billions of yen) / Crackers / Competitive crackers / (East Japan)2027:Decision to consolidation at Chiba LLP / (West Japan)Establish a LLP for the collaboration / among three companies and accelerate the study / into optimal cracker production / +17 / PH / Highly capital-efficient / PH chain / ・2025: Transfer of Equity Method in China / ・Closure of Ichihara PH plant in second half of / 2025(brought forward) / PTA・PET / Securing profit / through optimal / business structure / Domestic facilities have been closed by 2024 / Polyurethanes / High-profitability / polyurethane business / centered on / high-performance MDI / ・2025:Downsizing of Omuta TDI plant / ・High-performance MDI: Beginning study into next / production increase for debottlenecking / Polyolefins / (PP・PE) / Highly capital-efficient / high-performance / polyolefins business / ・Completion of build-and-scrap of PP / 2025: High-performance PP plant starts up / 2026: 1 PP line at Chiba to close / ・Considering further optimization / ・Optimization by integration with SUMITOMO / Additional closure 1 PP / 1 PE line at Chiba, / Consolidation of product lines, productivity / improvement, reduction of administration / functions, etc. / Integration / synergy / more than / +8 / Promoting the second / phase of restructuring / and bolstering / downstream business / more than+25 / 2030:B&GM business / ・Operating income / before special / items :36 / ・ROIC: Around 6.5% / (billions of yen)
Visuals: Left panel: a bar-style cash-flow diagram with three vertical bars standing on a black baseline line (about 0.7 to 15.3 percent of width at y 93 percent). A pale blue bar (#B4C7E7) at x 2.7 percent is labelled Operating cash flow, a tall olive green bar (#ABB867) at x 9.7 percent (upper part, y 42.6 to 62.2 percent) is labelled Free cash flow, and a pale yellow bar (#FFE699) at x 9.7 percent (lower part, y 62.2 to 93.3 percent) is labelled Investing cash flow with the note Investments to maintain production and pursue restructuring. A solid olive green block arrow (#ABB867), about x 12.9 to 18.6 percent and y 51 to 58 percent, points right from the top of the green bar, and the words Pursue investments for a green transition sit above it in dark olive. No numeric values are printed on the bars. Table: a grid of thin black cell borders on white with a green header row (#ABB867) across the top, four columns Business, Ideal state, 2025~2030 Promoting the second phase of restructuring and bolstering downstream business, and Improving profitability (billions of yen), and six body rows labelled Crackers, PH, PTA・PET, Polyurethanes, Polyolefins (PP・PE) and an unlabelled integration row. The Improving profitability column shows +17 spanning the first five rows and Integration synergy more than +8 in the last row. Right column: a thin dark slate bracket (#44546A) spans from the top of the table to its bottom and points to the text block; a grey plus sign (#A6A6A6) sits between Current underlying profitability 10 and the text Promoting the second phase...more than+25; a solid grey down arrow (#808080) sits above the final block. Logo: the Mitsui Chemicals logo at top right, a blue (#1F4E9A) swoosh mark to the left of a dark grey bold wordmark Mitsui Chemicals.
Slide 16
A global solutions company that
leads change and contributes to a sustainable future
Visuals: One photograph of a blue sky with white cumulus clouds and soft sunbeams radiating diagonally from the upper-left to the lower-right. The photo is cropped into a right-pointing hexagonal arrow/chevron shape: its right edge runs from the top at about x 63% (top edge) diagonally to a point at about x 78.9%, y 50%, then back diagonally to about x 63% at the bottom edge. Lighting is bright, diffused daylight with light rays from the upper left. Dominant colours are sky blue (about #6FA8D6), pale blue (about #BFE0F2) and white clouds. The photo is not boxed; there is no overlay or tint visible. The area to the right of the arrow point is plain white.
Slide 17
Chemistry for Sustainable World
Mitsui Chemicals
Challenge Diversity One Team
Statements made in this document with respect to Mitsui Chemicals' current plans, estimates, strategies, and beliefs and other statements that are not / historical facts are forward-looking statements about the future performance of Mitsui Chemicals.
Information provided here, other than historical facts, refers to future prospects and performance, and has been prepared by Mitsui Chemicals management / on the basis of currently available information. This covers various risks, including, but not limited to, economic conditions (especially, customer demand), / foreign currency exchange rates and other factors. As a result, actual future performance may differ from any forecasts contained in this document.
Mitsui Chemicals has no responsibility for any possible damages arising from the use of this information nor does Mitsui Chemicals have any obligation to / update present forward-looking statements, or release new ones, as a result of new information, future events or otherwise.
This document may not include all the information Mitsui Chemicals has disclosed to stock exchanges or made public in other ways. Please be aware that / the content on this document is subject to change or deletion without advance notice.
Although Mitsui Chemicals has made careful efforts regarding the accuracy of the contents here, Mitsui Chemicals assumes no responsibility for problems / including, but not limited to, incorrect information, or malicious tampering with the content of the data in this document by any third parties or problems / resulting from downloading. Furthermore, this website is not an offer or a solicitation of an offer to buy or sell securities. Please be aware that decisions / regarding investing are the responsibility of users themselves.
Visuals: One logo: the Mitsui Chemicals logo, a swoosh mark of three curved stripes with a blue gradient from deep indigo at the lower left (about #2B2A8C) to bright sky blue at the upper right (about #1E8FD9), beside the wordmark 'Mitsui Chemicals' in a bold dark grey (about #3A3A3A) sans-serif. The logo image is 777 by 190 pixels, placed unboxed on white at x 19.8, y 11.2, w 60.3, h 26.2. No photographs, charts or tables.
Download this deck
The hosted PDF of every library deck is free for readers of the SlideDeck Co newsletter. Join with your email and the viewer and download appear here.
Preparing a strategy presentation of your own? The SlideDeck Co Consulting Deck is a slide library with a statement of work and a worked client case.