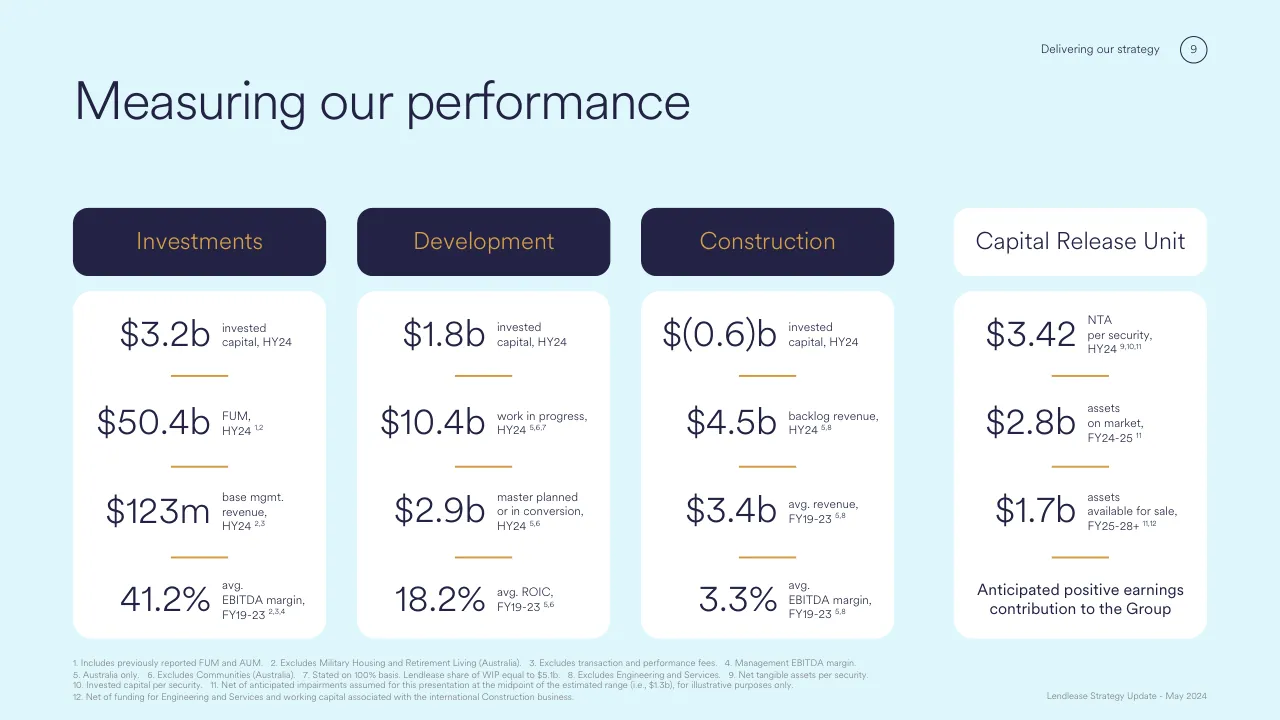
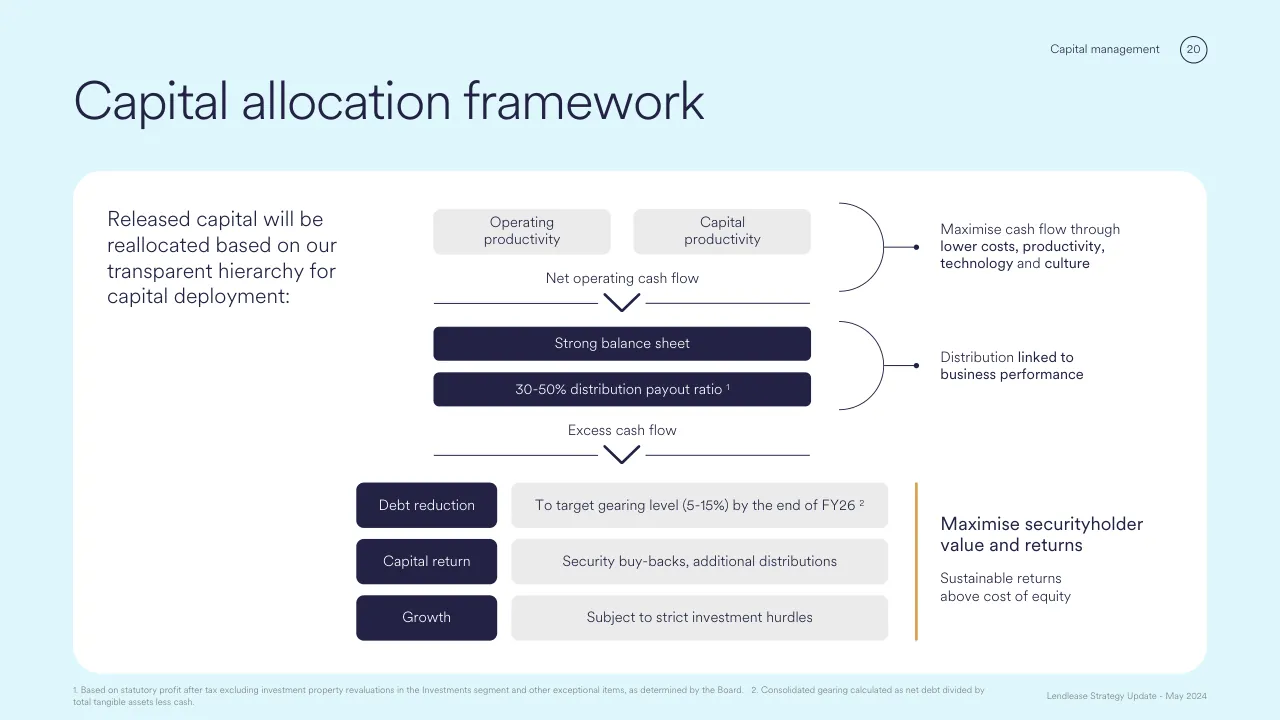
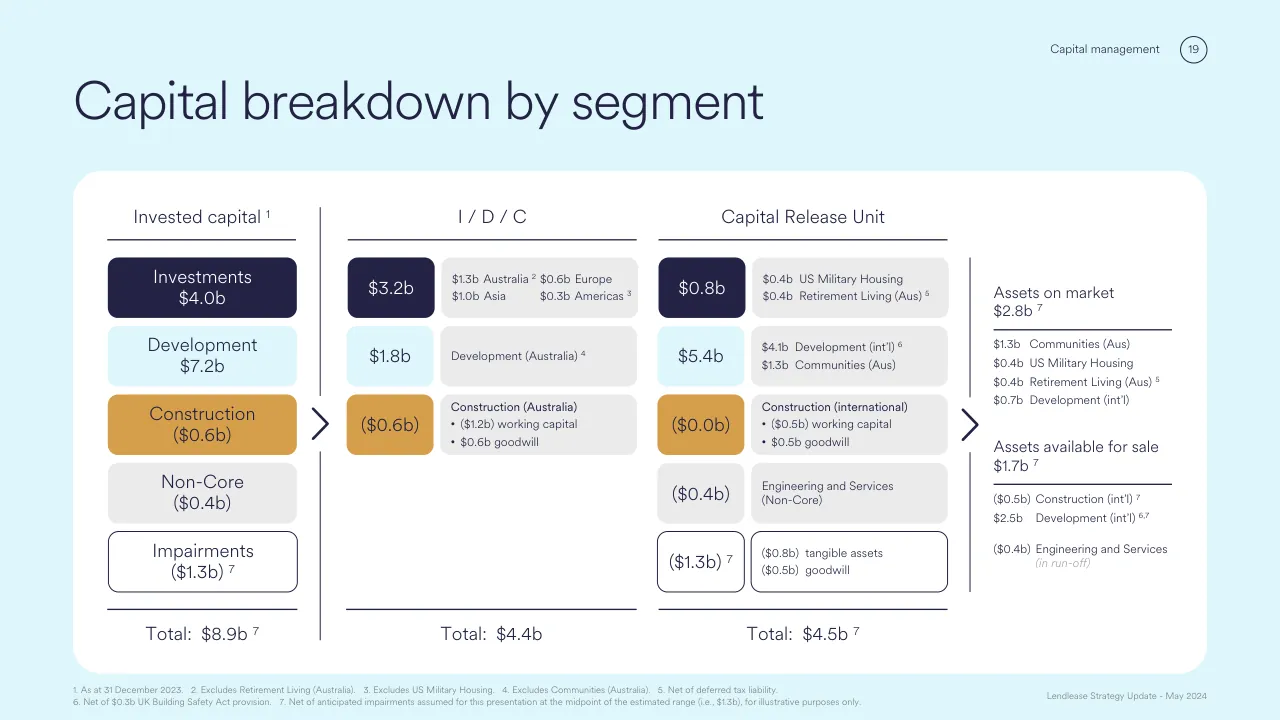
The deck opens with a title slide and an acknowledgement of country, then moves into a chairman's introduction and a statement of why the strategy update is needed: slow overseas construction earnings, long-dated overseas development projects, and the aim to recycle capital. Its core sections follow in order: a delivery section on simplifying the business and cutting costs, a focused structure with segment roles, an Australia growth section with pipeline and capability data, a financials section with historical pro-forma tables, a capital management section covering the capital release unit, allocation framework and buy-back, and a segment summaries appendix with supporting data. It closes with a summary slide, the analyst Q&A marker, and a disclaimer. Slides worth studying include the strategy-at-a-glance metrics slide (slide 12), which pairs each segment with its key figures in one layout, the capital allocation hierarchy (slide 23), which shows a ranked flow of capital priorities as a diagram, and the Capital Release Unit breakdown (slide 22), which splits invested capital by segment and region. The deck uses headline-style titles and mostly keeps one idea per slide.
Slides worth studying
Questions about this deck
How many slides does the Lendlease strategy update deck from May 2024 have?
The deck has 47 pages. Slide 5 contains the acknowledgement of country, and slide 17 opens the financials section.
What does the Lendlease strategy update say about the Capital Release Unit?
Slide 10 states that the Capital Release Unit has $2.8b of capital release anticipated by the end of FY25. Slide 22 also breaks down the invested capital in the Capital Release Unit by segment and region.
What cost savings does the Lendlease strategy update set out?
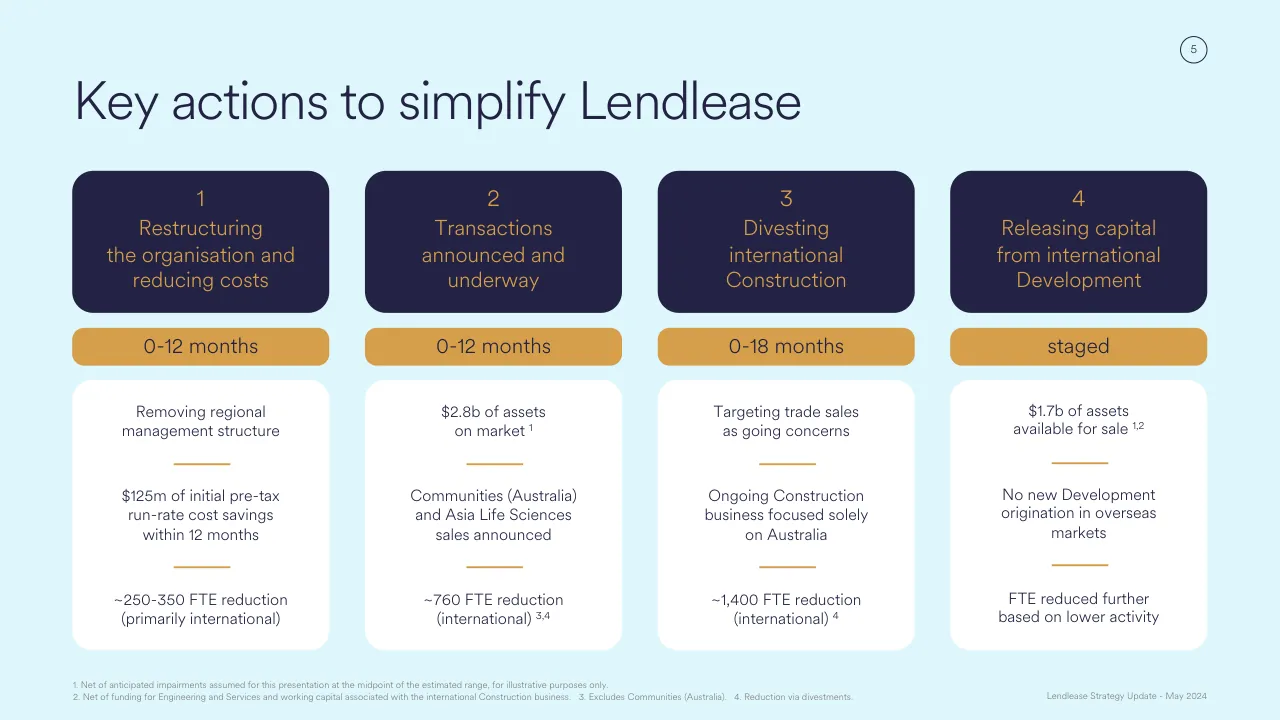
Slide 8 lists $125m of initial pre-tax run-rate cost savings within 12 months, along with a removal of the regional management structure. Slide 19 splits the further run-rate savings into $65m of employee costs and $60m of IT and other costs.
What is the Lendlease capital allocation framework in the strategy update?
Slide 23 says released capital will be reallocated based on a transparent hierarchy for capital deployment. Excess cash flow goes first to debt reduction, aiming for a gearing level of 5-15% by the end of FY26, followed by capital return and growth.
Details
- Company: Lendlease
- Year: 2024
- Type: Strategy presentation
- Industry: Real estate
- Pages: 47
Review score: 7 out of 10, Effective
Presentation quality, judged with the SlideDeck Co review heuristic. Ask, evidence and idea merit are not rated here.
The investor deck has a consistent identity: pale blue and navy palette, one light typeface, rounded white cards, and section dividers with a running header and page number. The content slides I read (12, 22, 23) are well organised, with clear column structure, strong figure hierarchy and a readable ranked-flow diagram on 23. The weaknesses are consequential: the deck opens with three pages of ASX announcement text (1-3) that read as a document, not a presentation, and several slides (22, 35, 44, 45) are dense and use very small type, with many footnotes and tables that cannot be read at a distance. Many divider pages (about 15 of 47) are empty, slide 24 is unlabelled, and some slides lack a headline statement of what to take away, so the reader has to find the point.
Worth keeping: Keep the consistent card layout, the figure-plus-label hierarchy of slide 12, the stepped flow of slide 23 with its brace annotations, and the segment colour coding that carries through slides 22 and 24.
Most useful repair: Move the three-page ASX text to a separate document or cut it from the presentation, and break up slides 22, 35, 44 and 45 so the key numbers are legible rather than relying on tiny table and footnote text.
What would change the score: I would replace topic titles like 'Measuring our performance' and 'Capital breakdown by segment' with takeaway headlines, and cut or merge the empty divider slides.
Confidence medium. 47 of 47 pages inspected on contact sheets, 4 at readable size. Reviewed 2026-11-08. Model-assisted review (claude-sonnet-5-5).
Full text of the slides (47 slides)
Every slide's words and a description of its charts and images, so the deck can be searched and rebuilt. Also available as Markdown.
Slide 1
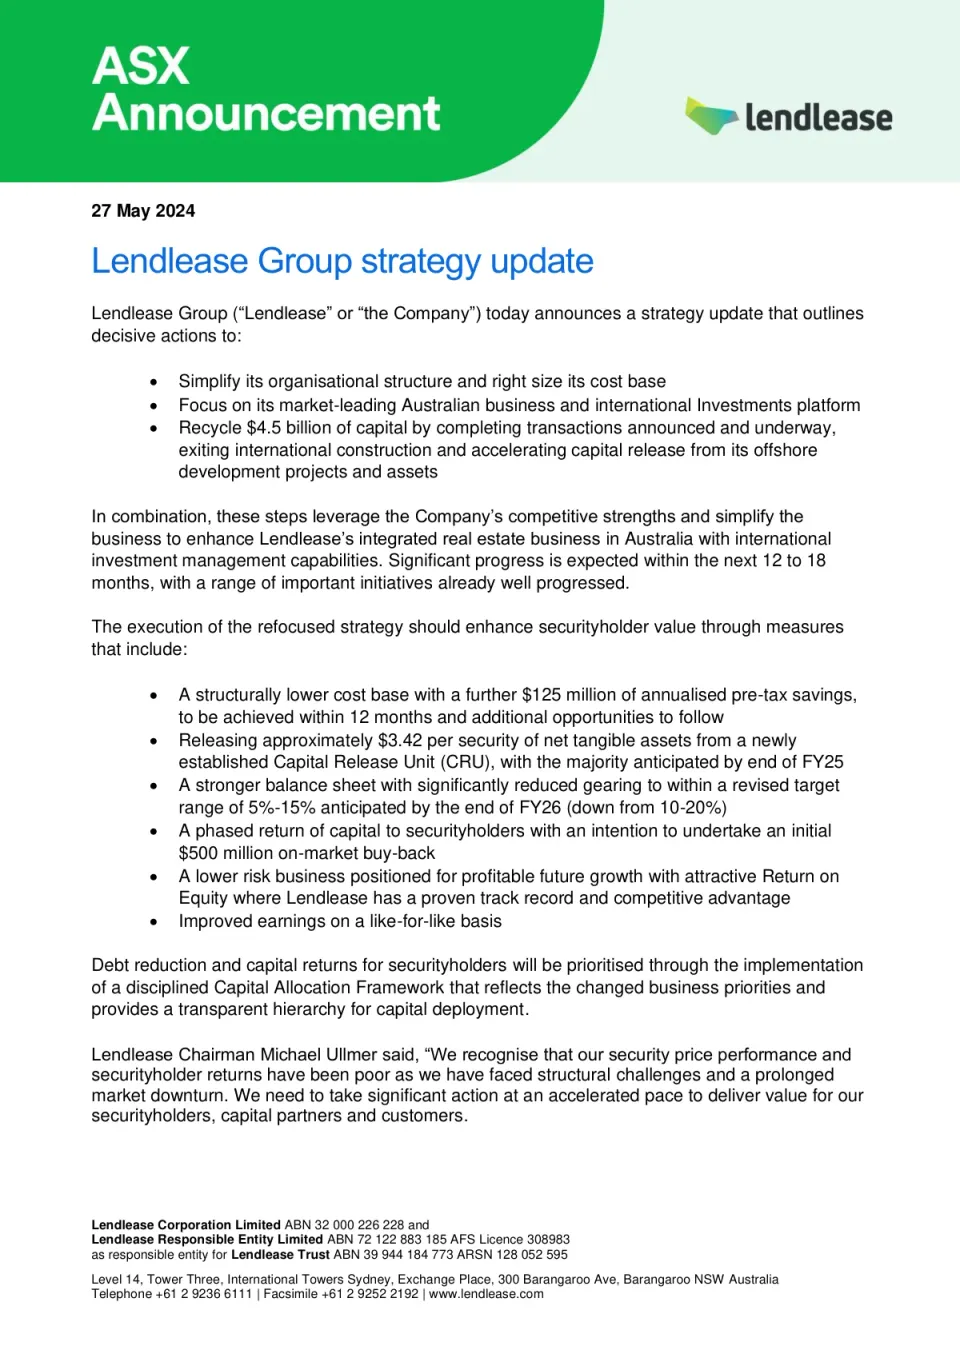
ASX Announcement
lendlease
27 May 2024
Lendlease Group strategy update
Lendlease Group (“Lendlease” or “the Company”) today announces a strategy update that outlines
decisive actions to:
• Simplify its organisational structure and right size its cost base
• Focus on its market-leading Australian business and international Investments platform
• Recycle $4.5 billion of capital by completing transactions announced and underway,
exiting international construction and accelerating capital release from its offshore
development projects and assets
In combination, these steps leverage the Company’s competitive strengths and simplify the
business to enhance Lendlease’s integrated real estate business in Australia with international
investment management capabilities. Significant progress is expected within the next 12 to 18
months, with a range of important initiatives already well progressed.
The execution of the refocused strategy should enhance securityholder value through measures
that include:
• A structurally lower cost base with a further $125 million of annualised pre-tax savings,
to be achieved within 12 months and additional opportunities to follow
• Releasing approximately $3.42 per security of net tangible assets from a newly
established Capital Release Unit (CRU), with the majority anticipated by end of FY25
• A stronger balance sheet with significantly reduced gearing to within a revised target
range of 5%-15% anticipated by the end of FY26 (down from 10-20%)
• A phased return of capital to securityholders with an intention to undertake an initial
$500 million on-market buy-back
• A lower risk business positioned for profitable future growth with attractive Return on
Equity where Lendlease has a proven track record and competitive advantage
• Improved earnings on a like-for-like basis
Debt reduction and capital returns for securityholders will be prioritised through the implementation
of a disciplined Capital Allocation Framework that reflects the changed business priorities and
provides a transparent hierarchy for capital deployment.
Lendlease Chairman Michael Ullmer said, “We recognise that our security price performance and
securityholder returns have been poor as we have faced structural challenges and a prolonged
market downturn. We need to take significant action at an accelerated pace to deliver value for our
securityholders, capital partners and customers.
Lendlease Corporation Limited ABN 32 000 226 228 and
Lendlease Responsible Entity Limited ABN 72 122 883 185 AFS Licence 308983
as responsible entity for Lendlease Trust ABN 39 944 184 773 ARSN 128 052 595
Level 14, Tower Three, International Towers Sydney, Exchange Place, 300 Barangaroo Ave, Barangaroo NSW Australia
Telephone +61 2 9236 6111 | Facsimile +61 2 9252 2192 | www.lendlease.com
Visuals: Header banner: a raster image 1654 by 314 pixels spanning the full slide width at the top, containing a bright green (#07B74A) field with a large quarter-circle curve sweeping down from the top right to the bottom centre, over a pale mint (#E4F5EC) right-hand area. Inside it, the white bold sans-serif text ASX Announcement is set in two lines at the left, and the Lendlease logo sits at the right: a multicoloured faceted mark (yellow-green, teal and blue) to the left of a dark charcoal (#2B2B2B) lowercase wordmark lendlease. No photographs, charts or tables. Bullets are solid round dots.
Slide 2
“Today we have announced the blueprint to position Lendlease for success – focussing on our
core strengths and competitive advantages.
“We have thought very carefully about the necessary strategic refocus and made some tough
decisions. I am confident that we have the right team and commitment to realise the value for our
securityholders that is inherent in our business. And I am determined to dedicate my final months
with this great company to ensure momentum builds toward the exciting future that lies ahead.”
Lendlease Group Chief Executive Officer and Managing Director, Tony Lombardo said, “Through
the decisive actions announced today, a new Lendlease is emerging. One that is firmly anchored in
the very best of our proud legacy, but less complex, more focused and fit for purpose. This new
Lendlease will be more easily understood by our people and customers, and transparent and
predictable for securityholders.
“By reshaping the portfolio, concentrating on our core competencies in markets where we have
proven we have the right to play, and the competitive advantage to win, the financial and
operational risk profile will be lower, and we believe the quality of our earnings ultimately higher
and more sustainable.
“Importantly, we do not launch this strategy from a standing start. Significant work has already
been undertaken and we anticipate making further positive announcements in the near-term on our
progress. We are well advanced on several transactions, and we have clear plans of action to
implement the necessary change to reorient the organisation. We are confident in the strategy and
have conviction in how we will execute.
“The optimum path we have chosen is built upon the creation of lasting economic value. We will
not walk away from commitments to our valued customers, and we will treat our people around the
world with the care and respect they deserve as our business changes.
“There is no question that the Australian business of Lendlease is market leading and unique in the
breadth and strength of its integrated capability and services. Moreover, the opportunities to grow
remain significant with a robust project pipeline that plays to our core competitive strengths,
especially in urban regeneration. We are exceptionally well placed to benefit from the key structural
shifts underway in the economy.
“We have retained our Investments platform in international markets for several compelling
reasons. Lendlease has deep relationships with major capital partners, and this presents an
appealing long-term growth vector through continuing to build our Funds Under Management. We
will leverage our scale and improve performance through active portfolio management, reducing
our co-ownership interests over time, and right sizing our cost base through removal of regional
cost structures that have weighed on performance.
“The establishment of the Capital Release Unit (CRU) is central to our new strategy. The CRU will
facilitate the recycling of $4.5 billion in capital of which $2.8 billion is anticipated by the end of
FY25. Our priority will be to pay down debt and efficiently return capital to securityholders. This is a
profound change. And is based upon making some very tough but necessary decisions.”
Lendlease Corporation Limited, ABN 32 000 226 228
Level 14, Tower Three, International Towers Sydney,
Exchange Place, 300 Barangaroo Ave, Barangaroo NSW
www.lendlease.com
Slide 3
The Strategy includes decisions which give rise to various impairments and charges. It is
anticipated these will be in the order of $1.150 - $1.475 billion pre-tax in FY24 and are not
anticipated to be recorded within core Operating Profit After Tax (OPAT). These impairments and
charges include a write down of goodwill attached to the US and UK construction businesses,
which arose as a consequence of the Bovis acquisition in 1999, impairments of certain overseas
development projects, where their intended use has changed, and other charges related to
redundancy and other break costs.
Lendlease maintains its FY24 guidance of 7 per cent return on Group equity, equating to
approximately $450m of OPAT. FY24 Group gearing is expected to be modestly above the mid-
point of the 10-20% target range. This guidance on both earnings and gearing is before the
anticipated provision for impairments and charges at FY24 and is subject to the completion of
transactions, including the announced sale of 12 Communities projects and the sale of our Asia
Life Sciences interests into a joint venture with Warburg Pincus, both of which remain subject to
conditions precedent.
ENDS
FOR FURTHER INFORMATION, PLEASE CONTACT:
Investors:
Michael Vercoe
Head of Investor Relations
Mob: +61 488 245 205
Media:
Stephen Ellaway
Executive General Manager, Corporate Affairs
Mob: +61 417 851 287
Authorised for lodgement by the Lendlease Group Disclosure Committee
Lendlease Corporation Limited, ABN 32 000 226 228
Level 14, Tower Three, International Towers Sydney,
Exchange Place, 300 Barangaroo Ave, Barangaroo NSW
www.lendlease.com
Slide 4
Strategy
Update
May 2024
lendlease
Gurrowa Place, Melbourne (artist’s impression)
Visuals: Photograph: an artist's impression (rendering) of a dense mixed-use urban precinct seen from an elevated viewpoint. Several tall towers stand behind a public park: a pale glass tower with a green-roofed terrace on the left, a slim dark glass tower in the centre-left, a tall light-coloured residential tower with a warm brick-red lower podium, and a bronze-glass tower on the right. Low heritage-style terrace buildings with shaded awnings line the park edge. In the foreground, a grid of mature eucalyptus-style trees, lawns, and curved paths is populated by small figures. A sports court with a pink surface sits at the right edge. A faded, semi-transparent overlay of a building and a site hoarding appears in the lower left, ghosting the existing structures. Lighting is soft daylight under a pale blue sky with thin cirrus streaks; the lighting is warm on the bronze and brick facades. Dominant colours: sky blue #8DB7D9, glass grey #A9B3BA, warm bronze #B99B6B, brick red #A65A3A, park green #5E8B4A. The image is full-height within its rounded box, not cropped beyond its corners, and is boxed with rounded corners rather than full-bleed. Its lower-left corner carries a white caption. A white rounded-corner logo sits on the navy panel: a white folded-paper shape with the word lendlease in navy bold sans-serif.
Slide 5
Acknowledgement of country / As an investor, developer, builder and manager of assets on land across Australia, we pay our respects to the Traditional Owners, especially their Elders, past and present, and value their custodianship of these lands. / 2
Visuals: A decorative pattern of white dots arranged in concentric rings, centred on the left edge around the title area and cropped by the left, bottom and top edges of the slide. The dots are solid white circles of varying sizes, with the outer rings larger and the inner rings smaller, giving a ripple effect. No photograph, chart, logos or icons. The rings sit behind the title text. The page number is enclosed in a thin dark navy circle outline with no fill.
Slide 6
Chairman’s introduction
3
Visuals: Non-text elements: one thin rounded-rectangle outline frame (hairline, dark navy #242444) inset about 1.5% from the slide edges with a large corner radius of roughly 4% of slide width, and one thin circular outline around the page number '3' in the top-right corner. No photographs, charts, logos or icons.
Slide 7
Impetus for strategy update / 14.9% / avg. ROE, FY19-23 1 / Clear competitive / advantage and / long track record of / strong performance / in Australia / >80% / of overseas Development / projects expected to complete / during or after FY30 2 / Overweight long-dated / development projects / overseas, impacting / securityholder returns / 0.6% / avg. EBITDA margin for / overseas Construction, / FY19-23 / Low overseas / construction / earnings / Simplifying the business to / drive efficiency and remove / further costs / Expediting capital / recycling to reduce / gearing, return capital / to securityholders and / redeploy for growth / 4 / 1. Australia only. Excludes Communities, Retirement Living, Engineering and Services. Calculated as statutory profit after tax divided by average equity. 2. Based on total project end value. / Lendlease Strategy Update - May 2024
Visuals: 1) Dotted map of Australia: a photo-free pixel/dot-matrix illustration of the Australian continent, rendered as a grid of small square dots in pale gold (about #E3C88F) on the white card, placed at x 11.5%, y 28.4%, 17.1% by 27.8% (343 by 313 px); no outline, no crop, sits behind the '14.9%' figure and its caption, which overlap the dots. 2) Large numeral '>80%' with a short gold horizontal bar beneath it (about #D9A441, about 1.0% of slide height thick, centred, about 12.5% of slide width long) with caption below. 3) Thin vertical navy rule at x about 50% from y about 16% to 50%, and vertical navy rules at x about 37.4% and 62.6% spanning the bottom row (about y 62% to 89%); one full-width navy horizontal rule at y about 58.7% from x 8.9% to 91.1%, all about 0.1% thick. 4) Filled light-grey circle (#EBEBEB) with stat '0.6%' and caption inside it. 5) Org-chart icon in gold outline (#D9A441, stroke about 0.4% of height): one top rectangle connected by a vertical line and horizontal bus to three lower rectangles, centred above the 'Simplifying' text. 6) Recycling icon: three navy (#242444) chevron-arrow loops forming a triangle of arrows, stroke about 0.35% of height, on a rounded light-grey (#EBEBEB) square tile with corner radius about 2% of slide width, no shadow. 7) Small outlined navy circle around the page number '4' at top-right.
Slide 8
Key actions to simplify Lendlease
5
1
Restructuring the organisation and reducing costs
2
Transactions announced and underway
3
Divesting international Construction
4
Releasing capital from international Development
0-12 months
0-12 months
0-18 months
staged
Removing regional management structure
$2.8b of assets on market 1
Targeting trade sales as going concerns
$1.7b of assets available for sale 1,2
$125m of initial pre-tax run-rate cost savings within 12 months
Communities (Australia) and Asia Life Sciences sales announced
Ongoing Construction business focused solely on Australia
No new Development origination in overseas markets
~250-350 FTE reduction (primarily international)
~760 FTE reduction (international) 3,4
~1,400 FTE reduction (international) 4
FTE reduced further based on lower activity
1. Net of anticipated impairments assumed for this presentation at the midpoint of the estimated range, for illustrative purposes only.
2. Net of funding for Engineering and Services and working capital associated with the international Construction business. 3. Excludes Communities (Australia). 4. Reduction via divestments.
Lendlease Strategy Update - May 2024
Visuals: None photographic. Four navy (#242444) rounded rectangles act as numbered header cards; each shows a gold numeral above a gold label. Below each sits a gold (#D7A04B) pill with a navy timing label. Below that, four white (#FFFFFF) rounded cards hold text and three short gold horizontal rules per card (about 4.6% of slide width, thin, dividing the three text groups). A small outlined circle with a navy outline and the numeral 5 sits at top-right. No charts, photographs, logos or icons.
Slide 9
Delivering / our strategy / 6
Slide 10
Delivering our strategy
7
Focused, simplified structure
Investments
Development
Construction
Capital Release Unit
International investment management capability
Australia only 1
Australia only
$2.8b of capital release anticipated by the end of FY25 2
Segment CEOs
Focused on segment performance
P&L accountability
CRU Senior Leadership
Focused on divesting assets and businesses to accelerate capital release
1. Capital Release Unit will continue to develop select projects with existing capital commitments in the short-to-mid-term prior to sale.
2. Net of anticipated impairments assumed for this presentation at the midpoint of the estimated range, for illustrative purposes only.
Lendlease Strategy Update - May 2024
Visuals: Four line icons in gold or navy, one above each card title. (1) Investments: a gold line-art chart icon, an L-shaped axis with a zigzag rising line ending in an arrowhead, about 14% to 17% across and 34% to 39% down. (2) Development: a gold line-art office building icon, a rectangular tower with a rounded top, a small antenna and a grid of window squares, about 36% to 39% across and 33% to 39% down. (3) Construction: a gold line-art hard hat icon, a dome with a brim and a centre seam, about 58% to 62% across and 34% to 39% down. (4) Capital Release Unit: a navy line-art recycling icon of three looping arrows forming a triangle, about 83% to 86% across and 33% to 39% down. Below the cards are two navy chevron (down-arrow) icons with horizontal rules: the left chevron at about 36% to 40% across and 64% to 67% down, with a long rule running from 6% to 35% and from 40% to 70% at about 65% down; the right chevron at about 83% to 86% across, 64% to 67% down, with short rules at about 75% to 82% and 87% to 94%. Short gold horizontal rules sit under each card title and under the two lower headings. No photographs or charts.
Slide 11
Delivering our strategy
8
Strategic focus areas
Investments
Development
Construction
Capital Release Unit
Focus on performance, earnings and profitability
Expand development pipeline in Australia
Maintain efficiency and risk management
Unlock value for securityholders
Strengthen existing and add new capital partnerships
Increase capital partnering and focus on productivity and returns
Delivery capability for integrated model in Australia
Capital release from overseas developments and other businesses
Expand beyond traditional Develop-to-Core product offerings
Greater focus on capital partner preferences in product origination
Partner of choice for governments and other key clients
$2.8b of capital release anticipated by the end of FY25
Lendlease Strategy Update - May 2024
Visuals: Visual elements: eight short gold horizontal rules, two per column, one between each pair of text groups in the cards. Each rule is about 4.6% of slide width (about 90 px at 2000 px wide), about 2 px thick, colour #D7A04B, centred horizontally in its card, at about y 54% (upper rule) and about y 71% (lower rule). Also a single outlined circle containing the page number 8, at the top right. No photographs, charts, tables, logos or icons.
Slide 12
Delivering our strategy / 9 / Measuring our performance / Investments / Development / Construction / Capital Release Unit / $3.2b / invested capital, HY24 / $1.8b / invested capital, HY24 / $(0.6)b / invested capital, HY24 / $3.42 / NTA per security, HY24 9,10,11 / $50.4b / FUM, HY24 1,2 / $10.4b / work in progress, HY24 5,6,7 / $4.5b / backlog revenue, HY24 5,8 / $2.8b / assets on market, FY24-25 11 / $123m / base mgmt. revenue, HY24 2,3 / $2.9b / master planned or in conversion, HY24 5,6 / $3.4b / avg. revenue, FY19-23 5,8 / $1.7b / assets available for sale, FY25-28+ 11,12 / 41.2% / avg. EBITDA margin, FY19-23 2,3,4 / 18.2% / avg. ROIC, FY19-23 5,6 / 3.3% / avg. EBITDA margin, FY19-23 5,8 / Anticipated positive earnings contribution to the Group / 1. Includes previously reported FUM and AUM. 2. Excludes Military Housing and Retirement Living (Australia). 3. Excludes transaction and performance fees. 4. Management EBITDA margin. / 5. Australia only. 6. Excludes Communities (Australia). 7. Stated on 100% basis. Lendlease share of WIP equal to $5.1b. 8. Excludes Engineering and Services. 9. Net tangible assets per security. / 10. Invested capital per security. 11. Net of anticipated impairments assumed for this presentation at the midpoint of the estimated range (i.e., $1.3b), for illustrative purposes only. / 12. Net of funding for Engineering and Services and working capital associated with the international Construction business. / Lendlease Strategy Update - May 2024
Visuals: Four rounded-corner stat cards, each with a header tile and a white body, and each body holding four figures separated by short gold rules. Column 1 Investments: $3.2b invested capital, HY24; $50.4b FUM, HY24 (footnotes 1,2); $123m base mgmt. revenue, HY24 (2,3); 41.2% avg. EBITDA margin, FY19-23 (2,3,4). Column 2 Development: $1.8b invested capital, HY24; $10.4b work in progress, HY24 (5,6,7); $2.9b master planned or in conversion, HY24 (5,6); 18.2% avg. ROIC, FY19-23 (5,6). Column 3 Construction: $(0.6)b invested capital, HY24; $4.5b backlog revenue, HY24 (5,8); $3.4b avg. revenue, FY19-23 (5,8); 3.3% avg. EBITDA margin, FY19-23 (5,8). Column 4 Capital Release Unit: $3.42 NTA per security, HY24 (9,10,11); $2.8b assets on market, FY24-25 (11); $1.7b assets available for sale, FY25-28+ (11,12); closing statement Anticipated positive earnings contribution to the Group. Gold rules #D7A04B, about 4.5% of slide width, sit under each figure in every card at about 52.1%, 64.7% and 77.3% of slide height. No charts, photographs or icons.
Slide 13
Australia is our key growth focus
10
Slide 14
Caltex House, Sydney
Australia Square, Sydney
Sydney Opera House
MLC Centre, Sydney
The Regent of Sydney
Tullamarine Airport, Melbourne
Sydney Olympic Park
Aurora Place, Sydney
Sydney Airport
National Museum of Australia, Canberra
Deutsche Bank Place, Sydney
Darling Quarter, Sydney
Victoria Harbour, Melbourne
Gold Coast University Hospital
Adelaide Oval
Royal Children’s Hospital, Melbourne
Rod Laver Arena, Melbourne
Gold Coast Commonwealth Games
Darling Square, Sydney
Western Sydney Stadium
Our history
of excellence
in Australia
11
11
Lendlease Strategy Update - May 2024
Air Traffic Control
Melbourne Quarter
Sunshine Coast University Hospital
Barangaroo South, Sydney
Data Centres
Salesforce Tower, Sydney
Visuals: Photographic mosaic of 30 tiles in a 6 by 5 grid, all full-bleed and unframed, with no gaps between tiles. Tiles from left to right, top to bottom: row 1: Caltex House, Sydney (black and white aerial view of a rooftop sign reading CALTEX on a stepped building); Australia Square, Sydney (black and white view of a tall circular tower among high-rise blocks); Sydney Opera House (warm sepia-toned view of the sails across the harbour water); MLC Centre, Sydney (tall pale tower against a blue sky, viewed from below); The Regent of Sydney (gold-toned hotel facade with angled balconies, low sun); Tullamarine Airport, Melbourne (aerial view of a star-shaped terminal roof with radiating structures). Row 2: Sydney Olympic Park (aerial of a stadium with a white arched roof and surrounding sports grounds); Aurora Place, Sydney (blue-sky view of tall glass towers, partly hidden by the card); Sydney Airport (interior of a terminal with red seats and a red gate sign reading 44 and a flight display, partly hidden by the card); National Museum of Australia, Canberra (interior of a curved timber and steel canopy, partly hidden by the card). Row 3: Deutsche Bank Place, Sydney (dark blue glass tower with a rooftop sign reading Deutsche Bank, viewed from below); Darling Quarter, Sydney (public plaza with palm trees, a water play area and a glass-roofed building at dusk, partly hidden by the card); Victoria Harbour, Melbourne (marina with white yachts in the foreground and a modern dark-clad building at right, under a pale sky, partly hidden by the card); Gold Coast University Hospital (aerial of a campus of pale buildings with a green roof and road). Row 4: Adelaide Oval (exterior of a curved stadium with a green and blue roof at blue hour); Royal Children’s Hospital, Melbourne (atrium with a large colourful sculpture and people seated); Rod Laver Arena, Melbourne (aerial of a white stadium with a curved roof and a city skyline behind at dusk); Gold Coast Commonwealth Games (purple and magenta graphic with the text Gold Coast 2018 and SHARE THE DREAM over a rows-of-seats background); Darling Square, Sydney (circular bronze-toned building with a crowd at dusk); Western Sydney Stadium (interior of a stadium with a crowd and a green pitch under a roof). Row 5: Air Traffic Control (control tower against a blue sky with clouds, viewed from below); Melbourne Quarter (public square with trees, a glass canopy and people); Sunshine Coast University Hospital (interior atrium with timber ceiling and glass walls); Barangaroo South, Sydney (cluster of tall towers, one with a curved glass facade, and a harbour ferry in the foreground); Data Centres (interior of a grey-floored hall with rows of black server cabinets under lights); Salesforce Tower, Sydney (view up at a tall glass tower among other office towers at dusk). Lighting is mostly daylight, with warm sunlight on the Sydney and Melbourne buildings. Dominant colours: blue sky, grey-silver glass, warm sepia and gold, and a magenta-purple graphic tile. Each tile has a dark gradient scrim at its bottom edge under the caption, and the photographs are tinted only by the scrim.
Slide 15
Core competitive strengths
Australia
12
Integrated Business Model
Investments
Development
Construction
Proven Track Record
Market-leading Australian integrated real estate business
We leverage our integrated business model of Investments, Development and Construction to create and manage mixed-use precincts and civic and social infrastructure
Australia’s leading builder and developer of real estate
Results-focused partner of choice for governments, businesses, capital partners
One of Australia’s largest real estate investment management platforms
Market-leading sustainability track record and credentials
Lendlease Strategy Update - May 2024
Visuals: Donut diagram of three segments forming a ring around a white centre, with thin curved outline arcs on the left and right and curved labels along the outer edge. Segments: Investments in gold #D7A04A (left, about 90 degrees from top to lower-left), Development in navy #242343 (right, from top to lower-right), Construction in grey #999999 (bottom, between them, slightly narrower). Labels: 'Integrated Business Model' curved along the top-left outside edge, 'Proven Track Record' curved along the bottom outside edge, 'Investments' and 'Development' and 'Construction' set inside their segments and rotated to follow the ring. The chart has no numeric values, axes or legend. Four icon tiles, each a gold #D7A04A rounded square with a white thin-line icon: (1) a multi-storey office building with window grid; (2) two hands shaking; (3) a line chart with an upward trend arrow inside an L-shaped axis; (4) a seedling sprout with two leaves. No photographs.
Slide 16
Australian Development pipeline
Large and diverse domestic opportunity set
Australia
13
Existing secured pipeline of $13b and actively competing on $13b of new development projects from our current target market of $40b 1
End value 1
No. of projects by stage
Advanced 2
Early stage 3
Urban regeneration (mixed-use)
$25b
3
11
Residential
$8b
-
7
Commercial
$7b
3
1
$40b
$13b
$27b
Leveraging our
core capabilities:
Large scale urban regeneration
•
Landmark developments, including Barangaroo and Darling Square precincts
Residential for sale, residential for rent
•
Leader in luxury residential; established build-to-rent capabilities and pipeline
Trusted partner for governments with an ability to unlock new opportunities
•
Strong policy support for new housing initiatives across Australia
Over-station development expertise
•
Strong pipeline and opportunity set across Sydney and Melbourne metro areas
1. Total estimated end value. Projects from FY24+. 2. Exclusive stage or “one of two.” 3. MOU, off-market, EOI, RFP, pre-market.
Lendlease Strategy Update - May 2024
Visuals: One table, no photographs, logos or charts. Table columns: unlabelled row-label column; End value (with footnote 1); No. of projects by stage, spanning two sub-columns Advanced (footnote 2) and Early stage (footnote 3). Rows: Urban regeneration (mixed-use) with End value $25b, Advanced 3, Early stage 11; Residential with End value $8b, Advanced -, Early stage 7; Commercial with End value $7b, Advanced 3, Early stage 1; total row with $40b (End value), $13b (Advanced), $27b (Early stage). The End value cells for the three category rows are light blue (#DEF6FC) boxes; the End value and No. of projects header cells are grey (#EBEBEB) rounded boxes; the total row cells are solid navy (#242444) boxes with white text. A dark navy horizontal rule sits under the column headers and under the total row, with thin grey rules between category rows. A vertical navy divider line separates the table panel from the right text panel. The circled page number is a thin navy outline ring around 13.
Slide 17
Financials / 14
Slide 18
Pro-forma financials
Financials
15
Group target 1
(post-simplification)
I / D / C
Capital Release Unit
Group
$589m
avg. EBITDA, FY19-23 2,5
$58m
avg. EBITDA, FY19-23 2,5
$647m
avg. EBITDA, FY19-23 2,5
9%
50%
19%
32%
35%
17%
EBITDA 2,5
15%
46%
42%
35%
Group ROE 4,5,7 sustainably above cost of equity
$m, FY19-23 avg:
Investments
Development
Construction
CRU
Operating PAT 3,5,6 | 312 | (156) | 156
Operating ROE 4,5,6 | 11.8% | (3.7%) | 2.3%
Group ROE 4,5,7 | 10.0% | (6.1%) | 0.2%
1. Through-the-cycle target. 2. Segment EBITDA only. Includes Engineering and Services (Non-Core). Excludes corporate costs. 3. Operating profit after tax. Includes corporate and treasury costs.
4. Return on Equity. Calculated as profit after tax divided by average equity. 5. Excludes investment property revaluations in the Investments segment. 6. Excludes other exceptional items. 7. Includes other exceptional items.
Lendlease Strategy Update - May 2024
Visuals: Four donut charts and one table and one legend. Chart 1, I / D / C: donut, centre label $589m avg. EBITDA, FY19-23 (segment EBITDA, superscript 2,5); segments Investments 35% (#242444, upper right), Development 46% (#DEF6FC, lower left and bottom), Construction 19% (#D7A04B, upper left); no axes, no units beyond percent and $m. Chart 2, Capital Release Unit: donut centre label $58m avg. EBITDA, FY19-23 2,5; a single full ring in CRU grey #EBEBEB labelled 100% in the file but the label is #EBEBEB on #EBEBEB and not legible on the slide. Chart 3, Group: donut centre label $647m avg. EBITDA, FY19-23 2,5; segments Investments 32% (#242444, upper right), Development 42% (#DEF6FC, bottom), Construction 17% (#D7A04B, left), CRU 9% (#EBEBEB, top, small wedge). Chart 4, Group target (post-simplification) 1: donut with centre label EBITDA 2,5; segments Investments 50% (#242444, top half), Development 35% (#DEF6FC, bottom right), Construction 15% (#D7A04B, lower left); no separate legend, same colour key as legend. Legend (left of chart 1 at about x 8.3%, y 52.7 to 63.1%): four square swatches, each about 0.9% wide and 1.6% high, with labels Investments (#242444), Development (#DEF6FC), Construction (#D7A04B), CRU (#EBEBEB). Table: heading '$m, FY19-23 avg:' above three columns (I / D / C, Capital Release Unit, Group; the column headers are the chart headings above) and three rows: Operating PAT 3,5,6 with 312, (156), 156; Operating ROE 4,5,6 with 11.8%, (3.7%), 2.3%; Group ROE 4,5,7 with 10.0%, (6.1%), 0.2%. Negative figures are in parentheses. Highlighted: the Group ROE row is the bottom row with a heavy rule above it. Callout: grey rounded box reading Group ROE 4,5,7 sustainably above cost of equity.
Slide 19
Significant cost reductions
Financials
16
Employee overhead expense, $m 1
Substantial savings have been realised since FY21
$125m p.a. of further run-rate pre-tax savings associated with the initial restructuring are anticipated to be realised within 12 months:
- $65m of employee costs
- $60m of IT and other costs
Further savings are also anticipated to be achieved as projects and businesses are wound down over time
592
508
384
FY21
FY22
FY23
Employee costs net of project and asset recoveries
Note 7. Other Expenses 2
FY23
Total Employee Benefit Expense
1,878
Less: Recoveries through projects
(1,570)
Superannuation accumulation plan expense
85
Net defined benefit plans expense
(9)
Total
384
1. Total combined employee overhead expense across IDC, CRU and Corporate. 2. Refers to Section A, Note 7 in Notes to Consolidated Financial Statements within the Lendlease Annual Report 2023.
Lendlease Strategy Update - May 2024
Visuals: Bar chart titled 'Employee overhead expense, $m' with superscript footnote marker 1, with a thin dark rule beneath the title. Vertical axis not shown; no axis tick labels. Horizontal category axis with categories FY21, FY22, FY23. One series, labelled 'Employee costs net of project and asset recoveries', shown as solid dark navy bars with values printed above each bar: FY21 = 592, FY22 = 508, FY23 = 384 (no estimates; values are printed). Bars are drawn to scale against a heavy navy baseline; bar heights are proportional to the values. No highlighted points. Legend below the chart: a small navy square followed by the series name. A right-pointing chevron sits between the chart and table, connected by two thin vertical navy lines that span the chart height. Table 'Note 7. Other Expenses' with superscript 2 as header, columns labelled (blank) and FY23. Rows: Total Employee Benefit Expense 1,878; Less: Recoveries through projects (1,570); Superannuation accumulation plan expense 85; Net defined benefit plans expense (9); Total 384 (Total row in regular weight). Header is underlined with a heavy navy rule; rows separated by thin grey rules.
Slide 20
Financial impacts to accelerate our strategy / Financials / 17 / Impairments and charges are required / to accelerate the release of capital / Estimated range (before tax) / Overseas development project impairments / $450m / $550m / Redundancy, tenancy and other break costs / $75m / $150m / Construction goodwill, deferred tax assets, / and other costs 1 / $625m / $775m / Impairments of overseas developments relate to projects with substantial office and/or residential condominium exposure where there has been a material change in development strategy / The decision to divest international construction operations will result in the impairment of related goodwill and deferred tax assets / These decisions will also result in redundancy, tenancy and other break costs / Anticipated impairments and charges will be assessed at 30 June 2024 and are expected to: / – increase FY24 gearing by 0.6-0.7% 2 / – decrease net tangible assets per security by 80-118 cents 2 / 1. Includes a portion of goodwill and deferred tax assets related to overseas development projects. 2 Based on anticipated average securityholders’ equity at the end of FY24. / Lendlease Strategy Update - May 2024
Visuals: A table with a heading row and three data rows, plus a vertical divider rule and a set of circled/outlined marks. Table: columns are an unlabelled row-label column (left, about 8.3% to 38% of slide width), then a column headed Estimated range (before tax) with two value columns. The header cell over the value columns is a light grey #EBEBEB fill spanning about 38.6% to 58.7% width, 47.2% to 55.6% height. Rows: (1) Overseas development project impairments: $450m and $550m; (2) Redundancy, tenancy and other break costs: $75m and $150m; (3) Construction goodwill, deferred tax assets, and other costs (footnote 1): $625m and $775m. Each value sits inside a rounded-corner light blue #DEF6FC cell about 9.2% wide and 8.4% high, with no border, on the white card. Horizontal rules: a dark #242444 line about 0.3% thick at about 44.6% height spanning the table width (about 8.3% to 61.6%); thin grey #7F7F7F-style hairlines, about 0.1% thick, under the header row and under each data row. A vertical dark #242444 divider line about 0.2% thick at about 61.3% x from about 28.8% to 88.9% of height. No photographs, logos or icons. Slide number 17 is shown inside a thin dark outlined circle (about 92.2% to 94.3% x, 5.0% to 8.8% y).
Slide 21
Capital management
Slide 22
Capital management
19
Capital breakdown by segment
Invested capital 1
I / D / C
Capital Release Unit
Investments
$4.0b
$3.2b
$1.3b Australia 2
$0.6b Europe
$1.0b Asia
$0.3b Americas 3
$0.8b
$0.4b US Military Housing
$0.4b Retirement Living (Aus) 5
Development
$7.2b
$1.8b
Development (Australia) 4
$5.4b
$4.1b Development (int'l) 6
$1.3b Communities (Aus)
Construction
($0.6b)
($0.6b)
Construction (Australia)
• ($1.2b) working capital
• $0.6b goodwill
($0.0b)
Construction (international)
• ($0.5b) working capital
• $0.5b goodwill
Non-Core
($0.4b)
($0.4b)
Engineering and Services (Non-Core)
Impairments
($1.3b) 7
($1.3b) 7
($0.8b) tangible assets
($0.5b) goodwill
Assets on market
$2.8b 7
$1.3b Communities (Aus)
$0.4b US Military Housing
$0.4b Retirement Living (Aus) 5
$0.7b Development (int'l)
Assets available for sale
$1.7b 7
($0.5b) Construction (int'l) 7
$2.5b Development (int'l) 6,7
($0.4b) Engineering and Services
(in run-off)
Total: $8.9b 7
Total: $4.4b
Total: $4.5b 7
1. As at 31 December 2023. 2. Excludes Retirement Living (Australia). 3. Excludes US Military Housing. 4. Excludes Communities (Australia). 5. Net of deferred tax liability.
6. Net of $0.3b UK Building Safety Act provision. 7. Net of anticipated impairments assumed for this presentation at the midpoint of the estimated range (i.e., $1.3b), for illustrative purposes only.
Lendlease Strategy Update - May 2024
Visuals: Diagram/flow of stacked tiles in three columns with chevron arrows: Column 1 'Invested capital' stacks Investments $4.0b (navy tile), Development $7.2b (light blue tile), Construction ($0.6b) (gold tile), Non-Core ($0.4b) (grey tile), Impairments ($1.3b) 7 (white outlined tile), totalling Total: $8.9b 7. A chevron points from column 1 to column 2. Column 2 'I / D / C' stacks $3.2b (navy tile) with grey detail box listing $1.3b Australia 2, $0.6b Europe, $1.0b Asia, $0.3b Americas 3; $1.8b (light blue tile) with grey box Development (Australia) 4; ($0.6b) (gold tile) with grey box Construction (Australia) with bullets ($1.2b) working capital and $0.6b goodwill; totalling Total: $4.4b. A chevron points from column 2 to column 3. Column 3 'Capital Release Unit' stacks $0.8b (navy tile) with grey box $0.4b US Military Housing and $0.4b Retirement Living (Aus) 5; $5.4b (light blue tile) with grey box $4.1b Development (int'l) 6 and $1.3b Communities (Aus); ($0.0b) (gold tile) with grey box Construction (international) with bullets ($0.5b) working capital and $0.5b goodwill; ($0.4b) (grey tile) with grey box Engineering and Services (Non-Core); ($1.3b) 7 (white outlined tile) with white outlined box ($0.8b) tangible assets and ($0.5b) goodwill; totalling Total: $4.5b 7. A right-hand side column shows Assets on market $2.8b 7 with rows $1.3b Communities (Aus), $0.4b US Military Housing, $0.4b Retirement Living (Aus) 5, $0.7b Development (int'l), and Assets available for sale $1.7b 7 with rows ($0.5b) Construction (int'l) 7, $2.5b Development (int'l) 6,7, and ($0.4b) Engineering and Services (in run-off). No photographs, logos or icons; all visuals are flat tiles, rules, dividers and chevrons. Nothing is cropped or overlaid.
Slide 23
Capital allocation framework
Capital management
20
Released capital will be
reallocated based on our
transparent hierarchy for
capital deployment:
Operating productivity
Capital productivity
Net operating cash flow
Maximise cash flow through
lower costs, productivity,
technology and culture
Strong balance sheet
30-50% distribution payout ratio 1
Distribution linked to
business performance
Excess cash flow
Debt reduction
To target gearing level (5-15%) by the end of FY26 2
Capital return
Security buy-backs, additional distributions
Growth
Subject to strict investment hurdles
Maximise securityholder value and returns
Sustainable returns
above cost of equity
1. Based on statutory profit after tax excluding investment property revaluations in the Investments segment and other exceptional items, as determined by the Board. 2. Consolidated gearing calculated as net debt divided by total tangible assets less cash.
Lendlease Strategy Update - May 2024
Visuals: Diagram (vertical flow with brackets). Top: two equal light grey (#EBEBEB) rounded rectangles side by side, labelled Operating productivity and Capital productivity. A thin navy (#242444) horizontal line with a centred downward chevron, labelled Net operating cash flow above it. Below, two stacked solid navy (#242444) rounded bars labelled Strong balance sheet and 30-50% distribution payout ratio with superscript 1. A right-facing navy arc bracket spans the top two boxes and points to a dot-ended connector leading to the text Maximise cash flow through lower costs, productivity, technology and culture. A second arc bracket spans the two navy bars and connects via a dot-ended line to the text Distribution linked to business performance. Below that a second thin line with a downward chevron labelled Excess cash flow. Bottom: a three-row grid; each row has a navy rounded label bar on the left (Debt reduction, Capital return, Growth) and a light grey (#EBEBEB) rounded rectangle on the right (To target gearing level (5-15%) by the end of FY26 with superscript 2; Security buy-backs, additional distributions; Subject to strict investment hurdles). A vertical gold (#D4A03C) rule runs alongside the bottom grid, beside the summary heading. No photographs, logos or icons.
Slide 24
Capital management
21
Capital allocation targets
Invested capital 1
Capital structure 1
Australia
International
Investments
Development
>75%
<25%
>60%
<40%
Consolidated gearing 2
5-15% 3
Credit rating
Investment grade
Distribution policy
30-50% payout ratio 4
Improved
financial position
Higher quality,
recurring income
Sustainable returns
above cost of equity
1. Through-the-cycle targets. 2. Consolidated gearing calculated as net debt divided by total tangible assets less cash. 3. Target gearing level anticipated to be reached by the end of FY26. 4. Based on statutory profit after tax excluding investment property revaluations in the Investments segment and other exceptional items, as determined by the Board.
Lendlease Strategy Update - May 2024
Visuals: Two donut charts, no axes, no chart title beyond the section headings. Left donut titled Invested capital (superscript 1), legend Australia (dark navy square) and International (light blue square); dark navy segment labelled >75% at top, light blue segment labelled <25% at bottom (about a quarter of the ring, roughly 7 to 5 o'clock). Right donut with legend Investments (dark navy square) and Development (light blue square); dark navy segment labelled >60% at top, light blue segment labelled <40% at bottom (about 40% of the ring). Donut ring thickness about one third of the outer radius, small white gaps between segments, inner hole white. Right panel Capital structure is a three-row table: row 1 Consolidated gearing 2 with value 5-15% 3; row 2 Credit rating with value Investment grade; row 3 Distribution policy with value 30-50% payout ratio 4. Values sit in light blue rounded cells; rows separated by thin grey rules. Below the table a full-width navy divider line broken in the centre by a downward chevron icon. Three dark navy rounded rectangles with white text: Improved financial position; Higher quality, recurring income; Sustainable returns above cost of equity. No photographs, logos or icons other than the chevron.
Slide 25
Capital management / 22 / Returning capital through buy-backs / Security buy-back program / Committed to prioritising near-term return of capital to securityholders and debt reduction over redeployment / Buy-back program guidelines / up to $500m / initial planned buy-back amount / up to 10% of outstanding securities / credit rating and covenant thresholds to be maintained / • Up to 10% of outstanding securities to be bought back, subject to the following: / – completion of the previously announced Communities transaction / – forecast gearing reaching target 5-15% level by the end of FY26, irrespective of security buy-backs / – maintaining existing credit ratings / – buy-backs being accretive to Earnings per Security (EPS) / • Disciplined capital allocation framework to be maintained and to leave ample room for debt reduction and future growth upon further capital release, particularly to expand the Development pipeline in Australia / Lendlease Strategy Update - May 2024
Visuals: None photographic. Three navy rounded rectangles (#242444) stacked vertically in the right column of the panel: top box shows 'up to $500m' with 'initial planned buy-back amount' beneath; middle box shows 'up to 10% of outstanding securities'; bottom box shows 'credit rating and covenant thresholds to be maintained'. One grey rounded rectangle (#EBEBEB) holds the bulleted guideline list. One horizontal rule (#242444, about 2px) spans from x 26.7% to about x 91.5% at about y 38.6%, beneath the 'Buy-back program guidelines' heading. One outlined circle (thin #242444 stroke) surrounds the page number 22 at top right.
Slide 26
Summary / 23
Visuals: None. The only non-text graphics are a thin white rounded-rectangle outline frame and a thin white circular outline badge around the page number '23'.
Slide 27
Enhancing securityholder value
24
Lower risk profile and lower cost base
$2.8b of capital release anticipated within next 12 months to:
–
Reduce gearing and strengthen balance sheet
–
Return capital to securityholders through buy-backs
–
Invest in future growth in proven segments with stringent return hurdles
$1.7b of anticipated further net capital release
Slide 28
25
Simplifying Lendlease to be…
Australia’s leading integrated real estate business / with a strong international investment management capability
Visuals: none. The only non-text marks are the thin white rounded-rectangle outline frame and the small outlined circle around the page number, which are described under elements.
Slide 29
Analyst Q&A / 26
Slide 30
Appendix / 27
Slide 31
Structural options
28
Slide 32
Structural options
29
Key structural options considered
Status quo
Internal restructuring and / accelerated capital release
Demerger
Description
• Simplifying the business through a / reallocation of capital to Australia / (40-60%) and Investments (50-70%)
• Internal separation of non-strategic / businesses and assets
• Separated business unit to focus / solely on maximising capital return
• Separate reporting with full / transparency on progress and KPIs
• Implementation of a structural / separation (e.g., Australia vs. / international)
• Delivers securityholders an / investment in two businesses with / different attributes and strategies
Key / considerations
• Currently delivering insufficient / returns on a risk-adjusted basis
• Limited securityholder appetite / for further investment into / underperforming markets and / segments
• Provides a clear pathway to / stabilisation and unlocking value / on a realistic timeline
• Balances trade-off between time / value of money and market timing
• Requires a capital injection
• Duplicates cost base
• Complex, costly and lengthy / implementation
Lendlease Strategy Update - May 2024
Visuals: None as images or charts. The slide is a table built from shapes and text: 4 columns by 3 rows. Columns: row-label column (no header), 'Status quo', 'Internal restructuring and accelerated capital release' (highlighted dark navy), 'Demerger'. Rows: 'Description' (bullets as listed in elements) and 'Key considerations' (bullets as listed in elements). Column header tiles are light grey #EBEBEB for Status quo and Demerger, and dark navy #242444 with white text for the middle column. The middle column's body cells are also dark navy with white text.
Slide 33
Segment summaries
Slide 34
Segment summaries / 31 / Investments / International capability with strong foundations in Australia and Asia / Global network of long-standing client relationships / Real estate skills to add value at the asset level / Trusted fiduciary with strong governance / >70 / capital partners / 10% / FUM CAGR, FY19-23 1,2 / $50.4b / FUM, HY24 1,2 / 62% / 24% / 9% / 5% / Australia / Asia / Americas / Europe / Historical performance (incl. international) 1 / ROIC / Average / 8.6% / 7.3% / 7.5% / 5.5% / 5.5% / 6.9% / FY19 / FY20 / FY21 / FY22 / FY23 / $123m / base management revenue, HY24 1,3 / 41.2% / avg. EBITDA margin, FY19-23 1,3,4 / 6.2% / co-investment % of FUM, HY24 1 / 3.1% / co-investment yield, HY24 1,5 / 1. Excludes US Military Housing and Retirement Living (Australia). 2. Includes previously reported FUM and AUM. 3. Excludes transaction and performance fees. / 4. Management EBITDA margin. 5. Co-investment distribution yield after deductions of interest, applicable taxes and fees. / Lendlease Strategy Update - May 2024
Visuals: Left KPI card: grey rounded tile reading '>70' over 'capital partners', a short navy divider line, then '10%' over 'FUM CAGR, FY19-23 1,2'. Donut chart: ring with centre label '$50.4b' over 'FUM, HY24 1,2'. Segments clockwise from top: Australia 62% (navy #242444, largest, right and bottom), Asia 24% (pale blue #DEF6FC, left), Americas 5% (gold #D7A04B, upper-left), Europe 9% (light grey #EBEBEB, top). Legend below the donut: navy square Australia, pale blue square Asia, gold square Americas, light grey square Europe. Bar chart titled 'Historical performance (incl. international) 1' with legend ROIC (navy square) and Average (gold square). Vertical navy bars with value labels above, no printed y-axis or range: FY19 7.3%, FY20 8.6%, FY21 5.5%, FY22 7.5%, FY23 5.5%; category labels FY19 to FY23 below a navy baseline. A horizontal gold line at about 6.9% spans FY19 to beyond FY23, labelled 6.9% in gold at its right end. Four grey KPI tiles below the bar chart: $123m base management revenue, HY24 1,3; 41.2% avg. EBITDA margin, FY19-23 1,3,4; 6.2% co-investment % of FUM, HY24 1; 3.1% co-investment yield, HY24 1,5. No photographs, logos or icons.
Slide 35
Segment summaries
32
Investments
Focused on improving profitability in Europe and the Americas
Strong returns have been achieved in established Australia and Asia platforms
• International operations are a substantial part of the business, contributing over 35% of FUM 1
• Changes in structure and segment leadership are anticipated to drive improved performance and increase scale in Europe and the Americas
• Growth initiatives will focus on tailoring and matching products to investor preferences, with potential minority co-investment positions in future products
$m FY19 FY20 FY21 FY22 FY23 HY24
Australia
FUM ($b) 1 25.5 25.2 28.7 32.3 31.8 31.4
Revenue 2,3 141 125 124 135 144 69
EBITDA 2,3 74 68 66 59 66 32
EBITDA margin 2,3 52.5% 54.4% 53.2% 43.7% 45.8% 46.0%
Asia
FUM ($b) 1 8.2 8.7 8.5 9.4 10.5 11.8
Revenue 2,3 62 123 63 78 82 41
EBITDA 2,3 34 97 41 51 39 20
EBITDA margin 2,3 54.8% 78.9% 65.1% 65.4% 47.6% 48.2%
Europe
FUM ($b) 1 1.9 1.8 2.1 1.9 4.6 4.6
Revenue 2,3 13 8 11 14 18 9
EBITDA 2,3 (7) (13) (16) (10) (3) (2)
Americas 4
FUM ($b) 1 0.7 1.0 1.7 2.0 2.5 2.6
Revenue 2,3 2 3 3 7 9 4
EBITDA 2,3 - 3 (1) 3 - (4)
1. Includes previously reported FUM and AUM. 2. Excludes co-investment distributions and transaction gains or losses. 3. Includes transaction and performance fees. 4. Excludes US Military Housing.
Lendlease Strategy Update - May 2024
Visuals: Table: columns are $m (row label), FY19, FY20, FY21, FY22, FY23, HY24. Row groups with grey #EBEBEB section header rows: Australia (FUM ($b) 1: 25.5, 25.2, 28.7, 32.3, 31.8, 31.4; Revenue 2,3: 141, 125, 124, 135, 144, 69; EBITDA 2,3: 74, 68, 66, 59, 66, 32; EBITDA margin 2,3: 52.5%, 54.4%, 53.2%, 43.7%, 45.8%, 46.0%); Asia (FUM ($b) 1: 8.2, 8.7, 8.5, 9.4, 10.5, 11.8; Revenue 2,3: 62, 123, 63, 78, 82, 41; EBITDA 2,3: 34, 97, 41, 51, 39, 20; EBITDA margin 2,3: 54.8%, 78.9%, 65.1%, 65.4%, 47.6%, 48.2%); Europe (FUM ($b) 1: 1.9, 1.8, 2.1, 1.9, 4.6, 4.6; Revenue 2,3: 13, 8, 11, 14, 18, 9; EBITDA 2,3: (7), (13), (16), (10), (3), (2)); Americas 4 (FUM ($b) 1: 0.7, 1.0, 1.7, 2.0, 2.5, 2.6; Revenue 2,3: 2, 3, 3, 7, 9, 4; EBITDA 2,3: -, 3, (1), 3, -, (4)). Negative values are in parentheses. Thin dark navy rule under the header row and light grey rules between rows; no chart. Page number 32 sits in a thin outlined circle. No photographs, logos or icons.
Slides 36 to 47 continue in the full text file.
Download this deck
The hosted PDF of every library deck is free for readers of the SlideDeck Co newsletter. Join with your email and the viewer and download appear here.
Preparing a strategy presentation of your own? The SlideDeck Co Consulting Deck is a slide library with a statement of work and a worked client case.