
The deck opens with a dark-humoured title, 'R.I.P. Good Times', and a 'Now What?' divider, then moves into a series of sections presented by different Sequoia partners. The first section, 'Wall Street: How Did We Get Here?', traces the housing-led recession, leverage, debt, and credit through charts of inflation, interest rates, household debt, home prices and derivatives. A second section, 'Main Street: Where Are We Now?', shows consumer spending, savings, debt service, falling advertising, retail, mobile and tech spending, with quotes from executives of EMC, Ingram Micro and SAP. A third section, 'Your Street: Where Do We Go From Here?', covers the venture financing environment, new fundraising and valuation realities, operating reviews and cost cuts, and a closing set of survival principles. The deck ends with 'Get Real or Go Home' and a Q&A slide. Slides are built around one chart or one idea each, with headline-style titles, while several sections lean on dense default-style charts and bulleted text.
Slides worth studying

Questions about this deck
How many slides does the Sequoia Capital deck have?
The deck has 56 pages, and it opens with the title 'R.I.P. Good Times' on slide 1 and closes with a Q&A slide near the end.
What does the Sequoia Capital deck say about U.S. consumer spending and GDP?
Slide 23 shows total U.S. GDP of 4.7, 8.3 and 13.8 ($ trillions) for 1987, 1997 and 2007, and consumer spending of 3.1, 5.8 and 10.1 for the same years.
What does the Sequoia Capital deck say about growth in derivatives?
Slide 16 charts the outstanding amount of open positions in OTC derivatives markets on a scale up to $525T, and notes that U.S. GDP was $13.8T in 2007.
What survival principles does the Sequoia Capital deck list?
Slide 46 lists preserve capital, grab share, must-have product, established revenue model, understanding of market uptake, customers' ability to pay, assessment vs. competitors, cash is king, and need for profitability.
Details
- Company: Sequoia Capital
- Year: 2008
- Type: Strategy presentation
- Industry: Venture capital
- Pages: 56
Review score: 7 out of 10, Effective
Presentation quality, judged with the SlideDeck Co review heuristic. Ask, evidence and idea merit are not rated here.
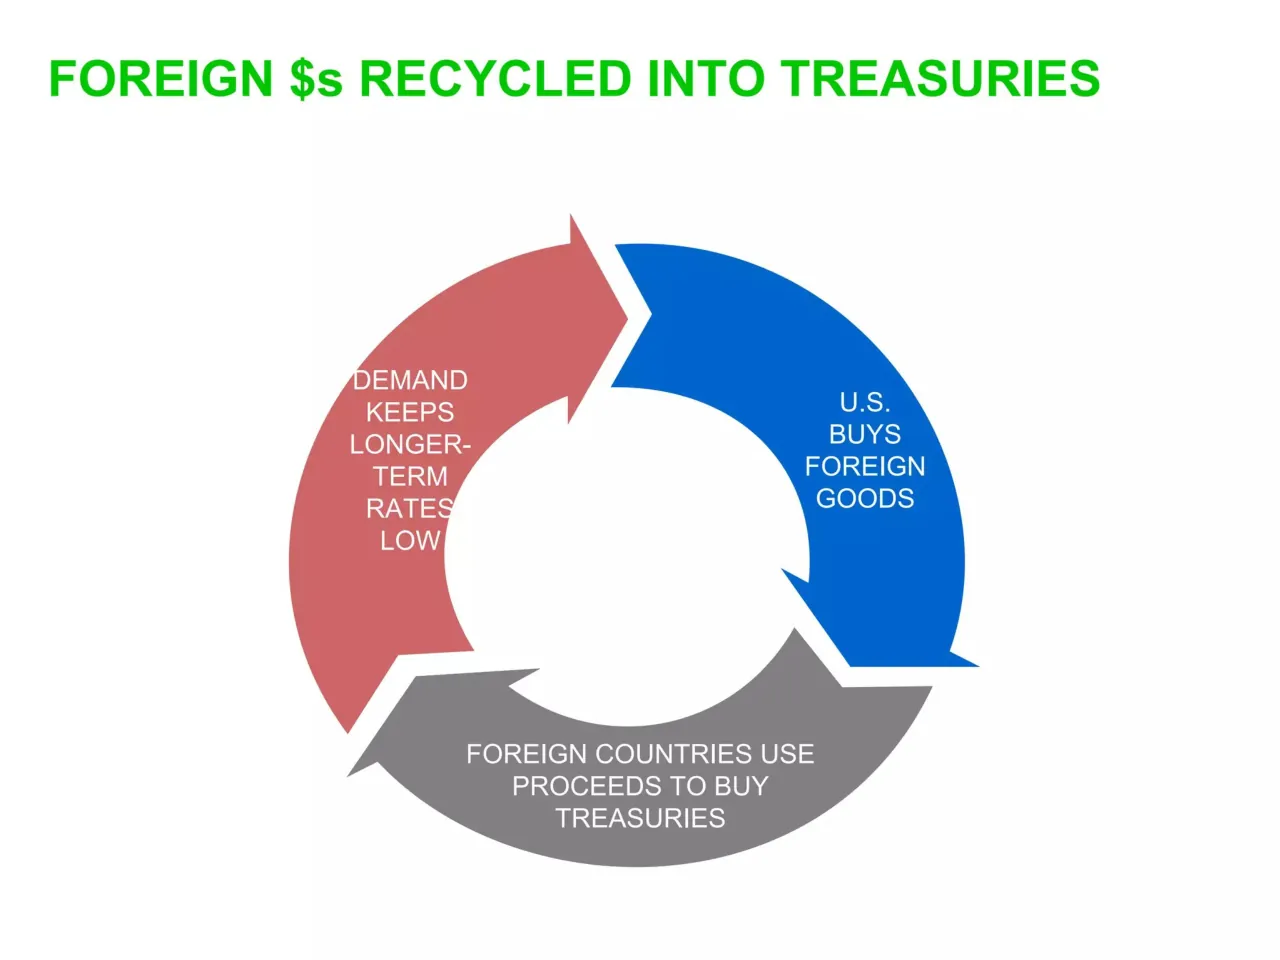
The deck has a clear three-part route (Wall Street, Main Street, Your Street) with dividers at slides 4, 22 and 39, and most pages carry one chart or one idea under a headline-style title, so the macro-to-startup argument is easy to follow and ends on a memorable close (slides 53 and 54). Execution is uneven: the slide 10 cycle diagram has labels spilling over the arrow edges, slide 1 is a low-resolution stock image with a novelty font, and the middle section (slides 25 to 31) uses dense third-party charts with tiny axis text and unlabelled legends. The Wall Street charts (slides 7 to 19) are plain but legible, while the green title style, divider rhythm and source lines give consistent identity throughout.
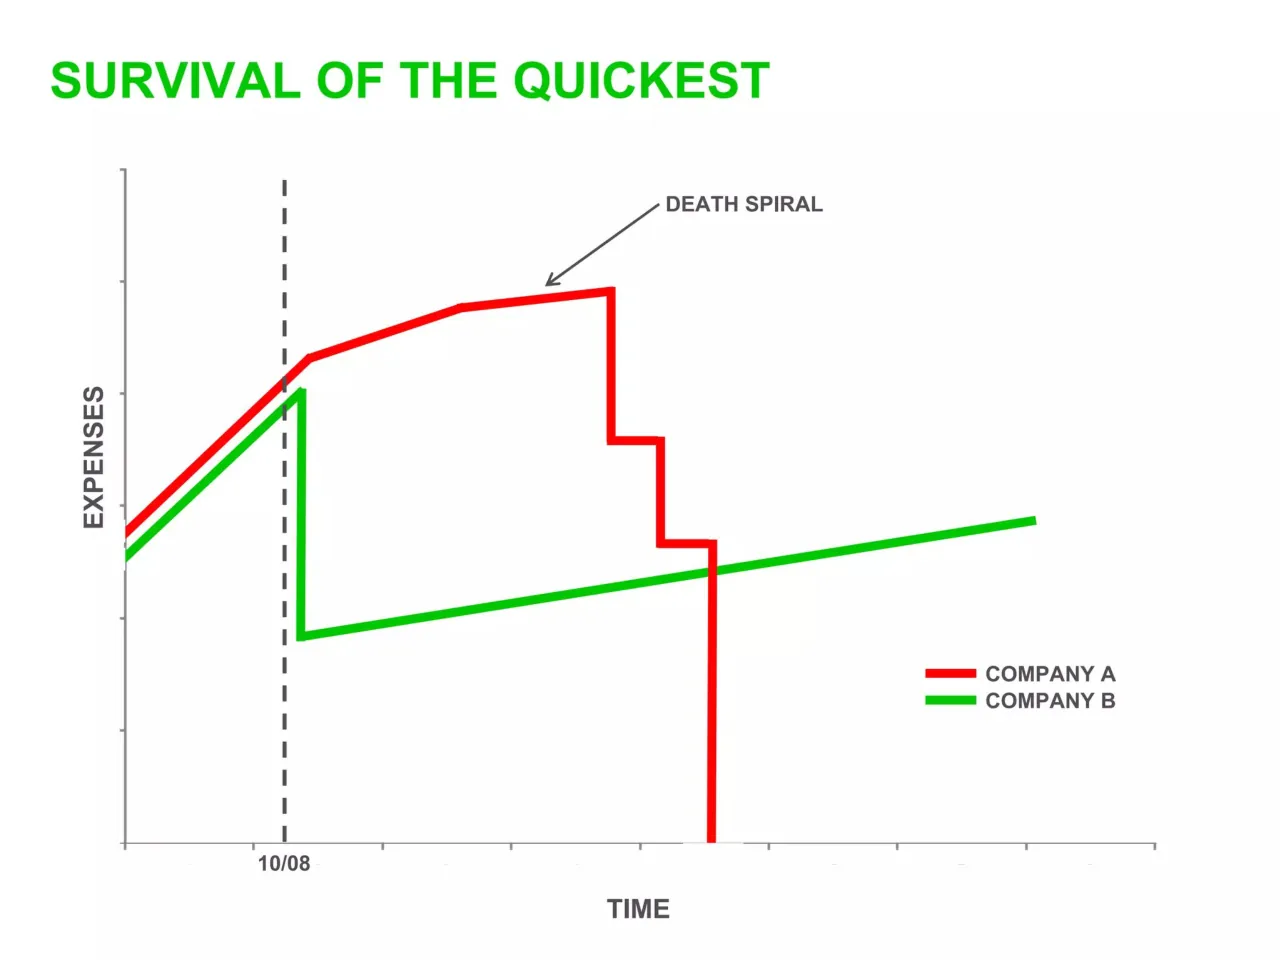
Worth keeping: Keep the three-section structure with green divider slides, the one-idea headline titles, and the closing sequence of survival checklist, death spiral, expense-curve chart (slide 49) and 'Get Real or Go Home'.
Most useful repair: Rebuild the slide 10 cycle so text sits inside the arrows, and simplify the multi-panel charts on slides 25, 28, 29 and 31 into one readable chart each with a stated takeaway.
What would change the score: I would replace the pixelated stock imagery on slides 1 and 3 and the random bartender photo on slide 56, and turn the plain grey text lists on slides 5, 15, 20 and 44 into something with more emphasis or visual support.
Confidence high. 56 of 56 pages inspected on contact sheets, 4 at readable size. Reviewed 2026-11-08. Model-assisted review (claude-sonnet-5-5).
Full text of the slides (56 slides)
Every slide's words and a description of its charts and images, so the deck can be searched and rebuilt. Also available as Markdown.
Slide 1
R.I.P. / GOOD / TIMES
Visuals: Photograph of a blue-toned stone gravestone in a night scene. The tombstone has an arched top with a carved skull face framed by carved feather or leaf shapes, and scroll-like carvings at the upper left and right shoulders. Its lower base is covered with dark green and reddish moss or shrubbery. The background is a dark blue, cloudy night sky with cyan light glowing behind the stone at the sides and low on the horizon. The image is cropped to the slide with a black strip about 4% wide on the left and about 1% on the right; it is not boxed. No overlay tint is visible beyond the natural blue cast of the photograph. Lighting is dramatic and frontal with a backlit glow around the stone.
Slide 2
NOW WHAT?
SEQUOIA CAPITAL
THE ENTREPRENEURS BEHIND THE ENTREPRENEURS
Visuals: Sequoia Capital logo lockup in the bottom-left white band: the wordmark 'SEQUOIA CAPITAL' in green letter-spaced sans-serif capitals with a green leaf/fern icon replacing the space between 'A' and 'C', a small registered mark after 'CAPITAL', and the grey tagline 'THE ENTREPRENEURS BEHIND THE ENTREPRENEURS' beneath it with a small registered mark. No photographs, charts or other illustrations.
Slide 3
Visuals: One photograph of a split pig carcass resting on a table. Subject: the pig's head and forequarter, lying on its side, with the cut face showing red muscle, white fat and pale ribs. A chef's knife with a dark handle is driven into the cut flesh near the centre-left, its blade angled up and out of the frame top. Snout and ear are at the lower-left and right of the carcass. A second cut piece of red meat sits on a white towel in the blurred upper-left background. A white cloth towel hangs over the table edge at left. A white plastic tub or bucket with a red handle is at the right edge. Composition: close, slightly low three-quarter angle, shallow depth of field with the foreground carcass sharp and the background blurred. Lighting: warm, low-key, tungsten-like with amber highlights. Dominant colours: flesh beige #D9B08C, meat red #C8453C, teal and pink tablecloth #7FBFB0 and #E8A49A, dark brown background #3A2A1E, white towel #F2F0EA. The photo is uncropped at the edges, full-bleed, with no overlay or tint.
Slide 4
WALL STREET
HOW DID WE GET HERE?
ERIC UPIN
SEQUOIA CAPITAL
THE ENTREPRENEURS BEHIND THE ENTREPRENEURS
Visuals: One logo: the Sequoia Capital logo, bottom-left on the white footer band. It consists of the wordmark 'SEQUOIA' and 'CAPITAL' in spaced bold capitals, separated by a stylised green leaf/fern icon, with the tagline 'THE ENTREPRENEURS BEHIND THE ENTREPRENEURS' below in spaced grey capitals, each with a small registered mark. No photographs, charts or other graphics.
Slide 5
MULTIPLE PROBLEMS
HOUSING LED RECESSION
OVER LEVERAGED FINANCIALS
FALLING ASSET PRICES
FROZEN CREDIT MARKETS
WEAK HOUSEHOLD BALANCE SHEET
GLOBALLY SYNCHRONIZED SLOWING EXACERBATING ALL OF ABOVE
FORCES OF INFLATION VERSUS FORCES OF DEFLATION
Slide 6
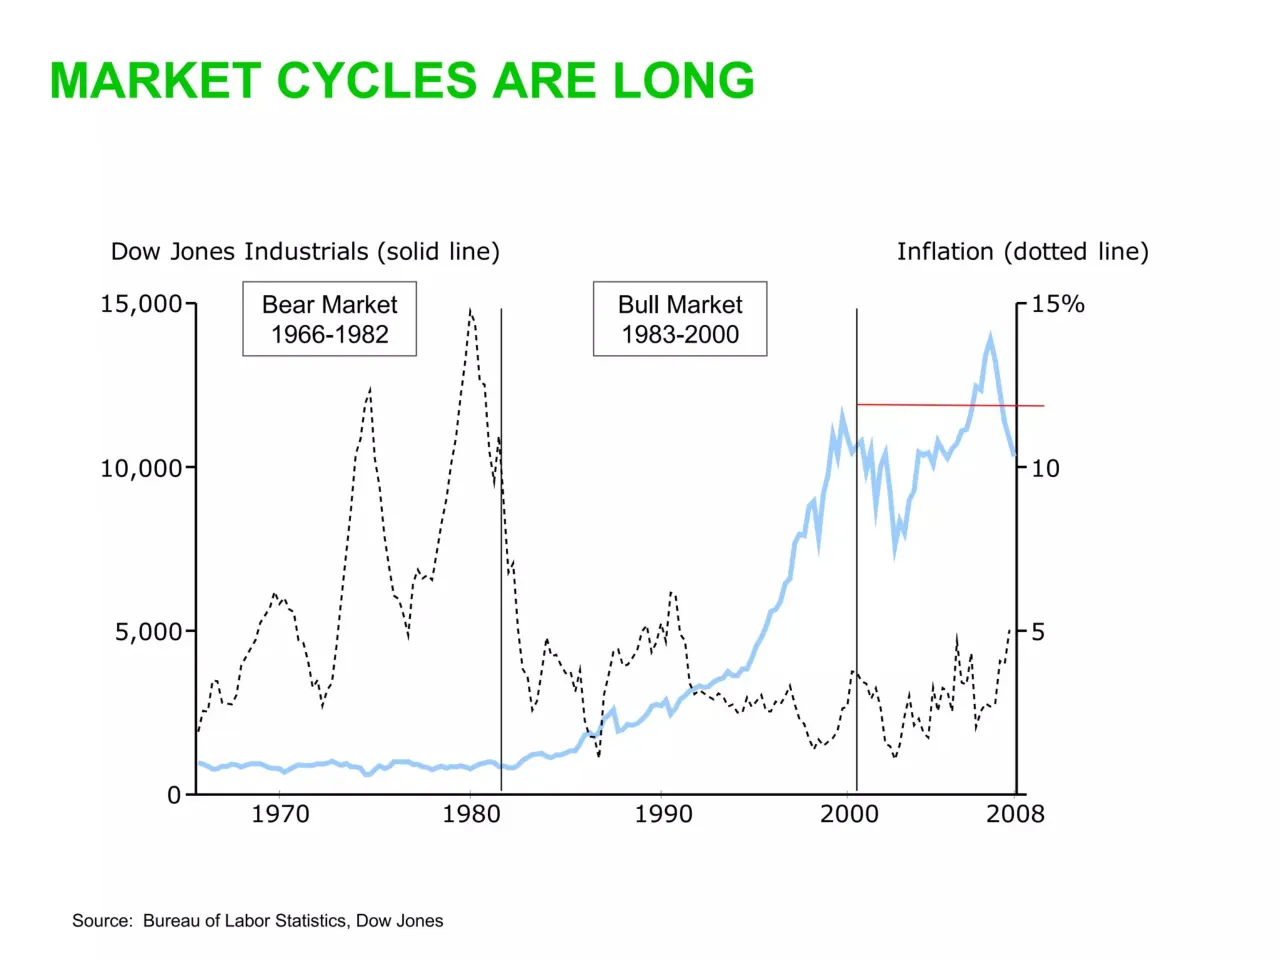
MARKET CYCLES ARE LONG
Dow Jones Industrials (solid line)
Inflation (dotted line)
15,000
Bear Market
1966-1982
Bull Market
1983-2000
15%
10,000
10
5,000
5
0
1970
1980
1990
2000
2008
Source: Bureau of Labor Statistics, Dow Jones
Visuals: Line chart titled none (axis titles only). Left y-axis: Dow Jones Industrials, linear, 0 to 15,000, ticks at 0, 5,000, 10,000, 15,000. Right y-axis: Inflation, percent, 0 to 15%, ticks at 0, 5, 10, 15%. X-axis: years, ticks labelled 1970, 1980, 1990, 2000, 2008, with a minor tick at each labelled year. Series 1: Dow Jones Industrials as a thick solid light-blue line; no values printed, about 1,000 in 1966, about 900 in 1982, about 2,000 in 1986, about 3,000 in 1990, about 4,000 in 1995, about 8,000 in 1998, about 11,000 in 2000, about 13,000 in 2003, about 13,000 in 2005, about 13,500 in 2007, about 10,500 in 2008 on the left scale. Series 2: inflation as a thin dotted black line; no values printed, about 2 percent in 1966 rising to about 6 percent in 1974 and about 4 percent in 1980 (peak in about 1980 near 14,500 on the left scale), falling to about 1.2 percent in 1987, about 4 percent in 1990, about 1.5 percent in 2002 and about 5 percent in 2008. Vertical black solid lines at about 1982 (from top of plot to x-axis) and at about 2000. Red thin straight line from about 2000 to 2008 at about 11.8 percent on the right scale, nearly flat, with no label. Boxes: 'Bear Market 1966-1982' and 'Bull Market 1983-2000' are outlined labels above the plot. No legend beyond the axis titles; no highlighted points.
Slide 7
DRIVEN BY PRODUCTIVITY AND CENTRAL BANK
Size of global workforce
Indexed global productivity
Fed funds rate
4B
3
2
1
0
1980
1990
2000
2008
150
125
100
1996
2002
2006
10%
8
6
4
2
0
1990
1995
2000
2005 Sep 2008
Source: Federal Reserve, International Labour Organization
Visuals: Three line charts side by side, each with a single light blue series and black axis lines with tick marks; no legend and no highlighted points. Chart 1 'Size of global workforce': y-axis 0 to 4B with ticks at 0, 1, 2, 3, 4B; x-axis 1980 to 2008 with ticks at 1980, 1990, 2000, 2008; line rises from about 1.9B in 1980 to about 3.2B in 2008, roughly straight with slight flattening around 1990. Chart 2 'Indexed global productivity': y-axis 100 to 150 with labelled ticks at 100, 125, 150; x-axis 1996 to 2006 with ticks at 1996, 2002, 2006; line rises from 100 in 1996 to about 125 in 2006, near-linear with a slight bend near 2002. Chart 3 'Fed funds rate': y-axis 0 to 10% with ticks at 0, 2, 4, 6, 8, 10%; x-axis 1990 to Sep 2008 with ticks at 1990, 1995, 2000, 2005, Sep 2008; stepped line starting about 8% in 1990, falling to about 3% in 1993, rising to about 6% in 1995, about 6.5% around 2000, falling to about 1% around 2003-2004, rising to about 5.25% in 2006-2007, then falling to about 2% by Sep 2008.
Slide 8
RESULTING IN FALLING INFLATION AND COST OF DEBT
U.S. inflation (annual year/year CPI change)
Yield on 10-year U.S. treasuries
25% / 15 / 5 / -5 / 1950 / 1960 / 1970 / 1980 / 1990 / 2000 / 2007
Average
16% / 12 / 8 / 4 / 0 / 1960 / 1970 / 1980 / 1990 / 2000 / June 2008
Average
Source: Bureau of Labor Statistics, Federal Reserve
Visuals: Two line charts on white. Left chart: title 'U.S. inflation (annual year/year CPI change)'; y-axis from -5 to 25% with labelled ticks at 25%, 15, 5 and -5 (a horizontal black zero baseline sits at about 0%); x-axis ticks labelled 1950, 1960, 1970, 1980, 1990, 2000, 2007; one light-blue series, about 10% at 1941, a spike to about 19% around 1947, a dip to about -10% around 1949, a peak of about 13% around 1974, a second peak of about 13% around 1980, then about 3 to 6% from 1985 to 2007; dashed black horizontal line labelled 'Average' at about 3.3%; a thin grey arrow with arrowhead runs from about 1981 at 13% down-right to about 2005 at 4%. Right chart: title 'Yield on 10-year U.S. treasuries'; y-axis 0 to 16% with labelled ticks at 16%, 12, 8, 4 and 0; x-axis ticks labelled 1960, 1970, 1980, 1990, 2000 and 'June 2008' at the end; one light-blue series starting about 3% in 1953, rising to about 15% peak around 1981, falling to about 4% by June 2008; dashed black horizontal line labelled 'Average' at about 6.5%; a thin grey arrow runs from about 1987 at 14% down-right to about 2006 at 7%. No legend. No highlighted points beyond the arrows.
Slide 9
FUELING A NATION OF CONSUMERS / U.S. current account / GDP / 2% / 0 / -2 / -4 / -6 / -8 / 1985 / 1990 / 1995 / 2000 / 2005 / Source: Bureau of economic analysis
Visuals: Line chart titled U.S. current account / GDP, with a horizontal black zero line across the plot. Y-axis: percent of GDP, labelled 2%, 0, -2, -4, -6, -8, range about -8% to +2%, with major ticks at each labelled value. X-axis: years, labelled 1985, 1990, 1995, 2000, 2005, range about 1982 to 2006, with ticks at the labelled years. One series drawn as a blue (#0066CC) line about 3 px thick, with approximate values (no values printed, so these are estimates): 1982 about -0.2, 1983 about -1.1, 1984 about -2.4, 1985 about -2.8, 1986 about -3.3, 1987 about -3.4, 1988 about -2.4, 1989 about -1.8, 1990 about -1.3, 1991 about 0.0 (the only point at or above zero, peaking at the zero line), 1992 about -0.8, 1993 about -1.2, 1994 about -1.7, 1995 about -1.5, 1996 about -1.6, 1997 about -1.7, 1998 about -2.5, 1999 about -3.2, 2000 about -4.2, 2001 about -3.8, 2002 about -4.4, 2003 about -4.8, 2004 about -5.5, 2005 about -6.1, 2006 about -6.2. No legend. No highlighted points beyond the 1991 peak, which is the only point above zero. Line is continuous, no markers.
Slide 10
FOREIGN $s RECYCLED INTO TREASURIES
DEMAND
KEEPS
LONGER-
TERM
RATES
LOW
U.S.
BUYS
FOREIGN
GOODS
FOREIGN COUNTRIES USE
PROCEEDS TO BUY
TREASURIES
Visuals: Diagram: a circular cycle of three thick block-arrow segments with chevron heads, arranged clockwise. Segment 1 (left, red, about #CC6666): label 'DEMAND KEEPS LONGER-TERM RATES LOW' in white capitals, stacked centred in six lines. Segment 2 (upper right, blue, about #0066CC): label 'U.S. BUYS FOREIGN GOODS' in white capitals, stacked centred in four lines. Segment 3 (bottom, grey, about #808084): label 'FOREIGN COUNTRIES USE PROCEEDS TO BUY TREASURIES' in white capitals, centred in three lines. Each arrowhead points to the next segment, and small white gaps separate the segments. The inner hole is white and the outer edges are smooth arcs. No axes, legend or values.
Slide 11
AS A RESULT, DEBT BALLOONED
Total Debt as % GDP
300%
280%
260%
240%
220%
200%
180%
160%
140%
120%
10 14 18 22 26 30 34 38 42 46 50 54 58 62 66 70 74 78 82 86 90 94 98 02
Source: Bridgewater
Visuals: One line chart titled Total Debt as % GDP (bold black sans-serif, centred above the plot). Type: a single red step-like line series (about 2 px stroke, pure red #FF0000) with a thin black rectangular plot frame and black tick marks. Y-axis: percentage, labelled 120% to 300% in 20-point steps, range about 120% to 300%. X-axis: years labelled 10, 14, 18 ... 98, 02 at 4-year intervals (years are shown as two-digit values, range about 1910 to 2004), no axis title. No legend, no data labels, no highlighted points. Estimated values (about, read from the line since no values are printed): about 143% around 1916, falling to about 125% near 1920, rising to about 165% around 1922, about 178% near 1930, about 253% peak around 1932 to 1934, falling to about 168% near 1937, about 137% in the early 1940s, about 129% near 1951, about 140% to 150% through the 1950s and 1960s, about 150% around 1975, about 170% near 1982, about 200% near 1986, about 230% near 1992, about 245% near 1998, and about 300% at the right edge near 2004.
Slide 12
DEPENDENT ON THE KINDNESS OF STRANGERS
Foreign Ownership of US Treasuries % Total Market Capitalization
70%
60%
50%
40%
30%
20%
10%
0%
60 62 64 66 68 70 72 74 76 78 80 82 84 86 88 90 92 94 96 98 00 02 04 06 08
Source: Bridgewater
Visuals: One line chart titled 'Foreign Ownership of US Treasuries % Total Market Capitalization' (bold black sans-serif, centred above the plot). Y-axis: percent, range 0% to 70%, major ticks and labels every 10% (0%, 10%, 20%, 30%, 40%, 50%, 60%, 70%). X-axis: calendar years, labelled every two years from 60 to 08 (labels read 60, 62, 64 ... 08), i.e. about 1960 to 2008. Single series drawn as a thick black stepped line about 3 px wide with small step jumps, no markers, no legend, no data labels. Values are not printed; estimates: about 6.5% in 1960 to 1962, about 7% in 1964-1966, about 6% in 1970, about 23% in 1972, about 30% in 1973, about 23% in 1976, about 30% in 1979, about 24% in 1981, about 17% in 1985, about 22% in 1990, about 21% in 1994, about 36% in 1997, about 35% in 2000, about 42% in 2002, about 54% in 2004, about 53% in 2006, about 59% in 2008 (latest point, the highest on the chart). Notable features: a sharp rise from about 1970 to 1973, a local peak near 1979, a trough near 1985, a sharp rise from about 1995 to 1997, and a steady climb from 2000 onward. No highlighted points. Plot area is an open rectangle with a thin dark grey border on all four sides and tick marks on the axes; no gridlines; white plot background.
Slide 13
LIQUIDITY AND EASING SPREAD TO HOUSING
Single family housing starts
2M
1
0
1980 1985 1990 1995 2000 2005 2008E
Average
Distribution of U.S. dollar mortgage originations
100%
80
60
40
20
0
Government
Prime-Jumbo
Prime-Conforming
Alt-A
Subprime
2002
2006
Source: Bridgewater, National Association of Home Builders
Visuals: Two charts. (1) Left: line chart titled 'Single family housing starts'. Y axis runs 0 to 2M with tick labels at 0, 1 and 2M (no unit printed beyond M). X axis labelled at 1980, 1985, 1990, 1995, 2000, 2005 and 2008E, with 2008E the last point. Single light blue (#99CCFF) line about 4 px thick, values unlabelled: about 0.85M in 1980, dipping to about 0.65M in 1982, rising to about 1.08M in 1983, about 1.2M in 1986, falling to about 0.9M in 1991, peaking about 1.2M in 1994, about 1.3M in 1998, about 1.7M in 2005, then falling sharply to about 1.45M in 2006, about 1.2M in 2007 and about 0.6M at 2008E. A horizontal black dashed line at about 1.15M is labelled 'Average' at its right end. No legend. (2) Right: 100% stacked column chart titled 'Distribution of U.S. dollar mortgage originations'. Y axis 0 to 100% with ticks at 0, 20, 40, 60, 80 and 100%. Two columns, 2002 and 2006, with black outlines. 2002 segments from bottom, estimated (about): Subprime about 5%, Alt-A about 5%, Prime-Conforming about 63%, Prime-Jumbo about 14%, Government about 13%. 2006 segments from bottom: Subprime about 20%, Alt-A about 20%, Prime-Conforming about 45%, Prime-Jumbo about 12%, Government about 3%. Segment colours: Subprime blue #0066CC, Alt-A red #CC6666, Prime-Conforming grey #808080, Prime-Jumbo green #339966, Government khaki #CCCC99. Labels inside segments are white, except Government which is dark text above its segment. A black dashed arrow runs from the top of the 2002 red segment at about 10% up-right to the boundary at about 40% on the 2006 column, linking the two columns. No legend beyond in-segment labels.
Slide 14
HOME PRICES GREW SUBSTANTIALLY ABOVE / MEAN / U.S. real home price index / 250 / 200 / 150 / 100 / 50 / 1900-1929 / -1.2% annualized / 1930 - 1997 / 0.7% annualized / 1998-2006 / 8.0% annualized / 1910 / 1920 / 1930 / 1940 / 1950 / 1960 / 1970 / 1980 / 1990 / 2000 / 2007 / Source: Robert Shiller
Visuals: Line chart titled 'U.S. real home price index' (no series name beyond that). Y-axis: labelled ticks 50, 100, 150, 200, 250 with no unit printed, range about 50 to 250, linear. X-axis: labelled ticks 1910, 1920, 1930, 1940, 1950, 1960, 1970, 1980, 1990, 2000, 2007, spanning about 1900 to 2007. Single series drawn as a thick light blue line (about 4 px at slide scale) with no printed data values. Approximate values read from the curve: about 100 in 1900, falling to about 65 around 1920, about 70 at 1930, rising to about 105 by 1946, about 115 by 1955, about 110 at 1985, about 125 near 1989, about 105 near 1990, about 125 near 1998, rising steeply to about 200 near 2006 and dipping to about 195 at 2007. Annotations are black arrows with thin black lines: (1) from about 1900 near 105 down to a point near 1929, labelled '1900-1929 / -1.2% annualized'; (2) from about 1930 near 70 up to about 1997 near 122, labelled '1930 - 1997 / 0.7% annualized'; (3) from about 1998 near 122 up to about 2006 near 205, labelled '1998-2006 / 8.0% annualized'; (4) a short unlabelled arrow pointing down-right to the right of the 2007 point. No highlighted points beyond the arrow tips. Axes are black lines about 2 px thick with no gridlines and no legend.
Slide 15
STRUCTURED PRODUCTS AND REGULATORY / CHANGES COMPOUND THESE ISSUES / GROWTH IN SECURITIZATIONS / LEVERAGE ON THOSE STRUCTURES / INCREASED LEVERAGE ON BANK’S BALANCE SHEETS / OFTEN MIS-RATED BY AGENCIES / REPEAL OF GLASS-STEAGALL / REGULATORY CHANGES ENCOURAGING HOME OWNERSHIP
Slide 16
HUGE GROWTH IN DERIVATIVES
Outstanding amount of open positions in OTC derivatives markets
$525T
350
175
0
1995
1998
2001
2004
2007
U.S. GDP
35x
U.S.
GDP
Note: Outstanding amount is not a pure measure of risk as some positions are netted and have collateral; U.S. GDP was $13.8T in 2007
Source: Bank for International Settlements
Visuals: Line chart titled 'Outstanding amount of open positions in OTC derivatives markets'. Y-axis: outstanding amount in US dollars, trillions, linear scale from 0 to $525T, labelled ticks at 0, 175, 350 and $525T. X-axis: years, labelled ticks at 1995, 1998, 2001, 2004 and 2007, with a tick mark at each label. Series 1 (light blue solid line, about 4 px thick, straight segments between points): about $49T in 1995, about $79T in 1998, about $98T in 2001, about $218T in 2004, about $508T in 2007 (estimates; no values printed, read from the plot). The line ends just short of the $525T top gridline at 2007. Series 2 (black dashed line, about 4 px thick, dash length roughly 20 px and gap roughly 12 px) labelled 'U.S. GDP' at its right end, at about $13.8T across the whole period (estimate; the note gives $13.8T for 2007). Annotation: a thin dark grey curly brace spanning from about $510T down to about $14T on the right side of the plot, pointing right at about $250T, with the label '35x U.S. GDP' to its right. No legend. No highlighted points. Axes are black lines, about 2 px thick, with outward ticks.
Slide 17
SIGNIFICANT EXCESS CAPACITY
World Fixed Investment (%GDP)
24%
23%
22%
21%
20%
90 92 94 96 98 00 02 04 06 08
tremendous amount of
capacity built up
Source: Bridgewater
Visuals: Line chart titled 'World Fixed Investment (%GDP)'. Y-axis: percent of GDP, range 20% to 24%, ticks at 20%, 21%, 22%, 23%, 24%. X-axis: years 1990 to 2008, labelled 90, 92, 94, 96, 98, 00, 02, 04, 06, 08 with tick marks every two years. Single series drawn as a thick black line (about 3 pt): starts near 21.0% in 1990, falls to a trough near 20.2% around 1992-93, rises to about 21.0% in 1995, about 21.5% around 1997-2001, dips to a trough near 20.6% around 2002-03, then rises steeply to a peak near 23.6% around 2007-08 and ends slightly lower near 23.5% in 2008. No printed data values; figures are estimates. Annotation: a thin black arrow pointing up-right from about 2003 at 21.1% to about 2006 at 22.9%, with the text 'tremendous amount of capacity built up' set in black above the arrow. Chart is boxed with a thin black rectangle frame around the plot area; no legend and no highlighted points.
Slide 18
VERY TIGHT CREDIT
High yield spreads (basis points)
1,250
1,000
750
500
250
0
1998
2000
2002
2004
2006
2008
Investment grade spreads (basis points)
500
400
300
200
100
0
1998
2000
2002
2004
2006
2008
Source: Merrill Lynch
Visuals: Two line charts with no legend and no highlighted points. Left chart: line chart titled 'High yield spreads (basis points)', y-axis labelled 0 to 1,250 in ticks of 250 (values 0, 250, 500, 750, 1,000, 1,250), x-axis labelled 1998, 2000, 2002, 2004, 2006, 2008; the series starts about 300 in 1998, dips to about 250 in early 1998, rises to about 650 in late 1998, about 900 in 2001, peaks about 1,150 in late 2002, falls to about 350 in 2005, rises to about 800 in 2007, dips to about 250 in 2007 and ends about 1,100 in 2008. Right chart: line chart titled 'Investment grade spreads (basis points)', y-axis 0 to 500 in ticks of 100 (values 0, 100, 200, 300, 400, 500), x-axis 1998, 2000, 2002, 2004, 2006, 2008; the series starts about 70 in 1998, rises to about 150 in 1999, about 200 in 2000, peaks about 280 in late 2002, falls to about 80 in 2005, about 100 through 2006, dips to about 85 in 2007 and ends about 460 in 2008. Both lines are a single pale sky-blue series, about 3 pt thick, with no markers, gridlines or data labels.
Slide 19
JAPAN MAY BE INSTRUCTIVE
Nikkei Index 1988 - present
Japanese discount rate
Annual real GDP growth
40,000
30,000
20,000
10,000
0
1990
1995
2000
2005
Oct 2008
8%
6
4
2
0
1990
1995
2000
2005
Jul-08
6%
3
0
-3
-6
1990
1995
2000
2005
Average
Source: Bank of Japan, Yahoo Finance
Visuals: Three line charts in light blue, all with black axes and no legend. Chart 1: title 'Nikkei Index 1988 - present'; y-axis 0 to 40,000 with ticks at 10,000, 20,000, 30,000 and 40,000 (no unit printed); x-axis 1988 to Oct 2008 with labels 1990, 1995, 2000, 2005, Oct 2008; series is a jagged daily index line that peaks at about 38,000 near 1990, falls to about 21,000 by 1992, dips to about 8,000 around 2003, and recovers to about 11,000 at the end. No values printed on the line. Chart 2: title 'Japanese discount rate'; y-axis 0 to 8% with ticks at 2, 4, 6 and 8%; x-axis 1988 to Jul-08 with labels 1990, 1995, 2000, 2005, Jul-08; step line that rises from about 2.5% in 1988 to a peak of about 6% near 1991, steps down to about 0.5% by 1996, sits near 0.1% from about 2002 to 2007, then rises to about 0.75% at the end. No values printed. Chart 3: title 'Annual real GDP growth'; y-axis -6 to 6% with ticks at -6, -3, 0, 3 and 6 (no unit beyond %); x-axis 1990 to 2005 with labels 1990, 1995, 2000, 2005; annual line starting about 4.6% in 1990, falling to about 1% by 1993, a peak of about 4% in 1996, a trough of about -5.5% in 1999, a peak of about 2.8% in 2000, and ending about 2% in 2005. A horizontal black dashed line marks the average at about 1.6%, labelled 'Average' at its right end, and a solid black zero line runs across the plot.
Slide 20
KEY THEMES
GLOBAL
SECULAR
NOT “NORMAL CRISIS”, WILL TAKE TIME
CREDIT NOT EQUITY DRIVEN
SIGNIFICANT RISK TO GDP GROWTH
POTENTIAL FOR GREATER REGULATORY REFORMS / SCRUTINY
Slide 21
OUR TAKE
MANAGE WHAT YOU CAN CONTROL
SPENDING
GROWTH ASSUMPTIONS
EARNINGS ASSUMPTIONS
FOCUS ON QUALITY
LOWER RISK
REDUCE DEBT
Slide 22
MAIN STREET
WHERE ARE WE NOW?
MICHAEL BECKWITH
SEQUOIA CAPITAL
THE ENTREPRENEURS BEHIND THE ENTREPRENEURS
Visuals: One logo: the Sequoia Capital wordmark in green (#00BE00-like) with a stylised green fern/leaf emblem replacing the letter between 'SEQUOIA' and 'CAPITAL', with a registered mark after CAPITAL; below it, the tagline 'THE ENTREPRENEURS BEHIND THE ENTREPRENEURS' in small grey widely spaced capitals with a registered mark. No photographs, charts or other graphics.
Slide 23
THE U.S.: A NATION OF CONSUMERS / THE CHANGING FACE OF THE ECONOMY / $ TRILLIONS / 1987 / 1997 / 2007 / TOTAL U.S. GDP / 4.7 / 8.3 / 13.8 / CONSUMER SPENDING / 3.1 / 5.8 / 10.1 / CONSUMER AS % OF TOTAL GDP / 66% / 70% / 73% / DISPOSABLE PERSONAL INCOME / 3.5 / 6.0 / 10.2 / Source: Bureau of Economic Analysis.
Visuals: A table with four columns: a row-label column (left-aligned, no values) and three value columns headed 1987, 1997 and 2007 (right-aligned). Header row: '$ TRILLIONS' in the label column, then the years. Rows: 'TOTAL U.S. GDP' with 4.7 (1987), 8.3 (1997), 13.8 (2007); 'CONSUMER SPENDING' with 3.1, 5.8, 10.1 (bold label and values); 'CONSUMER AS % OF TOTAL GDP' with 66%, 70%, 73% (bold label and values); 'DISPOSABLE PERSONAL INCOME' with 3.5, 6.0, 10.2. Units are US dollars in trillions for the value rows and percentages for the share row. A single black horizontal rule sits under the header row. No chart, photograph, logo or icon.
Slide 24
EXPLOSION IN HOME OWNERSHIP
HOME OWNERSHIP %
70
69
68
67
66
65
64
63
62
LONG-TERM AVERAGE
1965 / 1967 / 1969 / 1971 / 1973 / 1975 / 1977 / 1979 / 1980 / 1982 / 1984 / 1986 / 1988 / 1990 / 1992 / 1993r / 1995 / 1997 / 1999 / 2001 / 2002r / 2004 / 2006 / Q2'08
Source: Current Population Survey/Housing Vacancy Survey, Series H-111 Reports, Bureau of the Census, Washington, DC 20233.
Visuals: Chart: line chart, no chart title inside the graphic. Y-axis labelled HOME OWNERSHIP %, linear scale from 62 to 70 with ticks every 1 point, unit percent. X-axis is time, labelled 1965 to Q2'08 at roughly 2-year intervals (1965, 1967, 1969, 1971, 1973, 1975, 1977, 1979, 1980, 1982, 1984, 1986, 1988, 1990, 1992, 1993r, 1995, 1997, 1999, 2001, 2002r, 2004, 2006, Q2'08), labels rotated about 45 degrees. One series, thick bright green line (about 8 px wide at this scale) with a faint grey shadow. Values are not printed; estimates: 1965 about 63.4, 1966 about 63.8, 1967 about 63.5, 1968 about 63.6, 1969 about 64.4, 1970 about 64.0, 1971 about 64.5, 1972 to 1974 about 64.4, 1975 about 64.5, 1977 about 64.9, 1979 about 65.8 (peak of the early 1979 hump), 1980 about 65.5, 1981 about 65.2, 1982 about 64.5, 1983 about 64.4, 1984 about 64.1, 1985 about 63.5 (low point), 1986 about 64.0, 1987 about 64.1, 1988 to 1989 about 63.8, 1990 about 64.1, 1992 about 64.3, 1993 about 64.6, 1993r to 1994 about 64.2, 1995 about 65.1, 1997 about 65.6, 1998 about 66.2, 1999 about 66.7, 2000 about 67.5, 2001 about 68.0, 2002 about 68.3, 2002r about 68.3, 2003 about 68.6, 2004 about 69.2 (highest point), 2005 about 69.0, 2006 about 68.9, 2007 about 67.8, Q2'08 about 68.1. A dotted-outline grey rectangle with no fill spans the full plot width horizontally between about 64.3 and 64.7 on the y-axis, marking the long-term average band, labelled LONG-TERM AVERAGE in italic capitals placed just above the band near 1984 to 1993. No legend. No highlighted points beyond the peak. Axes are thin grey lines with small outward tick marks.
Slide 25
WAGE GROWTH & PERSONAL SAVINGS PERSONAL SAVINGS RATE FALLING REAL WAGES ERODING PCE PERSONAL SAVINGS RATE EVAPORATED REAL WAGE GROWTH FELL Source: Bureau of Economic Analysis, Federal Reserve, Haver, Bureau of Labor Statistics, Census Bureau, Factset, Morgan Stanley Research.
Visuals: Two line charts. Left chart: Personal Savings Rate, a single green (#00C000) line with no data labels and no legend. Y axis from -1 to 11 with labelled ticks at -1, 1, 3, 5, 7, 9, 11 (unit: percent, unlabelled). X axis labelled quarterly from Q1'85 to about Q3'07, with tick labels Q1'85, Q2'87, Q3'89, Q4'91, Q1'94, Q2'96, Q3'98, Q4'00, Q1'03, Q2'05, Q3'07, rotated 90 degrees. Line starts about 9.5 in Q1'85, peaks about 10.2 shortly after, falls to about 8 by 1986, plateaus around 7 to 8 through the early 1990s, drops to about 5.5 around 1994, drifts to about 4 by 1998, about 2 to 3 around 2000 with a dip near 0.5 around 2001, then about 1 near 2005 with a low just below 0 around Q2'05, recovering to about 1 and ending near 0 at Q3'07. Right chart: Falling Real Wages Eroding PCE, two lines. Blue (#1F5FBF approx) series labelled Real Personal Consumption Expenditure (yoy%). Yellow (#F5C400 approx) series labelled Real after-tax wages & salaries (yoy%). Y axis from -5 to 7 with labelled ticks at -5, -3, -1, 1, 3, 5, 7 (unit: percent year on year). X axis labelled 1971, 1974, 1977, 1980, 1983, 1986, 1989, 1992, 1995, 1998, 2001, 2004, 2007. A thin grey horizontal zero line crosses the plot at 0. Blue peaks about 7.8 around 1973 and troughs about -1.5 near 1975; yellow peaks about 6 near 1973 and troughs about -4.7 near 1975. Both lines show repeated peaks near 6 to 7 around 1984 and 1998, and troughs near -1 to -2 around 1980 and near -1.5 around 1991. Legend sits inside the lower-right of the plot area: blue line sample followed by the blue series label, then yellow line sample followed by the yellow series label, both in a serif font, black. No highlighted points.
Slide 26
CONSUMERS BUCKLING UNDER DEBT
HOUSEHOLD DEBT SERVICE RATIO
HOUSEHOLD FINANCIAL OBLIGATION RATIO
DSR = DEBT PAYMENTS ON OUTSTANDING MORTGAGES AND CONSUMER DEBT/DISPOSABLE PERSONAL INCOME
FOR = ADDS AUTOMOBILE LEASE PAYMENTS, RENTAL PAYMENTS, H/O'S INSURANCE AND PROPERTY TAX PAYMENTS TO THE DSR
Source: Bureau of Economic Analysis.
Visuals: Two line charts, side by side, same layout and time axis. Left chart: type line chart; title HOUSEHOLD DEBT SERVICE RATIO; y-axis 10 to 15 with ticks at 10, 11, 12, 13, 14, 15 (no units printed); x-axis quarterly ticks labelled Q1'85, Q2'87, Q3'89, Q4'91, Q1'94, Q2'96, Q3'98, Q4'00, Q1'03, Q2'05, Q3'07 (rotated 90 degrees, reading upward); one series in bright green, values not printed, estimated as: starts about 11.3 at Q1'85, rises to about 12.3 near Q2'87, dips to about 11.7 near Q3'89, falls to about 10.8 near Q1'93, recovers to about 11.8 near Q2'96, about 12.0 near Q3'98, climbs to about 13.6 near Q1'03, about 13.5 near Q2'05, ends about 14.4 at Q3'07. No legend, no highlighted points, no gridlines. Right chart: type line chart; title HOUSEHOLD FINANCIAL OBLIGATION RATIO; y-axis 15 to 20 with ticks at 15, 16, 17, 18, 19, 20 (no units printed); same quarterly x-axis labels Q1'85 to Q3'07 rotated 90 degrees; one series in bright green, values not printed, estimated as: starts about 16.35 at Q1'85, peaks about 17.85 near Q2'87, falls to about 16.15 near Q4'92, rises to about 17.4 near Q2'96, about 17.4 near Q3'98, about 18.9 near Q1'03, about 18.4 near Q2'05, ends about 19.5 at Q3'07. No legend, no highlighted points, no gridlines. Both charts have grey (#8C8C8C) axis lines on the left and bottom only, no chart border.
Slide 27
MEWs BECAME THE NEW PIGGY BANK
MEW CONTINUES TO FADE…
12
10
8
6
4
2
0
Active
Passive
Mortgage equity withdrawal,
as a % of disposable income,
4-quarter moving average
1Q91
1Q92
1Q93
1Q94
1Q95
1Q96
1Q97
1Q98
1Q99
1Q00
1Q01
1Q02
1Q03
1Q04
1Q05
1Q06
1Q07
1Q08
Source: Haver, BEA, NAHB, Conference Board, EIA, Morgan Stanley Research.
Visuals: Stacked column chart. Title: 'MEW CONTINUES TO FADE…' (printed above the plot, centred). Y-axis: 0 to 12, major ticks and labels at 0, 2, 4, 6, 8, 10, 12, no unit printed on the axis; the unit is given by the annotation 'as a % of disposable income'. X-axis: quarters from 1Q91 to 1Q08, about 69 columns, labels printed every four quarters (1Q91, 1Q92 ... 1Q08), rotated 90 degrees. Two series stacked: Passive (navy, bottom segment) and Active (gold, top segment). Legend: gold square labelled 'Active' above navy square labelled 'Passive', top right of plot. No values are printed on the bars, so readings are estimates. Approximate totals: 1Q91 about 4.4 (passive about 3.6); 1Q92 about 3.7; 1995 low about 2.0 (passive about 1.3); 1Q96 about 2.0; 1Q99 about 4.5; 1Q01 about 5.4; 1Q03 about 6.9; 1Q04 about 8.6; 1Q05 about 9.9; 1Q06 peak about 11.2 (passive about 5.7); 1Q07 about 9.4; 1Q08 about 5.0 (passive about 2.6). No highlighted points, no callout boxes, no gridlines. Bars have thick black outlines (about 2 px) and are separated by thin gaps.
Slide 28
FROM VIRTUOUS TO VISCIOUS CYCLE / MORTGAGE RESET / DELINQUENCIES/FORECLOSURES / PRICES FALL / MEWS DECREASE / CONSUMER SPEND FALLS / JOB MARKET ERODES / RECESSION / UNEMPLOYMENT SPIKES HIGHER / Mortgage Delinquency rate / US unemployment rate (RA) / 4.33 / 6.1 / y/y% / Case-Shiller composite-10 home price index: by region / (12-month change as of July 2008) / y/y% / Boston / Chicago / Denver / Los Vegas / L.A. / Miami / NY / San Diego / San Francisco / Washington D.C. / Source: Federal Reserve, Haver, Bureau of Labor Statistics, Census Bureau, Factset, Morgan Stanley Research, Case-Shiller & DB Global Market Research.
Visuals: Seven red block down-arrows (each with three thin white stripes near its top edge) stacked vertically on the left, separating the labels MORTGAGE RESET, DELINQUENCIES/FORECLOSURES, PRICES FALL, MEWS DECREASE, CONSUMER SPEND FALLS, JOB MARKET ERODES and RECESSION in top-to-bottom order; arrows point down into the next label. Upper right: a line chart titled UNEMPLOYMENT SPIKES HIGHER with a left axis from 1.0 to 4.5 (step 0.5, unlabelled units, Mortgage Delinquency rate) and a right axis from 3.5 to 8.0 (step 0.5, percent, US unemployment rate RA); x-axis ticks 1992, 1994, 1996, 1998, 2000, 2002, 2004, 2006, 2008. Blue line (Mortgage Delinquency rate) starts about 3.3 in 1992, falls to about 1.9 around 1999, rises to about 2.2 around 2001, falls to about 1.4 around 2005, then climbs steeply to 4.33 at the end (about 2008.7), labelled 4.33 with a blue-outlined circle marker. Yellow line (US unemployment rate RA) starts about 7.7 in 1992, falls to about 4.0 around 2000, rises to about 6.2 around 2003, dips to about 4.7 around 2007, then rises to 6.1 at the end, labelled 6.1 with a red-outlined circle marker. Legend inside the plot at upper right with a blue line swatch for Mortgage Delinquency rate and a yellow line swatch for US unemployment rate (RA). Lower right: a vertical bar chart titled Case-Shiller composite-10 home price index: by region (12-month change as of July 2008), y/y% on both axes, scale 0 to -35 in steps of 5, bars hanging down from the zero line in gray, with regions labelled beside or below each bar from left to right: Boston about -5.2, Chicago about -10.0, Denver about -4.8, Los Vegas about -30.0, L.A. about -26.3, Miami about -28.5, NY about -7.3, San Diego about -25.2, San Francisco about -24.8, Washington D.C. about -15.8 (no values are printed; these are estimates). No legend, no highlighted bars. Source line below the lower chart.
Slide 29
ON THE BRINK OF A RECESSION / CONSUMER CONFIDENCE AT MULTI-DECADE LOWS / Conference Board Consumer Confidence Index / Dec-74, 43.2 / May-80, 50.1 / Oct-82, 54.3 / Feb-92, 47.3 / Mar-03, 61.4 / Sep-08 59.8 / ISM IS FALLING FAST / ISM Manufacturing & Non-Manufacturing Index / ISM Manufacturing / Nov-70, 39.7 / Jan-75, 30.7 / May-80, 29.4 / May-82, 35.5 / Feb-91, 39.4 / Oct-01, 40.8 / ISM Non-Manufacturing / Aug-08 50.6 / GDP IS POISED TO TURN NEGATIVE / Real GDP and GDp growth (YoY SA) / Thousand / Continued unemployment insurance claims (4 wk MA, ls) / Unemployment rate (rs) / % / NBER recession / GDpg / GDPg / Source: Haver, NAHB, Conference Board, NFIB, Morgan Stanley Research, DoL & DB Global Markets Research.
Visuals: Four line charts. (1) Top-left: line chart titled 'Conference Board Consumer Confidence Index', y-axis 40 to 140 in steps of 20 (unitless index), x-axis 1970 to 2008 labelled every two years; one blue series with red open-circle markers at labelled troughs: Dec-74 43.2, May-80 50.1, Oct-82 54.3, Feb-92 47.3, Mar-03 61.4, Sep-08 59.8; grey vertical recession bands around 1970-71, 1973-75, 1980, 1981-82, 1990-91, 2001. (2) Top-right: dual-axis line chart; left axis 'Thousand' 1600 to 4000 in steps of 400; right axis '%' 2 to 8 in steps of 1; x-axis 2000 to 2008 by year; black solid line 'Continued unemployment insurance claims (4 wk MA, ls)' rising from about 2100 in 2000 to about 3500 at end of 2008; black line with x markers 'Unemployment rate (rs)' from about 4.0% in 2000 to about 6.1% at end of 2008; one grey shaded recession band around 2001. (3) Bottom-left: line chart titled 'ISM Manufacturing & Non-Manufacturing Index', y-axis 25 to 75 in steps of 5, x-axis 1960 to 2008 labelled every two years; blue series ISM Manufacturing with red open-circle markers at Nov-70 39.7, Jan-75 30.7, May-80 29.4, May-82 35.5, Feb-91 39.4, Oct-01 40.8; yellow series ISM Non-Manufacturing from about 1997 to 2008 with red open-circle marker at Aug-08 50.6; horizontal black reference line at 50; grey recession bands. (4) Bottom-right: line chart 'Real GDP and GDp growth (YoY SA)', y-axis -0.06 to 0.12 in steps of 0.02, x-axis Sep-71 to Sep-07 labelled every two years; blue series GDpg and red series GDPg tracking closely; light cyan vertical bands for NBER recessions around 1973-75, 1980, 1981-82, 1990-91, 2001; grey plot background; legend box beneath with cyan swatch 'NBER recession', blue line 'GDpg', red line 'GDPg'. No values are printed on the GDP chart, so its values are estimates: about 0.10 peak near 1983 in the blue series, troughs about -0.04 near 1980.
Slide 30
EARNINGS BEGINNING TO ROLL
EARNINGS DOWN 18% ON ESTIMATES MADE 12 MONTHS AGO
S&P 500 Rolling Earnings Surprise %
12mo Forward Estimates vs. Actuals
15%
10%
5%
0%
-5%
-10%
-15%
-20%
-25%
-30%
1985
1987
1989
1991
1993
1995
1997
1999
2001
2003
2005
2007
Under-estimate Earnings
Over-estimate Earnings
1/31/87, -18.5%
12/31/91, -25.0%
12/31/01, -25.2%
9/30/08 -18.6%
Grey shading represents US
Source: Datastream, Robert Shiller, Factset and Morgan Stanley Research.
Visuals: Line chart titled 'S&P 500 Rolling Earnings Surprise %' with subtitle '12mo Forward Estimates vs. Actuals'. Y-axis: percent, range -30% to 15%, labelled ticks at 15%, 10%, 5%, 0%, -5%, -10%, -15%, -20%, -25%, -30%. X-axis: years, labelled ticks 1985 to 2007 at two-year intervals. One blue series (about #4472C4) with a thick line, values with labels: 1/31/87 -18.5%; 12/31/91 -25.0%; 12/31/01 -25.2%; 9/30/08 -18.6%. Peaks visible at about 10% around 1989 and about 8% around 2004 are estimates, not printed. Highlighted points are red-outlined circles at each labelled value. Two grey vertical bands (about #D9D9D9) shade recession periods, one around 1990-1991 and one around 2001-2002; the caption 'Grey shading represents US' sits beneath the chart. Annotations 'Under-estimate Earnings' above the zero line near 1996 and 'Over-estimate Earnings' below the zero line near 1996. No legend.
Slide 31
V-SHAPED RECOVERY UNLIKELY / 50% / 30% / 10% / -10% / -30% / -50% / -70% / Y / Y / CY00 / CY01 / CY02 / CY03 / CY04 / CY05 / CY06 / CY07 / CY08E / CY09E / S&P 500 / IT / MEDIA / TELECOM SVCS / Current S&P 500 Consensus Actual and Expected Operating Earnings Growth (Weighted-Avg. % / Y/Y) / CY00 / CY01 / CY02 / CY03 / CY04 / CY05 / CY06 / CY07 / CY08E / CY09E / Financials / 5% / -10% / 18% / 25% / 11% / 5% / 23% / -37% / -46% / 109% / Consumer Discretionary / 0% / -24% / 33% / 11% / 28% / 2% / 9% / -10% / -16% / 41% / Media / -1% / -6% / 34% / 12% / 33% / 28% / 27% / 15% / 11% / 11% / Information Technology / 28% / -63% / 0% / 46% / 43% / 20% / 12% / 21% / 10% / 17% / Telecom Services / 6% / -24% / -8% / 0% / -8% / 14% / 17% / 5% / -1% / 10% / S&P 500 / 17% / -17% / 5% / 18% / 20% / 15% / 16% / -4% / 1% / 23%
Visuals: Line chart titled by the slide headline, with a y-axis labelled 'Y / Y' running from -70% to 50% in 20-point steps (50%, 30%, 10%, -10%, -30%, -50%, -70%) and a horizontal zero line. The x-axis has categories CY00, CY01, CY02, CY03, CY04, CY05, CY06, CY07, CY08E, CY09E. Four series, with values from the table below: S&P 500 (bright green line, 17%, -17%, 5%, 18%, 20%, 15%, 16%, -4%, 1%, 23%), IT (dark charcoal line, 28%, -63%, 0%, 46%, 43%, 20%, 12%, 21%, 10%, 17%), MEDIA (mid-grey line, -1%, -6%, 34%, 12%, 33%, 28%, 27%, 15%, 11%, 11%), TELECOM SVCS (light grey line, 6%, -24%, -8%, 0%, -8%, 14%, 17%, 5%, -1%, 10%). Series names are set as direct labels at the right end of the lines, with no separate legend box. The S&P 500 green line is the highlighted series. Below the chart is a table titled 'Current S&P 500 Consensus Actual and Expected Operating Earnings Growth (Weighted-Avg. % / Y/Y)' with columns CY00 to CY09E and rows Financials, Consumer Discretionary, Media, Information Technology, Telecom Services and S&P 500; the CY09E column is shaded light grey and its values are bold, and the S&P 500 row is bold throughout. The table has a thin black rule under the column headers and a thin black rule above the S&P 500 row.
Slide 32
ADVERTISING MARKETS ARE CRACKING
Y / Y
20%
15%
10%
5%
0%
-5%
-10%
Q1'07
Q2'07
Q3'07
Q4'07
Q1'08
Q2'08
INTERNET
TV
TOTAL MARKET
RADIO
Source: TNS U.S. Advertising Expenditure Estimates
Visuals: Line chart titled by the slide headline. Y-axis labelled 'Y / Y' (year-over-year percent change) running from -10% to 20% in 5-point steps, with horizontal zero line in black. X-axis categories: Q1'07, Q2'07, Q3'07, Q4'07, Q1'08, Q2'08, with tick marks between categories. Four series, each with its label at the right end: INTERNET (dark charcoal grey, about 16.7% at Q1'07, about 18.6% at Q2'07, about 16.3% at Q3'07, about 12.4% at Q4'07, about 8.5% at Q1'08, about 7.4% at Q2'08); TV (mid grey, about -2.7% at Q1'07, about -2.1% at Q2'07, about -0.9% at Q3'07, about -1.7% at Q4'07, about 1.8% at Q1'08, about -2.4% at Q2'08); TOTAL MARKET (bright green, about -2.3% at Q1'07, about -2.3% at Q2'07, about 1.2% at Q3'07, about 0.1% at Q4'07, about 0.7% at Q1'08, about -3.6% at Q2'08); RADIO (light grey, about -2.1% at Q1'07, about -3.1% at Q2'07, about 0.0% at Q3'07, about -8.3% at Q4'07, about -4.6% at Q1'08, about -8.0% at Q2'08). No legend; series are identified by end labels. No highlighted points. Lines are thick, about 1% of slide height, with round caps.
Slide 33
RETAIL/ECOMMERCE DETERIORATING / 25% / 20% / 15% / 10% / 5% / 0% / Y / Y / TOTAL US / eCOMMERCE / TOTAL US / RETAIL SALES / Q3'06 / Q4'06 / Q1'07 / Q2'07 / Q3'07 / Q4'07 / Q1'08 / Q2'08 / Source: US Census Bureau.
Visuals: Line chart with two series, no legend, labels placed directly at line ends. Title: none inside the chart. Y axis: 0% to 25%, ticks every 5%, labelled 'Y / Y' rotated vertically at left, percentage year-over-year change. X axis: categorical quarters Q3'06, Q4'06, Q1'07, Q2'07, Q3'07, Q4'07, Q1'08, Q2'08. Series 1 'TOTAL US eCOMMERCE', bright green line, values about: Q3'06 17.6%, Q4'06 21.2%, Q1'07 16.2%, Q2'07 19.6%, Q3'07 17.7%, Q4'07 17.0%, Q1'08 11.8%, Q2'08 7.9%. Series 2 'TOTAL US RETAIL SALES', dark grey line, values about: Q3'06 4.5%, Q4'06 3.8%, Q1'07 3.8%, Q2'07 3.7%, Q3'07 3.1%, Q4'07 4.9%, Q1'08 3.9%, Q2'08 2.3%. No values are printed on the slide; these are estimates read against gridlines. Highlighted points: none; the end points of both lines are labelled directly. Lines are thick (about 1% of slide height) with rounded joins and caps, the axes are thin black lines with small outward tick marks, and the x-axis baseline is black.
Slide 34
MOBILE IS NOT IMMUNE
Y / Y
16%
10%
5%
0%
-5%
-10%
Q1'07 / Q2'07 / Q3'07 / Q4'07 / Q1'08 / Q2'08 / Q3'08
Subscribers
Handsets
Source: TNS U.S. Advertising Expenditure Estimates
Visuals: Line chart titled 'MOBILE IS NOT IMMUNE' (the title is the slide headline). Y-axis: labelled 'Y / Y' (rotated vertical), ticks 16%, 10%, 5%, 0%, -5%, -10%, range -10% to 16%, tick labels every 5 points except 15% is not printed (16% is the top tick). X-axis: quarterly categories Q1'07, Q2'07, Q3'07, Q4'07, Q1'08, Q2'08, Q3'08, with tick marks between categories, horizontal axis line at 0%. Series 1 'Subscribers' (dark charcoal line, smooth curve, thick stroke, round ends): about 8.7% at Q1'07, about 7.5% at Q2'07, about 6.5% at Q3'07, about 5.2% at Q4'07, about 5.5% at Q1'08, about 6.2% at Q2'08, about 5.0% at Q3'08 (values estimated; none printed). Series 2 'Handsets' (mid-grey line, smooth curve, thick stroke, round ends): about 5.0% at Q1'07, about 7.5% at Q2'07, about 9% at Q3'07, about 13.5% at Q4'07 (peak), about 0% at Q1'08, about -2.5% at Q2'08, about -6% at Q3'08 (values estimated; none printed). The two lines cross near Q2'07 at about 7.5% and again near Q1'08 at about 5.5%. Series are labelled directly at line ends rather than in a legend; no highlighted points. Source attribution beneath the chart.
Slide 35
TECH SPENDING DEPENDS ON ECONOMY / Y-Y Change in S&P 500 Earnings, Technology Spending (1996-2008E) / S&P 500 EPS Growth / Tech Spending Growth / Source: Bernstein Strategy Group; First Call / Drop in earnings in Dec 07 was partly due to financial services industry write offs
Visuals: Line chart. Title: none inside the chart; the subtitle above it reads Y-Y Change in S&P 500 Earnings, Technology Spending (1996-2008E). Y-axis: percent change, from -30% to 30% in 10% steps, with labels 30%, 20%, 10%, 0%, -10%, -20%, -30%; a horizontal zero line in thin grey. X-axis: half-yearly periods from Jun-95 to Jun 08E, labels rotated vertical, reading Jun-95, Dec-95, Jun-96, Dec-96, Jun-97, Dec-97, Jun-98, Dec-98, Jun-99, Dec-99, Jun-00, Dec-00, Jun-01, Dec-01, Jun-02, Dec-02, Jun-03, Dec-03, Jun-04, Dec-04, Jun-05, Dec-05, Jun-06, Dec-06, Jun-07, Dec-07, Jun 08E, with small tick marks. Series 1: S&P 500 EPS Growth, solid thick black line; about 23% at Jun-95, about 7.5% at Dec-95, about 6% at Dec-96, about 22% at Jun-99, about -4% at Dec-00, about -23% at Jun-01, about -26% at Dec-01, about 14% at Jun-02, about 25% at Dec-03, about 26% at Jun-04, about 20% at Dec-05, about 11% at Jun-06, about -28% at Dec-07, about -16% at Jun 08E, about -15% at the final point. Series 2: Tech Spending Growth, dashed thick orange line; about 17% at Jun-95, about 19% at Dec-95, about 12.5% at Dec-96, about 17.5% at Jun-97, about 13% at Dec-98, about 18.5% at Jun-99, about 12% at Dec-99, about 18% at Dec-00, about -10% at Jun-01, about -10% at Dec-01, about -4% at Jun-02, about 0% at Dec-02, about 5% at Dec-03, about 11% at Jun-04, about 10% at Jun-05, about 11.5% at Jun-06, about 7% at Jun-07, about 6% at Jun 08E. Legend: boxed in a thin grey rectangle with white fill; black solid line sample followed by S&P 500 EPS Growth; orange dashed line sample followed by Tech Spending Growth. Highlighted points: none. A separate black arrow is drawn at the upper right, pointing right, with no label.
Slide 36
ENTERPRISE INDICATORS / PC UNITS SOLD (Y/Y) / 20% / 15% / 10% / 5% / 0% / -5% / Q3'06 / Q4'06 / Q1'07 / Q2'07 / Q3'07 / Q4'07 / Q1'08 / Q2'08 / W. EUR / U.S. / “IT spending is being more scrutinized now than at any point in the 2003 through 2007 timeframe … customers are showing more caution.” / - EMC, JUL 2008 / “It's now clear that this economic softness is continuing into September.” / - INGRAM MICRO, SEP 2008 / “Market developments of the past several weeks have been dramatic and worrying to many businesses. These concerns triggered a very sudden and unexpected drop in business activity.” / - SAP, OCT 2008 / Source: Gartner Personal Computer Quarterly Statistics Worldwide Database, 5/08. JPMorgan estimates for 2008-2009
Visuals: Line chart. Title: none printed on the slide; the slide title ENTERPRISE INDICATORS serves as heading. Y-axis: 'PC UNITS SOLD (Y/Y)', range -5% to 20%, ticks every 5% (20%, 15%, 10%, 5%, 0%, -5%). X-axis: categorical quarters Q3'06, Q4'06, Q1'07, Q2'07, Q3'07, Q4'07, Q1'08, Q2'08, with the 0% baseline drawn as a black horizontal axis line. Series 1, W. EUR, dark grey line: about 9% (Q3'06), about 7.5% (Q4'06), about 11.3% (Q1'07), about 9.2% (Q2'07), about 17.5% (Q3'07), about 9.5% (Q4'07), about 13.8% (Q2'08 precedes; Q1'08 about 13.8%), about 6% (Q2'08). Series 2, U.S., bright green line: about -2.5% (Q3'06), about -4% (Q4'06), about 2.5% (Q1'07), about 6.5% (Q2'07), about 4.7% (Q3'07), about 9.5% (Q4'07), about 3.7% (Q1'08), about 0.8% (Q2'08). Values are estimates marked 'about' because the slide prints no data labels. Series labels are placed at the right end of each line: 'W. EUR' above the grey line end and 'U.S.' at the green line end. No legend. No highlighted points; the peak of W. EUR at Q3'07 and the crossover at Q4'07 are unmarked. Line weight is heavy, about 4 pt, with round joins; tick marks are short black ticks on the x-axis.
Slide 37
AMAZON.COM & BUY.COM
Amazon.com Financial Performance '99-'05
Buy.com Financial Performance '99-'05
$9,000 / $8,000 / $7,000 / $6,000 / $5,000 / $4,000 / $3,000 / $2,000 / $1,000 / $0 / 80% / 60% / 40% / 20% / 0% / -20% / -40% / $ Mil / 1999 / 2000 / 2001 / 2002 / 2003 / 2004 / 2005 / Revenue / Opex / Revenue Growth / EBIT Margin
$900 / $800 / $700 / $600 / $500 / $400 / $300 / $200 / $100 / $0 / 40% / 30% / 20% / 10% / 0% / -10% / -20% / -30% / -40% / -50% / -60% / $ Mil / 1999 / 2000 / 2001 / 2002 / 2003 / 2004 / 2005 / Revenue / Opex / Revenue Growth / EBIT Margin
•Strong business model / •Focus on core value proposition
•Profitable growth / •Trim fat during lean times
Visuals: Two combo charts sharing the same layout. Left chart: 'Amazon.com Financial Performance '99-'05'. Left axis '$ Mil' from $0 to $9,000 in $1,000 steps; right axis in percent from -40% to 80% in 20% steps; categories 1999 to 2005. Series with about values: Revenue (blue bars) about 1999 $1,640, 2000 $2,760, 2001 $3,120, 2002 $3,930, 2003 $5,260, 2004 $6,920, 2005 $8,490. Opex (red bars) about 1999 $670, 2000 $1,000, 2001 $860, 2002 $880, 2003 $1,000, 2004 $1,180, 2005 $1,580. Revenue Growth (yellow-green line with triangle markers, right axis) about 2000 69%, 2001 12%, 2002 25%, 2003 32%, 2004 30%, 2005 21%; no 1999 point. EBIT Margin (purple line with square markers, right axis) about 1999 -23%, 2000 -12%, 2001 -1%, 2002 3%, 2003 5%, 2004 6%, 2005 5%. No point is highlighted. Legend below in one row: Revenue, Opex, Revenue Growth, EBIT Margin. Right chart: 'Buy.com Financial Performance '99-'05'. Left axis '$ Mil' from $0 to $900 in $100 steps; right axis in percent from -60% to 40% in 10% steps; categories 1999 to 2005. Revenue (blue bars) about 1999 $600, 2000 $790, 2001 $390, 2002 $300, 2003 $240, 2004 $290, 2005 $350. Opex (red bars) about 1999 $125, 2000 $165, 2001 $90, 2002 $55, 2003 $55, 2004 $45, 2005 $50. Revenue Growth (triangles, right axis) about 2000 32%, 2001 -51%, 2002 -22%, 2003 -21%, 2004 22%, 2005 19%; no 1999 point. EBIT Margin (squares, right axis) about 1999 -22%, 2000 -15%, 2001 -11%, 2002 -8%, 2003 -10%, 2004 -4%, 2005 -3%. Legend identical to the left chart. Both charts have light grey horizontal gridlines and no highlighted points. Below the charts a single large light blue down-arrow with a grey-teal outline and a flat shaft, pointing down, with no text inside.
Slide 38
SALESFORCE.COM & SIEBEL
Salesforce.com Financial Performance '00-'05
$ Mil
$350
$300
$250
$200
$150
$100
$50
$0
350%
300%
250%
200%
150%
100%
50%
0%
-50%
-100%
-150%
2000
2001
2002
2003
2004
2005
Revenue
Opex
Revenue Growth
EBIT Margin
Siebel Financial Performance '00-'05
$ Mil
$2,500
$2,000
$1,500
$1,000
$500
$0
25%
20%
15%
10%
5%
0%
-5%
-10%
-15%
-20%
-25%
2000
2001
2002
2003
2004
2005
Revenue
Opex
Revenue Growth
EBIT Margin
•Tailor sales message to environment
•Take advantage of competitors' weakness
•Understand your true customers
•Value of quick ROI and low cost
Visuals: Left chart: combo chart titled 'Salesforce.com Financial Performance '00-'05'. Primary y-axis '$ Mil' from $0 to $350 in $50 steps; secondary y-axis from -150% to 350% in 50% steps. X-axis years 2000 to 2005. Clustered columns: Revenue (blue) and Opex (red). Lines: Revenue Growth (lime green line with triangle markers) and EBIT Margin (slate purple line with square markers). Values, none printed, estimated: Revenue about $5 (2000), $22 (2001), $50 (2002), $96 (2003), $177 (2004), $310 (2005). Opex about $35 (2000), $38 (2001), $50 (2002), $78 (2003), $137 (2004), $220 (2005). Revenue Growth about 315% (2001), 128% (2002), 90% (2003), 83% (2004), 77% (2005). EBIT Margin about -93% (2001), -25% (2002), -2% (2003), 3% (2004), 8% (2005). Right chart: combo chart titled 'Siebel Financial Performance '00-'05'. Primary y-axis '$ Mil' from $0 to $2,500 in $500 steps; secondary y-axis from -25% to 25% in 5% steps. Years 2000 to 2005. Columns: Revenue (blue) and Opex (red). Lines: Revenue Growth (lime green, triangles) and EBIT Margin (slate purple, squares). Values, none printed, estimated: Revenue about $1,820 (2000), $2,090 (2001), $1,635 (2002), $1,355 (2003), $1,340 (2004), $1,425 (2005). Opex about $985 (2000), $1,090 (2001), $970 (2002), $780 (2003), $745 (2004), $780 (2005). Revenue Growth about 14.5% (2001), -21.5% (2002), -17.5% (2003), -0.5% (2004), 6.5% (2005). EBIT Margin about 20.5% (2000), 17.5% (2001), 6.5% (2002), 5% (2003), 10.5% (2004), 10.8% (2005). Legend: one shared legend row under each chart with Revenue (blue bar), Opex (red bar), Revenue Growth (green line with triangle), EBIT Margin (purple line with square). No points are highlighted. Down arrow: a block arrow with light blue fill pointing down, centred under the charts, with a grey-teal outline.
Slide 39
YOUR STREET
WHERE DO WE GO FROM HERE?
DOUG LEONE
SEQUOIA CAPITAL
THE ENTREPRENEURS BEHIND THE ENTREPRENEURS
Visuals: One logo: the Sequoia Capital logo at bottom left of the white band. It shows the wordmark SEQUOIA CAPITAL in bold, widely letter-spaced sans-serif capitals in green #00BE00, with a green stylised leaf emblem in place of the space between A and C, and a registered mark at the top right of CAPITAL. Beneath it, the tagline THE ENTREPRENEURS BEHIND THE ENTREPRENEURS is set in small, widely spaced grey #8C8C8C capitals, also with a small registered mark. No photographs, charts, diagrams or other illustrations.
Slides 40 to 56 continue in the full text file.
Download this deck
The hosted PDF of every library deck is free for readers of the SlideDeck Co newsletter. Join with your email and the viewer and download appear here.
Preparing a strategy presentation of your own? The SlideDeck Co Consulting Deck is a slide library with a statement of work and a worked client case.