
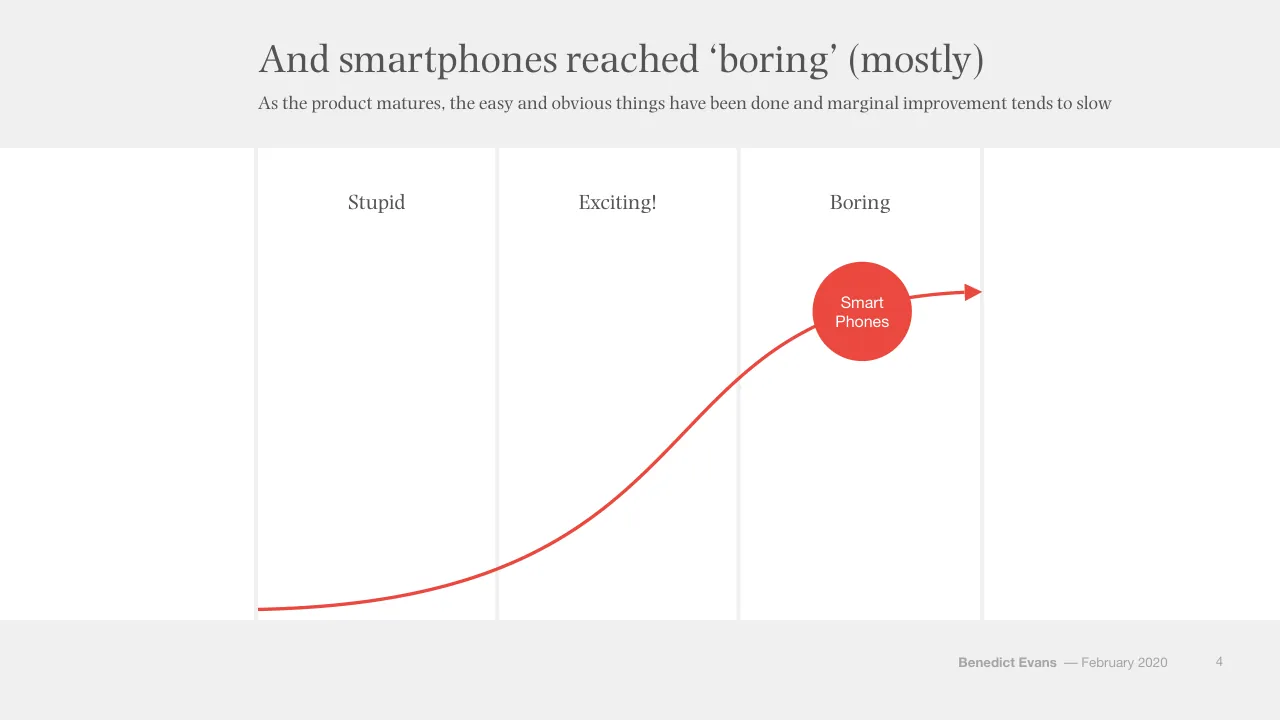
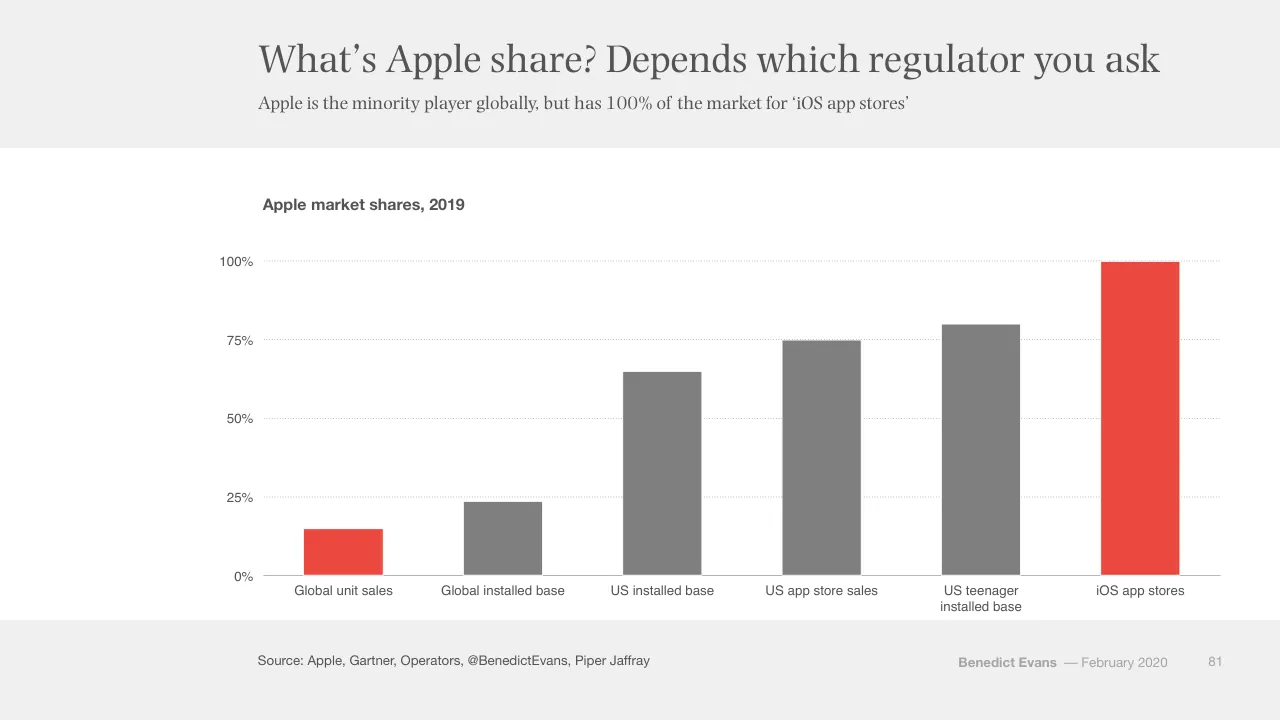
The deck opens with a title slide and then frames the talk around S Curves, showing how technologies move from stupid to exciting to boring and asking what comes after smartphones. It moves into what happens when everyone is online, using ecommerce, TV and platform examples with simple bar and line charts, then covers the next S Curves, and closes with regulation and policy, including anti-trust, digital extraterritoriality and the idea that tech is becoming a regulated industry. The structure is a sequence of section dividers, one-idea slides with headline titles and short subtitles, and recurring diagrams such as the circles and S Curve. Slides worth studying include the S Curve sequence on slides 3 to 6, which builds one diagram across several steps, and the market share breakdowns on slides 79 to 81, where a stacked bar chart carries the argument. The deck ends with a thank-you slide that repeats the title details.
Slides worth studying
Questions about this deck
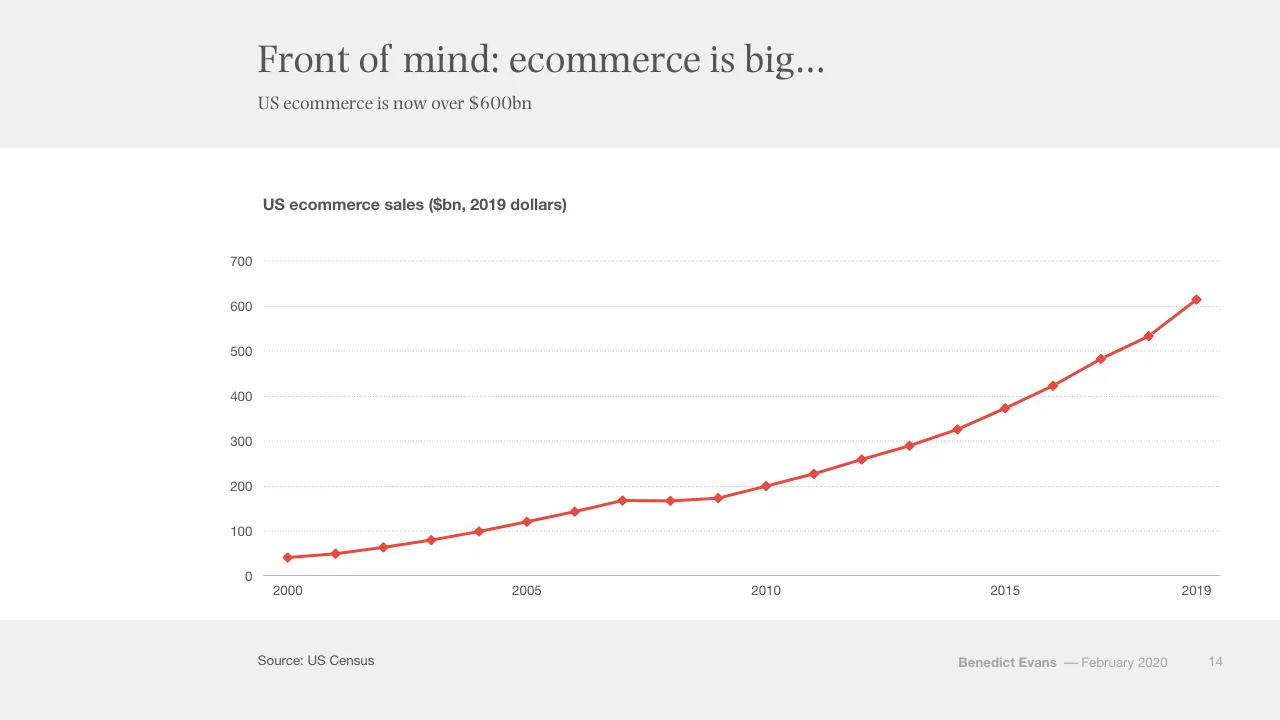
What does the Benedict Evans deck say about US ecommerce sales?
Slide 14 states that US ecommerce is now over $600bn, shown in 2019 dollars. Slide 15 adds that ecommerce is still 'only' 16% of addressable retail.
What does the Benedict Evans deck say about S Curves?
Slide 3 says new technology generally goes from stupid to exciting to boring. Slide 6 asks what the next S Curve will be after smartphones.
What does the Benedict Evans deck say about Amazon's platforms?
Slide 23 states that platforms for others are now a third of Amazon revenue. Slide 24 adds that 60% of sales on Amazon are through the third party marketplace.
How is the Benedict Evans deck structured?
Slide 9 lists three conversations: what happens when everyone is online, what the next S Curves are, and regulation and policy. Section divider slides such as slides 10, 35 and 51 introduce each topic.
Details
- Company: Benedict Evans
- Year: 2020
- Type: Conference talk
- Industry: Technology
- Pages: 126
More from Benedict Evans
- Benedict Evans conference talk, 2026
- Benedict Evans conference talk, Autumn 2025
- Benedict Evans conference talk, Spring 2025
- Benedict Evans conference talk, 2023
- Benedict Evans conference talk, 2023
- Benedict Evans strategy presentation, 2022
All Benedict Evans decks in the library
Review score: 8 out of 10, Strong
Presentation quality, judged with the SlideDeck Co review heuristic. Ask, evidence and idea merit are not rated here.
The deck is a well-built conference talk. Each slide carries one idea under a headline title with a short subtitle, and the argument builds in order: S Curves (3-7), the two then three conversations (8-9), then ecommerce, TV and the 'Is that a tech company?' refrain, then the next S Curves and regulation. The charts are simple and legible, with one red series or a highlighted bar against grey (14, 16, 44, 46), and the S Curve build across 3-6 makes an abstract idea easy to follow. Weaknesses are small type for subtitles, sources and legends at room distance, plain divider and quote slides (13, 30, 34), and a few crowded visuals such as the logo wall on 18 and the stacked bars on 33. I saw only 72 of 126 pages, so the later regulation section is unchecked.
Worth keeping: Keep the S Curve build on slides 3-6 and the recurring circle diagrams, which carry the structure in the spoken talk, along with the red-versus-grey emphasis in the charts.
Most useful repair: Enlarge the subtitles, chart legends and source lines, and replace the illegible logo wall on slide 18 with a few named examples.
What would change the score: I would add direct labels and callouts on the key data points, for example the crossover on slide 38, so the headline claim is visible in the chart itself.
Confidence medium. 72 of 126 pages inspected on contact sheets, 4 at readable size. Reviewed 2026-11-08. Model-assisted review (claude-sonnet-5-5).
Full text of the slides (126 slides)
Every slide's words and a description of its charts and images, so the deck can be searched and rebuilt. Also available as Markdown.
Slide 1
Tech in 2020:
Standing on the shoulders
of giants
Benedict Evans
February 2020
www.ben-evans.com
Slide 2
We connected (almost) everyone
There are 5.5bn adults on earth, 5bn have a phone and 4bn have a smartphone
Global population, 2019 (bn)
6
5
4
3
2
1
0
Global population over 14
Mobile phones
Smartphones
Fully online
Source: World Bank, GSMA, Apple, Google, CNNIC, ITU, @BenedictEvans
Benedict Evans
–– February 2020
2
Visuals: Chart: vertical bar chart, titled 'Global population, 2019 (bn)'. Y axis 0 to 6 in whole-number steps labelled 0, 1, 2, 3, 4, 5, 6 (unit: bn), with light grey dotted horizontal gridlines at each step; a solid grey baseline at 0. X axis categories: 'Global population over 14', 'Mobile phones', 'Smartphones', 'Fully online'. Four bars, values not printed; estimated values: Global population over 14 about 5.7 (grey #7F7F7F); Mobile phones about 5.1 (red #EB483F); Smartphones about 4.0 (red #EB483F); Fully online about 3.5 (pale pink #FBDAD9, the only pale bar, used as a highlight). No legend. Bars are flat rectangles with no outlines, equal width (about 9.3% of slide width) and evenly spaced across the plot (plot spans about x 20.5% to 95%).
Slide 3
New technologies come in S Curves
New tech generally goes from stupid to exciting to boring
Stupid
Exciting!
Boring
Benedict Evans — February 2020
3
Visuals: Line chart-style diagram, no axes or values: a single smooth S-shaped curve drawn as a red stroke of about 0.4% slide height, starting at the bottom-left of the first column (about x 20.1%, y 83.5%) and rising through the second column to end at the right of the third column (about x 76.5%, y 40.0%) with a solid red triangular arrowhead pointing right, about 1.5% wide. The curve is steepest in the middle of the second column, crossing the column gutter near (x 45%, y 69%). Stroke colour red about #E84540. Column labels 'Stupid', 'Exciting!' and 'Boring' sit centred above each column at y 26.7%. No legend, no highlighted points, no photographs or logos.
Slide 4
And smartphones reached ‘boring’ (mostly)
As the product matures, the easy and obvious things have been done and marginal improvement tends to slow
Stupid
Exciting!
Boring
Smart
Phones
Benedict Evans
— February 2020
4
Visuals: A single curved line chart-like diagram with no axes. Shape: a red (#EB483F) S-shaped curve, about 3 px-equivalent stroke, starting at the bottom-left of the middle white band (about x 20%, y 93% of slide height), flattening slightly, rising steeply through the Exciting column and ending at a red filled circle labelled 'Smart / Phones' located in the Boring column at about x 63.2%, y 35.9%, size 8.2% by 14.6% of the slide. From the right edge of the circle a red line continues with a filled red triangular arrowhead pointing right, ending just before the right gutter at about x 75%, y 40%. The curve enters the circle at its left side. No photographs, logos or icons. Columns are plain white rectangles with light grey (#F1F1F1) vertical separators about 0.4% of slide width.
Slide 5
At this stage, we ask how we can use it…
What becomes possible now that smartphones are mature and widely deployed?
Stupid
Exciting!
Boring
Smart
Phones
Benedict Evans
— February 2020
5
Visuals: One diagram: a single grey S-curve (stroke about #7F7F7F, roughly 0.3% of slide height wide) starts at the bottom-left of the white band at about x 20%, y 85%, runs flat then rises steeply through the Exciting column and levels off into the Boring column, ending at a grey filled circle labelled Smart Phones. From the circle's right edge a short solid grey arrow (#7F7F7F) points right to an arrowhead at about x 75.5%, y 40.5%. Three red dotted curved arrows (about #E8393A) fan upward from the right side of the circle, each ending in a small upward-pointing arrowhead at about y 33%, x 60%, 63% and 68%. No photographs, logos or icons.
Slide 6
And we ask what the next S Curve will be
What is the next generational change?
Stupid
Exciting!
Boring
Smart
Phones
?
Benedict Evans — February 2020
6
Visuals: A grey S-curve line (#7F7F7F, about 0.4% of slide height thick) starts at the bottom-left edge of the white band near x 20%, y 85%, flattens, then rises steeply through the Exciting! column and ends at a grey filled circle labelled Smart Phones in the Boring column. From the circle's right edge a short solid grey line with a filled grey triangular arrowhead points right toward the column gutter. Three red dotted curved arrows (#EB483F) fan up and to the right from the circle's right side, each ending in an upward arrowhead, and stop above the Boring column. In the lower right, a pink circle with a dotted red outline contains a bold red question mark, and a dotted red line leaves its right edge and runs off the right edge of the slide. No photographs, logos or icons.
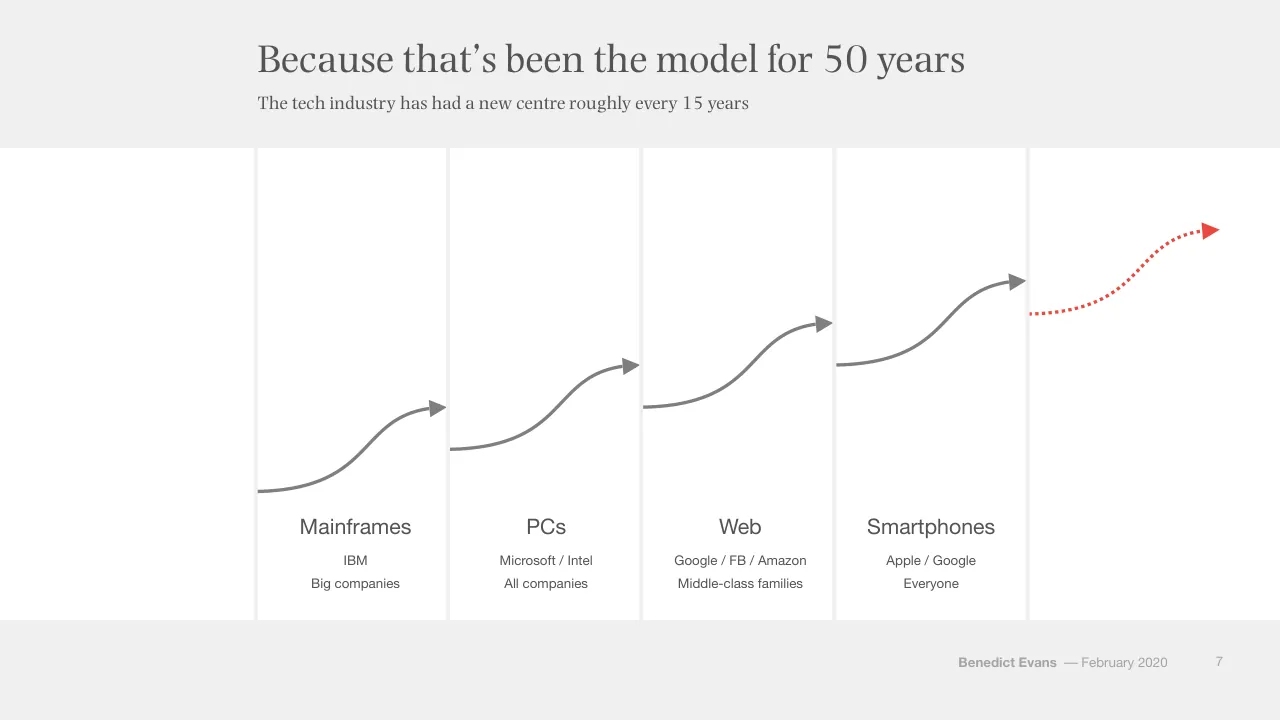
Slide 7
Because that’s been the model for 50 years
The tech industry has had a new centre roughly every 15 years
Mainframes
PCs
Web
Smartphones
IBM
Microsoft / Intel
Google / FB / Amazon
Apple / Google
Big companies
All companies
Middle-class families
Everyone
Benedict Evans
–– February 2020
7
Visuals: Five curved arrows, each a smooth S-shaped stroke that rises from the lower left of one column to an arrowhead at the upper right of the next. Arrows 1 to 4 are solid mid-grey (#808080), about 0.4% of slide height in stroke weight, each ending in a solid grey triangular arrowhead. Arrow 5 is the final rightmost arrow, in red (#E8413C), drawn as a dotted stroke with a solid red triangular arrowhead, starting at the left edge of the fifth column and rising to the upper right. No photographs, logos, charts or icons. Each arrow starts where the previous one ends, forming a continuous stepped rise across the columns.
Slide 8
So, two conversations today / What now and what next? / What happens / when everyone is / online? / What are the next / S Curves? / Benedict Evans / –– February 2020 / 8
Visuals: Two white circles with outlines, each about 22.7% of slide width and 40.4% of slide height. The left circle has a mid-grey outline (about #808080) and the right circle has a dark slate outline (about #2F4A50), both about 0.3% of slide height in stroke width. Each circle holds a centred question in serif type. A third white circle (x 73.6%, y 33.3%) is positioned behind a pale #F2F2F2 rectangle at x 72.0%, y 30.0%, w 25.9%, h 54.1%, so it is not visible in the render. No photographs, charts, icons or logos.
Slide 9
So, two three conversations today
Connecting the world has had consequences far outside tech
What happens
when everyone is
online?
What are the next
S Curves?
Regulation and
policy
Benedict Evans — February 2020
9
Visuals: Three empty circles (shapes, no photographs or charts). Circle 1, left: white fill #FFFFFF, mid-grey outline #808080 about 0.3% of slide height thick, containing the text 'What happens / when everyone is / online?'. Circle 2, centre: white fill #FFFFFF, dark slate outline #37474F about 0.3% thick, containing 'What are the next / S Curves?'. Circle 3, right: white fill #FFFFFF, red outline #E74C3C about 0.3% thick, containing 'Regulation and / policy'. Each circle is 22.7% wide by 40.4% high, so they are ellipses sized to a circle on the slide. No shadows, gradients or icons. The word 'two' in the title is struck through with a single horizontal line in #545454.
Slide 10
What happens when / everyone is online?
Benedict Evans — February 2020
10
Slide 11
Standing on the shoulders of giants
New possibilities at new scale
Density &
penetration
Consumer
expectation
Platforms
Benedict Evans — February 2020
11
Visuals: Three filled red circles, each about 22% of slide width and 39% of slide height, with centred white serif labels: 'Density & penetration', 'Consumer expectation', 'Platforms'. Between circles one and two and between two and three sits a pale right-pointing block arrow in #F2F2F2 with a very low-contrast appearance against the background, about 4% wide and 10.4% tall, with a flat shaft and triangular head. No photographs, charts, or logos.
Slide 12
“Every failed idea from
the dotcom bubble would
work now”
- Marc Andreessen
Benedict Evans — February 2020
12
Slide 13
Front of mind:
ecommerce
Benedict Evans — February 2020
13
Slide 14
Front of mind: ecommerce is big…
US ecommerce is now over $600bn
US ecommerce sales ($bn, 2019 dollars)
700
600
500
400
300
200
100
0
2000
2005
2010
2015
2019
Source: US Census
Benedict Evans
— February 2020
14
Visuals: Chart: line chart with diamond markers, titled 'US ecommerce sales ($bn, 2019 dollars)'. Y-axis: $bn, 0 to 700, gridlines every 100, labels 0, 100, 200, 300, 400, 500, 600, 700. X-axis: years 2000 to 2019, labels shown at 2000, 2005, 2010, 2015, 2019. Single series in red line with red diamond markers; no legend; no values printed. Values about: 2000 about 42; 2001 about 50; 2002 about 64; 2003 about 80; 2004 about 99; 2005 about 120; 2006 about 144; 2007 about 169; 2008 about 167; 2009 about 174; 2010 about 200; 2011 about 228; 2012 about 259; 2013 about 290; 2014 about 327; 2015 about 374; 2016 about 425; 2017 about 482; 2018 about 534; 2019 about 616. Line stroke red approx #EE4036, about 3 px wide. Gridlines dotted light grey. X-axis baseline solid thin grey. No highlighted points.
Slide 15
But still ‘only’ 16% of addressable retail
$600bn is a big number, but US addressable retail is $3.8tr
US retail sales ($tr, 2019 dollars)
Addressable retail*
Ecommerce
4
3
2
1
0
2000
2005
2010
2015
2019
Source: US Census
*Addressable retail = ex. cars, car parts, gasoline, restaurants & bars
Benedict Evans
–– February 2020
15
Visuals: Chart: line chart with markers, rendered as a single image (1441 by 478 px) at x 20.5%, y 36.0%, w 75.1%, h 44.3%. Chart title printed above the plot: US retail sales ($tr, 2019 dollars). Y axis: linear, labelled 0 to 4 in $tr (units from title), gridlines dotted light grey at 1, 2, 3 and 4, with a solid thin grey baseline at 0. X axis: years 2000 to 2019, one point per year, with labels printed at 2000, 2005, 2010, 2015 and 2019. Series 1, Addressable retail*, red line (#E8453C) with red diamond markers; values not printed, so approximate: 2000 about 2.9, 2001 about 2.9, 2002 about 2.95, 2003 about 3.0, 2004 about 3.1, 2005 about 3.2, 2006 about 3.2, 2007 about 3.25, 2008 about 3.1, 2009 about 3.05, 2010 about 3.1, 2011 about 3.15, 2012 about 3.2, 2013 about 3.25, 2014 about 3.3, 2015 about 3.45, 2016 about 3.5, 2017 about 3.6, 2018 about 3.65, 2019 about 3.8. Series 2, Ecommerce, grey line (#A6A6A6) with grey diamond markers; values approximate: 2000 about 0.05, rising gradually to 2010 about 0.2, 2015 about 0.38, 2019 about 0.6. Legend: top-left of chart area at x 4.8%, y 35.5% to 39.5%, showing a red diamond with Addressable retail* and a grey diamond with Ecommerce, stacked vertically. No highlighted points; no annotations.
Slide 16
Globally, the USA is in the middle of the pack
China leapfrogged physical retail, while the UK and SK are also far ahead of the USA
Ecommerce share of retail, 2019
30%
25%
20%
15%
10%
5%
0%
China
UK
SK
USA
France
Japan
Germany
Russia
Brazil
India
Source: McKinsey, BLS
Benedict Evans
–– February 2020
16
Visuals: Bar chart, vertical columns. Title: 'Ecommerce share of retail, 2019' (bold, left-aligned above the plot). Value axis: 0% to 30%, labelled every 5% (0%, 5%, 10%, 15%, 20%, 25%, 30%), dotted light-grey gridlines at each labelled value. Category axis: countries, no axis title. No data labels are printed on the bars; values below are estimates marked 'about' from bar heights. Series, left to right: China about 25%; UK about 22%; SK about 21.5%; USA about 14%; France about 10%; Japan about 9%; Germany about 9%; Russia about 5%; Brazil about 4%; India about 3%. No legend (single series). Highlighted point: the USA bar is red #EC473F while all other bars are mid grey #7F7F7F. Bars are solid rectangles of equal width (about 3% of slide width), with gaps of about 4.5% between them, sitting on a thin grey baseline at 0%.
Slide 17
Expanding what ecommerce means
Ecommerce has evolved past commodity products in brown cardboard boxes
Books, commodities
Anything
One model
Many models
Capital
Platforms
Benedict Evans — February 2020
17
Visuals: Three horizontal dotted red arrows, one in each white band. Each is a straight dotted line with a solid filled triangular arrowhead at its right end, about 49% to 65% of slide width, drawn in a red roughly #E8473F with small round dots. Arrow 1 sits at about 30% of slide height in the first band, arrow 2 at about 53% in the second band, and arrow 3 at about 76% in the third band. No photographs, logos, charts or icons.
Slide 18
Powering the ‘D2C’ explosion…
Several hundred (at least) new online-only or online-first brands
Benedict Evans
–– February 2020
18
Visuals: One large logo-grid graphic (the IAB '250 Direct Brands to Watch' chart) occupying the whole panel. Top-left cell is a light grey (#DCDCDC) box holding the IAB logo: a dark grey/black and red triangular arrow mark with 'iab.' in white, a large white '250' and red 'BRANDS' with black 'DIRECT' and 'TO WATCH'. Below it, the three columns are organised under red category bars (#E63329) with white bold capital labels and a white pictogram icon at left of each label. Column 1, APPAREL & FASHION (shirt icon): ADAY, ADORE ME, allbirds, American Giant, AURATE, AYR / BAUBAX, betabrand, BOMBAS, BOMBFELL, BOON+GABLE / BOW & DRAPE, BUCK MASON, bucketfeet, CAIRN, CARBONÉ / chubbies, COMBATANT GENTLEMEN, cotopaxi, CUYANA, DSTLD, DAGNE DOVER / Dia&Co, DOLLS KILL, DRAPER JAMES, Ella, EVERLANE, falyfirfun / fabkids, FAME PARTNERS, FIVE FOUR, FOOTCARDIGAN, gwynnie bee / HARPER WILDE, HICKIES, Huckberry, Hushmail, unlabelled circular logo, JACK ERWIN / KNOTSTANDARD, KOIO, LEDBURY, LIVELY, M.GEMI / MM.LAFLEUR, MACK WELDON, McUndies, MINISTRY OF SUPPLY, MIZZEN+MAIN, unlabelled rhino logo / nineWEST, Neighborhood Goods, NISOLO, ORCHARD MILE, OCO (Original Sign), OUTDOOR VOICES / Pale Fire-style script logo, PISTOL LAKE, plae, POSHMARK, primary, R circle logo, Reformation / unlabelled square logo, R, ROCKETS OF AWESOME, ROTHY'S, schoola, Slingry-style red script, SOCK101 / SOLE/SOCIETY, STANCE, STITCH FIX, sweatystyle, TAFT, TIMBERMELLON-style script / TECOVAS, The RealReal, THESIS, THIRDLOVE, THURSDAY BOOTS, TOMBOY X / Tommy John, Tracksmith, TRND BTLR, TRUE, UNTUCKit, WANTABLE, pact / yellowberry. Column 2 stack: BABY CARE & PARENTING (stroller icon): blume, a circular badge logo, Owlet Baby Care, seesaw. BEAUTY (jar icon): B (Beauty Counter), BEAUTYLISH, BOXYCHARM, Curology, FACETORY, a script 'f' logo / GLAMSQUAD, Glossier., ipsy, LOLI, MADISON REED, a dotted circular logo / S logo, MEMEBOX, OARS + ALPS, PINROSE, SCENTBIRD. BEER/WINE/ALCOHOL (glass icon): BREW PUBLIC, BRIGHT CELLARS, a red orange logo, Flaviar, a round dark logo, Splash, VINEBOX, Winc. EDUCATION (mortarboard icon): CODE COMBAT, Educents, LittleBits, Surprise Ride, verseone. FOOD/BEVERAGE/HOUSEHOLD/PET (plate icon): ALOHA, BARK BOX, BEAN BOX, blissmo, Blue Apron, a round logo, BULLETPROOF / Bulu Box, CALIFIA FARMS, CANDY CLUB, cleancult, CRAFT COFFEE, CC, DAILY HARVEST / DESERT FARMS, DIRTY LEMON, doggyloot, DOORDASH, FRESHLY, FUEGO BOX, Gobble / GREEN CHEF, a round logo, HEALTH-ADE KOMBUCHA, HOME CHEF, SUNDAY HARVEST, a round logo, KETTLEBELL KITCHEN / Love with Food, MUNCHERY, NATUREBOX, NOW NOW, ollie, POSTMATES / Pre, PRETTY LITTLE THING, RevereHealth, ripple, soylent, Sudden Coffee / SUN BASKET, Wag!, THE FARMER'S DOG, THRIVE MARKET, truBRAIN, PET THE WORLD, ub / YUMI. Column 3: HOBBIES & LIFESTYLE (camera icon): an orange logo, ALEHA OUTFIT, BAUBLEBAR, a script logo, DATE BEX, FANCHEST, a colourful circle logo / Kiwi Co, KUIU, LOCKERTIE, LUGLOC, MOMENT, NOMATIC, Osmo / PARAVEL, and carrots, ROBB VICES, rocksbox, a dark square logo, TRUE FACET, VAPORLAB. HOME & APPLIANCE (house icon): ARTLIFTING, AWAY, BRANDLESS, BOLL & BRANCH, brooklinen / BURROW, Casper, donnymy, FRAMEBRIDGE, greetabl, Grove, a blue H logo / a grey square logo, JOYBIRD, leesa, PARACHUTE, SNOWE, a T logo, ULGALLERY. PERSONAL CARE (bottle icon): billie, BIRCHBOX, CANDID, DOLLAR SHAVE CLUB, EARGO, GOBY / H', hims, HUBBLE, KOPARI, LOLA, NATIVE, quip / SimpleContacts, smile, TEADORA, THINX, WARBY PARKER. WELLNESS & FITNESS (heart icon): AliveCor, BuckBrushCo, CAPSULE, care/of, an E logo, GoNoodle / green gorilla, HELLOFLO, HVMN, Keeps, monthly gift, ONE DROP / PELOTON, Ritual, uplift, VIREO, vitafive, zeel.
Slide 19
And huge new ecommerce platforms
Independent ecommerce is now so big that the enabling platforms are worth tens of billions
Shopify market / cap is $46bn
Stripe valued at / $35bn
Instagram, / YouTube…
Source: Bloomberg, Companies
Benedict Evans — February 2020 19
Visuals: Three identical filled circles in a horizontal row, each about 22.7% of slide width and 40.4% of slide height (solid circles, not outlined), colour #EB483F, flat with no shadow or gradient. Left circle at x 19.1%, middle at x 46.4%, right at x 73.6%, all at y 33.3%. Each circle contains centred white serif text. No photographs, charts, logos or icons.
Slide 20
Shopify has come from nowhere to $60bn of GMV / $60bn of sales on the platform, with over a million merchants, from the long tail to Unilever and Pepsico / Shopify GMV ($bn) / 70 / 60 / 50 / 40 / 30 / 20 / 10 / 0 / 2014 / 2015 / 2016 / 2017 / 2018 / 2019 / Source: Shopify / Benedict Evans — February 2020 / 20
Visuals: Bar chart titled 'Shopify GMV ($bn)'. Vertical axis labelled in $bn with gridlines at 0, 10, 20, 30, 40, 50, 60 and 70 (range 0 to 70), drawn as light grey dotted horizontal lines with a solid thin grey baseline at 0. Horizontal axis shows years 2014, 2015, 2016, 2017, 2018 and 2019 with no axis title. One series of six red bars, no data labels printed; values are read against the gridlines: 2014 about 3.6, 2015 about 7.4, 2016 about 15.1, 2017 about 26.1, 2018 about 40.8, 2019 about 60.9. No legend and no highlighted points; all bars share the same colour #EB483F.
Slide 21
Meanwhile: Amazon! / Amazon’s revenue continues to grow at 20% a year / Amazon annual revenue ($bn) / 300 / 250 / 200 / 150 / 100 / 50 / 0 / 1995 / 2000 / 2005 / 2010 / 2015 / 2019 / Source: Amazon / Benedict Evans — February 2020 / 21
Visuals: Chart: line chart with diamond markers, titled 'Amazon annual revenue ($bn)' in bold sans-serif above the plot. Y-axis: revenue in $bn, range 0 to 300, labelled ticks at 0, 50, 100, 150, 200, 250, 300, with light dotted horizontal gridlines at each labelled tick. X-axis: calendar years 1995 to 2019, one point per year (25 points), labelled ticks at 1995, 2000, 2005, 2010, 2015 and 2019; a thin solid grey baseline sits at 0. No legend; single series. No values are printed on the points, so values are estimates marked about: 1995 about 0; 1996 about 0.5; 1997 about 1; 1998 about 1.5; 1999 about 2; 2000 about 3; 2001 about 3.5; 2002 about 4.5; 2003 about 5.5; 2004 about 7; 2005 about 8.5; 2006 about 11; 2007 about 15; 2008 about 19; 2009 about 25; 2010 about 34; 2011 about 48; 2012 about 61; 2013 about 74; 2014 about 89; 2015 about 107; 2016 about 136; 2017 about 178; 2018 about 233; 2019 about 280. Line is red (#E8453C) about 3 px thick with red diamond markers. No highlighted points beyond the endpoint trend.
Slide 22
Though only half is direct ecommerce / But it has become about more than just plain ecommerce / Amazon annual revenue ($bn) / Revenue / Ecommerce / 300 / 250 / 200 / 150 / 100 / 50 / 0 / 1995 / 2000 / 2005 / 2010 / 2015 / 2019 / Source: Amazon / Benedict Evans / –– February 2020 / 22
Visuals: One line chart, titled 'Amazon annual revenue ($bn)'. Type: line chart with diamond markers. Y axis: 0 to 300 in steps of 50, unit $bn, labels at left, dotted light grey horizontal gridlines at each step. X axis: years 1995 to 2019, labels at 1995, 2000, 2005, 2010, 2015 and 2019, solid thin grey baseline at 0. Series 1 'Revenue' (red, one point per year 1995 to 2019): about 0 in 1995, about 0 in 1996, about 1 in 1997, about 1 in 1998, about 2 in 1999, about 3 in 2000, about 3 in 2001, about 4 in 2002, about 5 in 2003, about 7 in 2004, about 8 in 2005, about 11 in 2006, about 15 in 2007, about 19 in 2008, about 25 in 2009, about 34 in 2010, about 48 in 2011, about 61 in 2012, about 75 in 2013, about 89 in 2014, about 107 in 2015, about 136 in 2016, about 178 in 2017, about 233 in 2018, about 281 in 2019. Series 2 'Ecommerce' (grey, one point per year 2014 to 2019): about 69 in 2014, about 77 in 2015, about 92 in 2016, about 108 in 2017, about 123 in 2018, about 141 in 2019. No values are printed on the slide; all values are estimates. Legend: top-left of the chart, red diamond marker labelled Revenue above grey diamond marker labelled Ecommerce. Highlighted points: none; the last point of each series (2019) is the highest point on its line.
Slide 23
Platforms for others are now a third of Amazon revenue / Amazon is building growth by leveraging its platforms for other companies / Amazon revenue, 2019 ($bn) / 150 / 125 / 100 / 75 / AWS / 50 / Ads & Other / Marketplace / Stores / 25 / Subscriptions / 0 / First party ecommerce / Platform / Other / Source: Amazon / Benedict Evans / — February 2020 / 23
Visuals: Stacked column chart, titled 'Amazon revenue, 2019 ($bn)'. Y-axis: linear, $bn, 0 to 150, labelled at 0, 25, 50, 75, 100, 125, 150, with light dotted horizontal gridlines at each label. X-axis: three categories, 'First party ecommerce', 'Platform', 'Other', with a thin solid grey baseline at 0. Series and values (no values printed on the slide; estimates marked about): First party ecommerce is a single solid grey segment, about 141. Platform is a stack of Marketplace (bottom, red, about 54) and AWS (top, pale pink, about 35), total about 89. Other is a stack of Subscriptions (bottom, mid grey, about 19), Stores (middle, lighter grey, about 17) and Ads & Other (top, very light grey, about 14), total about 50. Segments are separated by thin white lines. No legend; each segment carries its name as an inside label. Highlighted points: none; the red Marketplace segment is the only saturated colour and stands out against the greys. Bars are flat, unshaded and have no outlines; they are about 10% of slide width each, with generous gaps.
Slide 24
Amazon is a platform for others / 60% of sales on Amazon are through the third party marketplace / Amazon GMV ($bn) / Marketplace / First party ecommerce / 300 / 250 / 200 / 150 / 100 / 50 / 0 / 2014 / 2015 / 2016 / 2017 / 2018 / Source: Amazon, @BenedictEvans / Benedict Evans — February 2020 / 24
Visuals: Chart: stacked column chart, titled 'Amazon GMV ($bn)' (bold sans, top left of plot). Y axis: $bn, range 0 to 300, labelled ticks at 0, 50, 100, 150, 200, 250, 300, with light dotted horizontal gridlines at each tick. X axis: years 2014, 2015, 2016, 2017, 2018, categories with no axis title; baseline is a thin grey line at 0. Two series stacked per column: bottom series 'First party ecommerce' in grey #7F7F7F, top series 'Marketplace' in red #EB483F. Values are not printed on the slide, so estimates: First party ecommerce about 65 (2014), about 72 (2015), about 86 (2016), about 102 (2017), about 122 (2018); Marketplace about 62 (2014), about 76 (2015), about 101 (2016), about 131 (2017), about 170 (2018); totals about 127, 149, 187, 233, 292. Legend: top entry red square 'Marketplace', below it grey square 'First party ecommerce', at top left of chart. Highlighted points: none. Bars are flat, thin white separators between segments, no data labels.
Slide 25
Amazon is now taxing product search / Amazon has built a $10bn+ ‘search ad’ business – retailers just call this marketing / Amazon ‘Advertising & other’ revenue ($bn) / 15 / 10 / 5 / 0 / 2014 / 2015 / 2016 / 2017 / 2018 / 2019 / Source: Amazon / Benedict Evans — February 2020 / 25
Visuals: Vertical bar chart, single series, red bars (#EC473F), no data labels. Chart title above the plot: 'Amazon ‘Advertising & other’ revenue ($bn)'. Y axis: labelled 0, 5, 10, 15 ($bn), range 0 to about 15 to 16, with faint dotted horizontal gridlines at 5, 10 and 15. X axis: years 2014, 2015, 2016, 2017, 2018, 2019 with a thin grey baseline at 0. Bar values are not printed; about 1.3 for 2014, about 1.7 for 2015, about 2.9 for 2016, about 4.7 for 2017, about 10.1 for 2018 and about 14.1 for 2019. No legend. No highlighted points; all bars share the same colour.
Slide 26
New retailing means new taxes
If you’re not paying rent for a store (or in one), how do people hear about you?
Amazon sells / placement for / $10bn
Booking & / Expedia pay / Google $10bn
Source: Companies
Benedict Evans
–– February 2020
26
(Hidden under a #F1F1F1 box, white text not visible in render: Kylie Jenner's / make-up / business: / $1bn ; But Macy's / and Walmart / did all this too)
Visuals: Two solid red circles (#EB483F), each about 16.2% of slide width and 28.8% of slide height, placed side by side with a gap of about 3.9% of slide width between them. Circle 1 (left) reads Amazon sells placement for $10bn in white serif text, centred. Circle 2 (second from left) reads Booking & Expedia pay Google $10bn in white serif text, centred. Two further identical red circles at about x 59.7% and x 79.8% are present in the file but are covered by a #F1F1F1 rectangle at x 57.7%, y 32.6%, w 40.9%, h 41.9%, so they are not visible; their white text (Kylie Jenner's make-up business: $1bn and But Macy's and Walmart did all this too) is also covered. No photographs, charts, logos or icons.
Slide 27
New retailing means new taxes
If you’re not paying rent for a store (or in one), how do people hear about you?
Amazon sells
placement for
$10bn
Booking &
Expedia pay
Google $10bn
But Macy’s &
Walmart did
this too
Source: Companies
Benedict Evans
— February 2020
27
Visuals: Three flat filled circles in a row, each about 16.2% wide and 28.8% high (so roughly circular, slightly taller than wide in the file's proportions as measured). Circle 1 at x 19.4%: grey #7F7F7F, with white serif text 'Amazon sells / placement for / $10bn'. Circle 2 at x 39.6%: grey #7F7F7F, with white serif text 'Booking & / Expedia pay / Google $10bn'. Circle 3 at x 59.7%: red #EB483F, with white serif text 'But Macy’s & / Walmart did / this too'. The title's words 'New' and 'new' carry a horizontal strikethrough line in #545454 (about 0.2% high), crossing the middle of each word. A fourth red circle at x 79.8% is placed in the file but is hidden behind a background-coloured #F1F1F1 rectangle at x 78.9% to 98.6%, y 32.6% to 74.5%, so it does not show. No photographs, logos or icons.
Slide 28
Unless you have a new route to awareness
If you’re not paying rent for a store (or in one), how do people hear about you?
Amazon sells
placement for
$10bn
Booking &
Expedia pay
Google $10bn
But Macy’s &
Walmart did
this too
Kylie Jenner’s
make-up
business:
$1.2bn
Source: Companies
Benedict Evans –– February 2020
28
Visuals: Four solid circles in one row, each about 16.2% wide by 28.8% tall (close to circular on the 16:9 slide). Circles 1 to 3 are mid grey #7F7F7F; circle 4 on the far right is red #EB483F. Each circle carries a centred white serif label reading, from left to right: 'Amazon sells placement for $10bn', 'Booking & Expedia pay Google $10bn', 'But Macy’s & Walmart did this too', and 'Kylie Jenner’s make-up business: $1.2bn'. No chart, photograph, logo or icon.
Slide 29
Get it wrong? Go to the mattresses
A vacuum-packed mattress was a brilliant idea until everyone else did it
Source: GoodBed.com
Benedict Evans — February 2020
29
2019: there are
175 online
mattress
companies
Visuals: Three circular images in a row, each about 20.7% of slide width and 36.8% of slide height, with a thin grey outline. Left: a cropped, full-circle photograph of a colourful retail mattress sale flyer, with a blue starburst background, large white-and-red block letters reading 'BIGGEST MATTRESS SALE EVER' (partly cut off as 'IGEST' and 'ATTRESS'), red starbursts and price stickers ('$699', '$1199', '$649', '$1399', '$879 OFF', '$1000 OFF', '$1170 OFF'), and red banners reading 'FREE Set-Up' and 'FREE Recycling'; dominant colours blue, white, red and yellow. Middle: a photograph of a white-and-blue striped cardboard box partly open with a white pillow on a dark mattress on a black metal bed frame, lettering 'Casper' on the box, pale wooden floor, grey wall panelling; soft natural light, dominant colours white, navy, grey and light wood. Right: a plain white circle with a 2.5px-ish red (#E74C3C-like) outline containing the text statement. Between circles: two solid grey (#B3B3B3) right-pointing block arrows, about 6% of slide width each, flat with no shadow.
Slide 30
Is that a ‘tech’ company?
Or is it a mattress company with a website?
Benedict Evans — February 2020 30
Slide 31
Welcome to retail
The internet is not the first new retail format
US retail sales ($bn, 2019 dollars)
Department stores
Ecommerce
Warehouse clubs
600
450
300
150
0
1995
2000
2005
2010
2015
2018
Source: US Census
Benedict Evans
–– February 2020
31
Visuals: Line chart, titled 'US retail sales ($bn, 2019 dollars)', with three series plotted as lines with diamond markers, 1995 to 2018. Y-axis is labelled 0, 150, 300, 450, 600 ($bn, 2019 dollars); plot range 0 to about 600, with faint dotted horizontal gridlines at 150, 300, 450 and 600 and a solid thin grey baseline at 0. X-axis is labelled 1995, 2000, 2005, 2010, 2015, 2018 with a solid thin grey baseline. Series 1, Department stores (red #E8453C diamonds and line): about 150 in 1995, 150 in 1996, 151 in 1997, 149 in 1998, 150 in 1999, 143 in 2000, 132 in 2001, 126 in 2002, 119 in 2003, 113 in 2004, 108 in 2005, 101 in 2006, 94 in 2007, 84 in 2008, 76 in 2009, 77 in 2010, 75 in 2011, 70 in 2012, 67 in 2013, 65 in 2014, 63 in 2015, 58 in 2016, 53 in 2017, 49 in 2018 (all values about). Series 2, Ecommerce (light grey #A6A6A6 diamonds and line): starts 2000 at about 41, then about 49 in 2001, 63 in 2002, 79 in 2003, 97 in 2004, 120 in 2005, 143 in 2006, 166 in 2007, 165 in 2008, 171 in 2009, 198 in 2010, 227 in 2011, 258 in 2012, 289 in 2013, 326 in 2014, 370 in 2015, 424 in 2016, 483 in 2017, 534 in 2018 (all values about). Series 3, Warehouse clubs (dark grey #4D4D4D diamonds and line): about 108 in 1995, 119 in 1996, 131 in 1997, 154 in 1998, 182 in 1999, 208 in 2000, 236 in 2001, 274 in 2002, 303 in 2003, 331 in 2004, 359 in 2005, 377 in 2006, 401 in 2007, 414 in 2008, 425 in 2009, 436 in 2010, 441 in 2011, 454 in 2012, 461 in 2013, 467 in 2014, 476 in 2015, 478 in 2016, 484 in 2017, 489 in 2018 (all values about). Legend: top-to-bottom Department stores (red diamond), Ecommerce (light grey diamond), Warehouse clubs (dark grey diamond). No highlighted points; the Ecommerce and Warehouse clubs lines cross near 2018 and near 1998 and 2005 is where Ecommerce passes Department stores.
Slide 32
“Over half of our store sales involve an online / journey, and over a third of our online sales / involve a store experience” / - Erik Nordstrom / Benedict Evans –– February 2020 / 32
Slide 33
Retail isn’t as binary as ‘online’ and ‘offline’
Online, yes, but also rent, distance to customer, service, selection, staff costs, urgency, margin, inventory, etc, etc
US retail sales by retailer category, 2018
100%
Non-addressable retail
75%
50%
Addressable retail
25%
Ecommerce
0%
'Online versus offline'
'Retail'
Source: US Census, @BenedictEvans
*Addressable retail = ex. cars, car parts, gasoline, restaurants & bars.
Benedict Evans —– February 2020
33
Visuals: Chart: 100% stacked column chart titled 'US retail sales by retailer category, 2018'. Y-axis runs 0% to 100% in 25% steps with faint dotted horizontal gridlines at 25, 50, 75 and 100%. X-axis categories are 'Online versus offline' (left column) and 'Retail' (right column). Left column, bottom to top: Ecommerce, about 9% (red #EB483F, label 'Ecommerce' in white); Addressable retail, about 50% (mid grey #7F7F7F, label 'Addressable retail' in white), spanning about 9% to 59.5%; Non-addressable retail, about 40% (light grey #A6A6A6, label in white), spanning about 59.5% to 100%. Right column, bottom to top, all segments separated by thin white rules: about 8.5% Ecommerce red #EB483F; about 2% red #EB483F; about 1% red #EB483F; about 6% salmon #F3918C; about 6% salmon #F3918C; about 5% salmon #F3918C; about 1% salmon #F7B6B2; about 1% dark red #C0272D; about 1% pale salmon #F7B6B2 (near 40 to 42%); about 13% salmon #F4A3A0 region (about 42 to 54%) in #F7B6B2; about 1.5% #F7B6B2; about 3% pale pink #F4D3D3; about 15% pale pink #F4D3D3 (about 59.5 to 79%); about 12% salmon #F7B6B2 (about 79 to 91.5%); about 8% very pale pink #FBDAD9 (about 91.5 to 100%). No printed values are shown for any segment, so all sizes are estimates. No legend. No highlighted points. Segment labels appear only on the left column and the bottom red segment of the right column is unlabelled. No logos, icons or photographs.
Slide 34
Is that a ‘tech’ company?
Or is it a retailer using a new channel?
Benedict Evans — February 2020 34
Slide 35
Front of mind:
TV
Benedict Evans — February 2020
35
Slide 36
Front of mind: unbundling TV / YouTube launched in 2004 – a decade later, US TV finally unlocked / Annual change in US pay TV subscriptions / 2% / 0% / -2% / -4% / -6% / -8% / 2011 / 2012 / 2013 / 2014 / 2015 / 2016 / 2017 / 2018 / 2019 / Source: JP Morgan / Benedict Evans –– February 2020 / 36
Visuals: Chart: line chart with markers, titled 'Annual change in US pay TV subscriptions'. Y-axis: percent, labelled 2%, 0%, -2%, -4%, -6%, -8%, with horizontal dotted gridlines at each label; range from -8% to about +3%; the bottom axis line sits at -8%. X-axis: years 2011 to 2019, one category per year, solid grey baseline. One series, drawn as a red line (about 3pt) with small red diamond markers at each year. Values are not printed; estimated values: 2011 about +0.2%, 2012 about +0.4%, 2013 about -0.1%, 2014 about -0.5%, 2015 about -1.9%, 2016 about -2.2%, 2017 about -3.7%, 2018 about -4.4%, 2019 about -7.3%. No legend. No highlighted points beyond the uniform markers; the steepest drop is between 2018 and 2019. Chart has no border and sits on the white band.
Slide 37
US pay TV subs down 20% and falling / For generations, most of the US was sold a big and expensive pay TV bundle - this is now breaking apart / US pay TV subscriptions (m) / Incumbents / Netflix / 100 / 75 / 50 / 25 / 0 / 2011 / 2012 / 2013 / 2014 / 2015 / 2016 / 2017 / 2018 / 2019 / Source: JP Morgan, Netflix / Benedict Evans / –– February 2020 / 37
Visuals: One line chart. Chart title: 'US pay TV subscriptions (m)' in bold, top-left above the plot. Y axis: subscriptions in millions, linear, range 0 to 100 (labelled 0, 25, 50, 75, 100) with light dotted horizontal gridlines at each 25 step. X axis: years 2011 to 2019, one category per year, with a solid thin grey baseline at 0. Series 1 'Incumbents' in red with diamond markers, values about: 2011 98, 2012 99, 2013 99, 2014 98, 2015 96, 2016 94, 2017 91, 2018 87, 2019 81 (no values printed; estimates). Series 2 'Netflix' in grey with diamond markers, values about: 2011 20, 2012 25, 2013 31, 2014 37, 2015 43, 2016 48, 2017 53, 2018 58, 2019 61 (no values printed; estimates). No data labels, no highlighted points. Legend at upper left of the chart, outside the plot, with red diamond 'Incumbents' above grey diamond 'Netflix'. Source of data printed in footer: JP Morgan, Netflix.
Slide 38
And TV is changing a lot faster than retail
US cord-cutting % has passed ecommerce % in just 5 years
Digital change in US retail and TV
Cord cutting
Ecommerce
20%
15%
10%
5%
0%
2000
2005
2010
2015
2019
Source: US Census, JP Morgan, @BenedictEvans
Benedict Evans — February 2020
38
Visuals: One line chart, titled 'Digital change in US retail and TV' (bold sans, left-aligned above the plot). Y axis: percentage from 0% to 20% in 5% steps, gridlines dotted light grey at each 5% step; no axis unit label beyond the % signs. X axis: years 2000 to 2019 (labels printed at 2000, 2005, 2010, 2015, 2019), one point per year. Series 1 'Cord cutting' is a red (#E8443A approx) line with red diamond markers, starting 2014 and running to 2019; values about 0.5% (2014), 2.4% (2015), 4.6% (2016), 8.1% (2017), 12.2% (2018), 18.6% (2019), all estimates as no values are printed. Series 2 'Ecommerce' is a grey (#A6A6A6 approx) line with grey diamond markers from 2000 to 2019; values about 1.2% (2000), 1.5% (2001), 1.9% (2002), 2.3% (2003), 2.8% (2004), 3.2% (2005), 3.8% (2006), 4.4% (2007), 4.5% (2008), 4.9% (2009), 5.5% (2010), 6.0% (2011), 6.7% (2012), 7.5% (2013), 8.3% (2014), 9.5% (2015), 10.7% (2016), 11.9% (2017), 12.8% (2018), 15.0% (2019); all estimates. Legend at upper left of the chart: red diamond 'Cord cutting' above grey diamond 'Ecommerce'. The 2019 red and grey points are the highlighted end points where cord cutting (about 18.6%) passes ecommerce (about 15.0%); the lines cross between 2018 and 2019. Horizontal baseline at 0% in mid grey.
Slide 39
Teen share down by half / Pay TV share of US teen viewing hours is down by half in three years / US teen daily video consumption share / Pay TV / Netflix / Youtube / 40% / 30% / 20% / 10% / 0% / Mar-16 / Sept-16 / Mar-17 / Sept-17 / Mar-18 / Sept-18 / Mar-19 / Sept-19 / Source: Piper Jaffray / Benedict Evans — February 2020 / 39
Visuals: Line chart titled 'US teen daily video consumption share', with three series drawn with diamond markers and straight segments. Y axis is percentage share from 0% to 40% in 10% steps, with dotted horizontal gridlines at 10%, 20%, 30% and 40%. X axis is categorical time points from Mar-16 to Sept-19 at six-month intervals (Mar-16, Sept-16, Mar-17, Sept-17, Mar-18, Sept-18, Mar-19, Sept-19). Pay TV (red #E8453C line and markers): about 26% Mar-16, about 25% Sept-16, about 23% Mar-17, about 22% Sept-17, about 20% Mar-18, about 16% Sept-18, about 14% Mar-19, about 12% Sept-19; values are estimates as the slide prints none. Netflix (light grey #A6A6A6 line and markers): about 38% Mar-16, about 37% Sept-16, about 38% Mar-17, about 37% Sept-17, about 39% Mar-18, about 38% Sept-18, about 37% Mar-19, about 35% Sept-19. Youtube (dark grey #545454 line and markers): about 23% Mar-16, about 26% Sept-16, about 26% Mar-17, about 29% Sept-17, about 30% Mar-18, about 33% Sept-18, about 32% Mar-19, about 37% Sept-19. Legend at left with diamond swatches: Pay TV (red), Netflix (grey), Youtube (dark grey). No points are highlighted. Chart has no visible axis titles beyond the chart title.
Slide 40
Begun, the content wars have
A third of US 2019 content spending came from streaming companies
US annual content budgets, 2019 ($bn)
Sport
Entertainment
20
15
10
5
0
Disney
Comcast/NBCU
Netflix
ViacomCBS
Warner
Amazon
Fox
Sony
Discovery
Apple
Source: UBS
Benedict Evans
–– February 2020
40
Visuals: Chart: stacked column chart titled 'US annual content budgets, 2019 ($bn)'. Y axis runs from 0 to 20 in steps of 5 ($bn), with dotted horizontal gridlines at 5, 10, 15 and 20 and a solid baseline at 0. X axis lists ten companies left to right: Disney, Comcast/NBCU, Netflix, ViacomCBS, Warner, Amazon, Fox, Sony, Discovery, Apple. Two series: Entertainment (dark grey #7F8080, bottom segment) and Sport (light grey #A6A5A6, top segment). Netflix, Amazon and Apple columns are filled red #EC473F instead, and their Sport segments, if any, are light red. Values are estimates from the image (no values are printed): Disney Entertainment about 10.5, Sport about 7.7, total about 18.2; Comcast/NBCU Entertainment about 10.9, Sport about 5.7, total about 16.6; Netflix single red bar about 15.0; ViacomCBS Entertainment about 10.9, Sport about 1.9, total about 12.8; Warner Entertainment about 8.3, Sport about 2.4, total about 10.7; Amazon red about 7.1 with a thin light-red top to about 7.5; Fox Entertainment about 2.5, Sport about 4.3, total about 6.8; Sony Entertainment about 3.5, Sport about 0.3, total about 3.8; Discovery Entertainment about 3.0 only; Apple red about 2.1. Legend at upper left: Sport swatch above Entertainment swatch, stacked, on a white box. No highlighted points beyond the red columns.
Slide 41
Streaming is a third of US TV production / A third of original series in the USA are now from Netflix, Amazon and other new entrants / US scripted original series / Online / Broadcast / Pay cable / Basic cable / 500 / 400 / 300 / 200 / 100 / 0 / 2009 / 2010 / 2011 / 2012 / 2013 / 2014 / 2015 / 2016 / 2017 / 2018 / Source: FX Networks Research / Benedict Evans — February 2020 / 41
Visuals: Chart: stacked column chart titled US scripted original series (bold sans-serif, dark grey). Y axis: 0 to 500 scripted series count (units: number of series), gridlines at 100 intervals drawn as light grey dotted lines, labels 0, 100, 200, 300, 400, 500. X axis: calendar years 2009 to 2018, one column per year, labels in dark grey below the baseline. Series from bottom to top: Basic cable (mid grey #7F7F7F), Pay cable (grey #A6A6A6), Broadcast (light grey #BFBFBF), Online (red #EB483F). Each column has thin white separators between segments. Approximate values, not printed on slide: 2009 basic about 66, pay about 86, broadcast about 208 (total about 208, no online). 2010 basic about 74, pay about 100, broadcast about 211, online about 215. 2011 basic about 111, pay about 144, broadcast about 260, online about 265. 2012 basic about 124, pay about 154, broadcast about 273, online about 287. 2013 basic about 161, pay about 194, broadcast about 325, online about 348. 2014 basic about 173, pay about 209, broadcast about 356, online about 388. 2015 basic about 186, pay about 223, broadcast about 373, online about 422. 2016 basic about 183, pay about 219, broadcast about 366, online about 455. 2017 basic about 174, pay about 217, broadcast about 370, online about 490. 2018 basic about 145, pay about 190, broadcast about 335, online about 495. No points highlighted. Legend: vertical list at far left, top to bottom Online (red square), Broadcast (light grey square), Pay cable (grey square), Basic cable (dark grey square), all squares about 1.5% of slide height, labels in regular sans-serif. No logos, photographs or icons.
Slide 42
Now what? / Old model is gone, but not yet clear what the new equilibrium will look like / Subs down / 20% / Teen viewing / share down / 50% / Show count / has doubled, / and costs… / + / + / = / Ad budgets / flat to up? / Benedict Evans — February 2020 / 42
Visuals: Four circles in a horizontal row, each about 14.8% wide and 26.2% high, vertically centred around 54% of slide height. Circles 1 to 3 are mid-grey #7F7F7F with white serif text; circle 4 is red #EB483F with white serif text. Between circles are three operators: a grey plus sign (#BFBFBF, between circles 1 and 2 and between 2 and 3) and a grey equals sign (#BFBFBF, between circles 3 and 4), each a bold flat geometric glyph roughly 4.5% wide. No photographs, charts, or logos.
Slide 43
New forms of video emerging
Twitch (90% of live games viewing) hit 1bn monthly hours in Q3 2019
Monthly Twitch viewing hours (m)
1,000
750
500
250
0
Sep-12
Sep-13
Sep-14
Sep-15
Sep-16
Sep-17
Sep-18
Sep-19
Amazon acquisition for $970m
Source: Twitchmetrics
Benedict Evans
— February 2020
43
Visuals: One line chart. Title printed above the plot: 'Monthly Twitch viewing hours (m)'. Y axis: 0 to 1,000 in linear steps labelled 0, 250, 500, 750, 1,000 (unit: millions of hours, per the chart title); faint dotted horizontal gridlines at each labelled tick. X axis: monthly time from Sep-12 to Sep-19, labelled every 12 months (Sep-12, Sep-13, Sep-14, Sep-15, Sep-16, Sep-17, Sep-18, Sep-19), with a solid grey baseline. One series, a single red line of about 2.5 px width with no markers, showing monthly Twitch viewing hours. Values are not printed, so estimates are: Sep-12 about 55; Sep-13 about 160 to 190; Sep-14 about 240 to 290; Sep-15 about 360 to 440; Sep-16 about 360 to 600; Sep-17 about 530 to 720; Sep-18 about 810 to 870; late Sep-19 about 890 with a peak of about 1,000 near early 2019. A vertical solid grey line of about 1 px at Sep-14 (about x 40.0%) runs from the baseline up to just above the 1,000 gridline, annotated 'Amazon acquisition for $970m' just right of its top. No legend. No highlighted points beyond the annotated vertical marker. Source: Twitchmetrics.
Slide 44
Twitch is already/only the size of a UK TV channel
Glass half empty, or half full?
Monthly viewing hours (bn)
6
5
4
3
2
1
0
Total UK TV
Netflix USA
BBC 1 (UK)
Global Twitch
ITV 1 (UK)
Source: Ofcom/ONS, Netflix, Twitchmetrics, @BenedictEvans
Benedict Evans
— February 2020
44
Visuals: One vertical bar chart. Title above the plot: "Monthly viewing hours (bn)" in bold sans, left-aligned at x 20.5%. Y-axis: numeric labels 0 to 6 at the left, unit billions of viewing hours (bn), range 0 to 6 with major ticks every 1, horizontal dotted light-grey gridlines at each integer. X-axis: five categories with a solid grey baseline at 0. Series (single series, values printed nowhere, so estimates): Total UK TV about 5.8 bn (grey #7F7F7F); Netflix USA about 3.6 bn (grey #7F7F7F); BBC 1 (UK) about 1.1 bn (grey #7F7F7F); Global Twitch about 0.9 bn (highlighted red #EC4B3D, the only coloured bar); ITV 1 (UK) about 0.85 bn (grey #7F7F7F). No legend. Bars are flat, no shadows, evenly spaced, approximately 6% of slide width each, with the Global Twitch bar as the highlighted point.
Slide 45
Meanwhile, global effects from the US streaming war
US budgets were always bigger, but they sold the shows abroad: Netflix goes direct
2019 content budget ($bn)
25
20
Amazon
15
10
Netflix
5
0
Streaming
Top 5 European markets
Source: Netflix, UBS, Ofcom/IHS Markit
Benedict Evans
— February 2020
45
Visuals: Stacked column chart titled '2019 content budget ($bn)'. Y axis labelled with values 0, 5, 10, 15, 20, 25 (units $bn, range 0 to 25), dotted light grey horizontal gridlines at each value. X axis categories: 'Streaming' and 'Top 5 European markets'; thin grey baseline. Series for 'Streaming' column (about values, no numeric labels printed except segment names): bottom segment 'Netflix' in red about 15 (from 0 to about 15), top segment 'Amazon' in light pink about 7 (from about 15 to about 22.2). Series for 'Top 5 European markets' column, unlabelled segments from bottom to top, all estimated: about 4.5 (darkest grey #7F7F7F), about 4.3 (#A6A6A6), about 3.5 (#BFBFBF), about 2.2 (#D9D9D9) for a total of about 15.5. Segments separated by thin white lines. Column of Streaming is about 15 wide, Top 5 column same width. No legend; segment names are written inside the segments. No highlighted points. Netflix segment is the only saturated colour, red #EB483F, Amazon segment light pink #FBDAD9.
Slide 46
Netflix is the UK’s biggest TV channel / Netflix is the UK’s biggest TV channel for 18-34s, and YouTube is even bigger / Video minutes per person per day, UK 18-34s, 2018 / 70 / 60 / 50 / 40 / 30 / 20 / 10 / 0 / Youtube / Netflix / ITV / BBC / Channel 4 / Amazon Prime / Channel 5 / Source: Ofcom / Benedict Evans / –– February 2020 / 46
Visuals: Vertical bar chart. Title above the plot: 'Video minutes per person per day, UK 18-34s, 2018' in bold. Y-axis from 0 to 70 in steps of 10, with light dotted horizontal gridlines in grey; no axis unit label printed beyond the title (minutes). X-axis categories: Youtube, Netflix, ITV, BBC, Channel 4, Amazon Prime, Channel 5. Values: the slide prints no data labels, so values are estimates: Youtube about 64, Netflix about 40, ITV about 24, BBC about 19, Channel 4 about 13, Amazon Prime about 9, Channel 5 about 5. Bars are solid, flat, no shadow. Coloured in red #EB483F for Youtube, Netflix and Amazon Prime (highlighted, streaming services); grey #7F7F7F for ITV, BBC, Channel 4 and Channel 5. No legend. Bars are evenly spaced with a thin grey baseline at zero.
Slide 47
Unbundling countries, not just cable
More than half of Netflix’s base and most of the user growth is now outside the USA
Netflix subscribers (m)
APAC
LATAM
EMEA
North America
175
150
125
100
75
50
25
0
Mar 17
Jun 17
Sept 17
Dec 17
Mar 18
Jun 18
Sept 18
Dec 18
Mar 19
Jun 19
Sept 19
Source: Netflix
Benedict Evans
–– February 2020
47
Visuals: Chart: stacked column chart titled 'Netflix subscribers (m)' (bold, left-aligned above the plot). Y axis: 0 to 175 in steps of 25, unit millions (m), dotted light grey horizontal gridlines at each 25 step, labels right-aligned. X axis: 11 quarterly categories from Mar 17 to Sept 19, solid thin grey baseline at 0. Series, stacked bottom to top: North America (#7F7F7F grey), EMEA (red, about #E84A3C), LATAM (salmon, about #F29389), APAC (light pink, about #F6B5AE). Labelled values: none printed on the bars; estimated totals about 94, 99, 104, 111, 119, 125, 130, 139, 149, 151, 158. Estimated North America values: about 55, 56, 57, 59, 61, 62, 63, 65, 67, 67, 67. No highlighted points. Legend: top-to-bottom APAC, LATAM, EMEA, North America, each with a small square swatch, at the left of the chart, not on the plot. Bars are white-outlined thin separators between segments; bar width about 2.7% of slide width, evenly spaced.
Slide 48
“In business, there are two ways to make / money. You can bundle, or you can unbundle.” / - Jim Barksdale / Benedict Evans — February 2020 / 48
Slide 49
Now: the great unbundling. Next: the great rebundling
For TV and retail, the old bundles are going, but we will get new ones
New distribution channels / break apart old / aggregation models
Everyone wants to / unbundle and go direct
But!
There can only be so many brand / relationships
Aggregators exist for a reason
Many big brands are actually B2B / businesses anyway
Lots of rebundling coming
Benedict Evans — February 2020
49
Visuals: none. The only graphic is a non-text chevron: a vertical V-shaped band in light grey #F2F2F2 with a thinner darker grey #BFBFBF edge along its right-hand side, pointing right; its point sits at about the vertical middle of the white band (y about 50%) and its arms run to the top and bottom edges of the white band. It is a flat shape with no shadow, gradient or photograph.
Slide 50
Is that a ‘tech’ company?
Or is it a TV company using a new channel?
Benedict Evans — February 2020
50
Slide 51
OK, ecommerce and TV. / But what else?
Benedict Evans — February 2020 / 51
Slide 52
“Remember, most people don’t have that”
For 25 years, we’ve had to remind ourselves that most people are not early adopters
Most people don’t have broadband
Most people don’t have 3G
Most people don’t have smartphones
83% of US teenagers have an iPhone*
* Source: Piper Jaffray
Benedict Evans — February 2020
52
Visuals: Four circles of equal size connected left to right by three light-grey block arrows (right-pointing, pentagon-style arrowheads). Circles 1-3 are mid-grey (#7F7F7F) and read 'Most people / don’t have / broadband', 'Most people / don’t have / 3G', 'Most people / don’t have / smartphones'. Circle 4 is red (#EB483F) and reads '83% of US / teenagers / have an / iPhone*'. Arrows are light grey (about #BFBFBF), flat with no outline. No chart, photo or logo. Circles are flat with no shadow or outline.
Slide 53
Today, anyone does anything online / In 2017, 40% of Americans met their partners online / US heterosexual couples who met online, by year of meeting / 40% / 30% / 20% / 10% / 0% / 1995 / 2000 / 2005 / 2010 / 2015 / 2017 / Source: Stanford/GfK / Benedict Evans –– February 2020 / 53
Visuals: One line chart, a single series, plotted as a red line with diamond markers at each year. Chart title: US heterosexual couples who met online, by year of meeting. Y axis: percentage of couples, 0% to 40%, gridlines at 10% intervals, labels 0%, 10%, 20%, 30%, 40%. X axis: year of meeting, 1995 to 2017, labels shown at 1995, 2000, 2005, 2010, 2015 and 2017. Values are not printed on the chart; estimated values (about) by year: 1995 about 1.5%, 1996 about 1.8%, 1997 about 2.8%, 1998 about 4.4%, 1999 about 6.7%, 2000 about 9.2%, 2001 about 11.6%, 2002 about 13.9%, 2003 about 15.9%, 2004 about 17.4%, 2005 about 18.6%, 2006 about 19.0%, 2007 about 19.2%, 2008 about 19.3%, 2009 about 20.4%, 2010 about 20.8%, 2011 about 22.2%, 2012 about 22.8%, 2013 about 25.6%, 2014 about 28.0%, 2015 about 31.8%, 2016 about 34.6%, 2017 about 38.3%. The line rises steeply from 1995 to 2000, flattens around 2005 to 2009 near 19 to 20%, then rises steeply to 2017. No legend, no highlighted points, no annotations. Source attributed on slide: Stanford/GfK.
Slides 54 to 126 continue in the full text file.
Download this deck
The hosted PDF of every library deck is free for readers of the SlideDeck Co newsletter. Join with your email and the viewer and download appear here.
Building a deck of your own? The SlideDeck Co Standard Deck is a slide library for business presentations: reviews, updates and plans.







