

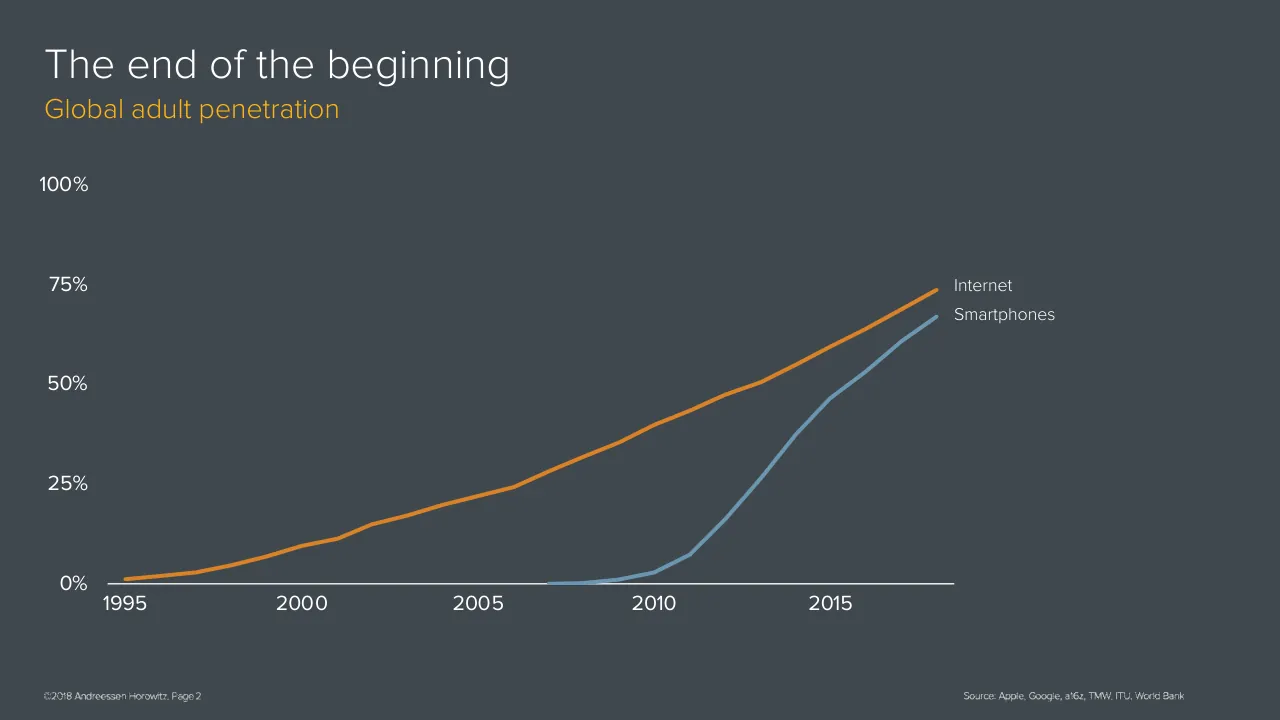
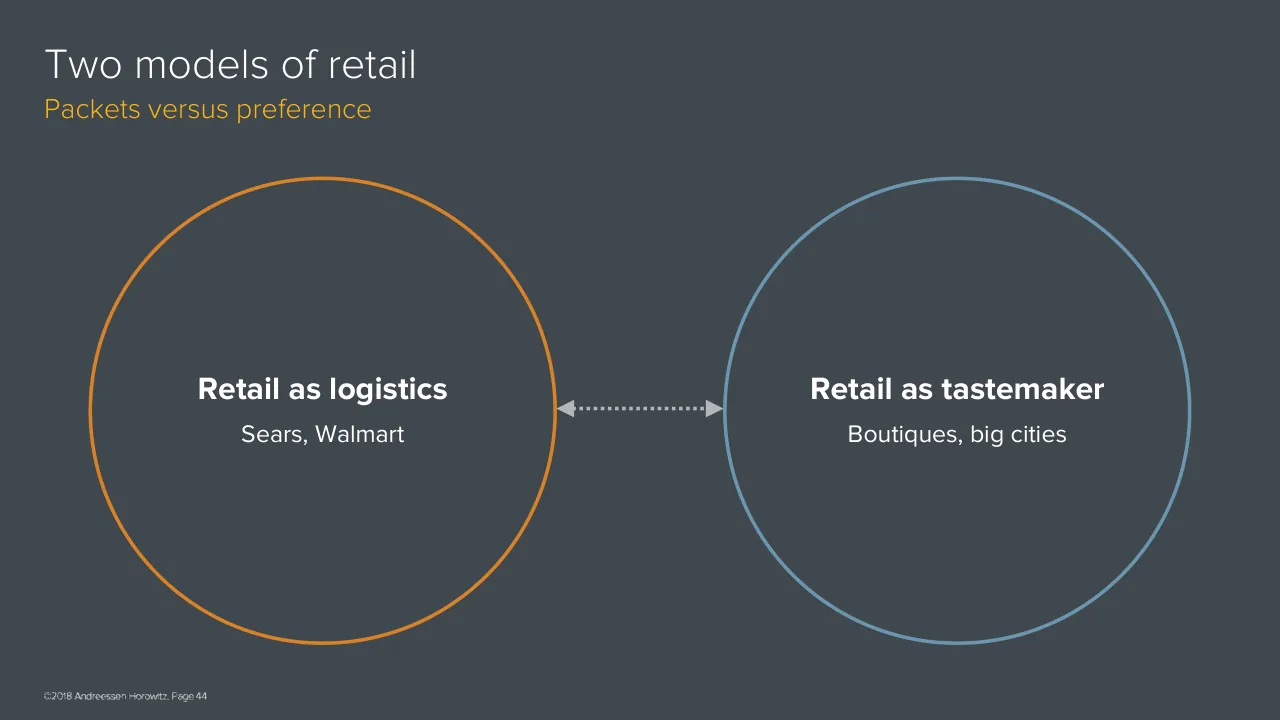
Benedict Evans, an independent analyst and former a16z partner, gave a long talk on technology markets in November 2018. It opens with a title slide and an 'The end of the beginning' thesis, noting that most people are online while most of the money is not. The main sections follow in order. Market sizes examine ecommerce as a share of US retail spending, along with restaurants, gas stations, cars and advertising. New problems describe the internet moving from easy, low-capital categories to harder ones such as groceries, housing, transport, finance and health. Packets versus preference contrasts retail as logistics with retail as tastemaking. New layers cover machine learning and crypto as the next organising systems after search and social. The deck closes with a repeated 'The end of the beginning' section break, a 'What is this?' slide and a thank you slide.
Slides worth studying

Questions about this deck
How many slides does the Benedict Evans deck have?
The Benedict Evans deck has 106 pages, and its title slide, 'The End of the Beginning', is slide 1. The deck is presented in the order described on its opening slides.
What does the Benedict Evans deck say about ecommerce's share of US retail spending?
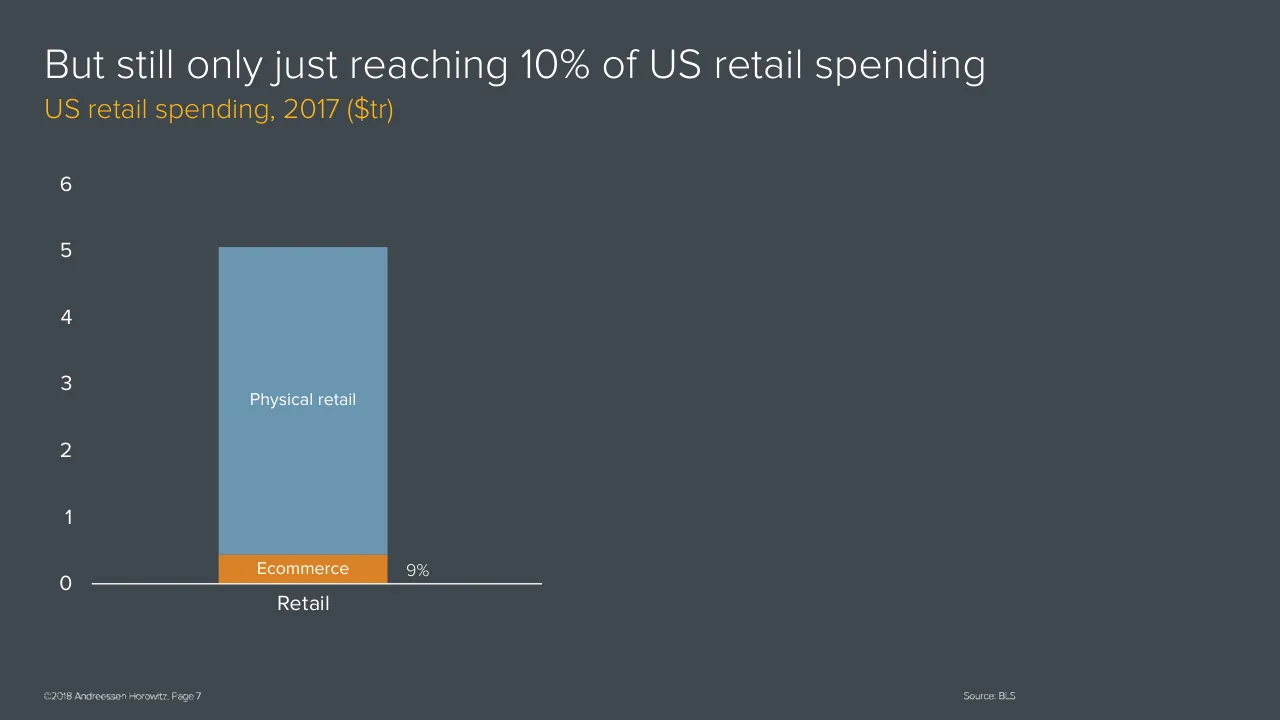
Slide 8 is headed 'But still only just reaching 10% of US retail spending', and its chart labels ecommerce at 9%. The chart uses 2017 US retail spending in trillions of dollars.
What does the Benedict Evans deck say about selling groceries online?
Slide 53, 'New problems: groceries', says groceries 'breaks the Amazon model' and 'can't be bolted onto a commodity logistics platform', so it 'needs a whole new platform'. The same slide adds that the market is 'so big it's worth it'.
What does the Benedict Evans deck say about machine learning and crypto?
Slide 5 lists them under 'New structural layers' with the text 'After search & social, now ML and Crypto'. The slide presents them as the next layers after search and social.
Details
- Company: Benedict Evans
- Year: 2018
- Type: Conference talk
- Industry: Venture capital
- Pages: 106
More from Benedict Evans
- Benedict Evans conference talk, 2026
- Benedict Evans conference talk, Autumn 2025
- Benedict Evans conference talk, Spring 2025
- Benedict Evans conference talk, 2023
- Benedict Evans conference talk, 2023
- Benedict Evans strategy presentation, 2022
All Benedict Evans decks in the library
Review score: 8 out of 10, Strong
Presentation quality, judged with the SlideDeck Co review heuristic. Ask, evidence and idea merit are not rated here.
The deck is a disciplined, consistent system: one dark template, a fixed title and orange subtitle pattern, a restrained palette, readable direct labels and source lines on every chart. Its main technique is progressive build, as in slides 7 to 11 where one stacked bar gains a segment per slide, and slides 32 to 34 where bubbles are added one group at a time. This lets a speaker walk an audience through one idea at a time, and the section dividers and the opening map on slide 5 help the route. The weaknesses are that the many near-identical build slides make the 106-page length hard to scan, several charts leave large empty areas (slide 8), and tiny labels and footers would be hard to read in a big room.
Worth keeping: Keep the consistent template, action-style titles over orange unit subtitles, direct labelling, the one-element-per-slide builds, and the orange highlight for the focus item.
Most useful repair: Raise the smallest segment labels and footer text, fill or rebalance the empty right half on single-bar slides such as slide 8, and add takeaway titles to the plain 'The spread of...' and 'Global company creation' slides.
What would change the score: I would merge some of the repeated build steps (for example slides 44 to 47 where the same two empty circles recur) into fewer slides, and add an agenda or progress marker so the 106-page route is easier to follow.
Confidence medium. 72 of 106 pages inspected on contact sheets, 4 at readable size. Reviewed 2026-11-08. Model-assisted review (claude-sonnet-5-5).
Full text of the slides (106 slides)
Every slide's words and a description of its charts and images, so the deck can be searched and rebuilt. Also available as Markdown.
Slide 1
The End of the Beginning / Benedict Evans / November 2018 / www.ben-evans.com
Slide 2
The end of the beginning / ©2018 Andreessen Horowitz. Page ‹#›
Slide 3
The end of the beginning
Global adult penetration
100%
75%
Internet
Smartphones
50%
25%
0%
1995
2000
2005
2010
2015
©2018 Andreessen Horowitz. Page 2
Source: Apple, Google, a16z, TMW, ITU, World Bank
Visuals: Chart: line chart, no chart title inside the plot. Y-axis is labelled in percent from 0% to 100% with gridline-free tick labels at 0%, 25%, 50%, 75% and 100%; the y-axis has no unit label beyond the % sign. X-axis runs from 1995 to about 2018 with labelled ticks at 1995, 2000, 2005, 2010 and 2015; data points are plotted roughly annually. Series 1, Internet (orange line): about 1% in 1995, about 2% in 1997, about 5% in 1999, about 10% in 2001, about 15% in 2002, about 20% in 2004, about 25% in 2006, about 35% in 2008, about 40% in 2010, about 47% in 2012, about 58% in 2015, about 67% in 2017 and about 73% in 2018. Series 2, Smartphones (blue-grey line): about 0% in 2007 and 2008, about 1% in 2009, about 3% in 2010, about 7% in 2011, about 15% in 2012, about 25% in 2013, about 37% in 2014, about 46% in 2015, about 53% in 2016, about 61% in 2017 and about 67% in 2018. Legend: none; series are identified by direct labels 'Internet' and 'Smartphones' at the line ends. Highlighted points: none. Line ends: Internet ends at about x 73.2%, y 40.3%; Smartphones ends at about x 73.2%, y 44.0%. Lines are about 0.5% of slide height thick, with rounded joins. Footer and source lines are reproduced as placed pictures of text, not live text.
Slide 4
The end of the beginning / Global penetration / 100% / 75% / Internet / Smartphones / 50% / 25% / 0% / 1995 / 2000 / 2005 / 2010 / 2015 / Ecommerce / ©2018 Andreessen Horowitz. Page 3 / Source: Apple, Google, a16z, TMW, ITU, World Bank
Visuals: One line chart, no title inside the chart area. Type: multi-series line chart with time on the x-axis (years 1995 to about 2018) and penetration on the y-axis (0% to 100%, gridlines not drawn, labelled every 25%: 0%, 25%, 50%, 75%, 100%). Y-axis unit is percent of population. X-axis labels printed at 1995, 2000, 2005, 2010, 2015. Series: (1) Internet, orange line #D17F2A, about 1% in 1995, about 3% in 1997, about 9% in 2000, about 22% in 2005, about 39% in 2010, about 58% in 2015, ending at about 73% in 2018; (2) Smartphones, steel-blue line #6B96B5, starts at about 0% in 2007, about 1% in 2009, about 3% in 2010, about 7% in 2011, about 16% in 2012, about 26% in 2013, about 37% in 2014, about 46% in 2015, about 53% in 2016, about 61% in 2017, ending at about 67% in 2018; (3) Ecommerce, magenta-pink line #C94F8A, starts at about 0% in 1998, about 0.5% in 2002, about 1% in 2006, about 2% in 2010, about 4% in 2015, ending at about 7% in 2018. Values marked 'about' are estimates because the slide prints no data values. No legend box; series are identified by direct labels at line ends: Internet at about 73%, Smartphones at about 67%, Ecommerce at about 7%. No highlighted points. Lines are about 0.4% of slide height thick with round ends and no markers. A white horizontal baseline at 0% runs from about x 8.4% to x 74.5%, at about y 81.1%.
Slide 5
Most people / are online…
But most of the / money is not
New problems
Tackling harder / markets and / changing them / more
New structural / layers
After search & / social, now ML / and Crypto
©2018 Andreessen Horowitz. Page 4
Visuals: Three outlined circles, left to right: an orange ring (about #E0822A), a steel-blue ring (about #6B97B4) and a magenta ring (about #C4417F). Each ring is about 2.5 mm stroke, i.e. about 0.3% of slide height, with no fill. Between the left and middle circles, and between the middle and right circles, is a grey dotted double-headed arrow (about #A8ACB0) with filled triangular heads at both ends touching the ring edges at the vertical centre of the circles. Each arrow is about 8.6% of slide width long and about 1.8% of slide height tall. No photographs, icons or charts.
Slide 6
Market sizes
©2018 Andreessen Horowitz, Page 5
Slide 7
Ecommerce is big in dollar terms
Quarterly US ecommerce revenue ($bn)
150
100
50
0
Mar 99
Mar 02
Mar 05
Mar 08
Mar 11
Mar 14
Mar 17
©2018 Andreessen Horowitz. Page 6
Source: BLS
Visuals: Line chart. Title: none inside the chart; the slide title is 'Ecommerce is big in dollar terms' and the subtitle is 'Quarterly US ecommerce revenue ($bn)'. Y-axis: labelled 0, 50, 100, 150, units $bn, range 0 to 150, no axis title. X-axis: time, quarterly, labelled Mar 99, Mar 02, Mar 05, Mar 08, Mar 11, Mar 14, Mar 17, with ticks every three years; the series runs from about Mar 99 to about late 2018, with no axis title. Series: one orange line, no legend, no printed data values. Estimated values (about): starts about 5 at Mar 99, about 10 at Mar 01, about 20 at Mar 04, about 30 at Mar 07, about 40 at Mar 09, about 55 at Mar 11, about 70 at Mar 13, about 85 at Mar 15, about 105 at Mar 16, about 122 at Mar 17, a peak of about 141 just after Mar 17, a drop to about 112, then about 120 at the final point. The line shows a strong seasonal zigzag with a spike each fourth quarter. Highlighted points: none. Footer items are rendered as two raster images: copyright text at bottom-left and 'Source: BLS' at bottom-right. No logos or icons.
Slide 8
But still only just reaching 10% of US retail spending / US retail spending, 2017 ($tr) / 6 / 5 / 4 / 3 / 2 / 1 / 0 / Physical retail / Ecommerce / 9% / Retail / Consumer Spending / ©2018 Andreessen Horowitz. Page 7 / Source: BLS
Visuals: Chart: stacked column chart, single column, no chart title inside the chart area (the title is the slide headline). Y-axis: unit is $tr (trillions of US dollars), ticks labelled 0, 1, 2, 3, 4, 5, 6, range 0 to 6, gridlines none, axis labels white. X-axis: one category labelled Retail, baseline is a white horizontal line. Series 1 'Physical retail' (blue, #6C96B2), top of segment about 5.05 $tr on the axis, label 'Physical retail' printed inside the segment in white. Series 2 'Ecommerce' (orange, #D98228), sits on the baseline, top about 0.45 $tr (about estimate, no value printed), label 'Ecommerce' printed inside the segment in white. Highlighted value: '9%' printed in white to the right of the column top of the orange segment, indicating ecommerce share of total retail. No legend. No points highlighted beyond the 9% label. Column spans about 17.1% to 30.3% of slide width. Two rendered images in footer: a 194 by 26 pixel copyright/page text image and a 76 by 27 pixel Source: BLS image; no logos or icons.
Slide 9
Now add restaurants….
US retail spending, 2017 ($tr)
6
5
Bars & restaurants
4
3
2
Physical retail
1
0
Retail
Ecommerce
8%
Source: BLS
©2018 Andreessen Horowitz. Page 8
Visuals: Chart: a single stacked vertical column chart, category 'Retail', on a y-axis from 0 to 6 with no unit suffix (the unit $tr is given in the subtitle). Segments from bottom to top: Ecommerce, about 0.4, orange #D98228; Physical retail, about 4.6, blue-grey #6C96B2; Bars & restaurants, about 0.7, magenta #BE4681; the column totals about 5.8. The Ecommerce segment is labelled '8%' to its right, as printed. Segment labels are printed inside each segment in white. No legend, no gridlines, no tick marks other than the axis labels 0 to 6. The white horizontal baseline runs from about x 7.2% to 42.4% at y 81%. No highlighted points. A pale-grey rectangle filled #40484F sits over the area around 'Consumer Spending' and hides that text. No photographs, icons or logos.
Slide 10
And think about what happens to gas stations
US retail spending, 2017 ($tr)
6
5
Bars & restaurants
4
3
2
Physical retail
1
0
Retail
Consumer Spending
Gas stations
Ecommerce
©2018 Andreessen Horowitz. Page 9
Source: BLS
Visuals: Stacked column chart, single category 'Retail'. Y-axis: unlabelled axis with tick values 0, 1, 2, 3, 4, 5, 6 (units $tr, shown only in subtitle), range 0 to 6. X-axis: category 'Retail', baseline a white horizontal line. Series, stacked bottom to top, with labels printed inside segments and no printed values: Ecommerce (orange #D98228), about 0.4 $tr; Gas stations (purple #773F9B), about 0.5 $tr; Physical retail (steel blue #6C96B2), about 4.1 $tr; Bars & restaurants (magenta #BE4681), about 0.7 $tr; total about 5.7 $tr. No legend; segment labels serve as legend. No highlighted points. The text 'Consumer Spending' is present in the file but is covered by a background-coloured rectangle (#40484F) and is not visible.
Slide 11
And the $1.2tr spent on cars / US retail spending, 2017 ($tr) / 6 / 5 / Bars & restaurants / 4 / 3 / Physical retail / 2 / 1 / Cars & parts / 0 / Gas stations / Ecommerce / Retail / ©2018 Andreessen Horowitz. Page 10 / Source: BLS
Visuals: Chart: stacked vertical column chart, single category 'Retail', y-axis 0 to 6 in $tr, no axis title printed, no gridlines, no legend, no printed value labels. Segments from bottom to top: Ecommerce (orange #D98228) about 0.4; Gas stations (purple #773F9B) about 0.5; Cars & parts (green #95CA53) about 1.2; Physical retail (blue #6C96B2) about 3.0; Bars & restaurants (magenta #BE4681) about 0.7; total about 5.8. Segment names are printed in white inside each segment. No segment is highlighted. Column spans about 17.1% to 30.3% across the slide. Horizontal white baseline at the zero line. Footer images: copyright line and source line as small raster images.
Slide 12
Meanwhile, there’s more than just retail
US spending, 2017 ($tr)
15
10
5
0
Retail
Consumer Spending
©2018 Andreessen Horowitz. Page 11
Source: BLS
Visuals: Stacked column chart. Title: none inside the chart; slide subtitle reads 'US spending, 2017 ($tr)'. Y axis: 0 to 15 in $ trillions, labelled 0, 5, 10, 15 at the left, no gridlines, no axis title. X axis: two categories, 'Retail' and 'Consumer Spending', with a thin white baseline. No legend; the segments are unlabelled. Retail column (about 5.7 total): bottom orange segment about 0 to 0.5, then grey segments about 0.5 to 3.4, 3.4 to 5.1 and 5.1 to 5.7 (all estimates, no values printed). Consumer Spending column (about 12.0 total): bottom blue segment about 0 to 1.3, then about 1.3 to 4.4, about 4.4 to 5.8, and about 5.8 to 12.0 (all estimates, no values printed). Thin darker separator lines divide the segments. No highlighted points. Footer and source are small text images, not photographs.
Slide 13
What’s the opportunity?
US spending, 2017 ($tr)
15
10
5
0
4%
Retail
Consumer Spending
©2018 Andreessen Horowitz. Page 12
Source: BLS
Visuals: Stacked bar chart, untitled apart from the slide subtitle 'US spending, 2017 ($tr)'. The value axis runs from 0 to 15 ($tr), with labels at 0, 5, 10 and 15 and no visible gridlines. Two categories: 'Retail' and 'Consumer Spending'. Retail is a single stacked bar, about 5.7 $tr high (top segment boundary at about 5.0 and 3.4, the lower grey segment top at about 0.4), with a thin orange base segment labelled '4%' printed to the right of the bar top-right corner. Its segments are grey #838586 with thin darker separator lines, except the bottom segment which is orange (about #DB822B). Consumer Spending is a single stacked bar about 12 $tr high, with grey #838586 segments and thin darker separator lines at about 1.3, 4.4 and 5.8 $tr (estimated, no values printed). No legend. No segment values other than the '4%' label are printed. No highlighted points beyond the orange Retail base segment. Baseline is a white horizontal line at the zero level, about 2px thick.
Slide 14
Digital advertising also looks big…
Global advertising, 2018 dollars ($bn)
250
200
Internet
150
TV
100
50
All other
0
1985
1990
1995
2000
2005
2010
2015
©2018 Andreessen Horowitz. Page
13
Source: Zenith
Visuals: Chart: multi-series line chart, not stacked. Title: Digital advertising also looks big… Subtitle: Global advertising, 2018 dollars ($bn). Y axis: $bn, 0 to 250, gridlines none, tick labels 0, 50, 100, 150, 200, 250. X axis: years 1985 to 2018, labelled every five years (1985, 1990, 1995, 2000, 2005, 2010, 2015), with the 2018 endpoint unlabelled. Four series, each a 3-4 px stroke with rounded joins, labelled at the right end: Internet (orange #E07F27), TV (magenta #C64A84), Print (steel blue #6A95B5), All other (green #8DC63F). Values are estimates marked about since the slide prints none. Internet: about 0 from 1985 to 1996, about 10 in 2000, about 27 in 2005, about 61 in 2009, about 110 in 2013, about 180 in 2016, about 223 in 2018. TV: about 78 in 1985, about 101 in 1990, about 162 in 2000, about 160 in 2009, about 190 in 2014, about 183 in 2018. Print: about 135 in 1985, about 168 in 1990, about 215 at its peak in 2000, about 197 in 2007, about 139 in 2010, about 100 in 2015, about 73 in 2018. All other: about 33 in 1985, about 69 in 2000, about 78 in 2007, about 66 in 2009, about 73 in 2018. Legend: none; series are identified by end labels. Highlighted points: none. Axis baseline is a white horizontal rule at 0.
Slide 15
Internet is now the largest segment of US advertising…
US advertising, 2018 ($bn)
250
200
150
100
50
0
Other media
TV
Internet
38%
©2018 Andreessen Horowitz. Page 14
Source: Zenith
Visuals: Chart: a single stacked column chart. Type: vertical stacked column, one column. Title: none inside the chart; the subtitle above reads 'US advertising, 2018 ($bn)'. Y-axis: linear, $bn implied by the subtitle, range 0 to 250, labelled ticks at 0, 50, 100, 150, 200 and 250, no axis title. X-axis: one unlabelled category, drawn as a white horizontal baseline. Series, bottom to top: Internet about 0 to 78 (about $78bn, orange segment, labelled 'Internet' inside); Print about 78 to 106 (about $28bn, blue-grey segment, labelled 'Print' inside); TV about 106 to 175 (about $69bn, magenta segment, labelled 'TV' inside); Other media about 175 to 203 (about $28bn, green segment, labelled 'Other media' inside). Total about 203, shown by the column top at the 200 gridline. Beside the Internet segment, outside the column on the right, the printed value '38%' appears, marking Internet's share. No legend; no gridlines; no highlighted points beyond the 38% label. Column width about 13.2% of slide width, centred over the axis at about x 17.5 to 30.7%. Segment colours: Internet #D98228, Print #6C96B2, TV #BE4681, Other media #95CA53, all with thin no-stroke edges. Segment labels are white, centred horizontally in each segment. Footer contains two small images: one 194 by 26 pixel image spanning the copyright line at bottom-left, and one 88 by 27 pixel image at bottom-right under 'Source: Zenith'; a 51 by 52 pixel image sits at about x 14.8%, y 95.5%, adjacent to the copyright line, and its content is not clearly legible.
Slide 16
And advertising doesn’t change much
US advertising as % US GDP
4%
3%
2%
1%
0%
1920
1930
1940
1950
1960
1970
1980
1990
2000
©2018 Andreessen Horowitz. Page 15
Source: Galbi
Visuals: Chart: line chart. Title: US advertising as % US GDP (rendered as the yellow subtitle). Y-axis: US advertising as a percentage of US GDP, unit %, labelled at 0%, 1%, 2%, 3%, 4%, range 0% to 4%, no gridlines. X-axis: calendar years, unit year, labelled every ten years 1920 to 2000 (last plotted point about 2007, not labelled). Single series, a continuous line in steel blue #6B93B0 about 0.5% of slide height thick with square-cornered joins. Estimated values, all about: 1920 about 2.8%; 1922 about 3.0% (local peak); 1930 about 2.7%; 1933 about 2.3%; 1934 about 2.5%; 1941 about 2.1%; 1942 about 1.3%; 1944 about 1.2% (lowest point, trough); 1950 about 1.9%; 1956 about 2.3%; 1960 about 2.3%; 1966 about 2.1%; 1970 about 1.8%; 1975 about 1.7%; 1980 about 1.9%; 1987 about 2.3%; 1992 about 2.1%; 1997 about 2.3%; 2000 about 2.5% (highest after 1922); 2007 about 2.0%, the last point. No legend. No highlighted points beyond the trough and peaks as drawn. Baseline: horizontal white rule at 0%, about 0.2% thick, spanning the plot width. Also present in the file but not visibly rendered: four placed images in the footer band (see elements); the footer copyright and source text appear as raster images.
Slide 17
But what about marketing? / US advertising and marketing, 2018 ($bn) / 500 / 400 / 300 / 200 / 100 / 0 / Internet / 18% / Advertising / Marketing / ©2018 Andreessen Horowitz. Page 16 / Source: Zenith
Visuals: Chart: stacked column chart with a floating column, titled 'US advertising and marketing, 2018 ($bn)'. Y axis 0 to 500 in $bn with labelled ticks at 0, 100, 200, 300, 400, 500 (no unit label on axis; unit is in subtitle). X axis categories: Advertising and Marketing. Advertising column is a stacked column, bottom to top: orange #D98228 segment labelled 'Internet' (about 79, from 0 to about 79), slate blue #6C96B2 segment (about 28, from about 79 to about 107), magenta #BE4681 segment (about 67, from about 107 to about 174), green #95CA53 segment (about 29, from about 174 to about 203). Total about 203. Values are estimates marked 'about' because the slide prints no segment values. Label '18%' printed to the right of the Advertising column. Marketing is a single grey #838586 floating column from about 203 to about 438 (estimated, no printed value), not stacked on a baseline. No legend. No highlighted points beyond the 18% label. Horizontal white baseline axis at 0 spanning about 7.6% to 73.6% of slide width. Small image elements at the footer: copyright line image, 'Source: Zenith' image, and an unidentified small raster image (51 by 52 pixels) near x 14.8%, not legible in the render.
Slide 18
But what about marketing? / US advertising and marketing, 2018 ($bn) / 500 / 400 / Events / 300 / Sales promotion / 200 / Telemarketing / Direct Mail / 100 / 0 / Advertising / Marketing / Internet / 18% / ©2018 Andreessen Horowitz. Page 17 / Source: Zenith
Visuals: Stacked column chart, titled 'US advertising and marketing, 2018 ($bn)'. Y axis: $bn, linear, range 0 to 500, gridlines at 100, 200, 300, 400 and 500 labelled, no gridlines drawn. X axis: two categories, Advertising and Marketing. Advertising column (x about 17.5% to 30.7%): bottom segment Internet, orange #D98228, about 0 to 78 (estimate, no value printed); three unlabelled grey #838586 segments stacked above it, about 78 to 107, 107 to 174 and 174 to 202 (estimates, no values printed); the Internet segment is labelled 'Internet' in white and the whole column is annotated '18%' to its right. Marketing column (x about 50.6% to 63.8%), stacked bottom to top: Direct Mail #6C96B2 about 201 to 249 (estimate); Telemarketing #BE4681 about 249 to 308 (estimate); Sales promotion #95CA53 about 308 to 393 (estimate); Events #FCB316 about 393 to 431 (estimate); a thin top segment in purple about 431 to 440 (estimate, unlabelled). Segment labels are white centred text inside each segment. No legend. Highlighted points: none beyond the 18% annotation. A tiny image of 50 by 52 pixels is placed at x 14.8%, y 95.5%, with no visible content distinguishable at this scale; footer copyright and source lines are rendered as small images of text.
Slide 19
Reaching customers / Old definitions, new use cases / Pay for placement on / Amazon / “Advertising” / Pay for placement in / Walmart / ”Marketing" / ©2018 Andreessen Horowitz. Page 18
Visuals: Diagram: two outlined circles of equal size and a double-headed arrow connecting them. Left circle: orange outline (about #D9822B), stroke about 0.4% of slide height, centred around x 36%, y 49%, diameter about 46% of slide height (about x 7% to 43.5%, y 24.7% to 89.2%); it contains the bold label 'Pay for placement on Amazon' and the quoted word '“Advertising”'. Right circle: steel-blue outline (about #5E8FAF), same size, centred around x 74.5%, y 49%, spanning about x 56.5% to 93%, y 24.7% to 89.2%; it contains the bold label 'Pay for placement in Walmart' and the quoted word '”Marketing"'. Between the circles: a grey (about #A8ADB2) double-headed arrow with filled triangular heads, dotted shaft, running horizontally at y about 56.7%, from about x 43.5% to 56.2%. No photographs, logos or icons.
Slide 20
And what do you really pay to reach a customer? / US budgets, 2018 ($bn) / 700 / 600 / Retail rents? / 500 / 400 / Shipping? / 300 / 200 / 100 / 0 / Advertising / Marketing / Logistics / Internet / ©2018 Andreessen Horowitz. Page 19 / Source: Zenith, BLS, Pitney Bowes, a16z
Visuals: Chart: floating stacked-column chart (bars floating above a zero baseline, with grey segments). Y-axis: US dollars in billions ($bn), linear scale from 0 to 700 with labelled ticks every 100 (0, 100, 200, 300, 400, 500, 600, 700), white labels. X-axis: three categories labelled Advertising, Marketing, Logistics, no axis title. Title: 'US budgets, 2018 ($bn)' as subtitle. No legend. Series and labelled values: Advertising column consists of an orange segment labelled 'Internet' from 0 to about 80 (estimate, no value printed) and a grey segment stacked above it up to about 200 (about, no value printed); the grey segment has two faint darker horizontal divider lines inside it. Marketing column is a single grey floating segment from about 200 to about 440 (about, no value printed) with faint divider lines inside it at about 250, 300 and 350 (about). Logistics column consists of a blue segment labelled 'Shipping?' from about 440 to about 545 (about) and a magenta segment labelled 'Retail rents?' from about 545 to about 695 (about). Highlighted points: the orange Internet segment, the blue Shipping segment and the magenta Retail rents segment are the only coloured segments, the grey segments are unlabelled. Image elements: a 215 by 27 pixel raster of the source line 'Source: Zenith, BLS, Pitney Bowes, a16z' at bottom right; a 194 by 26 pixel raster of the copyright line '©2018 Andreessen Horowitz. Page 19' at bottom left; and a small 51 by 52 pixel raster at about x 14.8%, y 95.5%, overlapping the end of the copyright line (likely the page number digits '19'), not a photograph. No photographs, logos or icons.
Slide 21
Globally, $1tr is spent on “what should I buy?”
Global sales & marketing, 2018 ($tr)
1.00
Events
0.75
Direct
0.50
Other advertising
TV
0.25
0.00
Internet
©2018 Andreessen Horowitz. Page 20
Source: GroupM
Visuals: Chart: stacked single-column bar chart, vertical. Title: none inside the chart; the slide title and subtitle 'Global sales & marketing, 2018 ($tr)' serve as its title. Y-axis: linear, unit $tr, range 0.00 to 1.00, tick labels 0.00, 0.25, 0.50, 0.75, 1.00 at left, no gridlines. X-axis: a single unlabelled category, drawn as a white horizontal baseline. Series, stacked from bottom to top with labelled values where the slide prints none (values are estimates from segment heights, marked about): Internet about 0.22 (#D98228, orange); Print about 0.08 (#6C96B2, steel blue); TV about 0.20 (#BE4681, magenta); Other advertising about 0.08 (#95CA53, green); Direct about 0.35 (#FCB316, amber); Events about 0.07 (#773F9B, purple). Segments sum to about 1.00. Each segment carries its name in white centred text. Legend: none, segments are labelled directly. Highlighted points: none. Column width about 13.2% of slide width, centred at about 24.5% of width. No photographs, illustrations, logos or icons are visible. Four placed images exist in the file (194 by 26 px, 112 by 53 px, 112 by 53 px and 57 by 52 px) but are not visible in the render and are treated as hidden.
Slide 22
And where else is the opportunity?
©2018 Andreessen Horowitz, Page 21
Visuals: None apart from the footer artwork at bottom left: a 194 by 26 pixel image carrying the copyright line '©2018 Andreessen Horowitz, Page 21' in small white sans-serif, and a 51 by 52 pixel image at x 14.8% that sits just past the end of that line and is not legible at this size. No photographs, charts, or diagrams.
Slide 23
The spread of industrialisation
Global manufacturing production
75%
50%
25%
USA
UK
0%
1830
1860
1913
©2018 Andreessen Horowitz. Page 22
Source: WTO
Visuals: Chart: stacked column chart, no chart title. Y axis labelled 0%, 25%, 50%, 75% (percent of global manufacturing production; range 0% to 75%, gridlines absent). X axis categories 1830, 1860, 1913 with the baseline drawn as a thin white horizontal line. Each column is split into two series: UK in orange #D98228 at the bottom and USA in blue #6C96B2 on top. Values are not printed, so estimates are given: 1830 total about 12% (UK about 9%, USA about 3%); 1860 total about 27% (UK about 20%, USA about 7%); 1913 total about 46% (UK about 13%, USA about 32%). Series labels are printed inside the 1913 columns: 'USA' in the blue segment and 'UK' in the orange segment. No legend and no highlighted points. Columns are about 6.5% of slide width wide. A grey box #40484F sits over the right part of the chart area, hiding text that is not visible in the rendered slide.
Slide 24
The spread of industrialisation / Global manufacturing production / 75% / 50% / USA / 25% / UK / 0% / 1830 / 1860 / 1913 / 2015 / ©2018 Andreessen Horowitz. Page 23 / Source: WTO
Visuals: Stacked column chart. Title: none on the chart itself. Y-axis: percentage of global manufacturing production, 0% to 75%, tick labels at 0%, 25%, 50%, 75%, no gridlines. X-axis: years 1830, 1860, 1913, 2015, no axis title. Two series stacked per column: UK in orange (#D98228, bottom) and USA in blue-grey (#6C96B2, top). No printed values on the bars; values are estimates: 1830 UK about 9%, USA about 3% (total about 12%); 1860 UK about 20%, USA about 7% (total about 27%); 1913 UK about 13.5%, USA about 32% (total about 46%); 2015 UK about 2%, USA about 18% (total about 20%). Series are labelled inline: 'UK' in white inside the orange segment of 1913, and 'USA' in white inside the blue segment of 1913. No legend. No highlighted points. Baseline is a thin white horizontal line at 0%.
Slide 25
The spread of industrialisation
Global manufacturing production
75%
50%
25%
USA
0%
1913
2015
UK
©2018 Andreessen Horowitz. Page 24
Source: WTO
Visuals: Stacked column chart. Title: none (the slide title serves as the chart heading). Subtitle: Global manufacturing production. Y-axis: percentage of global manufacturing production, linear, 0% to 75%, labelled at 0%, 25%, 50% and 75%, with no gridlines. X-axis: two categories, 1913 and 2015. Series, bottom to top: UK (orange #D98228) and USA (steel blue #6C96B2). Printed values: none; the segments carry only the labels UK and USA, shown on the 1913 bar. Estimated values (about): 1913 UK about 13.5%, 1913 USA about 32% (bar top about 46%); 2015 UK about 2%, 2015 USA about 18% (bar top about 20%). Legend: none; series are identified by in-bar labels. Highlighted points: none. Bars are flat-filled with no outline, about 13% of slide width each. Baseline: white horizontal line at 0%. Two small images at the footer, one about 13% wide and one about 5% wide, plus a small image about 2% wide, are not legible at this resolution and are not identifiable as logos.
Slide 26
The spread of industrialisation
Global manufacturing production
75%
50%
25%
USA
China
0%
1913
2015
UK
©2018 Andreessen Horowitz. Page 25
Source: WTO
Visuals: Stacked column chart. No chart title beyond the slide title. Y axis: linear percentage scale, labelled 0%, 25%, 50%, 75%, with tick labels at the left of the chart and no gridlines; the range is 0% to about 75%. X axis: two categories, 1913 and 2015, labelled beneath the baseline. Each column is stacked with three series, bottom to top: UK (orange #D98228), USA (blue #6C96B2), China (magenta #BE4681). Series are labelled inside the segments only on the bottom and middle segments of the 1913 column (UK, USA) and the top segment of the 2015 column (China). Values are not printed; estimates: 1913 column: UK about 13.5%, USA about 32%, unlabelled magenta segment about 1% at the top, total about 46%. 2015 column: UK about 2%, USA about 18%, China about 20%, total about 40%. No legend. No highlighted points. The white horizontal baseline runs from about x 7.8% to x 73.8% at y 81.1%.
Slide 27
The spread of computers
Global installed base
75%
50%
25%
0%
Computing capacity, 1993
Smartphones, 2018
Europe
USA
©2018 Andreessen Horowitz. Page 26
Source: IMD, WEF, CNNIC, a16z
Visuals: Stacked column chart. Title: none printed on the chart itself; slide title 'The spread of computers' with subtitle 'Global installed base'. Y axis: percentage, 0% to 75%, labelled at 0%, 25%, 50%, 75% with no gridlines; the axis runs from 0% at the baseline to 75% at the top. X axis: two categories, 'Computing capacity, 1993' and 'Smartphones, 2018', with no unit. Series: USA (bottom segment, orange #D98228) and Europe (top segment, blue #6C96B2). No values are printed; estimates: Computing capacity, 1993: USA about 49%, Europe about 21%, total about 70%. Smartphones, 2018: USA about 8%, Europe about 14%, total about 22%. Legend: none; series are labelled directly inside the segments of the 2018 column with 'Europe' (blue segment) and 'USA' (orange segment), and not inside the 1993 column. Highlighted points: none. Baseline: a white horizontal axis line from about x 7.8% to 73.8% at y 81%. Small image at x 14.8%, y 95.5%, 1.9% by 3.1%, 57 by 52 pixels, content not legible at this rendering, overlapping the end of the footer line.
Slide 28
The spread of computers
Global installed base
75%
50%
25%
China
Europe
USA
0%
Computing capacity, 1993
Smartphones, 2018
©2018 Andreessen Horowitz. Page 27
Source: IMD, WEF, CNNIC, a16z
Visuals: Chart: stacked column chart, two columns, no chart title. Y axis: percentage scale 0% to 75%, labelled at 0%, 25%, 50%, 75%, no units beyond %, no gridlines. X axis: two categories, 'Computing capacity, 1993' and 'Smartphones, 2018', baseline drawn as a thin white line. Series: USA in orange, Europe in blue, China in magenta-pink. Column 1 (Computing capacity, 1993), unlabelled segments, about: USA 48.8%, Europe about 20.9%, China about 0.7%, total about 70%. Column 2 (Smartphones, 2018), labelled segments: USA about 8%, Europe about 13%, China about 24%, total about 45%. Legend: none; series are identified by the labels inside column 2. No highlighted points. Column 1 segment boundaries are as measured from the file.
Slide 29
The spread of use
Mobile data traffic (exabytes/month)
16
14
12
All other
10
8
6
APAC
4
2
0
Western Europe
2014
2017
North America
©2018 Andreessen Horowitz. Page 28
Source: Ericsson
Visuals: Chart: stacked column chart. Title: none inside the chart; the slide subtitle reads Mobile data traffic (exabytes/month). Y-axis: linear, 0 to 16 in steps of 2, no axis title beyond the subtitle units (exabytes/month). X-axis: two categories, 2014 and 2017. Series, stacked bottom to top: North America (orange #D98228), Western Europe (blue #6C96B2), APAC (magenta #BE4681), All other (grey #838586). Printed values: none; the segments carry only labels, so values are estimates. 2014 column (about 3.7 total): North America about 0.6, Western Europe about 0.4, APAC about 1.3, All other about 1.4. 2017 column (about 14.8 total): North America about 2.5, Western Europe about 1.7, APAC about 7.2, All other about 3.4. Segment labels printed inside the 2017 column: North America, Western Europe, APAC, All other. No legend; series are identified by in-bar labels on the 2017 column only. Highlighted points: none. Baseline: thin white horizontal axis line at 0, spanning from about 7% to 73% of slide width. No gridlines. Columns have square corners and no outlines. Footer and source are text; the two small images near the footer are footer artwork (see elements).
Slide 30
The spread of spending power
Global middle class* (billions of people)
4
3
All other
2
APAC
1
0
2009
2020
Europe
North America
©2018 Andreessen Horowitz. Page 29
Source: OECD. *Global middle class defined as daily expenditures between $10 and $100 per person in PPP.
Visuals: Chart: stacked column chart, no chart title beyond the subtitle 'Global middle class* (billions of people)'. Y-axis: numeric, labelled 0 to 4 in billions of people, gridlines none, tick labels 0, 1, 2, 3, 4. X-axis: two categories, 2009 and 2020, baseline white. Series from bottom to top: North America (orange #D98228), Europe (blue #6C96B2), APAC (magenta #BE4681), All other (grey #838586). Printed values: none; segment values are not printed, so estimates for 2009 are about 0.3 North America, about 0.7 Europe, about 0.5 APAC, about 0.3 All other, total about 1.8 billion; estimates for 2020 are about 0.3 North America, about 0.7 Europe, about 1.7 APAC, about 0.5 All other, total about 3.2 billion. Legend: none; series are labelled directly inside the bars. Highlighted points: none. Source note printed at bottom right.
Slide 31
And the spread of spending online / Global ecommerce ($tr) / 2.5 / 2.0 / All other / 1.5 / China / 1.0 / Western Europe / 0.5 / USA / 0.0 / 2005 / 2016 / Source: McKinsey / ©2018 Andreessen Horowitz. Page 30
Visuals: Chart: vertical stacked column chart, no chart title beyond the slide's subtitle 'Global ecommerce ($tr)'. Y axis: $tr, range 0.0 to 2.5, labelled ticks at 0.0, 0.5, 1.0, 1.5, 2.0, 2.5, no gridlines. X axis: categories 2005 and 2016, white baseline. Series (bottom to top, the same colour key for both years): USA, orange #D98228; Western Europe, steel blue #6C96B2; China, magenta-pink #BE4681; All other, mid grey #838586. The 2016 column carries labels USA, Western Europe, China and All other inside its segments; the 2005 column has no segment labels. No values are printed on the slide. Estimated values from bar heights: 2005 total about 0.49, USA about 0.17, Western Europe about 0.13, All other about 0.19 (no China segment shown for 2005). 2016 total about 2.10, USA about 0.46, Western Europe about 0.34, China about 0.82, All other about 0.48. Legend: none; segment labels serve as the legend. Highlighted points: none. Bars are flat, unshadowed rectangles, about 13% of slide width each.
Slide 32
USA in the middle of the pack
Ecommerce share of retail spending, 2017
25%
20%
15%
10%
5%
0%
China
SK
UK
USA
Western
Europe
Japan
India
Eastern
Europe
Russia
Brazil
©2018 Andreessen Horowitz. Page 31
Source: Goldman Sachs, ONS
Visuals: Vertical bar chart. Title: none inside the chart; the slide headline and subtitle serve as the chart heading (subtitle: Ecommerce share of retail spending, 2017). Y-axis: percentage of retail spending, 0% to 25%, gridlines none, tick labels at 0%, 5%, 10%, 15%, 20%, 25%. X-axis: categories, no axis title. Ten bars, one series, with values printed nowhere on the slide; values are estimates: China about 22%, SK about 21%, UK about 17.4%, USA about 9%, Western Europe about 8%, Japan about 6%, India about 5.8%, Eastern Europe about 5.5%, Russia about 5.2%, Brazil about 5.2%. Bars are sorted in descending order, left to right. Highlighted point: the USA bar is orange, all others are steel blue. Legend: none. The baseline is a thin white horizontal line at y about 81%, spanning x about 7.8% to 73.8%. Bar widths are about 2.6% of slide width, evenly spaced at about 6.7% pitch.
Slide 33
Global company creation
75%
Bubble size = users
50%
TTM Revenue growth
25%
Amazon
0%
0
50
100
150
200
250
Apple
300
TTM Revenue ($bn)
©2018 Andreessen Horowitz. Page 32
Source: Bloomberg, companies
Visuals: Bubble chart titled 'Global company creation' with no printed chart title. X-axis: 'TTM Revenue ($bn)', linear, range 0 to 300, ticks labelled every 50 (0, 50, 100, 150, 200, 250, 300). Y-axis: 'TTM Revenue growth', linear, range 0% to 75%, ticks labelled every 25% (0%, 25%, 50%, 75%). Axis units are $bn and percent. The y-axis title is rotated 90 degrees. The x-axis is a white horizontal line only; there is no visible y-axis line and no gridlines. Four bubbles, all filled #6C96B2 with no outline, labelled directly with company names; no printed values, so positions are estimates. Facebook: about 49 $bn TTM revenue and about 46% growth, the second-largest bubble. Google: about 125 $bn and about 25% growth, the largest bubble. Amazon: about 209 $bn and about 38% growth, the smallest bubble. Apple: about 255 $bn and about 14% growth, the third-largest bubble. Bubble size encodes users per the note 'Bubble size = users'; no size legend or scale is printed. No highlighted points and no legend. Logos: none visible on the slide.
Slide 34
Global company creation
75%
Bubble size = users
50%
TTM Revenue growth
Netflix
Amazon
25%
Apple
0%
0
50
100
150
200
250
300
TTM Revenue ($bn)
©2018 Andreessen Horowitz. Page 33
Source: Bloomberg, companies
Visuals: Bubble scatter chart. Title: none printed inside the chart area. X axis: 'TTM Revenue ($bn)', linear, labelled 0, 50, 100, 150, 200, 250, 300, range 0 to 300. Y axis: 'TTM Revenue growth', labelled 0%, 25%, 50%, 75%, range 0% to about 80%. Series, one per company, bubble size encodes users, all bubbles circular: Facebook centred at about x 50 and y about 47% (bubble diameter about 7.2% of slide width, largest after Google); Google centred at about x 125 and y about 25% (largest bubble, about 8.4% of slide width); Amazon centred at about x 209 and y about 38% (small bubble); Apple centred at about x 255 and y about 14% (medium bubble); Netflix centred at about x 15 and y about 37% (smallest bubble, orange, the only highlighted point). Values are estimates marked 'about' because the slide prints no data labels. Bubbles are labelled by name to their right. Legend: none; a text note reads 'Bubble size = users'. Bubble fill #6C96B2 steel blue except Netflix in orange about #DD8A26. Axis line: single white horizontal baseline at y 0%. No gridlines. Footer contains a small raster copyright line and a small raster source line; a further small raster element sits within the footer at x 14.8%.
Slide 35
Global company creation / 75% / Bubble size = users / Alibaba / 50% / TTM Revenue growth / Tencent / Facebook / 25% / Amazon / Netflix / Baidu / Google / 0% / 0 / 50 / 100 / 150 / 200 / 250 / 300 / TTM Revenue ($bn) / Apple / ©2018 Andreessen Horowitz. Page 34 / Source: Bloomberg, companies
Visuals: Bubble chart with no chart title. X-axis: TTM Revenue ($bn), linear, range 0 to 300, tick labels every 50 (0, 50, 100, 150, 200, 250, 300), white axis baseline. Y-axis: TTM Revenue growth, linear, range 0% to 75%, tick labels 0%, 25%, 50%, 75%; no gridlines. Bubble size encodes users; a legend-style note reads 'Bubble size = users' with no size scale. Bubbles with about values: Alibaba about x 43 $bn, about y 67%, pink; Tencent about x 43 $bn, about y 54%, pink, overlapping Facebook; Facebook about x 49 $bn, about y 46%, blue, largest on the left cluster and partly behind Tencent; Netflix about x 15 $bn, about y 37%, small orange bubble overlapping Baidu's top edge; Baidu about x 15 $bn, about y 32%, pink; Amazon about x 209 $bn, about y 38%, small blue; Google about x 125 $bn, about y 25%, large blue, the largest bubble on the chart; Apple about x 255 $bn, about y 14%, blue, the second-largest bubble. Each bubble has its name as a label immediately to its right. No highlighted points or legend colour key.
Slide 36
Unicorns are born outside Silicon Valley! / Last reported valuation ($bn) / 80 / 60 / 40 / 20 / 0 / Byte / Meituan / Didi / Lufax / Spotify / Flipcart / DJI / Grab / Ola / dance Dianping Chuxing / ©2018 Andreessen Horowitz. Page 35 / Source: Press reports, companies, Bloomberg
Visuals: Chart: vertical bar chart, title 'Unicorns are born outside Silicon Valley!' with subtitle 'Last reported valuation ($bn)'. Y-axis labelled in $bn with ticks 0, 20, 40, 60, 80 (range 0 to 80), no gridlines. X-axis is categorical with nine companies. Single series, bars in #6C96B2 steel blue, no data labels printed. Values are not printed, so estimates are: ByteDance about 75, Meituan Dianping about 55, Didi Chuxing about 50, Lufax about 35, Spotify about 25, Flipcart about 21, DJI about 15, Grab about 10, Ola about 4. Bars are in descending order from left to right, evenly spaced, each about 3% of slide width wide. Horizontal baseline axis line in light grey #D9D9D9 at y about 80.9%, spanning x about 7.2% to 73.2%, about 2px thick. No legend. No highlighted points.
Slide 37
Venture spreads outside the USA
Share of venture investment by value
100%
UK
India
75%
China
50%
25%
USA
0%
1995
2017
©2018 Andreessen Horowitz. Page 36
Source: CAE, Pitchbook
Visuals: Chart: 100% stacked column chart with no chart title inside the plot. Y-axis runs 0% to 100% in 25% steps, labelled 0%, 25%, 50%, 75%, 100%, with no unit beyond the percent sign. X-axis categories are 1995 and 2017, with a thin white horizontal baseline at 0%. Series, bottom to top: USA (blue #6C96B2), China (orange #D98228), India (magenta #BE4681), UK (green #95CA53). Values are not printed; estimates: 1995 column has USA about 95%, China about 1%, India about 1%, UK about 2%, total about 99%. 2017 column has USA about 51%, China about 24%, India about 4%, UK about 4%, total about 84%. Segment labels are printed inside the 2017 column only: UK (top), India, China, USA. No legend. No highlighted points. Column width is equal for both bars.
Slide 38
What’s the opportunity?
Market size, 2017 ($tr)
6
5
4
3
2
1
0
US ecommerce
US retail
©2018 Andreessen Horowitz. Page 37
Source: BLS
Visuals: Column chart, titled 'Market size, 2017 ($tr)'. Y-axis: linear, labelled with integers 0 to 6 with no unit label on the axis itself (unit given in subtitle as $tr, trillions of dollars), range 0 to 6, no gridlines. X-axis: two categories, 'US ecommerce' and 'US retail', with a thin white horizontal baseline at 0. Series (one series, two bars, no printed data values): US ecommerce, orange bar, about 0.45 ($tr); US retail, blue-grey bar, about 5.75 ($tr). Values are estimates read from bar heights against the axis scale. No legend. No highlighted points. Bars are flat rectangles with no outline. Bar width about 6.6% of slide width.
Slide 39
What’s the opportunity?
Market size, 2017 ($tr)
50
40
$40tr
30
20
10
0
$450bn
US ecommerce
US retail
Retail
Consumer spending
Visuals: Bar chart, no chart title beyond the slide subtitle 'Market size, 2017 ($tr)'. Vertical axis: value in trillions of US dollars, labelled 0, 10, 20, 30, 40, 50, no unit label on axis ticks, range 0 to 50. Horizontal axis: four categories, labelled US ecommerce, US retail, Retail, Consumer spending. One series, four bars. US ecommerce: $450bn (printed label above bar; about 0.45 on the $tr axis), drawn in orange, very short. US retail: no printed value, about 5.5 (estimate). Retail: no printed value, about 25 (estimate). Consumer spending: $40tr (printed label above bar, about 40 on the axis). Bars are steel blue, except the US ecommerce bar which is orange. No legend. Highlighted points: the orange US ecommerce bar and the orange subtitle text. Baseline is a thin white horizontal line at 0. Footer logos/images: none beyond the footer text rendered as images.
Slide 40
New problems / ©2018 Andreessen Horowitz, Page 39
Slide 41
From easy to hard? / First 20 years / Next 20 years / Things that work with low penetration / and little capital / Low touch goods / Selling tools / Information arbitrage / Things that need high penetration and lots / of capital / High touch goods / Full stack / Information businesses / ©2018 Andreessen Horowitz. Page 40
Visuals: Two-tone comparison panel with a chevron divider. There is no photograph, chart, table or logo. The left panel is a mid-dark grey rectangle (#626465) from x 0 to about 48.8% and y 30.1% to 89.4%. The right panel is a lighter grey rectangle (#838586) from about x 39.6% to the right edge and the same vertical span. Between them a dark slate chevron band (#40484F) about 2.9 to 4% of the width wide points right; its top starts near x 42.3% and its point is near x 48.8% at about 60% of the height, before returning to the bottom near x 43.9%. The chevron visually separates the two panels. Nothing else is drawn.
Slide 42
New problems: restaurant listings to restaurant delivery
Low capital needs
High capital needs
Selling tools
Building the full stack
Information arbitrage
Information as system
©2018 Andreessen Horowitz. Page 41
Visuals: Left: Yelp logo, a black lowercase 'yelp' wordmark with a white outline and a red asterisk-like burst mark to its right, with a small registered symbol; occupies about x 10.5%, y 32.9%, w 19.0%, h 16.4%; placed as a raster image without a box. Centre: a solid flat gray (#7F7F7F) right-pointing block arrow with a rectangular shaft and triangular head, no outline, at x 36.6%, y 37.7%, w 15.6%, h 6.7%. Right: DoorDash logo, a red-orange (#FF3008) stylised D-shaped chevron icon above the uppercase wordmark 'DOORDASH' in a wide geometric sans-serif, occupying about x 59.4%, y 29.7%, w 26.3%, h 22.7%. No charts, tables or photographs. A small image fragment near the footer at x 14.8%, y 95.5% (1.7% by 3.1%) appears to be the tail of the footer text.
Slide 43
New problems / $40tr / Health / Clothes / Household / Entertainment / Food / Transport / Housing / Global consumer spending / ©2018 Andreessen Horowitz. Page 42 / Source: World Bank, UN
Visuals: A single stacked column chart with no axes, gridlines or legend. Segments from bottom to top: Housing (orange #D98228, y 69.4 to 84.8%), Transport (purple #773F9B, y 61.5 to 69.4%), Food (green #95CA53, y 51.4 to 61.5%), Entertainment (steel blue #6C96B2, y 40.5 to 51.4%), Household (magenta #C0467E, about y 37.1 to 40.5%), Clothes (purple #7B3F9B, about y 34.0 to 37.1%), Health (brown #7F4A1A, about y 31.6 to 34.0%), and two unlabelled grey segments (#8A8A8A, about y 29.2 to 31.6%) at the top. Each labelled segment carries its label in white centred text. The column width is 9.9% of slide width. The total is printed above the column as $40tr. A white horizontal baseline (about 0.2% thick) runs under the column and carries the caption Global consumer spending beneath it. No values are printed for individual segments.
Slide 44
New problems / First 20 years / $40tr / Next 20 years / Symptoms / Editing DNA / Mail-order books / Netflix / Health / Restaurant reviews / Food delivery / Clothes / Household / Grocery delivery / Entertainment / Tickets / Airbnb, autonomy / Listings, mortgage comparison / Mortgages, houses, liquidity / Food / Transport / Global consumer spending / Housing / ©2018 Andreessen Horowitz. Page 43 / Source: World Bank, UN
Visuals: Diagram: a single vertical stacked bar chart titled '$40tr' (bold, gold) above the bar, captioned 'Global consumer spending' below a horizontal white baseline rule. Segments from top to bottom: an unlabelled grey segment (about #8A8A8A, about 2% of height), Health (brown about #8B4A1A), Clothes (purple about #7B3FA0), Household (magenta-pink about #C0457F), Entertainment (#6C96B2), Food (#95CA53), Transport (#773F9B), Housing (#D98228, largest, bottom). Segment labels are centred in white text. Eight grey dotted arrows with solid triangular heads: four point from left labels into the bar's left edge (Symptoms to Health, Mail-order books and Restaurant reviews to Entertainment, Tickets to Transport, Listings and mortgage comparison to Housing); five point from right labels into the bar's right edge (Editing DNA to Health, Netflix and Food delivery to Entertainment, Grocery delivery to Food, Airbnb and autonomy to Transport, Mortgages houses liquidity to Housing). Arrow lines are about #A0A6AC, roughly 0.3% of slide height, dotted. No chart axes or numeric scale.
Slide 45
Two models of retail
Packets versus preference
Retail as logistics
Sears, Walmart
Retail as tastemaker
Boutiques, big cities
©2018 Andreessen Horowitz. Page 44
Visuals: Two outlined circles and one double-headed connector. Left circle: outline ring in orange (about #D98025), stroke about 0.4% of slide width, no fill, diameter about 36.4% of slide width, top-left corner at x 7.0%, y 24.6%, containing the bold heading 'Retail as logistics' and the line 'Sears, Walmart'. Right circle: outline ring in steel blue (about #6A96B0), same stroke width and size, top-left corner at x 56.6%, y 24.6%, containing 'Retail as tastemaker' and 'Boutiques, big cities'. Connector: a horizontal dotted line in light grey (about #A8A8A8), roughly 1% of slide height thick, from x 43.4% to x 56.6% at y about 56.6%, with solid filled triangular arrowheads at both ends, the left pointing left and the right pointing right. The connector touches the outer edges of both circles at the vertical centre line of the circles. Two small raster images sit in the footer: one about 194 by 26 px (x 2.9%, y 95.5%) carrying the copyright text in light grey-white, and one about 56 by 52 px (x 14.8%, y 95.5%) whose content is not legible at this size. No photographs, charts, or icons.
Slide 46
So far, the internet has mostly tackled logistics
Packets versus preference
Retail as logistics
Sears, Walmart
Amazon
Retail as tastemaker
Boutiques, big cities
©2018 Andreessen Horowitz. Page 45
Visuals: Two outlined circles and one double-headed connector arrow; no photographs, charts or logos. Left circle: outline ring in burnt orange #D9822B, stroke about 0.4% of slide width, unfilled, diameter about 36% of slide width, containing the bold heading 'Retail as logistics' and the lines 'Sears, Walmart' and bold 'Amazon'. Right circle: outline ring in steel blue #5E8FAE, same stroke weight and size, unfilled, containing the bold heading 'Retail as tastemaker' and 'Boutiques, big cities'. Connector: a horizontal double-headed arrow between the circles at about 56% from the top, spanning the gap from the left circle's right edge to the right circle's left edge, dotted line in mid grey #A6A6A6 with solid filled triangular arrowheads of the same grey at both ends.
Slide 47
New waves of logistics
Packets versus preference
Retail as logistics
+ Same day delivery
+ Free delivery
+ Groceries
Retail as tastemaker
©2018 Andreessen Horowitz. Page 46
Visuals: Two outline circles of equal size joined by a double-headed dotted grey arrow. Left circle: orange ring (#D98324), about 3 px stroke at 1125 px slide height, no fill, containing the heading 'Retail as logistics' (bold, centred) and a left-aligned bulleted list of three items: '+ Same day delivery', '+ Free delivery', '+ Groceries' (with 'Groceries' in bold). Right circle: steel-blue ring (#5E8FB0), same stroke weight, no fill, containing the heading 'Retail as tastemaker' (bold, centred). Arrow: grey (#A8A8A8) dotted line, about 2.5% of slide height tall including arrowheads, filled triangular heads at both ends, spanning the gap between the circles at the vertical centre of the circles. No photographs, illustrations or logos apart from the small footer image.
Slide 48
And pushing into new kinds of decision
Packets versus preference
Retail as logistics
Retail as tastemaker
©2018 Andreessen Horowitz. Page 47
Visuals: Two circle outlines and one triangle, no photographs or charts. Left circle: outline ring, orange (#D7802A), about 2 px stroke, unfilled, centred near x 25%, y 63%, roughly 36% of slide width and 65% of slide height in diameter. Right circle: outline ring, steel blue (#5E93B0), same stroke weight and size, centred near x 75%, y 63%. Between them: a solid right-pointing isosceles triangle with fill #7F7F7F, apex pointing right at about x 53.5%, y 53.5%, base vertical on the left edge at x 46.5%, spanning y 26.9% to 86.5%. No shadows, no gradients. The footer line is a small raster image of the copyright text, about 194 by 26 px, with a second small 55 by 52 px image at x 14.8% overlapping the footer text area.
Slide 49
(All of which will affect the USA more than most…) / Retail square feet per capita, 2017 / 25 / 20 / 15 / 10 / 5 / 0 / USA / Canada / Australia / UK / France / China / Germany / ©2018 Andreessen Horowitz. Page 48 / Source: iCSC
Visuals: Chart: vertical bar chart, untitled inside the chart (the title and subtitle sit above it as slide text). Y-axis: unlabelled units, scale 0 to 25 with gridlines absent and tick labels at 0, 5, 10, 15, 20 and 25. X-axis: seven categories in this order, USA, Canada, Australia, UK, France, China, Germany. Series: one series, retail square feet per capita, 2017. Values: USA 24 (the slide prints no value; about 24), Canada about 16, Australia about 11, UK about 5, France about 4, China about 3, Germany about 2. Highlighted point: the USA bar is orange #D98228 while the other six bars are steel blue #6C96B2. Bars are flat rectangles of equal width (about 3.8% of slide width) with even spacing. The baseline is a thin white horizontal axis line at the zero value running from about 7.2% to 73.2% of slide width. No legend. The two small raster images at the footer positions (194 by 26 px at the bottom-left and 82 by 27 px at the bottom-right, and a 56 by 52 px image near 14.8%) appear to carry the footer and source text; their content is not separately legible.
Slides 50 to 106 continue in the full text file.
Download this deck
The hosted PDF of every library deck is free for readers of the SlideDeck Co newsletter. Join with your email and the viewer and download appear here.
Building a deck of your own? The SlideDeck Co Standard Deck is a slide library for business presentations: reviews, updates and plans.







