
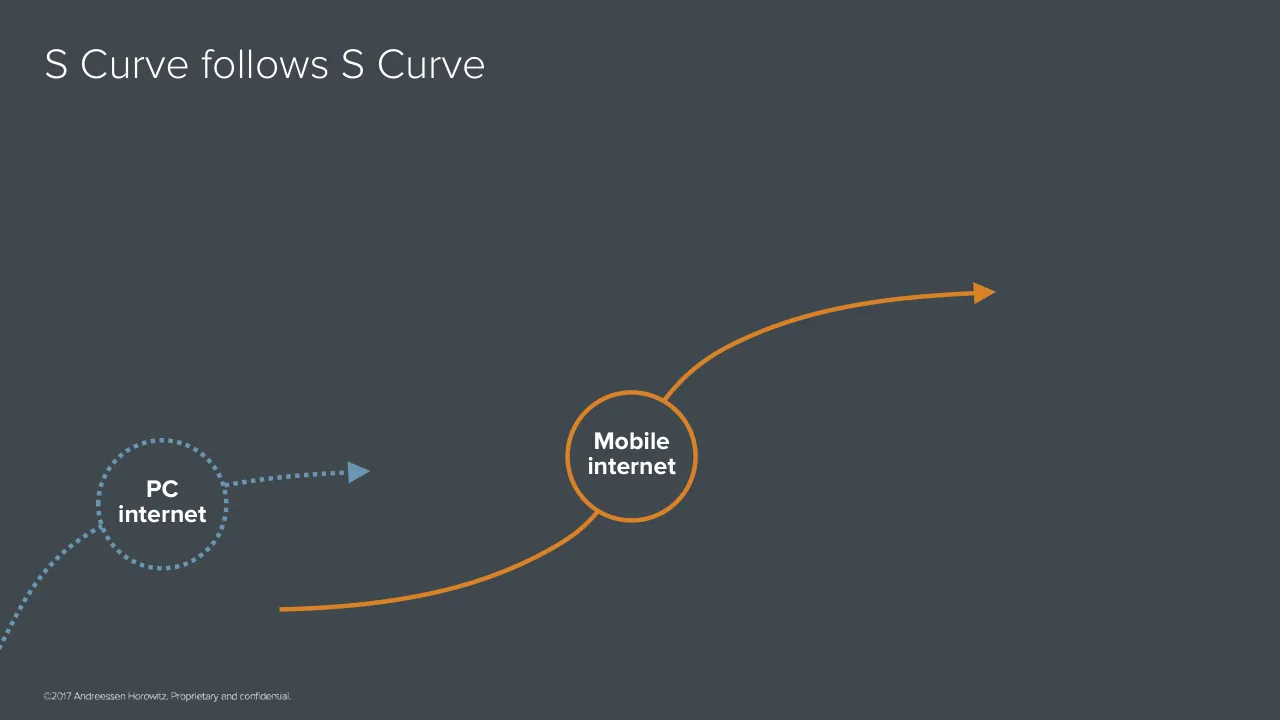
The deck opens with a title slide and a speaker card for Benedict Evans, a partner at Andreessen Horowitz, presenting at the a16z Summit. It builds an argument in sections: first S curves, showing the PC installed base giving way to smartphones and the move from PC internet to mobile internet, then the scale and character of today's largest technology companies, then four emerging S curves to watch: AI, autonomy, mixed reality and cryptocurrency. Each section uses long runs of simple one-idea slides, with charts, diagrams and quotations rather than bullet lists. The talk closes on a return to the theme of innovation, a recap of the four emerging curves and a short thank-you slide. Slides worth seeing include the S curve charts that carry the first argument, the layered diagram of mobile and PC internet, and the single-quote slide that sets up the crypto comparison.
Slides worth studying
Questions about this deck
What does the Benedict Evans deck say about AI?
Slide 29 lists AI as one of four emerging S Curves to consider, alongside autonomy, mixed reality and cryptocurrency. Slide 30 is a section slide titled AI, and slide 32 lists unhelpful ways to talk about AI.
How is the Benedict Evans Ten Year Futures deck structured?
The deck opens with a title slide and a speaker card for Benedict Evans, a partner at Andreessen Horowitz (slides 1 and 2). It moves through S curves of PC and mobile internet (slides 3 to 11), the scale of today's largest tech companies (slides 14 to 24), and then new S curves, starting with the question on slide 25.
What does the Benedict Evans deck say about Microsoft's share of personal computing?
Slide 21, titled But winners always look invulnerable, until they don't, shows a line chart of Microsoft's share of personal computing unit sales (PCs, Macs, Linux, smartphones and tablets) from 2000 to 2016 on a 0% to 100% scale.
What quote from Marc Andreessen appears in the Benedict Evans deck?
Slide 10 quotes Marc Andreessen: I arrived in Silicon Valley in 1994 and I thought I was too late and missed the whole thing.
Details
- Company: Benedict Evans
- Year: 2017
- Type: Conference talk
- Industry: Venture capital
- Pages: 76
More from Benedict Evans
- Benedict Evans conference talk, 2026
- Benedict Evans conference talk, Autumn 2025
- Benedict Evans conference talk, Spring 2025
- Benedict Evans conference talk, 2023
- Benedict Evans conference talk, 2023
- Benedict Evans strategy presentation, 2022
All Benedict Evans decks in the library
Review score: 8 out of 10, Strong
Presentation quality, judged with the SlideDeck Co review heuristic. Ask, evidence and idea merit are not rated here.
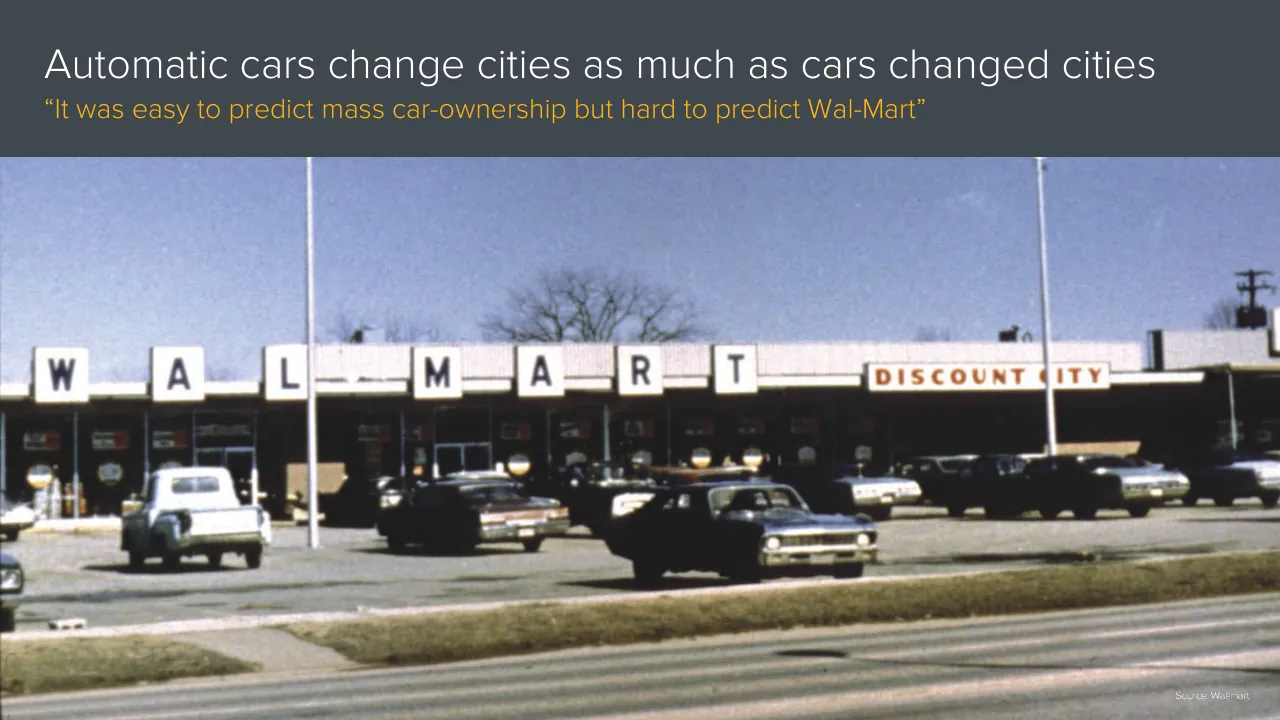
Each slide carries one idea in a plain headline, and the argument builds in steps: the PC and smartphone installed-base charts (slides 3 to 6) set up S curves, the layered curve diagrams (slide 7 onward) follow, and orange divider slides then mark each section. The system holds from start to finish: dark slate ground, orange and blue accents, gold subtitles, consistent chart styling with sources, and full-bleed or half-slide photos that carry a point, such as the washing machine versus robot pair and the Wal-Mart photo on slide 60. Slides 7 and 26 are sparse but readable, with large type and good contrast. The weaknesses are that some slides lean on the speaker to supply meaning (slide 7 is mostly empty, and slides 49 and 50 are near-repeats), small footers and some axis labels are tiny, and a few diagram slides such as slides 5 and 6 repeat the same frame with only minor additions; this is acceptable for live delivery but weaker as a read-alone file.
Worth keeping: Keep the one-idea-per-slide discipline, the dark ground with orange and blue accents, the clean chart styling, and the orange section-divider questions that signal each new curve.
Most useful repair: Cut or merge the near-duplicate build slides (such as 5 and 6 and 49 and 50) and enlarge the footers and chart axis labels where they fall below comfortable reading size.
What would change the score: I would add a short on-slide takeaway to the sparsest diagram slides, such as slide 7, so they still communicate when read without the speaker.
Confidence medium. 72 of 76 pages inspected on contact sheets, 4 at readable size. Reviewed 2026-11-08. Model-assisted review (claude-sonnet-5-5).
Full text of the slides (76 slides)
Every slide's words and a description of its charts and images, so the deck can be searched and rebuilt. Also available as Markdown.
Slide 1
Ten Year Futures
Benedict Evans
November 2017
www.ben-evans.com
Slide 2
Ten Year Futures
BENEDICT EVANS
Partner
Andreessen Horowitz
a16zSummit
Visuals: Full-bleed illustration of a dense field of tall, angular 3D bars or columns in slate grey, rising and receding toward the upper right and fanning out from the lower left, with soft shading and a subtle depth-of-field fade. Three white diagonal bands run from the lower-right corner up toward the right edge at about 45 degrees, forming wedge shapes with dark slate gaps between them; they overlap the bar field and are fully opaque. Lighting is soft and diffuse from the upper left. Dominant colours are slate grey #40484F and white #FFFFFF. The image is full-bleed, not cropped or boxed, with a slate tint over it. Logo: the a16zSummit wordmark in white, lowercase sans-serif, with four vertical bars of ascending height to the right in blue-grey, magenta, green and amber.
Slide 3
S Curves / Global PC installed base (bn) / 2.0 / 1.5 / 1.0 / 0.5 / 0.0 / 1985 / 1990 / 1995 / 2000 / 2005 / 2010 / 2015 / ©2017 Andreessen Horowitz. Proprietary and confidential. / Source: Apple, Google, a16z, TMW, ITU, World Bank
Visuals: Chart: line chart, title none on the chart itself; the slide subtitle reads 'Global PC installed base (bn)'. Y axis: 'Global PC installed base (bn)', numeric range 0.0 to 2.0, labelled ticks at 0.0, 0.5, 1.0, 1.5, 2.0; units billions (bn). X axis: years, labelled ticks at 1985, 1990, 1995, 2000, 2005, 2010, 2015; series runs from about 1985 to about 2017. No printed data values; estimates: 1985 about 0.03 bn, 1990 about 0.08 bn, 1995 about 0.19 bn, 2000 about 0.47 bn, 2005 about 0.73 bn, 2010 about 1.35 bn, 2012 about 1.54 bn, 2013 about 1.54 bn, 2015 about 1.50 bn, 2017 about 1.42 bn. Single series drawn as a magenta-pink line about 4 px thick in #B83C7E, with a smooth rise, a plateau around 2012 to 2013, and a slight decline to 2017. Legend: none. Highlighted points: none. The horizontal x-axis baseline is a thin white line at 0.0 running from about 7.2% to 80.8% of the width. Gridlines: none. Footer and source are small images of text. A third small image sits at the bottom-right corner (81 by 52 px) and shows nothing visible in the render.
Slide 4
S Curves
Global installed base (bn)
4
3
2
1
0
1985
1990
1995
2000
2005
2010
2015
iOS & Android
smartphones
PCs
©2017 Andreessen Horowitz. Proprietary and confidential.
Source: Apple, Google, a16z, TMW, ITU, World Bank
Visuals: Chart: area-and-line chart, with no chart title inside the plot. Y axis is labelled 0, 1, 2, 3, 4 (unit: billions, bn, per the subtitle 'Global installed base (bn)'), range 0 to 4. X axis is labelled 1985, 1990, 1995, 2000, 2005, 2010, 2015 (years), spanning 1985 to about 2017. Series 1 'iOS & Android smartphones' is a filled area in #6C96B2, starting near 0 in 2008, about 0.03 in 2009, about 0.15 in 2010, about 0.4 in 2011, about 0.8 in 2012, about 1.6 in 2013, about 2.5 in 2015, about 2.85 in 2016 and about 3.2 in 2017 (all values estimated, none printed). Series 2 'PCs' is a line in magenta #C2468A, starting about 0.03 in 1985, about 0.2 in 1995, about 0.6 in 2003, about 1.0 in 2007, about 1.3 in 2010, peaking about 1.5 in 2013, and ending about 1.4 in 2017 (all estimated, none printed). No highlighted points. Legend at right: a #6C96B2 swatch labelled 'iOS & Android smartphones' above a #C2468A line swatch labelled 'PCs'. The x-axis baseline is a thin white horizontal rule. No gridlines, no tick marks, no data labels.
Slide 5
S Curves / Global installed base (bn) / 6 / 5 / 4 / 3 / 2 / 1 / 0 / 1985 / 1990 / 1995 / 2000 / 2005 / 2010 / 2015 / Mobile users / iOS & Android / smartphones / PCs / ©2017 Andreessen Horowitz. Proprietary and confidential. / Source: Apple, Google, a16z, TMW, ITU, World Bank
Visuals: Chart: overlapping area and line chart titled by the slide subtitle 'Global installed base (bn)'. Y axis: 0 to 6 bn, labelled 0, 1, 2, 3, 4, 5, 6 with gridlines absent. X axis: years 1985 to 2017, labelled 1985, 1990, 1995, 2000, 2005, 2010, 2015. Series 1, Mobile users: light blue-grey filled area (#A7C0D1) rising from about 0.0 in 1985 to about 0.5 in 2001, about 1.6 in 2005, about 2.7 in 2008, about 3.5 in 2010, about 4.4 in 2013, about 4.9 in 2016 and about 5.05 in 2017. Series 2, iOS & Android smartphones: mid blue filled area (#6C96B2) at about 0.0 until 2008, about 0.15 in 2010, about 0.4 in 2011, about 0.8 in 2012, about 1.5 in 2013, about 2.0 in 2014, about 2.45 in 2015, about 2.9 in 2016 and about 3.2 in 2017. Series 3, PCs: magenta line (#C44A8E), about 0.03 in 1985, about 0.4 in 1999, about 0.55 in 2002, about 1.0 in 2008, about 1.45 in 2011, about 1.5 peak in 2013 to 2014, falling to about 1.4 in 2017. No highlighted points. Legend: at the right of the plot, three entries top to bottom: light blue-grey swatch with 'Mobile users', mid blue swatch with 'iOS & Android smartphones', magenta line sample with 'PCs'. Baseline: thin white horizontal axis line at the zero level, spanning the plot width. Footer images: copyright and source lines rendered as small images of text. Bottom-right small image (81 by 52 px) is a logo-sized picture that is not legibly visible on the render.
Slide 6
S Curves
Global installed base (bn)
6
5
4
3
2
1
0
1985
1990
1995
2000
2005
2010
2015
Mobile users
iOS & Android
smartphones
PCs
Adults
©2017 Andreessen Horowitz. Proprietary and confidential.
Source: Apple, Google, a16z, TMW, ITU, World Bank
Visuals: Chart: an overlapping area and line chart titled 'Global installed base (bn)'. Y-axis: 0 to 6, unit billions (bn), integer ticks 0, 1, 2, 3, 4, 5, 6, printed as text with the zero at the baseline. X-axis: years 1985 to 2017, labelled every five years (1985, 1990, 1995, 2000, 2005, 2010, 2015), with the last plotted point at about 2017. Series: (1) Mobile users, light blue #A7C0D1 filled area, rising from about 0 in 1985 to about 0.6 around 2001, about 1.6 around 2005, about 3.5 around 2010, about 4.6 around 2014, and about 5.05 in 2017. (2) iOS & Android smartphones, mid blue #6C96B2 filled area, near 0 until about 2009, about 0.8 around 2012, about 2.0 around 2014, and about 3.2 in 2017; values are estimates, none printed. (3) PCs, magenta line (about #C4478A), about 0.02 in 1985, about 0.4 in 1999, about 1.2 around 2009, peaking about 1.5 around 2013 to 2014, and about 1.4 in 2017; estimates. (4) Adults, green line (about #9BC53D), about 3.2 in 1985, about 3.5 around 1990, about 4.2 around 2000, about 4.9 around 2009, and about 5.5 in 2017; estimates. Legend: four entries at right, Mobile users (light blue filled swatch), iOS & Android smartphones (mid blue filled swatch), PCs (magenta line swatch), Adults (green line swatch). No highlighted points. Footer: copyright and source lines are rendered as small images of text.
Slide 7
S Curve follows S Curve
Mobile
internet
PC
internet
©2017 Andreessen Horowitz. Proprietary and confidential.
Visuals: Diagram with two circles and two curved arrows. Left: a dotted-outline circle labelled 'PC internet' (white bold text), centred near x 7.7–17.7%, y 61.2–79.0%, with a dotted blue-grey (#6C96B2) stroke. A dotted blue-grey curve enters from the bottom-left edge (about x 0%, y 90%) and rises into the circle's left side; a second dotted blue-grey line leaves the circle's right side and ends in a small blue-grey (#6C96B2) triangular arrowhead at about x 48–52%, y 64–67%, pointing right. Right: a solid orange (#D98228) ring labelled 'Mobile internet' (white bold text), centred near x 44.3–54.3%, y 54.5–72.3%, with an orange stroke of about 0.5% of slide width and no fill beyond the background. A solid orange curve starts at about x 21.8%, y 80% at the bottom-left, rises through the bottom of the Mobile circle, continues out of its top-right and curves upward to an orange triangular arrowhead at about x 76–78%, y 22–24%, pointing right. The orange curve passes behind the Mobile circle; the circle has a fill matching the background. Shapes have no shadows, gradients or rounded rectangles; the only curved and filled elements are the circles and arrowheads. Copyright footer is a small logo-free text line.
Slide 8
Mobile now = PCs in 2005 / What can you build on top of the platform? / Ride-sharing, Instagram, Instacart… / SEO, SEM, Social… / Mobile / internet / PC / internet / ©2017 Andreessen Horowitz. Proprietary and confidential.
Visuals: Diagram: a left circle labelled 'PC internet' with a dotted blue (#6C96B2) outline, and a larger-looking right circle labelled 'Mobile internet' with a solid orange (#D98228) outline. A dotted blue line enters from the bottom-left edge, passes through the PC circle, and branches into three upward dotted arrows and one right-pointing arrow, labelled 'SEO, SEM, Social…'. A solid orange curve starts at lower-left (about x 21.8%, y 84.8%), passes through the Mobile circle, and rises to a solid right-pointing arrowhead at about x 77.8%, y 40.4%. Three dotted orange upward arrows branch from that curve toward the label 'Ride-sharing, Instagram, Instacart…'. No chart, table or photograph.
Slide 9
And the future is always boring when we get there
“Innovation is dead”
“Innovation is dead”
Mobile
internet
PC
internet
©2017 Andreessen Horowitz. Proprietary and confidential.
Visuals: Diagram. Two tall dark rectangles, each labelled “Innovation is dead” at the top, with a dotted light-blue circle labelled “PC internet” at the lower left, a small dotted light-blue arrow running from that circle's right edge into the left panel, and a curved dotted light-blue line entering from the bottom-left edge of the slide into the PC circle. A solid orange circle labelled “Mobile internet” sits between the two panels, with a solid orange curve starting at the bottom of the left panel, passing up through the Mobile circle, and ending in an orange arrowhead pointing right, inside the right panel. Stroke widths are about 0.5% of slide height for the orange lines and about 0.4% for the dotted blue lines. No axes, legend or photographs.
Slide 10
“I arrived in Silicon Valley in 1994 and I / thought I was too late and missed the / whole thing” / - Marc Andreessen / ©2017 Andreessen Horowitz. Proprietary and confidential.
Slide 11
But there’s always something else coming / PC / internet / Mobile / internet / ? / ©2017 Andreessen Horowitz. Proprietary and confidential.
Visuals: Diagram: three circles connected by curved and dotted arrows showing progression. Left circle (about 7.7% x, 61.2% y, 10% w, 17.8% h) is dark grey fill #40484F with a dotted light steel-blue outline #6C96B2 containing bold white text 'PC internet'; a dotted steel-blue line leaves its right edge at mid-height and ends in a small steel-blue triangular arrowhead pointing right at about x 27%, y 73%; a dotted steel-blue line also runs from the lower-left edge of the circle off the left edge of the slide, from about y 82% to the bottom-left corner at y 90%. Centre circle (about 44.3% x, 54.5% y, 10% w, 17.8% h) is dark grey #40484F with a solid orange #D98228 outline about 0.4% of slide width thick containing bold white text 'Mobile internet'; a thick orange curved arrow starts at the bottom-left of the slide around x 21.8%, y 85% and rises through the circle's bottom edge, out of its top-right edge, sweeping up and right to end in a solid orange triangular arrowhead at about x 77.5%, y 40.4%. Right circle (about 79.6% x, 48.7% y, 10% w, 17.8% h) is dark grey #40484F with a dotted steel-blue outline containing a large bold white question mark '?'; a dotted steel-blue line enters its left side from the left at about y 66% and another leaves its upper-right edge and runs up and off the top-right edge of the slide at about x 100%, y 33%. Footer image: small white copyright wordmark at bottom-left (about 2.9% x, 95.5% y, 20.3% w, 3.1% h), 305 by 26 pixels.
Slide 12
So, two innovation conversations today
‘What now?’ and ‘What next?’
What can we build on
the billion-scale
platforms we have
today?
What are the next
S Curves - what will
the next platforms be?
©2017 Andreessen Horowitz. Proprietary and confidential.
Visuals: Two outlined circles and one double-headed connector arrow, no photographs or charts. Left circle: orange outline (about #D9822B, roughly 0.3% of slide height stroke), no fill, centred at about x 25%, y 57%, spanning about x 7.0% to 43.4% and y 24.6% to 89.3%, containing the bold white text 'What can we build on / the billion-scale / platforms we have / today?'. Right circle: steel-blue outline (about #6393B5, same stroke weight), no fill, spanning about x 56.6% to 93.1% and y 24.6% to 89.3%, containing the bold white text 'What are the next / S Curves - what will / the next platforms be?'. Connector: thin dotted grey line (about #A8A8A8) running horizontally at y about 56.6% from the left circle's right edge (x 43.4%) to the right circle's left edge (x 56.6%), with solid filled grey triangular arrowheads at both ends pointing outward toward each circle. The footer is a small raster image of the copyright line in light grey-white text.
Slide 13
Massive experimentation around current platforms
New models and end-points
Bots? Voice? Smart speakers?
Wearables? Watches? Smart home?
TV shows? As marketing? Lock-in?
Social as pop culture, camera as
platform
VR? AR? Accessory or next platform?
Meta-conversation
Is there any white space left?
Can you even compete with
Google/Apple/Facebook/Amazon?
©2017 Andreessen Horowitz. Proprietary and confidential.
Visuals: Two-panel chevron graphic: a left panel in mid-dark grey #626465 and a right panel in lighter grey #838586 sit between y 30.1% and 89.4% of the slide height. The boundary between them is a chevron that points right, with a dark band #40484F about 2.5% of slide width wide running along the boundary, so the left panel's right edge notches inward and the right panel's left edge points left into it. The chevron tip is at about x 50% and y 60% of the slide. No photographs, charts, icons or logos other than the footer wordmark image.
Slide 14
Big scary tech giants / are nothing new… / ©2017 Andreessen Horowitz. Proprietary and confidential. / Source: Andy Hertzfield
Visuals: One photograph, full-height and full-bleed within the right 65% of the slide, not boxed and with no overlay or tint. Subject: an IBM logo mounted on a dark, rough textured wall, with a man in a dark leather bomber jacket, open-collared light shirt and light trousers leaning against the wall beneath it. He raises his right arm with the index finger pointing up, mouth open as if speaking, and stands near the centre-right of the image. A thin dark horizontal line runs across the wall at about 70% of the image height. The IBM letters are the classic horizontal-striped white logo, spanning roughly 49% to 86% of the slide width and 9% to 35% of the height. Composition: the logo is in the upper half and the figure is in the lower half, with the figure's legs cropped by the bottom edge. Lighting is flat, even and monochrome. Dominant colours are charcoal grey and off-white. The photo is 976 by 845 pixels.
Slide 15
But maybe there is something new about these?
Annual revenue ($bn, real)
800
Thousands
GAFA
600
Wintel
IBM
400
1980
1985
1990
1995
2000
2005
2010
2015
200
-
©2017 Andreessen Horowitz. Proprietary and confidential.
Source: Bloomberg, BLS, a16z
Visuals: Chart: stacked area chart, titled 'Annual revenue ($bn, real)'. Y-axis printed values: '-' (zero, at baseline), 200, 400, 600, 800, with the printed axis label 'Thousands' rotated along the left edge; the subtitle states the unit as $bn, real. X-axis: years 1980 to 2016 labelled every five years (1980, 1985, 1990, 1995, 2000, 2005, 2010, 2015); the series ends at about 2016. Series stacked bottom to top: IBM (orange #D98228), Wintel (steel blue #6C96B2), GAFA (magenta #BE4681). No values are printed on the data; estimates: total about 8 in 1980, about 60 in 2000, about 250 at the 2008 peak and about 690 in 2016. IBM about 90 at 2008, about 80 in 2016; Wintel top about 220 in 2016 (about 130 thick); GAFA about 470 thick in 2016 (from about 220 to about 690). Legend: vertical list at right with square markers, top to bottom GAFA (magenta), Wintel (blue), IBM (orange), in white text; no highlighted points. Footer and source are rendered as small text images.
Slide 16
Generational change in scale
Employees (000s)
150
Thousands
100
50
-
2000
2005
2010
2015
Microsoft
Apple
©2017 Andreessen Horowitz. Proprietary and confidential.
Source: Bloomberg
Visuals: Line chart titled 'Generational change in scale' with subtitle 'Employees (000s)'. Y-axis labelled 'Thousands', linear, from 0 (shown as '-') to 150, with gridline labels at 50, 100 and 150; no gridlines are drawn. X-axis runs from 2000 to 2016 with labels at 2000, 2005, 2010 and 2015, and a solid white baseline at zero. Four series: Microsoft as a dotted orange line, Google as a solid steel-blue line, Apple as a solid magenta line, and Facebook as a solid light-green line. Approximate values, none printed on the slide: Microsoft about 39 (2000), 46 (2001), 50 (2002), 55 (2003), 57 (2004), 61 (2005), 70 (2006), 79 (2007), 90 (2008), 92 (2009), 88 (2010), 89 (2011), 93 (2012), 99 (2013), 127 (2014), 118 (2015), 115 (2016). Google from 2004 about 3, 5 (2005), 10 (2006), 17 (2007), 20 (2008), 19 (2009), 24 (2010), 32 (2011), 53 (2012), 47 (2013), 53 (2014), 61 (2015), 71 (2016). Apple from 2000 about 8, 9 (2001), 12 (2002), 13 (2003), 14 (2004), 15 (2005), 18 (2006), 21 (2007), 31 (2008), 34 (2009), 46 (2010), 60 (2011), 73 (2012), 80 (2013), 92 (2014), 109 (2015), 116 (2016). Facebook from 2009 about 1, 2 (2010), 3 (2011), 5 (2012), 6 (2013), 9 (2014), 13 (2015), 17 (2016). Legend at the right, stacked vertically with line-sample swatches matching each series: dotted orange for Microsoft, solid steel blue for Google, solid magenta for Apple, solid green for Facebook. No highlighted points. Lines are about 0.5% of slide height thick. The copyright and source lines are rendered as small images of text.
Slide 17
Engineers, salespeople, retail, logistics…
Employees (000s)
400
Thousands
Microsoft
300
Apple
200
Amazon
2000
2005
2010
2015
100
-
©2017 Andreessen Horowitz. Proprietary and confidential.
Source: Bloomberg
Visuals: Line chart titled 'Engineers, salespeople, retail, logistics…' with subtitle 'Employees (000s)'. Y-axis: 'Thousands' label, ticks at -, 100, 200, 300, 400 (zero shown as '-'); range 0 to 400 thousand employees. X-axis: years 2000 to 2016, labelled 2000, 2005, 2010, 2015 (ticks at 5-year intervals, data points roughly annual). Five series, values are estimates marked about because no values are printed: Microsoft (orange dotted line): about 38 in 2000, about 60 in 2005, about 88 in 2010, about 125 in 2014, about 115 in 2016. Google (steel-blue solid line, starts 2004): about 3 in 2004, about 22 in 2010, about 52 in 2012, about 45 in 2013, about 70 in 2016. Apple (magenta-pink solid line): about 8 in 2000, about 13 in 2005, about 45 in 2010, about 70 in 2012, about 90 in 2014, about 107 in 2015, about 115 in 2016. Facebook (green solid line, starts 2009): about 1 in 2009, about 5 in 2013, about 15 in 2016. Amazon (amber/yellow solid line): about 8 in 2000, about 10 in 2005, about 33 in 2010, about 85 in 2012, about 115 in 2013, about 152 in 2014, about 230 in 2015, about 340 in 2016 (steepest rise, ending highest). Legend at right lists Microsoft (dotted), Google, Apple, Facebook, Amazon, each with a short line swatch in its series colour. No highlighted points. The image-based footer marks are described in elements.
Slide 18
LOTS of logistics
Employees (000s)
750
500
250
-
Thousands
Microsoft
Apple
Amazon
2000
2005
2010
2015
©2017 Andreessen Horowitz. Proprietary and confidential.
Source: Bloomberg
Visuals: Line chart titled 'LOTS of logistics' with subtitle 'Employees (000s)'. Y-axis: linear, unit thousands of employees, labelled 0 (shown as '-'), 250, 500 and 750 (top of range about 750; the axis label 'Thousands' is positioned vertically at the far left). X-axis: years 2000 to about 2017, tick labels 2000, 2005, 2010, 2015. Series (values are about estimates, as no data labels are printed): Microsoft, dotted orange line, about 40 in 2000, about 60 in 2005, about 90 in 2010, about 120 in 2015 and about 115 in 2016. Google, steel-blue line, starts about 2004 near 0, about 25 in 2010, about 55 in 2012, about 60 in 2015 and about 75 in 2016. Apple, magenta line, about 10 in 2000, about 50 in 2010, about 90 in 2014 and about 115 in 2016. Facebook, green line, starts about 2009 near 0, about 5 in 2012, about 10 in 2014 and about 15 in 2016. Amazon, amber-orange line, about 8 in 2000, about 30 in 2010, about 115 in 2013, about 220 in 2015, about 340 in 2016 and about 600 in 2017, the steepest series and the one that ends highest. No highlighted points. Legend at right, vertical list with a short line swatch before each name: Microsoft (dotted orange), Google (steel blue), Apple (magenta), Facebook (green), Amazon (amber). Two small footer text images and one further small raster element sit at bottom. A filled shape #D98228 lies behind the chart area (x 9.3%, y 71.4%, w 65.7%, h 7.1%) and is not a visible block in the render. Axis baseline is a thin white horizontal line at about 81% from top.
Slide 19
Just try building an ad-funded content business…
Global ad revenue ($bn, real)
Thousands
300
250
200
150
100
50
-
1980
1985
1990
1995
2000
2005
2010
2015
Other internet
FB
©2017 Andreessen Horowitz. Proprietary and confidential.
Source: Zenith, Google, Facebook, a16z
Visuals: Chart: stacked area chart, no chart title beyond the subtitle 'Global ad revenue ($bn, real)'. Y-axis: linear, labelled 300, 250, 200, 150, 100, 50 and '-' (zero) with gridlines absent; unit $bn real; range 0 to about 300. X-axis: years 1980 to about 2016, labelled every five years from 1980 to 2015, with a thin white baseline at the zero line. Series stacked bottom to top: Print (#6C96B2, bottom layer), Google (#A4621D), FB (#D98228), Other internet (#E8B47E, top layer). Values are not printed; estimates: 1980 total about 110 (all Print); 2000 total about 221 with Print about 211; 2007 total about 236 with Google about 22 and Print about 190; 2009 total about 201 with Print about 140 and Google about 26; 2016 total about 265 with Print about 87, Google about 91, FB about 27, Other internet about 60. Legend at right, white labels, colour swatches for each series. No highlighted points.
Slide 20
Super-evolved organisms?
GAFA seem to have a different mix of character to many tech giants before them
Massively
greater scale
+
Everyone read
the book –
saw Yahoo &
MySpace fail
+
Founder-
controlled
(except Apple)
+
Four, not one
©2017 Andreessen Horowitz. Proprietary and confidential.
Visuals: Four solid filled circles of equal size, in a left-to-right row, joined by three plus-sign shapes. Circle 1 is steel blue #6C96B2 with the text 'Massively greater scale'. Circle 2 is magenta #BE4681 with the text 'Everyone read the book – saw Yahoo & MySpace fail'. Circle 3 is lime green #95CA53 with the text 'Founder-controlled (except Apple)'. Circle 4 is dark amber #CB8B03 with the text 'Four, not one'. Between the circles are three plus signs, each a bold cross of about 2.8% width and 5.5% height: the first is grey #8E99A3 and the second and third are light steel blue #A9C4D6. A small image of 215 by 71 pixels sits at about x 79.7%, y 52.0%, inside the orange circle; it shows no visible content distinct from the text and is probably a transparent or hidden graphic. Overlaid at bottom-left is a 305 by 26 pixel image carrying the copyright line. No photographs, charts or tables.
Slide 21
But winners always look invulnerable, until they don’t
Microsoft’s share of personal computing unit sales (PCs, Macs, Linux, smartphones & tablets)
100%
75%
50%
25%
0%
2000
2005
2010
2015
©2017 Andreessen Horowitz. Proprietary and confidential.
Source: Gartner, Apple, Google, Microsoft, Nokia, Blackberry, a16z
Visuals: Chart: line chart with no chart title inside the plot. X-axis: calendar years from 2000 to 2016 with labels at 2000, 2005, 2010 and 2015, no units printed. Y-axis: percentage share from 0% to 100%, labels at 0%, 25%, 50%, 75% and 100%. Single series, no legend, no data labels, no highlighted points. Values are not printed, so these are estimates: about 96% from 2000 to 2003, about 96.5% in 2004, about 95.5% in 2005 and 2006, about 93.5% in 2007, about 90% in 2008, about 82% in 2009, about 69% in 2010, about 47% in 2011, about 31% in 2012, about 19.5% in 2013, about 15% in 2014, about 12.5% in 2015 and about 11% in 2016. The line is a single orange stroke about 4 px thick with rounded joins, falling steeply between 2008 and 2013. Bottom horizontal axis line is thin and white. No photographs, logos or icons.
Slide 22
And some of them haven’t quite ‘won’ yet anyway
Annual net revenue ($bn, real)
500
400
300
200
100
0
Thousands
1980
1985
1990
1995
2000
2005
2010
2015
Walmart
Amazon
©2017 Andreessen Horowitz. Proprietary and confidential.
Source: Amazon, Bloomberg
Visuals: Line chart, untitled apart from the slide subtitle 'Annual net revenue ($bn, real)'. Y axis: 0 to 500, labelled every 100 (0, 100, 200, 300, 400, 500), unit $bn real, with a vertical axis label 'Thousands' printed at the far left in very faint small type. X axis: years 1980 to 2016, labelled every five years (1980, 1985, 1990, 1995, 2000, 2005, 2010, 2015), white horizontal baseline at value 0. Series 1, Walmart: steel-blue line (#6B94AB), about 1 in 1980, about 2 in 1982, about 6 in 1985, about 25 in 1990, about 65 in 1993, about 135 in 1998, about 165 in 2000, about 215 in 2001, about 285 in 2004, about 345 in 2006, about 403 in 2008, about 420 in 2010, about 468 in 2012, about 485 in 2014, ending about 485 in 2016. Series 2, Amazon: orange line (#E07F26), starts about 0 in 1995, about 2 in 2000, about 6 in 2004, about 18 in 2008, about 35 in 2010, about 70 in 2013, ending about 135 in 2016. No values are printed on the chart; all values are estimates. Legend at right: blue line swatch with 'Walmart' and orange line swatch with 'Amazon', white labels. Line weight about 0.4% of slide height, round joins. No highlighted points. Footer and source are small images of text.
Slide 23
The winners always look invulnerable, until they don’t
They lose their market, or their market becomes irrelevant
IBM
Microsoft /
Intel /
Nokia
AOL /
MySpace /
Yahoo
GAFA
?
©2017 Andreessen Horowitz. Proprietary and confidential.
Visuals: Five filled circles of equal size in a left-to-right row, each with a centred white label: IBM (blue circle), Microsoft / Intel / Nokia (magenta circle), AOL / MySpace / Yahoo (green circle), GAFA (orange circle), and a question mark (purple circle). Four solid grey (#858D98) block arrows point rightward between adjacent circles, connecting them in sequence. No chart, photograph or logo; the copyright line is a small raster image of text.
Slide 24
The winners always look invulnerable, until they don’t
They lose their market, or their market becomes irrelevant
IBM
Microsoft / Intel / Nokia
AOL / MySpace / Yahoo
GAFA
?
©2017 Andreessen Horowitz. Proprietary and confidential.
Visuals: Five solid flat circles in one row, left to right: a steel-blue circle (#6C96B2) labelled IBM with a large semi-transparent dark slate X over it; a magenta circle (#BE4681) labelled Microsoft / Intel / Nokia with a semi-transparent dark maroon X over it; a lime-green circle (#95CA53) labelled AOL / MySpace / Yahoo with a semi-transparent dark olive-green X over it; an amber circle (#CB8B03) labelled GAFA with no X; a purple circle (#904CBB) labelled ? with no X. Between each pair of circles is a flat grey right-pointing block arrow (about #838D99), about 4.5% of slide width and 5% of slide height, with no outline. The three X marks are semi-transparent (about 50% opacity) and drawn over the labels, so the label text shows through them. No photographs, logos or icons beyond these.
Slide 25
So what are the new S Curves, to / change all of this? / ©2017 Andreessen Horowitz. Proprietary and confidential.
Slide 26
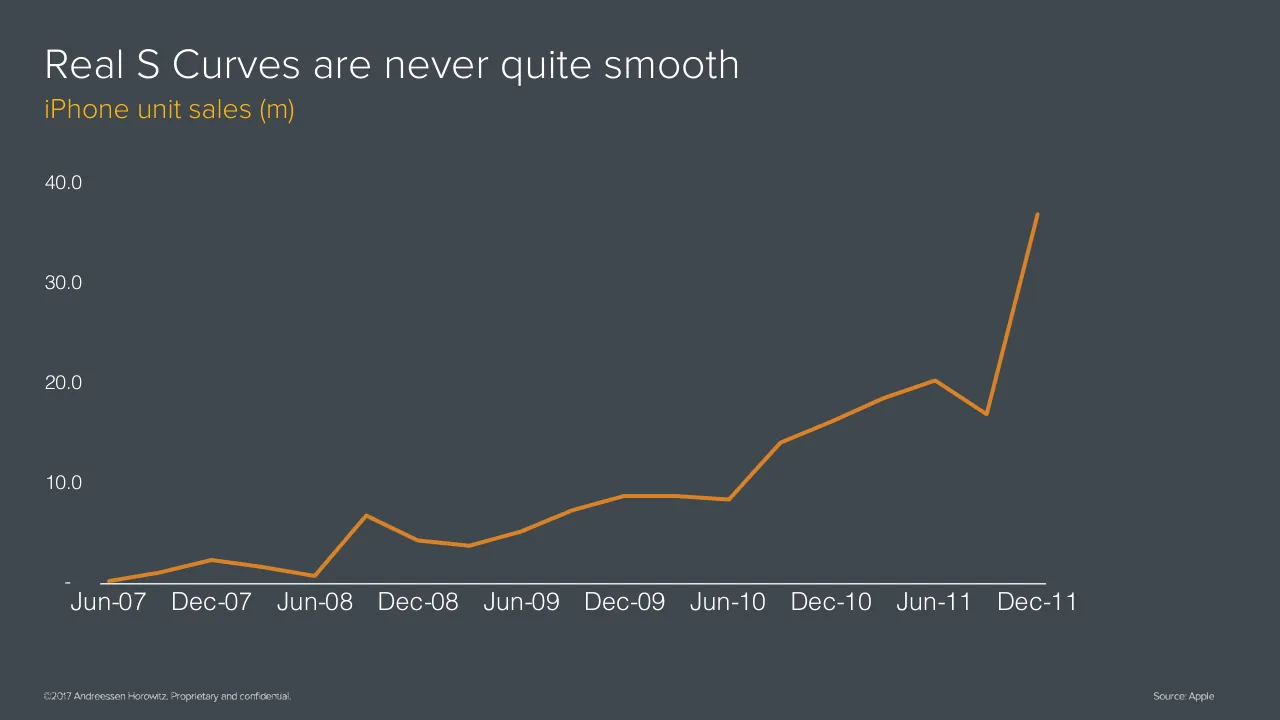
Real S Curves are never quite smooth
iPhone unit sales (m)
40.0
30.0
20.0
10.0
-
Jun-07 Dec-07 Jun-08 Dec-08 Jun-09 Dec-09 Jun-10 Dec-10 Jun-11 Dec-11
©2017 Andreessen Horowitz. Proprietary and confidential.
Source: Apple
Visuals: Line chart with no legend. Title: none inside the chart area; the slide title and subtitle act as its heading. Y-axis: 'iPhone unit sales (m)', linear, range 0 to 40 with labelled ticks at 0 ('-'), 10.0, 20.0, 30.0 and 40.0; no unit suffix beyond the (m) in the subtitle. X-axis: half-yearly time, labelled Jun-07, Dec-07, Jun-08, Dec-08, Jun-09, Dec-09, Jun-10, Dec-10, Jun-11, Dec-11, with no printed values. Single series, orange line about 0.5% of slide height thick, colour #D7801F. Values are not printed; estimates from the chart: Jun-07 about 0.3, Dec-07 about 2.2, Jun-08 about 0.6, Dec-08 about 4.1, Jun-09 about 5.2, Dec-09 about 8.8, Jun-10 about 8.5, Dec-10 about 16.1, Jun-11 about 20.3, Dec-11 about 36.9. Points at Jun-08 and Dec-11 are visible as local minimum and final maximum, with a dip at about 16.8 just before Dec-11. Highlighted points: none. Baseline: a thin white horizontal x-axis line at the zero level spanning from about x 7.8% to 81.7%.
Slide 27
The iPod took almost 5 years to work
iPod unit sales (m)
15.0
12.5
10.0
7.5
5.0
2.5
0.0
Dec-01
Jun-02
Dec-02
Jun-03
Dec-03
Jun-04
Dec-04
Jun-05
Dec-05
©2017 Andreessen Horowitz. Proprietary and confidential.
Source: Apple
Visuals: Line chart. Title: none inside the chart; the subtitle above it reads 'iPod unit sales (m)'. Y-axis: linear, labelled in units of millions of units, range 0.0 to 15.0, gridlines none, tick labels 0.0, 2.5, 5.0, 7.5, 10.0, 12.5, 15.0. X-axis: time, labelled every six months from Dec-01 to Dec-05 (tick labels Dec-01, Jun-02, Dec-02, Jun-03, Dec-03, Jun-04, Dec-04, Jun-05, Dec-05), with intermediate data points between labels. Single series, drawn as an orange line of about 4 px stroke with round joins, no markers. Values are not printed; approximate values read from the plot are: Dec-01 about 0.05, Jun-02 about 0.02, Dec-02 about 0.15, Jun-03 about 0.2, Dec-03 about 0.7, Jun-04 about 0.8, Dec-04 about 4.5, Jun-05 about 6.1, Dec-05 about 14.0. The last point, at Dec-05, is the highlighted peak, and the line rises steeply from about 6.5 to about 14.0 between the last two points. No legend. The horizontal baseline is a thin white axis line at 0.0. Small raster image of the copyright text, 305 by 26 pixels, white, sits bottom-left. Two small raster images sit bottom-right: one 112 by 52 pixels and one 90 by 52 pixels, both part of the 'Source: Apple' line rendering, with no distinct visible content.
Slide 28
Three phases of creation
Get the tech to
work at all
Find product-market fit
Pour on rocket fuel
©2017 Andreessen Horowitz. Proprietary and confidential.
Visuals: One line chart drawn without axes, title, legend, or printed values. It is a single orange polyline with rounded joins, about 4 px thick on a 2000 px-wide slide. It starts at about x 34.3%, y 82% (about 930 px of 1125 px height) and runs nearly flat with slight dips through about x 45% to 58%, then rises gently to about x 69% at y 80%, then steepens sharply. It climbs through about x 73% (y 67%), x 76% (y 60%), and x 80% (y 55%), then kinks upward to about x 86% (y 60%) and ends in a near-vertical stroke at about x 89.5%, y 32%. All values are estimates; none are printed. Three chevron panels form the other visual, described in the elements list. The footer is a white wordmark-style text image (305 by 26 px) reading the copyright line.
Slide 29
Four emerging S Curves to consider / Get the tech to / work at all / Find product-market fit / Pour on rocket fuel / Auton- / omy / Mixed / reality / Crypto- / currency / AI / ©2017 Andreessen Horowitz. Proprietary and confidential.
Visuals: Diagram: three large dark chevron (arrow-shaped) panels, each #30363B, pointing right, separated by thin #40484F chevron gaps. Panel 1 is a left-flat rectangle with a notched right edge; panels 2 and 3 are chevrons with notched left edges. Inside, four circles with orange rings (about #D9822B, stroke about 0.5% of slide height) and fill #40484F, labelled in order: 'Auton-omy' (circle 1, centred near x 16%), 'Mixed reality' (circle 2, centred near x 33%, straddling the gap between panels 1 and 2), 'Crypto-currency' (circle 3, centred near x 50%), 'AI' (circle 4, centred near x 76%). Each circle has a dotted orange arrow (about #D9822B) running right from its edge to the next stage, with a solid arrowhead; the last arrow ends near x 86%. Circles are about 20% of slide width in diameter... Measured: circles about 10% of slide width each. No photographs, logos other than the footer wordmark image, or charts.
Slide 30
AI
©2017 Andreessen Horowitz. Proprietary and confidential.
Visuals: none (the footer line is a placed image of text, listed under elements)
Slide 31
We’ve all heard of ‘AI’ by now / The Economist / Inside China's Ministry of Truth / Trump in trouble / Who are the Niger Delta Avengers? / The flaws in executive pay / Motorcycles that fly / JUNE 25TH–JULY 1ST 2016 / March of the machines / A SPECIAL REPORT ON ARTIFICIAL INTELLIGENCE / Bloomberg Businessweek / April 4–April 10, 2016 | bloomberg.com / Spawn of Clippy / Microsoft is building an army of artificial intelligence bots. / Can they be controlled? / $6.00 / ©2017 Andreessen Horowitz. Proprietary and confidential.
Visuals: Two magazine cover photographs, shown as flat rectangular images with no border or shadow. Left: The Economist cover (400 by 526 pixels) with a sepia-gold Art Deco illustration of a metallic robot head with a helmet-like headpiece, bust and shoulders, framed by vertical golden pillars and diagonal light beams; a red rectangular masthead reading 'The Economist' in white serif type at upper left; a column of white sans-serif cover lines at upper right; a large white bold headline 'March of the machines' across the middle; a small white caps line 'A SPECIAL REPORT ON ARTIFICIAL INTELLIGENCE' below it; dominant colours ochre, gold and dark brown. Right: Bloomberg Businessweek cover (398 by 525 pixels) on a black background showing a three-dimensional cartoon robot built from pastel blue, teal, pink and orange parts, with a glass cylinder containing a pink brain on its head, a large paper-clip body with a googly eye, and legs standing on a cyan perspective grid floor; green bold masthead 'Bloomberg Businessweek' at upper left (the 'Business' line partly covered by the robot's head), pink headline 'Spawn of Clippy' at left and small yellow-green text block below it; dominant colours black, cyan, pastel blue and pink. Both covers are full-colour, uncropped and unlit by any overlay. Behind each cover, a dark charcoal rectangle (#30363B) peeks out at the cover's left and right edges, about 2 percent of slide width wide beyond the image edges, at the vertical middle of the covers.
Slide 32
Unhelpful ways to
talk about AI
Data is the new oil!
Google has all the data!
China will have all the AI!
AI will kill us!
AI will take all the jobs!
Calling it ‘AI’
©2017 Andreessen Horowitz. Proprietary and confidential.
Visuals: One photograph in the right 65% of the slide, full-bleed to the top, bottom and right edges, butted against the grey panel on its left edge. Subject: a tall black rectangular monolith standing upright on a rocky, sandy desert floor, with three dark furry apes around it: one crouched on a rock ledge at the upper right, one small and seated in the middle distance left of the monolith, and one standing upright in the foreground lower centre. A dark rock outcrop frames the left edge and a large dark shape frames the top right corner. Action: the apes are gathered near the monolith at dusk. Composition: monolith is near-vertical and centred slightly left of middle, filling most of the image height; horizon sits about two-thirds up. Lighting: low warm sun behind the scene, backlit sky with glowing white and yellow centre fading to orange and red-brown clouds. Dominant colours: sky orange #E8A060 and cream #F5E6C8, rock tan #8A7560, monolith black #1E1E22, apes near-black #15120F. Cropped to fill the box, not boxed, no overlay or tint. No logos or icons on the slide.
Slide 33
More useful? / Machine learning / Automation / Enabling layers / ©2017 Andreessen Horowitz. Proprietary and confidential.
Slide 34
Machine learning as the new relational database
New companies created, but also a new technology that became part of everything
Oracle
SAP
PeopleSoft,
CRM, Expedia,
Starbucks,
Wal-Mart…
©2017 Andreessen Horowitz. Proprietary and confidential.
Visuals: Diagram: three filled circles of equal size (about 25% of slide width each) connected left to right by two grey block arrows (pentagon-shaped block arrows, fill #85929C, about 5% wide by 12.8% tall) pointing from the first circle to the second and from the second to the third. Left circle: light steel blue #6C96B2 containing the label 'Oracle'. Middle circle: magenta-pink #BE4681 containing the label 'SAP'. Right circle: amber-gold #CB8B03 containing the stacked label 'PeopleSoft, / CRM, Expedia, / Starbucks, / Wal-Mart…'. Arrows are not labelled and do not touch the circles; they sit in the gaps between them, vertically centred on the circles. A small Andreessen Horowitz logo image (305 by 26 pixels, about 20% wide) is at the bottom left as part of the footer, rendered in light grey-white. No charts, photographs or tables.
Slide 35
Machine learning =
patterns
Techniques to allow
statistical analysis of
data to find patterns
that computers could
not see before.
Babies
Back to School
Bakery
Beverages
Breakfast
Bulk
Canned Goods
Dairy & Eggs
Deli
Dry Goods & Pasta
Floral
Fromagerie
Frozen
Healthy Eating
Holidays
Household
International
Meat & Seafood
Olives, Gourmet Cheese, Salads
Pantry
Personal Care
Pets
Popular
Produce
Snacks
©2017 Andreessen Horowitz. Proprietary and confidential.
Source: Instacart
Visuals: One scatter plot (t-SNE style cluster map) of grocery products from Instacart, with no printed title, no axis labels, no axis values and no axis units. Plot area is a light grey #EBEBEB square with white gridlines, spanning about x 38 to 82.7 and y 10.7 to 89.2. About 25 coloured point clusters of varying density; points are small filled circles of roughly 1 to 1.5% of slide width. Visible clusters: pink (Produce/Popular/Snacks hues) cluster at top centre-right, large pink cluster at top-left-centre, blue cluster at upper-left (Meat & Seafood/International hues), olive-green cluster at upper-centre, green cluster at upper-right, orange/brown cluster in centre-left, teal cluster (Healthy Eating hue) in lower-centre, lavender/purple cluster (Pantry and Personal Care hues) at right, dense green cluster at right edge, pink clusters at bottom-left and bottom-centre, and scattered points throughout. No highlighted points. Legend at right of plot: 27 entries, each a small coloured dot in a light grey square swatch followed by a label in dark grey sans-serif, listed top to bottom as Babies (pink-red), Back to School (orange-red), Bakery (orange), Beverages (dark orange), Breakfast (gold), Bulk (olive), Canned Goods (olive green), Dairy & Eggs (green), Deli (green), Dry Goods & Pasta (green), Floral (green), Fromagerie (teal-green), Frozen (teal-green), Healthy Eating (teal), Holidays (cyan), Household (sky blue), International (blue), Meat & Seafood (blue), Olives, Gourmet Cheese, Salads (blue), Pantry (lavender), Personal Care (violet), Pets (violet), Popular (magenta), Produce (pink), Snacks (pink). Legend spans about x 83.9 to 98 and y 15 to 87. Source line 'Source: Instacart' in light grey at bottom-right. Copyright line is in the footer on the dark panel.
Slide 36
Cat pictures?
©2017 Andreessen Horowitz. Proprietary and confidential.
Source: Wikipedia
Visuals: One photograph, full-bleed on the right 65% of the slide and cropped by the slide edges on the right, top and bottom. Subject: two young kittens sitting on a beige woven or knitted cat tree or basket in the lower foreground. On the left is a calico kitten with orange, black and white fur, a white chest and white front paws, with blue-green eyes, looking upward and slightly off to the left. On the right is a fluffy black kitten with grey-green eyes, looking towards the viewer. Composition: the two kittens fill the lower two-thirds of the frame, with their heads near the upper third and the basket edge running across the bottom. Background: a soft, out-of-focus pale grey wall, giving a shallow depth of field. Lighting: soft, diffuse natural daylight from the front-left. Dominant colours: warm tan/beige of the basket, pale grey wall, orange and black of the calico kitten, and black of the second kitten. No overlay or tint is applied. Not boxed; the image runs to the slide edge.
Slide 37
What patterns can you look for?
“Is there a cat in this picture?”
“Which customers are about to churn?”
“Will that car let me merge?”
And, the unknown unknowns
©2017 Andreessen Horowitz. Proprietary and confidential.
Slide 38
Automation means / washing machines, / not robots
We imagine automation / will look like us - / humanoid robots, ‘artificial / intelligence’.
We did make robots, but / we call them washing / machines.
©2017 Andreessen Horowitz. Proprietary and confidential.
Source: Wikipedia, Siemens
Visuals: Two photographs, no chart or diagram. Left: a black vintage toy-style humanoid robot standing front-facing, full figure, with a clear dome head containing red and blue lights, two circular antenna-like rings on the head sides, a blue-lit grille on the chest, and a tall segmented black body with bulbous legs and feet; isolated on white with a soft grey ground shadow beneath the feet. Right: a white front-loading Siemens washing machine shown in three-quarter view from the front-left, with a silver-rimmed circular door, a control panel with knobs and a digital display at the top, and the word SIEMENS printed above the control panel; isolated on white. Both images are cut out (no crop shape), unboxed, lit evenly by studio light, with dominant colours black, silver and white.
Slide 39
There’s no such
thing as ‘data’
A dishwasher can’t wash
clothes - a voice
recogniser can’t find
network intrusion.
Data is specific to each
vertical and problem.
Many new companies to
be created here.
©2017 Andreessen Horowitz. Proprietary and confidential.
Source: Siemens
Visuals: Two product photographs of Siemens home appliances, shown as white cut-out products with no background. Left: a freestanding white dishwasher with its door dropped open toward the viewer, showing plates, bowls and cutlery in the upper and lower racks, a black control panel with a small digital display on the door top edge, and a light grey worktop-style top. Right: a white front-loading washing machine with a brushed silver chrome door ring and round drum window showing laundry inside, a Siemens wordmark above the control panel, a round silver dial and a small digital display at upper right. Both products are viewed from a three-quarter front angle, uncropped, shown at equal size, with a soft grey floor shadow beneath each. Lighting is even studio light. Dominant colours are white, light grey and chrome silver. Neither photo has an overlay or tint, and neither is boxed or full-bleed.
Slide 40
So, what are the washing machines of machine learning?
What can a real company automate?
Current analysis
Better results for
questions and data
you have now
+
New analysis
New kinds of
questions for data
you have now
+
New data
Data types that
computers couldn’t
read before – voice,
images, video
©2017 Andreessen Horowitz. Proprietary and confidential.
Visuals: Three outlined circles arranged left to right with two grey plus-sign symbols between them. Circle 1 (left): orange outline #D9822B, stroke about 0.3% of slide height, containing bold heading 'Current analysis' and body 'Better results for / questions and data / you have now'. Circle 2 (centre): steel-blue outline #6A94B0, same stroke, containing bold heading 'New analysis' and body 'New kinds of / questions for data / you have now'. Circle 3 (right): mid-grey outline #8A8D90, same stroke, containing bold heading 'New data' and body 'Data types that / computers couldn’t / read before – voice, / images, video'. Between circle 1 and 2 is a plus sign about 4.5% wide, filled #7F8A95, centred vertically on the circles at about x 30.5%, y 50%. Between circles 2 and 3 is a plus sign about 5.5% wide, filled #7F8A95, centred at about x 66.5%, y 50%, slightly lower than the first plus. Circles are flat with no fill, no shadow. No photographs or logos apart from the copyright text.
Slide 41
Mobile / Ride-sharing, Instagram, Instacart / ©2017 Andreessen Horowitz. Proprietary and confidential.
Visuals: Diagram: a solid orange curved line starts at the lower left (about x 21.8%, y 84.8%) and rises rightward, passing behind a hollow orange circle centred around x 49%, y 63% with diameter about 10% of slide width; the line continues out of the top-right of the circle and ends in a solid orange arrowhead pointing right at about x 77.5%, y 40.6%. Near the arrow's end, three dotted orange curved arrows branch upward from the main line, each ending in a small solid upward-pointing arrowhead at about x 70.5%, y 31.7%; x 73.8%, y 31.2%; and x 76.8%, y 30.5%. The circle has a stroke of about 0.4% of slide height in orange #D98228 with a dark fill matching the background, and the text 'Mobile' is centred inside it in bold white. The three dotted arrows and the label are the only other marks; no photographs, logos or icons appear.
Slide 42
Best use cases may not be clear at the start of the S Curve
Email, stocks, weather?
Mobile
Ride-sharing, Instagram, Instacart
©2017 Andreessen Horowitz. Proprietary and confidential.
Visuals: Diagram: one orange S-curve (solid line, about 0.5% of slide height thick, with a solid arrowhead at its upper-right end) starts at about x 21.8%, y 85.5% and runs up and right to an arrowhead at about x 77.8%, y 40.4%. A circle (about 10.0% wide by 17.8% tall, centred near x 49.3%, y 63.4%) sits on the curve at its midpoint, with an orange outline of about 0.4% of slide height, filled with the background colour and containing the bold white word Mobile. Two groups of three thin orange dotted arrows with small solid arrowheads point upward off the curve: the lower-left group sits at about x 22% to 32%, y 83% to 94%, and the upper-right group at about x 68% to 78%, y 30% to 43%. The lower-left group is captioned Email, stocks, weather? and the upper-right group is captioned Ride-sharing, Instagram, Instacart. No photographs, logos or charts.
Slide 43
The same probably applies to machine learning / Machine / learning / Cat pictures! / ©2017 Andreessen Horowitz. Proprietary and confidential.
Visuals: Diagram: a solid orange curved line starts at bottom-left (about x 21.8%, y 94.5%) and rises gently, then steepens toward a circle labelled 'Machine learning' at about centre x 49%, y 64%, diameter about 10% of slide width. The line passes behind the circle and continues from its upper-right edge in a larger upward-curving arc that ends in a filled arrowhead pointing right at about x 77.5%, y 40.5%. Three smaller dotted orange arrows with arrowheads point upward from the start of the solid curve at bottom-left, spaced across about x 22% to 31%, labelled collectively by the text 'Cat pictures!' above them at about x 24%, y 68.7%. Stroke colour #D98228 orange, solid stroke about 0.5% of slide height; dotted arrows of similar weight with round dots. No photographs, logos or icons.
Slide 44
The same probably applies to machine learning / Machine / learning / Cat pictures! / ©2017 Andreessen Horowitz. Proprietary and confidential.
Visuals: One diagram: a solid orange (#D98228) curved line about 0.6% of slide height thick starts at bottom-left (about x 21.9%, y 84.7%), rises gently and then steepens, passes behind a circle at the centre, and continues up and to the right to a filled orange triangular arrowhead at about x 77.8%, y 40.4%. The circle is an outlined ring with a #40484F fill and an orange outline about 0.5% of slide height thick, centred at about x 49.4%, y 63.3%, diameter about 10% of slide width; it reads 'Machine / learning' in bold white. Three dotted orange curved arrows fan out upward from the start of the solid line at bottom-left, each ending in a small filled orange arrowhead, with the label 'Cat pictures!' in white light type centred above them. Three matching dotted orange curved arrows fan out upward from the solid line near the arrowhead at top-right, each ending in a small filled arrowhead. The line passes behind the circle, which is opaque. No photographs, logos or icons.
Slide 45
So, what can we automate next? / ©2017 Andreessen Horowitz. Proprietary and confidential.
Slide 46
Mechanised legs
Ilya Repin, ‘Barge-haulers on the Volga’, 1873
©2017 Andreessen Horowitz. Proprietary and confidential.
Visuals: Photograph-like reproduction of Ilya Repin's oil painting 'Barge-haulers on the Volga' (1873), full-bleed, 1500 by 659 px, cropped at the left and right edges. Subject: about ten barefoot or booted men in ragged clothing lean forward in a line, each harnessed by a broad dark strap to a towing rope running left to right. A bearded man with a pipe stands among them and a young boy in a pink shirt stands in the centre looking to the right. On the right, a two-masted sailing barge with rigging and a small red-clad crew sits on calm water with a flag at its masthead. A small sailboat is far left. In the foreground, a sandbank with a wicker basket, a folded sack and a fallen stick. Lighting is soft, warm, low-angle daylight. Dominant colours are ochre sand about #C8A46E, pale blue-grey sky about #B9CCD8, dark olive and brown clothing about #3D4632, and warm pink about #D9907F. Composition is horizontal with the figures in the left-centre band and the barge at right. A faint date and signature appear bottom right. A small image of the copyright text sits over the sand, bottom left, rendered in white at reduced opacity.
Slide 47
Mechanised arms
Ford production line, 1920s
©2017 Andreessen Horowitz. Proprietary and confidential.
Visuals: One photograph, full-bleed across the lower part of the slide and running off the left, right and bottom edges. Subject: interior of the Ford production line in the 1920s. A long aisle recedes from the foreground toward the vanishing point at the upper left-centre. Along the right, workers in work clothes and flat caps stand at assembly stations with car chassis and engine components, one worker in the foreground leaning over a chassis. Steering wheels hang from overhead rails and tall racks of parts bins line the right side, with crates of components and stacked frame parts. Left side shows a white wall with pipes and hanging equipment, and stacked tyres near the wall. Composition is a deep one-point perspective shot from an elevated viewpoint, with the subject occupying most of the frame. Lighting is diffuse overhead industrial light, producing soft grey tones and no strong shadows. Dominant colours are greyscale: black, charcoal and light grey, with no colour. The image is cropped at the bottom and sides, boxed to the lower area, with no overlay or tint. A small white copyright line overlays the lower-left of the photograph.
Slide 48
Mechanised arithmetic
Billy Wilder, ‘The Apartment’, 1960
©2017 Andreessen Horowitz. Proprietary and confidential.
Visuals: One full-bleed black-and-white photograph of a large 1960s open-plan office, seen in one-point perspective from a raised viewpoint looking down the length of the room. Rows of metal desks run towards a vanishing point at the centre, with men and women seated at desks, typing on manual and electric typewriters and operating calculating machines, while others stand and walk between the rows. The ceiling is a grid of rectangular fluorescent light panels in diagonal coffers, and concrete columns line the aisles. Lighting is flat, bright and overhead, with the foreground brighter at the bottom. Dominant colours are greys, black and white. The photograph is cropped at the slide edges and is full-bleed beneath the header band. A small white copyright line overlays the lower-left corner of the photograph.
Slide 49
What can you do with automated interns?
Automation replaces humans, but it also gives us the equivalent of millions more
Computer
10 year old
15 year old
?
©2017 Andreessen Horowitz. Proprietary and confidential.
Visuals: Four solid filled circles of equal size (each about 18.1% wide by 32.2% high of the slide) with their labels centred inside: an orange circle reading Computer, a steel-blue circle reading 10 year old, a green circle reading 15 year old, and a purple circle reading ?. Three grey right-pointing block arrows sit between adjacent circles, each pointing from the circle on its left to the next circle, showing a left-to-right sequence. Arrow fill is about #848E9A with no outline. The bottom-left element is a small placed image (305 by 26 pixels) carrying the copyright text in light grey-white. No photographs, charts or icons.
Slide 50
What if computers can see, the way they / can read or count? / ©2017 Andreessen Horowitz. Proprietary and confidential.
Visuals: none. The footer is a placed 305 by 26 pixel image of the copyright line in white, not a graphic.
Slides 51 to 76 continue in the full text file.
Download this deck
The hosted PDF of every library deck is free for readers of the SlideDeck Co newsletter. Join with your email and the viewer and download appear here.
Building a deck of your own? The SlideDeck Co Standard Deck is a slide library for business presentations: reviews, updates and plans.







