
This 78-slide talk by Benedict Evans, a partner-level analyst, presents his view of the mobile industry, with Andreessen Horowitz branding carried through its charts. It opens on a red title slide, then a bold orange statement, 'Mobile is eating the world.' The next section, 'Mobile deployment,' frames a shift from the creation phase of smartphones to a deployment phase focused on what can be built. The middle sections, 'A new kind of scale' and 'New kinds of computer,' compare the revenue and capex of Google, Apple, Facebook and Amazon with the old Wintel giants, and cover apps, imaging and frictionless computing. Later sections, 'Ecommerce' and 'Cars,' apply the same logic to retail and to electric and autonomous vehicles. The deck closes with a 'Thank you' slide. Each slide carries one idea, short headline-style titles, large simple charts and sourced footers. Section divider slides in a single accent colour pace the argument. Notable slides include the S-curve comparison, the Wintel versus GAFA revenue chart and the machine learning data-versus-rules slide.
Slides worth studying
Questions about this deck
How many slides does the Benedict Evans mobile industry deck have?
The deck has 78 slides. Slide 1 is the title slide, 'Mobile is eating the world', dated December 2016.
What does the Benedict Evans deck say about Wintel versus GAFA revenue?
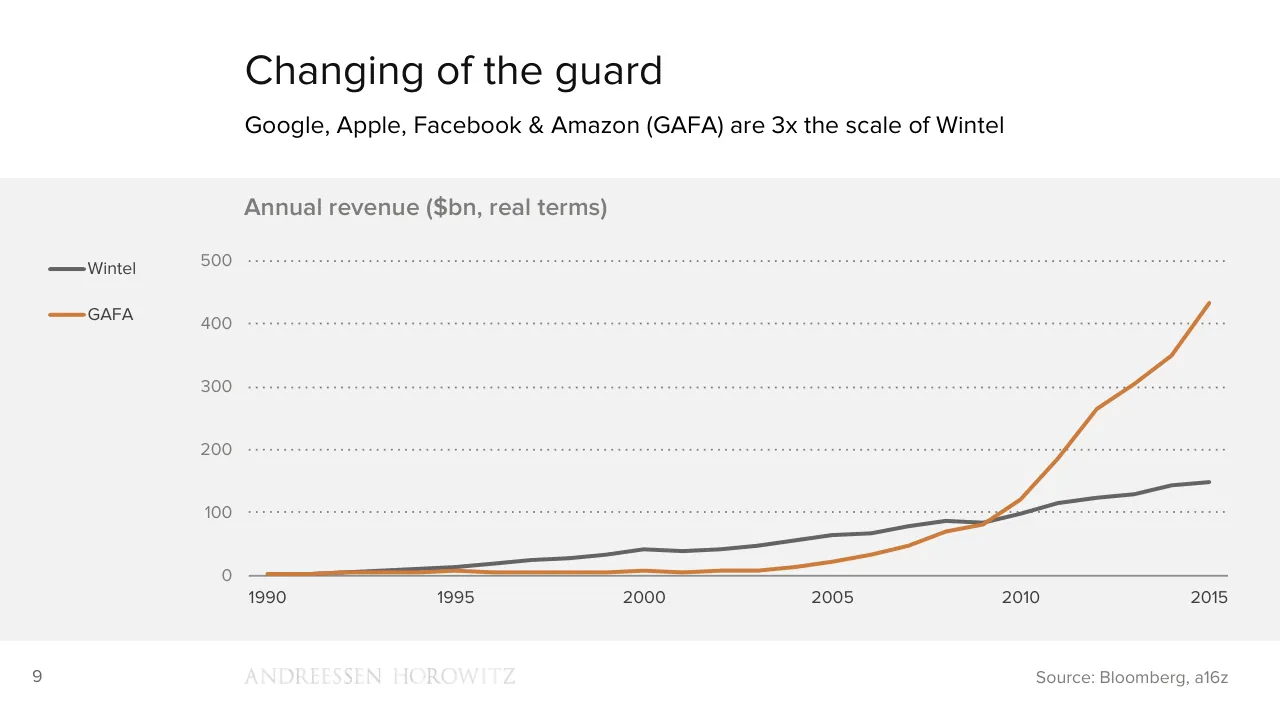
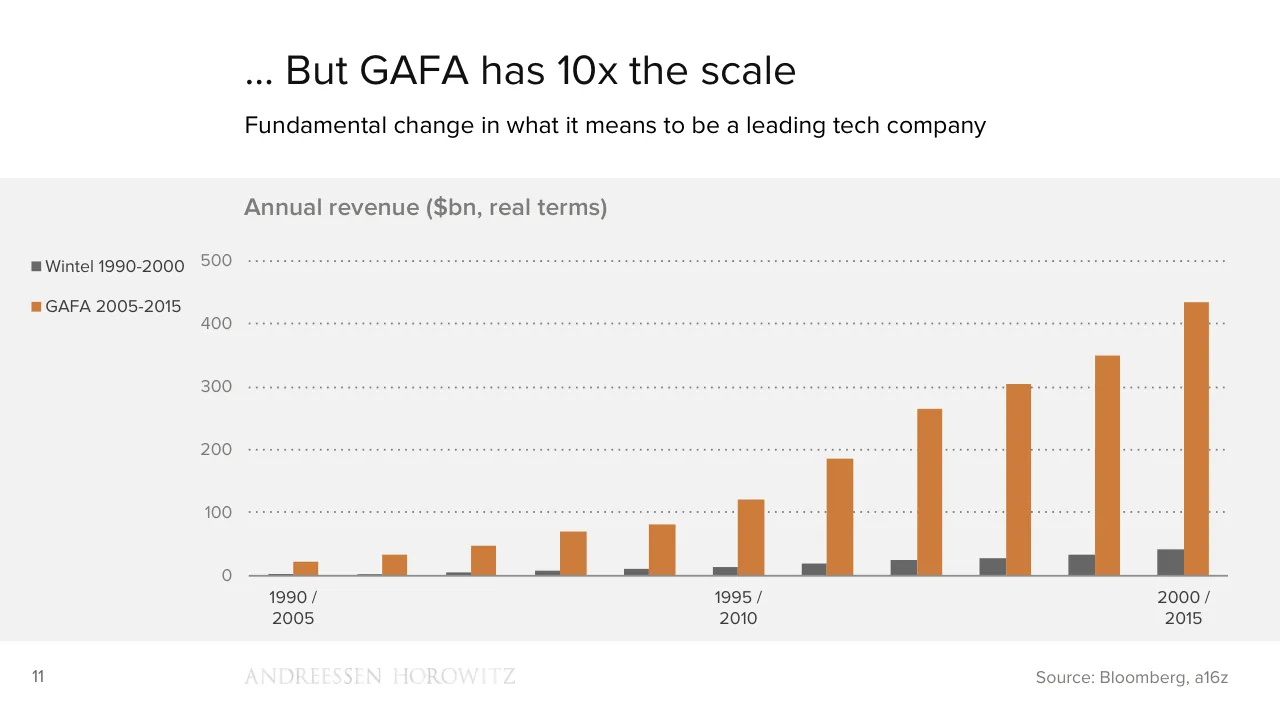
Slide 10 states that Google, Apple, Facebook & Amazon (GAFA) are 3x the scale of Wintel in its annual revenue ($bn, real terms) chart. Slide 12 adds that GAFA has 10x the scale.
What does the Benedict Evans deck say about ecommerce and retail?
Slide 52 says ecommerce is much better at logistics than demand generation. Slide 53 says Amazon is the fourth largest apparel retailer in the USA.
What error rates does the Benedict Evans deck give for machine learning in image and speech recognition?
Slide 24 shows image recognition falling from a 28% error rate to 7%. It shows speech recognition falling from a 26% error rate to 4%.
Details
- Company: Benedict Evans
- Year: 2016
- Type: Conference talk
- Industry: Venture Capital
- Pages: 78
More from Benedict Evans
- Benedict Evans conference talk, 2026
- Benedict Evans conference talk, Autumn 2025
- Benedict Evans conference talk, Spring 2025
- Benedict Evans conference talk, 2023
- Benedict Evans conference talk, 2023
- Benedict Evans strategy presentation, 2022
All Benedict Evans decks in the library
Review score: 8 out of 10, Strong
Presentation quality, judged with the SlideDeck Co review heuristic. Ask, evidence and idea merit are not rated here.
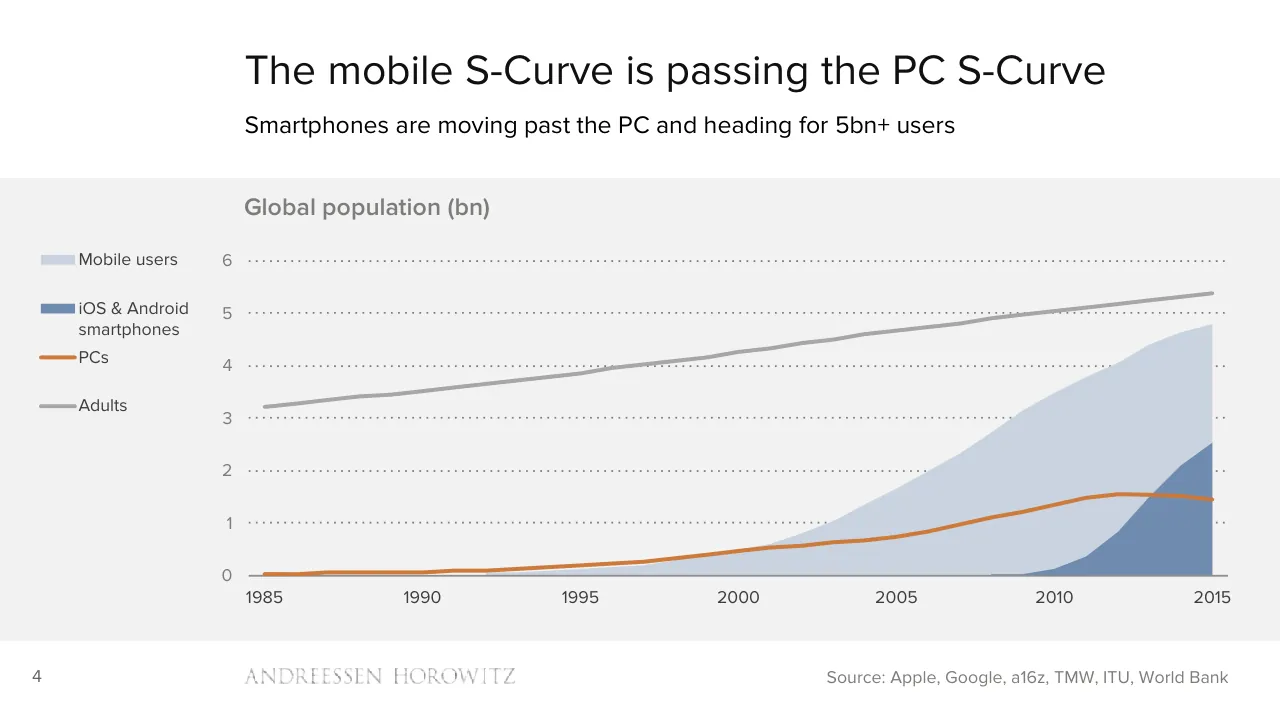
The deck is a clear, well-paced argument: orange dividers (3, 9, 22, 36, 49, 64) mark the sections, and nearly every slide carries one point under a plain headline with a one-line subtitle. Charts are large and uncluttered, with orange used to isolate the subject against grey, as on slide 10 (GAFA against Wintel) and slide 5 (the mobile S-curve passing PCs). The Wintel 1990-2000 versus GAFA 2005-2015 comparison builds in three steps over slides 10 to 12, which is strong teaching sequence. Weaknesses are consistent but not fatal: tiny footers and axis text, a faint logo, sparse quote slides, and a dual-year axis on slide 12 that is awkward to read.
Worth keeping: Keep the one-idea-per-slide discipline, the grey-and-orange chart palette, the orange section dividers, and the stepped Wintel versus GAFA build on slides 10 to 12.
Most useful repair: Fix the slide 12 axis labels, which read '1990 / 2005' and only three of the eleven bars are labelled, and add a single labelled takeaway on the denser stacked charts such as slides 14 and 15.
What would change the score: I would enlarge the small body text on the image-and-text slides (17, 23, 28, 31, 42), replace the very faint footer logo, and add emphasis or visuals to the plain quote slides (8, 16, 26, 59) so the run of text-only pages has more rhythm.
Confidence high. 72 of 78 pages inspected on contact sheets, 4 at readable size. Reviewed 2026-11-08. Model-assisted review (claude-sonnet-5-5).
Full text of the slides (78 slides)
Every slide's words and a description of its charts and images, so the deck can be searched and rebuilt. Also available as Markdown.
Slide 1
Mobile is eating the world / Benedict Evans / December 2016 / www.ben-evans.com
Slide 2
ANDREESSEN HOROWITZ
MOBILE IS
EATING THE
WORLD
Benedict Evans
December 2016
@BenedictEvans
Slide 3
Mobile deployment
ANDREESSEN HOROWITZ
Visuals: Apart from the wordmark, there are no visual elements. The only non-text element is the small white Andreessen Horowitz logo wordmark (a placed image, 364 by 22 pixels) at bottom left.
Slide 4
We’re halfway to connecting everyone
5.5bn people over 14 years old, close to 5bn with mobile phones, ~2.5bn smartphones
Global population and mobile penetration*, December 2016
100%
90%
80%
70%
60%
50%
40%
30%
20%
10%
0%
Not mobile
Mobile
Smart
Developed markets
China
Latam
MENA
South Asia
Sub-Saharan Africa
Other
SE Asia
3
ANDREESSEN HOROWITZ
* SIM penetration is >100%. Source: World Bank, TMW, CNNIC, a16z
Visuals: Chart: 100% stacked column chart with variable-width columns (Marimekko style), titled 'Global population and mobile penetration*, December 2016'. Y-axis runs 0% to 100% in 10% steps with light gridlines at 100%; no unit label beyond the percent signs. X-axis categories from left to right: Developed markets, China, Latam, MENA, South Asia, Sub-Saharan Africa, SE Asia, Other. Column widths are not labelled, so they encode no printed value. Series stacked bottom to top: Smart (dark grey #666666), Mobile (orange #CE7C3B), Not mobile (pale blue-grey #C9D3E1). No values are printed on the bars; estimates from the image: Developed markets Smart about 70%, Mobile top about 82%, Not mobile about 18%. China Smart about 56%, Mobile top about 80%, Not mobile about 20%. Latam Smart about 43%, Mobile top about 67%, Not mobile about 33%. MENA Smart about 40%, Mobile top about 63%, Not mobile about 37%. South Asia Smart about 11%, Mobile top about 52%, Not mobile about 48%. Sub-Saharan Africa Smart about 16%, Mobile top about 45%, Not mobile about 55%. SE Asia Smart about 23%, Mobile top about 68%, Not mobile about 32%. Other Smart about 21%, Mobile top about 60%, Not mobile about 40%. Legend at upper left of chart with square swatches, order top to bottom: Not mobile (#C9D3E1), Mobile (#CE7C3B), Smart (#666666). No highlighted points. Logo: 'ANDREESSEN HOROWITZ' wordmark in wide-tracked serif capitals in dark grey, at bottom left of the footer.
Slide 5
The mobile S-Curve is passing the PC S-Curve
Smartphones are moving past the PC and heading for 5bn+ users
Global population (bn)
Mobile users
iOS & Android
smartphones
PCs
Adults
6
5
4
3
2
1
0
1985
1990
1995
2000
2005
2010
2015
4
ANDREESSEN HOROWITZ
Source: Apple, Google, a16z, TMW, ITU, World Bank
Visuals: One chart: a stacked-area and line chart titled 'Global population (bn)'. Y-axis: 0 to 6 bn, with labels 0, 1, 2, 3, 4, 5, 6 and dotted horizontal gridlines at each integer. X-axis: years 1985 to 2015, labelled at 1985, 1990, 1995, 2000, 2005, 2010, 2015. No values are printed on the chart, so all values below are estimates. Series: Adults, a grey line (#A6A6A6, about 3 px) rising from about 3.2 bn in 1985 to about 5.35 bn in 2015, passing about 4.0 in 1997 and about 4.5 in 2005. PCs, an orange line (#D07A35, about 3 px) rising from about 0.03 bn in 1985 to about 0.5 bn in 2000 and about 1.55 bn near 2012, then falling slightly to about 1.45 bn in 2015. Mobile users, a light blue-grey filled area (#C9D3E1) rising from about 0 in 1995 to about 0.5 bn in 2000, about 1.0 bn in 2003, about 3.1 bn in 2009, and about 4.8 bn in 2015. iOS & Android smartphones, a mid blue filled area (#708CB0) starting about 2008, rising to about 0.1 bn in 2010, about 0.8 bn in 2012, about 2.05 bn in 2014, and about 2.5 bn in 2015, drawn in front of the Mobile users area. Legend, at the left of the plot: a light blue-grey swatch with 'Mobile users', a mid blue swatch with 'iOS & Android smartphones', an orange line with 'PCs', and a grey line with 'Adults'. No highlighted points. Logo: the Andreessen Horowitz wordmark in grey serif capitals.
Slide 6
Mobile S-Curve moving from creation to deployment
As we pass 2.5bn smartphones in use, the issues that matter are changing
Creation
Deployment
Maturity
Scaling
AR?
Mobile
PCs
Frenzy
Crazy idea
5
ANDREESSEN HOROWITZ
Visuals: Diagram: an S-curve drawn as a solid orange line (#CE7C3B, about 0.5% of slide height stroke) starts near the bottom at about x 21.8, y 84.6 with a flat start, bends upward through the Creation panel and ends at a right-pointing orange arrowhead at about x 77.7, y 40.6 in the Deployment/Maturity area. The curve passes through an orange-outlined circle labelled Mobile at centre about x 49.3, y 63.5 (diameter about 10% of width). Labels on the curve: Crazy idea at bottom-left of the curve start, Frenzy above the lower curve, Scaling above the upper curve, Maturity above the arrowhead. Two dotted grey circles (#646464 dotted outline, about 1% stroke): PCs circle centred about x 12.6, y 70.5 and AR? circle centred about x 84.6, y 52.7, each about 10% wide. A dotted grey line (#646464) enters from the lower-left edge and curves up into the PCs circle at about x 0 to 7.8, y 72.9 to 89. A dotted grey arrow leaves the PCs circle at its right side (x 17.5, y 65.8) and points right into the Creation panel, ending with a small filled grey arrowhead at about x 28.6, y 65.5. A dotted grey line runs from the left of the AR circle (about x 70.7, y 53.2) into the circle. A dotted grey line leaves the AR circle upper right (about x 89.4, y 53) and rises to the top-right edge at about x 100, y 26. No photographs, logos other than the wordmark, or icons.
Slide 7
What does mobile deployment mean?
As we pass 2.5bn smartphones in use, the issues that matter are changing
Creation
Deployment
Platform wars
The big winners are clear
The latest handset!
Steady, incremental improvement
Technology arguments
Commodity technology (mostly)
Millions of users
Billions of users
“Will this work? Who will win?”
“What can we build with this?”
6
ANDREESSEN HOROWITZ
Visuals: Two-column text panel with one divider graphic. The divider is a single white chevron (pointing right, apex at the centre of the slide) with a thin light grey #BFBFBF shadow edge along its right side, cutting through the grey band from top to bottom of the band. No photographs, charts, icons or diagrams. The footer wordmark is a raster logo image (24 by 2 pixels) reading ANDREESSEN HOROWITZ in light grey serif capitals.
Slide 8
“What can we build with this?”
A new kind of scale for technology, and new
kinds of computer.
New ways to change other industries.
Two of those industries: ecommerce & cars.
7
ANDREESSEN HOROWITZ
Visuals: None apart from the faint Andreessen Horowitz wordmark at the bottom. The wordmark is a logo of the firm name 'ANDREESSEN HOROWITZ' set in widely spaced light grey serif capitals, sitting on the bottom band of the slide at about x 19.1 to 40.2 percent and y 92.8 to 94.9 percent. The measured image box is 24 by 2 pixels, and the visible wordmark sits within it. It is not full-bleed, not boxed, has no overlay or tint, and is rendered in a very low-contrast grey (about #E6E6E6) on the #F2F2F2 background.
Slide 9
A new kind of scale
ANDREESSEN HOROWITZ
Slide 10
Changing of the guard / Google, Apple, Facebook & Amazon (GAFA) are 3x the scale of Wintel / Annual revenue ($bn, real terms) / 500 / Wintel / GAFA / 400 / 300 / 200 / 100 / 0 / 1990 / 1995 / 2000 / 2005 / 2010 / 2015 / 9 / ANDREESSEN HOROWITZ / Source: Bloomberg, a16z
Visuals: Line chart titled 'Annual revenue ($bn, real terms)' with a y-axis in $bn from 0 to 500 with labelled gridlines at 0, 100, 200, 300, 400 and 500, and an x-axis of years from 1990 to 2015 labelled at 1990, 1995, 2000, 2005, 2010 and 2015. Two series: Wintel as a dark grey line (#666666) and GAFA as an orange line (#D08040 approx.). Values are not printed; approximate values: Wintel about 3 in 1990, 12 in 1995, 42 in 2000, 65 in 2005, 98 in 2010, 149 in 2015; GAFA about 3 in 1990, 9 in 1995, 8 in 2000, 22 in 2005, 121 in 2010, 433 in 2015. Intermediate GAFA peaks about 266 in 2012 and 350 in 2014. The lines cross around 2009 where GAFA is about 80 and Wintel about 82. Legend at left with a short thick line swatch and label: Wintel (grey), GAFA (orange). No highlighted points. Dotted horizontal gridlines in mid grey span the plot width, and a solid grey baseline sits at 0. Footer wordmark 'ANDREESSEN HOROWITZ' in a light grey (#D9D9D9 approx.) serif capital typeface, measured as a 24 by 2 pixel image at x 19.1%, y 92.8%.
Slide 11
The Wintel explosion in 1990s – 14x growth / The golden age for Intel and Microsoft saw 14x revenue growth and dominance of tech / Wintel annual revenue ($bn, real terms) / 50 / 40 / 30 / 20 / 10 / 0 / 1990 / 1995 / 2000 / 10 / ANDREESSEN HOROWITZ / Source: Bloomberg, a16z
Visuals: One vertical bar chart. Title: Wintel annual revenue ($bn, real terms), shown above the plot. Y axis: linear, 0 to 50, gridlines and labels at 0, 10, 20, 30, 40, 50 ($bn), drawn as fine dotted grey lines. X axis: years 1990 to 2000, with labels only at 1990, 1995 and 2000; a solid grey baseline at 0. Series: one series of 11 bars, one per year 1990 to 2000, all in #666666. No values are printed on the bars, so estimated values are: 1990 about 3, 1991 about 4, 1992 about 5, 1993 about 7.5, 1994 about 10, 1995 about 14, 1996 about 19.5, 1997 about 25, 1998 about 29, 1999 about 34.5, 2000 about 41. No legend. No highlighted points. Bars are evenly spaced and roughly 3.5% of slide width each. Also present: a faint wordmark logo reading ANDREESSEN HOROWITZ in light grey serif capitals, with very low contrast against the white footer.
Slide 12
… But GAFA has 10x the scale
Fundamental change in what it means to be a leading tech company
Annual revenue ($bn, real terms)
500
Wintel 1990-2000
GAFA 2005-2015
400
300
200
100
0
1990 /
2005
1995 /
2010
2000 /
2015
11
Source: Bloomberg, a16z
Visuals: Chart: clustered vertical bar chart, titled 'Annual revenue ($bn, real terms)'. Y-axis: revenue in $bn real terms, range 0 to 500, labelled ticks at 0, 100, 200, 300, 400, 500, with dotted light-grey horizontal gridlines at each labelled tick and a solid grey baseline at 0. X-axis: 11 yearly category pairs; only three are labelled: '1990 / 2005' at the first category, '1995 / 2010' at the sixth, '2000 / 2015' at the last; the unlabelled categories are in between. Series 1, 'Wintel 1990-2000', dark grey #666666 bars, values about: 2, 3, 5, 8, 10, 14, 19, 25, 28, 33, 42. Series 2, 'GAFA 2005-2015', orange #CE7C3B bars, values about: 22, 33, 47, 70, 82, 120, 185, 265, 305, 350, 435. Values are estimates since the slide prints no values. Legend: at far left, dark grey square and label 'Wintel 1990-2000' above an orange square and label 'GAFA 2005-2015'. No highlighted points. Bars are in pairs per year, Wintel bar left of GAFA bar, with no gap between paired bars but a gap between pairs. The wordmark 'ANDREESSEN HOROWITZ' in pale grey serif capitals is a logo at the footer.
Slide 13
From important to dominant
When tech was scared of Microsoft, it was a pretty small company
Top 20 US listed companies by market cap (indexed)
100
90
80
70
60
50
40
30
20
10
0
GAFA
Wintel
All other
1995
2016
12
ANDREESSEN HOROWITZ
Source: Bloomberg, a16z
Visuals: Clustered column chart titled 'Top 20 US listed companies by market cap (indexed)'. Y-axis: indexed market cap, 0 to 100, labelled every 10 (0, 10, 20 ... 100), with dotted horizontal gridlines at each 10-unit step. X-axis: two groups labelled 1995 and 2016, with a solid grey baseline at 0. Series colours: GAFA #CE7C3B (orange), Wintel #C9D3E1 (pale blue-grey), All other #666666 (dark grey). Legend at left, top to bottom: GAFA, Wintel, All other. Values are not printed; estimates for 1995 group, left to right, about: All other 100, 96, 86, 85, 70, 68, 53, 50; Wintel about 50; All other about 49; Wintel about 49; All other about 47, 40, 39, 39, 37, 37, 36, 35, 35. Values for 2016 group, left to right, about: GAFA 100, GAFA 87 (the second orange bar), Wintel 70, GAFA 63, GAFA 59, All other 57, 57, 51, 41, 39, 38, 37, 36, 33, 32, 32, 31, 31, 28, then Wintel about 28 at the right end. Highlighted points: the orange GAFA bars in 2016 at the top-left of that group and the Wintel bar at the far right. Gaps separate the 1995 and 2016 groups. Bars are flat-filled with no outlines.
Slide 14
That scale means much more investment / Annual capex has increased from $1bn to $34bn since 2000 / Annual capex ($bn real) / 35 / 30 / 25 / 20 / 15 / 10 / 5 / 0 / Amazon / Facebook / Apple / Google / Microsoft / 2000 2001 2002 2003 2004 2005 2006 2007 2008 2009 2010 2011 2012 2013 2014 2015 / ANDREESSEN HOROWITZ / Source: Bloomberg, a16z / 13
Visuals: Chart: stacked vertical bar chart. Title: Annual capex ($bn real). Y axis: Annual capex in $bn real, linear scale 0 to 35, gridlines and labels every 5 units (0, 5, 10, 15, 20, 25, 30, 35), drawn as light grey dotted horizontal lines. X axis: calendar years 2000 to 2015, one bar per year, with a thin grey baseline at 0. Series stacked bottom to top: Microsoft (#666666), Google (#CE7C3B), Apple (#C9D3E1), Facebook (#50676E), Amazon (#093E58). The slide prints no values for individual segments, so the following are estimates. Totals about: 2000 1; 2001 1.2; 2002 1; 2003 1; 2004 1.6; 2005 1.8; 2006 3.8; 2007 5; 2008 6.4; 2009 5; 2010 8.7; 2011 11.8; 2012 18.4; 2013 24.4; 2014 32.8; 2015 34.2. About 2015 segments: Microsoft about 5.9, Google about 9.9 (top about 15.8), Apple about 11.3 (top about 27.1), Facebook about 2.5 (top about 29.6), Amazon about 4.6 (top about 34.2). About 2000 the bars are all under 1.5 and mostly Microsoft. Legend: vertical list in the left margin, top to bottom Amazon, Facebook, Apple, Google, Microsoft, each with a small filled square swatch (about 1.2% wide) in the series colour followed by the label. No highlighted points. Logo: the wordmark ANDREESSEN HOROWITZ in very light grey, set as a 24 by 2 pixel placed image (wide, thin), rendered in a serif capital face. No other illustrations.
Slide 15
And 10x more people
(Though this chart includes a lot of warehouse and retail staff)
Permanent employees (000)
Amazon
Apple
Microsoft
600
500
400
300
200
100
0
2000 2001 2002 2003 2004 2005 2006 2007 2008 2009 2010 2011 2012 2013 2014 2015
14
ANDREESSEN HOROWITZ
Source: Bloomberg
Visuals: Stacked column chart. Title: 'Permanent employees (000)' in semibold grey text above the plot. Y axis: 0 to 600 (thousands of permanent employees), labelled 0, 100, 200, 300, 400, 500, 600, with dotted horizontal gridlines at each 100 step. X axis: years 2000 to 2015, one column per year. Each column is stacked bottom to top: Microsoft (#666666), Google (#CE7C3B), Apple (#C9D3E1), Facebook (#50676E), Amazon (#093E58). Legend at left, top to bottom: Amazon, Facebook, Apple, Google, Microsoft, each with a small square swatch. Values are not printed on the slide, so these are estimates: column totals about 57 (2000), 64 (2001), 70 (2002), 78 (2003), 81 (2004), 87 (2005), 114 (2006), 134 (2007), 162 (2008), 172 (2009), 197 (2010), 243 (2011), 313 (2012), 352 (2013), 437 (2014), 531 (2015). Microsoft segment about 40 (2000), 47 (2001), 51 (2002), 55 (2003), 57 (2004), 61 (2005), 71 (2006), 78 (2007), 91 (2008), 94 (2009), 88 (2010), 92 (2011), 95 (2012), 98 (2013), 128 (2014), 118 (2015). Columns are narrow, roughly 40% of each category width, with no outlines. No highlighted points. The 2015 Amazon segment is the tallest single segment, about 232. Small logo: Andreessen Horowitz wordmark in light grey serif capitals at the footer.
Slide 16
Today’s tech giants have a totally different
character of scale to Wintel or IBM before
them.
Giants in the economy, not just in tech.
And (at least) four competing giants, not one.
15
ANDREESSEN HOROWITZ
Visuals: One visual element: a faint 'ANDREESSEN HOROWITZ' wordmark in all-caps serif letters with wide letter-spacing, in very light grey (about #E0E0E0) on the #F2F2F2 background, low contrast and barely legible. No photographs, charts, diagrams or icons.
Slide 17
So Apple is a global top 10 retailer
500 stores, ~$25bn revenue make it a top 20 retailer.
$53bn including the online store…
Making Apple the 10th largest global retailer by revenue.
Not bad for a marketing operation.
16
ANDREESSEN HOROWITZ
Retail ran at 12% of revenue before Apple stopped disclosing it: direct is 25%. Source: Apple, a16z
Visuals: One photograph: exterior of an Apple retail store at dusk, shown as a wide 768 by 512 pixel image. Subject: a multi-storey glass-and-steel building with a glass facade lit from inside, a white Apple logo glowing on the glass at centre, a broad elevated canopy of slanted dark panels along the roof, and an overhead glass walkway spanning a city street. A row of cars with red tail-light streaks (motion blur) travels on the road in the foreground right, with yellow painted road markings at the bottom; a tree stands at left foreground and skyscrapers rise behind. Composition: eye-level wide view, the building centred and filling most of the frame, not cropped, shown as a rectangular boxed image with square corners and no overlay or tint. Lighting: blue twilight sky with warm white and amber interior lighting from the store. Dominant colours: deep blue, slate grey steel, warm white, amber and red accents. Second visual: the Andreessen Horowitz wordmark in capital serif letters, very light grey, sitting in the bottom-centre of the left column; it is a logo, not a photograph.
Slide 18
For Amazon, content is just a strategic lever
Original content is core for Netflix, but just another way to sell Prime for Amazon. / Combined, they’re 16% of US production budgets
Annual TV production budgets, 2015 ($bn)
14
12
10
8
6
4
2
0
Disney
NBCU
CBS
Netflix
Turner
Amazon
HBO
17
ANDREESSEN HOROWITZ
Source: IHS
Visuals: Vertical bar chart titled 'Annual TV production budgets, 2015 ($bn)'. Y-axis: 0 to 14 in steps of 2, unit $bn, labels at the left of the plot, with light dotted horizontal gridlines at each step. X-axis: seven categories with a solid grey baseline at 0. Series (single series, values not printed on the slide, so all are estimates): Disney about 11.9; NBCU about 10.3; CBS about 5.8; Netflix about 4.9; Turner about 3.8; Amazon about 2.7; HBO about 2.1. Highlighted points: the Netflix and Amazon bars are orange (#CE7C3B); all other bars are dark grey (#666666). No legend. Bars are flat with no outline, evenly spaced, about 4.3% of slide width each. Netflix bar sits at x 55.5% to 59.9%, top at y 64.7%, bottom at y 79.9%. No photographs or icons.
Slide 19
Is Netflix a threat?
“Is the Albanian army going to
take over the world?”
- Jeffery Bewkes, CEO Time Warner, 2010
18
ANDREESSEN HOROWITZ
Slide 20
Making your own chips: Intel’s whole / business becomes an add-on.
Google: ‘TPU’ machine learning FPGA.
Amazon: ‘Annapurna’ networking ASIC.
Apple: A10 is the fastest mobile SoC – plus / custom chips for TouchID, Airpods, etc.
19
ANDREESSEN HOROWITZ
Visuals: none apart from the faint Andreessen Horowitz wordmark logo at the bottom, which is a small serif capitals logo in pale grey that is barely visible against the background.
Slide 21
Standing on the shoulders of giants / Huge companies building on an ecosystem that commoditises almost everything before / Scale of 5bn / mobile users / Vast supply chain of / commoditised / components & / platforms / Scale of the / winners / GAFA have much / greater global scale / than Wintel or IBM / ever had / New ways to / compete / Custom hardware / Retail & distribution / Content / (Cars) / 20 / ANDREESSEN HOROWITZ
Visuals: Three outlined circles of equal size arranged left to right, joined by two solid grey plus signs. Circle 1 has a dark grey #666666 outline about 0.3% of slide height thick, with a bold heading and regular body text inside. Circle 2 has an orange #C87D3C outline of the same thickness, with the same text structure. Circle 3 has a pale blue-grey #CBD5E1 outline of the same thickness, with a bold heading and a four-line list. Each circle is about 25.6% of slide width in diameter and has no fill. Between circles 1 and 2 and between circles 2 and 3 sits a solid plus sign in #A6A6A6, about 3.9% of slide width and 6.8% of slide height, with square arms and no shadow. No photographs, charts or icons appear.
Slide 22
In the mean time,
the new thing –
machine learning
ANDREESSEN HOROWITZ
Slide 23
“Is there a dog in / this picture?”
After 50 years of work, computer vision / systems got this right 72% of the time. / A whole class of similar problems – / easy for people and hard/impossible for / computers. / Consensus: decades more work. / Then, in 2012, machine learning.
22
ANDREESSEN HOROWITZ
Source: Imagenet
Visuals: One photograph: a square 4 by 4 collage of 16 abutting tiles, with no gaps and no frame, placed at x 45.9%, y 12.0%, w 43.8%, h 75.9% (780 by 760 pixels). Each tile is a close-up photo of either a chihuahua dog face or a blueberry or chocolate chip muffin. Row 1 from left: blueberry muffin, tan chihuahua face in profile looking left, blueberry muffin in a paper cup, cream-coloured chihuahua puppy looking forward. Row 2: tan chihuahua face looking forward, chocolate chip muffin, tan chihuahua face with wide eyes, blueberry muffin with blueberries. Row 3: chocolate chip muffin with a hole in the centre, tan chihuahua face looking forward, blueberry muffin with two blue-purple blueberries, chihuahua with a pink top and open mouth. Row 4: tan chihuahua face close to camera, a group of blueberry muffins on a plate, two small chihuahua puppies together, chocolate chip muffin with yellow paper cup. Lighting is even and natural, with warm tan, golden and purple-blue dominant colours. The grid is full-square, not cropped at the outer edges. No overlay or tint.
Slide 24
The arrival of machine learning
Performance for decades-old challenges has been transformed
Image recognition
28% error rate
7%
Speech recognition
26% error rate
4%
23
ANDREESSEN HOROWITZ
Visuals: Two rows of dotted arrows, each a horizontal dotted-line arrow with a solid triangular arrowhead, dark grey (about #555555). Row 1 (Image recognition): arrow 1 runs from about x 52.9% to 71.9% at y about 44.7%, from the value '28% error rate' toward '7%'; arrow 2 runs from about x 85.9% to 96.0% at y about 44.7%, continuing past '7%'. Row 2 (Speech recognition): arrow 1 runs from about x 52.9% to 71.9% at y about 76.0%, from '26% error rate' toward '4%'; arrow 2 runs from about x 85.9% to 96.0% at y about 76.0%, continuing past '4%'. No chart, photograph or other imagery. The Andreessen Horowitz wordmark is a light grey serif all-caps logo.
Slide 25
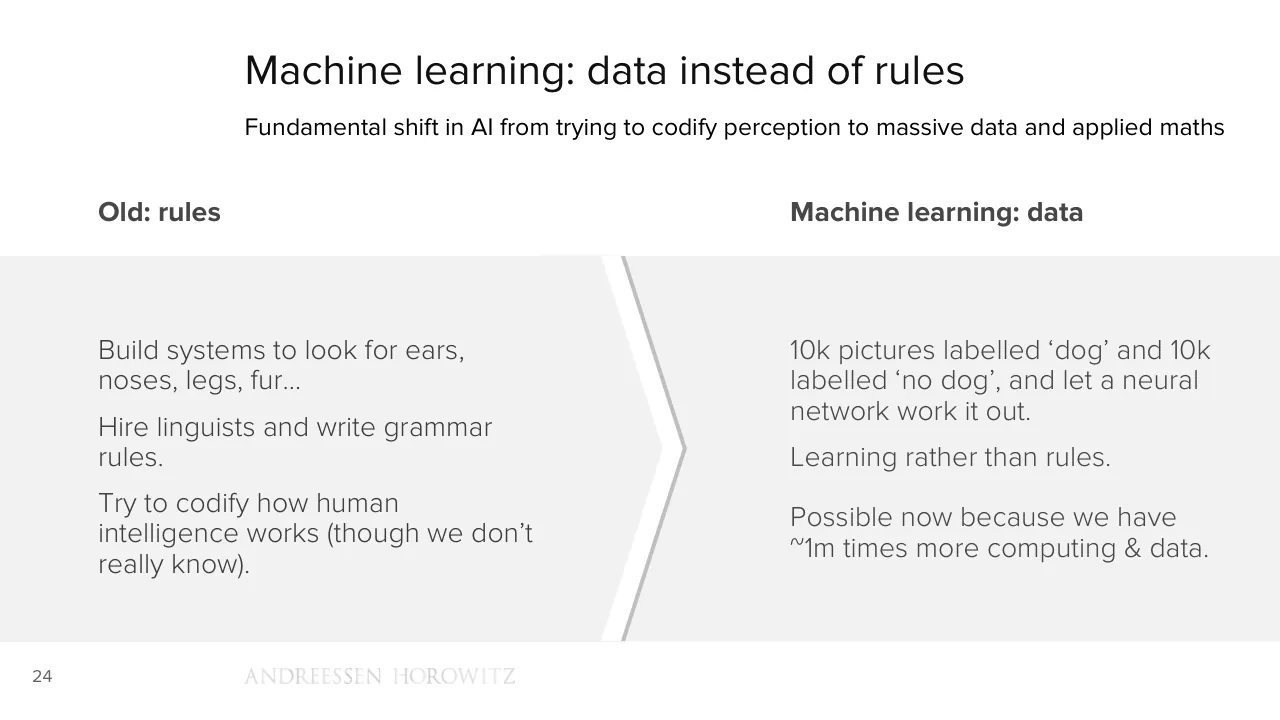
Machine learning: data instead of rules
Fundamental shift in AI from trying to codify perception to massive data and applied maths
Old: rules
Machine learning: data
Build systems to look for ears,
noses, legs, fur…
Hire linguists and write grammar
rules.
Try to codify how human
intelligence works (though we don’t
really know).
10k pictures labelled ‘dog’ and 10k
labelled ‘no dog’, and let a neural
network work it out.
Learning rather than rules.
Possible now because we have
~1m times more computing & data.
24
ANDREESSEN HOROWITZ
Visuals: One graphic element: a chevron divider running vertically through the grey band, pointing right. It is a white stripe about 1.5% of slide width with a thin grey #BFBFBF edge on its right side. Its top runs from about x 47% to 49.5% at y 35.6% and its apex is near x 53.5%, y 62%, returning to the bottom at about x 47% to 49.5%, y 89.1%. Also a small grey ANDREESSEN HOROWITZ wordmark logo in widely spaced capitals, light grey (about #D9D9D9), at x 19.1%, y 92.8%, 21.1% wide and 2.1% high. No photographs, charts or icons.
Slide 26
“Every time I fire a linguist, the
performance of the speech
recognizer goes up.”
- Frederick Jelinek
25
ANDREESSEN HOROWITZ
Visuals: None apart from the faded Andreessen Horowitz wordmark in the footer, which is a logo rendered as a small low-contrast image (24 by 2 pixels at the measured size) in light grey serif capitals with no overlay or tint.
Slide 27
Since we’re analysing data, not looking for
dogs, this works for many other data sets.
“Which customers are about to churn?”
“Will that car let me merge?”
“Is anything weird happening on the
network?”
26
ANDREESSEN HOROWITZ
Visuals: One small wordmark image at the bottom, reading ANDREESSEN HOROWITZ in a light serif capital type, roughly 21% of slide width and 2% of slide height. It is a logo rendered in very pale grey, almost the same tone as the background, so it reads as faint. No photographs, charts, or other graphics.
Slide 28
Alpha Go – board / games and air-con / Google took the machine learning / platform that won Go and applied it to / data center cooling. / Achieved a 15% energy saving. / Building systems that find patterns in / data. / 27 / ANDREESSEN HOROWITZ
Visuals: One photograph of an indoor data-centre cooling plant. Subject: a dense network of large colourful painted pipes and ducts, with yellow, red, blue and green pipes running overhead and down to the floor, flanged valves with handwheels, and suspended chains. Below are light blue plate heat exchangers, stainless steel tanks, and a red pump casing on a steel frame with yellow and black hazard-striped base plates. A red fire extinguisher stands on the floor, and a green mat lies at the bottom left. Composition: wide-angle, looking up and across the ceiling, with the pipe run receding to the right. Lighting: overhead fluorescent tubes and small spotlights, neutral and even. Dominant colours: saturated blue, yellow, red and green, with grey steel and a pale grey concrete floor. The photo is full-height and bleeds to the top, bottom and right edges. Its left part sits under the grey panel, so only the right part is visible. No overlay or tint. Also a faint grey wordmark, ANDREESSEN HOROWITZ, in a thin serif capital typeface, low contrast, centred on about x 11 to 32 percent.
Slide 29
“We will move from mobile-first to AI-first.”
- Sundar Pichai, 2016
28
ANDREESSEN HOROWITZ
Visuals: One logo: a faint Andreessen Horowitz wordmark in widely spaced serif capitals, reading ANDREESSEN HOROWITZ, drawn in very light grey at low contrast. It sits in the bottom band, left-aligned with the slide's text block at about x 19.1%, and occupies a 24 by 2 pixel image. No photographs, charts, diagrams or icons.
Slide 30
ML use cases: how many patterns, how much data?
Things that only people could do, but at a scale that people could never do
Data
New analysis
on almost any
data set
Interaction
Images, voice,
devices, new
UX models
Images
ML can read
images as
easily as text?
Surprises
Things that
don’t look like
ML use cases
29
Visuals: Four outlined circles in a single row, each with a centred heading and three-line centred body text. Circle 1 outline is mid grey #666666, about 0.4% of slide height stroke width, centred at about x 12.3%, y 58%, diameter about 18.8% of slide width. Circle 2 outline is orange #C97B3A, same size, centred at about x 37.2%. Circle 3 outline is pale blue-grey #CBD5E0, same size, centred at about x 62.2%. Circle 4 outline is dark slate #4F6168, same size, centred at about x 87.2%. Interiors are unfilled, showing the #F2F2F2 band. Between circles are three solid plus-sign glyphs in grey #A6A6A6: the first at about x 23.5%, y 58.6%, about 2.3% wide; the second at about x 48.4%, y 58.6%, about 2.8% wide; the third at about x 76.4%, y 58.6%, about 2.6% wide. No photographs or charts.
Slide 31
At the top and / bottom of the stack / Training models at vast scale in the / cloud… / But once trained, many models could / run on very small/cheap devices. / Run on a smartphone. / A $10 widget could run on a cheap DSP / with a commodity camera, looking for / just one thing – people, leaks, cars… / 30 / ANDREESSEN HOROWITZ
Visuals: Two circular photographs and two curved arrows. (1) Top-left circle: a photograph of a data centre, a long central aisle of server racks lit in saturated blue, with overhead cable trays and a bright white light at the far end of the aisle; the aisle converges to a vanishing point in the centre; cool blue dominant colours with a grey floor; the image is cropped to a circle, not full-bleed, with a thin grey outline. (2) Lower-right: a grey outlined circle (no fill) containing a photograph of a small green printed circuit board with two black square chips marked DSP, a larger chip at upper right and one at lower right, a few smaller chips and a gold edge connector at upper left; the board is rotated about 20 degrees and sits centred in the circle on a white background. (3) Upper-right curved block arrow, light grey, sweeping clockwise from the top circle towards the lower circle, with its head pointing down-right. (4) Lower-left curved block arrow, light grey, sweeping from the lower circle towards the top circle, with its head pointing up-left. No charts or tables.
Slide 32
Cameras in everything, except in cameras
Imaging, combined with machine learning, may be becoming a universal sensor
Global image sensing market size ($bn)
12.5
Other
Cars
10.0
PC & Tablet
Camera
7.5
Mobile
5.0
2.5
0.0
2014
2015
2016e
2017e
31
ANDREESSEN HOROWITZ
Source: Sony
Visuals: Chart: stacked column chart titled Global image sensing market size ($bn). Y-axis labelled with values 0.0, 2.5, 5.0, 7.5, 10.0, 12.5 (units $bn), range 0 to 12.5, with dotted horizontal gridlines at each labelled value. X-axis categories 2014, 2015, 2016e, 2017e, with the e marking estimates. Four stacked columns, bottom to top in each: Mobile (#666666), Camera (#CE7C3B), PC & Tablet (#C9D3E1), Cars (#50676E), Other (#093E58). Values are not printed; estimates: 2014 about Mobile 5.7, Camera 0.5, PC & Tablet 1.3, Cars 0.5, Other 1.1, total about 9.1. 2015 about Mobile 6.2, Camera 0.3, PC & Tablet 1.2, Cars 0.7, Other 1.4, total about 9.8. 2016e about Mobile 6.3, Camera 0.3, PC & Tablet 1.0, Cars 0.9, Other 1.6, total about 10.1. 2017e about Mobile 6.8, Camera 0.2, PC & Tablet 1.1, Cars 1.1, Other 2.2, total about 11.4. Legend at left in order top to bottom: Other, Cars, PC & Tablet, Camera, Mobile, each with a small square swatch in the series colour. No highlighted points. Logo: Andreessen Horowitz wordmark in light grey serif capitals at bottom centre-left, low contrast.
Slide 33
What does it mean if computers can read
images in the way they’ve always been able
to read text?
32
ANDREESSEN HOROWITZ
Visuals: One logo: a faint, pale grey Andreessen Horowitz wordmark in serif capitals (ANDREESSEN HOROWITZ), set in a single line across the bottom of the slide, with letters partly fading out so it reads as low contrast. No photographs, charts, diagrams or other graphics.
Slide 34
Complexity and abstraction
Arms race of science, engineering and product – a new front for GAFA competition
Surge in complexity
Building the engineering on
top of the science
‘What’s the right ML for this?’
Even as the science still has
far to go
Rush to abstraction
Google, Amazon, Microsoft,
IBM, etc. rushing to build ML
platforms in the cloud
Core, cutting-edge ML tech
available to rent
ANDREESSEN HOROWITZ
33
Visuals: Two outlined circles of equal size and a double-headed dotted arrow. Left circle: orange outline (about #CC7A38), roughly 2.5 px at slide scale, no fill, containing the heading Surge in complexity and three text blocks. Right circle: pale blue-grey outline (about #C8D1DD), same size and stroke weight, no fill, containing the heading Rush to abstraction and two text blocks. Arrow: dotted dark grey line (about #666666) with filled triangular arrowheads at both ends, running horizontally between the right edge of the left circle and the left edge of the right circle at about the vertical centre of the circles. Not a chart, table, photograph or logo beyond the wordmark.
Slide 35
The machine learning S-Curve
Still in the very early days of creation, with lots and lots of low-hanging fruit
Creation
Deployment
Maturity
Scaling
Frenzy
Machine
Learning
Crazy idea
34
ANDREESEN HOROWITZ
Visuals: One line-and-circle diagram over a column background. A single orange (#CE7C3B) S-curve, about 4 px wide, runs from a plain start point at about x 22%, y 85% rising to the right through a circle at about x 31% to 41%, y 71% to 89%, then curves steeply up through the gap between the Creation and Deployment columns and flattens toward the right, ending in a small filled arrowhead pointing right at about x 78%, y 41%. The curve is labelled from left to right and bottom to top with 'Crazy idea' (start), 'Machine Learning' (inside the circle), 'Frenzy' (on the steep rise), 'Scaling' (on the upper flattening section) and 'Maturity' (at the arrow end). The circle has an orange outline of about 0.4% of slide height and a light grey #D9D9D9 fill, with bold dark grey text centred inside. Column backgrounds: light grey #F2F2F2 bands at about x 2.6% to 25.4% and x 73.4% to 96.2% with a sliver at the far right edge; mid grey #D9D9D9 columns at about x 26.1% to 49.0% (Creation) and x 49.8% to 72.6% (Deployment), separated by white gutters of about 0.8% width. The wordmark 'ANDREESEN HOROWITZ' is set in a thin serif capital typeface in pale grey, about 2.1% of slide height tall.
Slide 36
New kinds of
computer
ANDREESSEN HOROWITZ
Visuals: One logo: the Andreessen Horowitz wordmark, set in white capital letters with a classical serif face, placed as an image of 364 by 22 pixels at bottom-left. No photographs, charts, diagrams or icons.
Slide 37
Obvious but boring: apps have won mobile
Smartphone apps are now close to 60% of all time spent online in the USA
Billion minutes online, USA
Mobile browser
Mobile app
Desktop
1,600
1,400
1,200
1,000
800
600
400
200
0
Jun-13
Jun-14
Jun-15
Jun-16
36
ANDREESSEN HOROWITZ
Source: Comscore
Visuals: Stacked column chart titled 'Billion minutes online, USA', with four columns labelled Jun-13, Jun-14, Jun-15 and Jun-16. The y-axis runs from 0 to 1,600 in steps of 200, with light grey dotted horizontal gridlines at each step and a solid grey baseline at 0. Each column is stacked from bottom to top as Desktop (#666666), Mobile app (#CE7C3B) and Mobile browser (#C9D3E1). No values are printed on the bars, so values are estimates: Jun-13 Desktop about 480, Mobile app top about 885, Mobile browser top about 965; Jun-14 Desktop about 480, Mobile app top about 1,100, Mobile browser top about 1,200; Jun-15 Desktop about 550, Mobile app top about 1,325, Mobile browser top about 1,450; Jun-16 Desktop about 495, Mobile app top about 1,355, Mobile browser top about 1,480. Legend at the left, top to bottom: Mobile browser, Mobile app, Desktop, each with a small square swatch in the series colour. No highlighted points.
Slide 38
... with increasing concentration / Facebook has 15-20% of mobile time (making it the largest mobile web browser) / Billion minutes online, USA / Mobile browser / Facebook app / Mobile app / Desktop / 1,600 / 1,400 / 1,200 / 1,000 / 800 / 600 / 400 / 200 / 0 / Jun-13 / Jun-14 / Jun-15 / Jun-16 / 37 / ANDREESSEN HOROWITZ / Source: Comscore, a16z
Visuals: Chart: stacked column chart, titled 'Billion minutes online, USA' (semibold, grey #7F7E7B). Y axis in billions of minutes, ticks at 0, 200, 400, 600, 800, 1,000, 1,200, 1,400 and 1,600, with a range of 0 to 1,600; no unit label beyond the title. X axis categories are Jun-13, Jun-14, Jun-15 and Jun-16. Four stacked series, bottom to top: Desktop (dark grey #666666), Mobile app (orange #CE7C3B), Facebook app (slate teal #50676E) and Mobile browser (pale blue-grey #C9D3E1). The printed slide gives no data labels, so the values are estimates marked about: Jun-13 Desktop about 480, Mobile app to about 885, Mobile browser to about 965, no Facebook app segment; Jun-14 Desktop about 480, Mobile app to about 1,100, Mobile browser to about 1,200, no Facebook app segment; Jun-15 Desktop about 550, Mobile app to about 1,325, Mobile browser to about 1,445, no Facebook app segment; Jun-16 Desktop about 495, Mobile app to about 1,130, Facebook app to about 1,355, Mobile browser to about 1,480. Legend at left, top to bottom: Mobile browser, Facebook app, Mobile app, Desktop, each with a small square swatch in the matching colour. Horizontal gridlines are dotted mid-grey lines at each 200 step. The baseline at 0 is a solid grey line. No highlighted points. Bars are flat with no gradient, no outline and no shadow. A wordmark logo 'ANDREESSEN HOROWITZ' sits in the footer in very light grey serif capitals, not boxed.
Slide 39
More important: a new generation of computing
After 30 years, we shift to a new and more sophisticated kind of computer
Intensely personal
Always with you
Imaging as primary input
Touch, tilt, location, microphone
App stores
Ignore battery & bandwidth
1000x faster
Cloud & machine learning
And yet much easier to use…
38
Visuals: A photograph of a beige Macintosh-style desktop computer shown front-on: a boxed monitor with a black screen, a floppy disk slot below the screen, a small rainbow Apple logo at lower left of the case, a beige keyboard in front, and a small mouse at right. Lighting is flat and even, with soft shadows under the keyboard. Dominant colours are beige #D8D0BE and black #1A1A1A on a near-white ground. The image is not cropped, is not full-bleed, and has no border or overlay. A solid grey #A3A3A3 right-pointing block arrow runs horizontally from the computer's right edge (about x 30.4% to 46.0%, y 50.0% to 56.7%) toward the tile grid, with its shaft at mid-height and a triangular head at the right end. A tiny 24 by 2 pixel mark sits at x 19.1%, y 92.8%, nearly invisible. The grid of nine white rectangles is described under elements.
Slide 40
New computing model
Both more sophisticated and easier to use
39
Visuals: One visible element: a solid dark grey circle (#3F3F3F), diameter about 20.4% of slide width, centred at about x 29.3%, y 56.9%, holding the white text 'Both more sophisticated and easier to use' centred in four lines. The file also contains, but they do not show in the render, an orange circle (#CE7B3B) at x 47.9% y 38.7% size 20.4 by 36.4, a grey circle (#7F7F7F) at x 76.6% y 38.7% size 20.4 by 36.4, two small arrow-like shapes (#A3A3A3) at x 41.6% y 52.3% and x 70.3% y 52.3% size 4.4 by 9.3, and white labels 'New', 'creation: live,', 'New sensors,', 'social,', 'inputs and', 'broadcast,', 'interfaces', 'touch,', 'imaging' placed over those shapes. These are white or light on the white or light grey background and are not visible in the render. No photograph, chart or logo is visible apart from the footer wordmark.
Slide 41
New computing model, and new creation models
Leave the PC behind, presume mobile-only and mobile-native, not mobile-first
Both more
sophisticated
and easier to
use
New sensors,
inputs and
interfaces,
machine
learning
New
creation: live,
social,
broadcast,
touch,
imaging
40
ANDREESSEN HOROWITZ
Visuals: Three filled circles, each about 20.4% of slide width by 36.2% of slide height, so they are true circles. Circle 1 at x 19.1%, y 38.8%, fill #3F3F3F (dark charcoal), contains the white text 'Both more sophisticated and easier to use'. Circle 2 at x 47.9%, y 38.8%, fill #CE7B3B (burnt orange), contains the white text 'New sensors, inputs and interfaces, machine learning'. Circle 3 at x 76.6%, y 38.8%, fill #7F7F7F (mid grey), contains the white text 'New creation: live, social, broadcast, touch, imaging'. Between circles 1 and 2 is a right-pointing block arrow at x 41.6%, y 52.3%, 4.4% by 9.3%, fill #A3A3A3, flat with no outline; a second identical arrow at x 70.3%, y 52.3% sits between circles 2 and 3. The arrows point left to right, showing the sequence circle 1 to circle 2 to circle 3. A small wordmark 'ANDREESSEN HOROWITZ' in light-grey serif capitals (raster image, 24 by 2 pixels) sits at x 19.1%, y 92.8%.
Slide 42
How many old assumptions does live video break? / Assume high quality camera, fast CPU/GPU for encoding and effects, touch, always on, always in your pocket. / Assume unlimited bandwidth & battery. / Assume 1bn high-end smartphones on earth - there can be 50 companies trying this. / And turn the whole phone into the camera. / 41 / ANDREESSEN HOROWITZ / Source: Houseparty, Yixia
Visuals: Two smartphone mockups in dark grey/black frames, shown upright and side by side, with no overlap. Left phone: a Houseparty video call screen showing a 2x3 grid of live video tiles of smiling young people (top-left a woman with long brown hair, top-right a young man in sunglasses and checked shirt, middle-left a partly visible woman against a grey street, middle-right a laughing woman with blonde hair, bottom-left partly visible, bottom-right a smiling woman with long dark hair). A white rounded notification banner at the top of the screen reads 'Sara Tabb is the house!' with a small house icon. Right phone: a Yixia live-streaming screen with a full-frame photo of a young woman with bangs wearing a cream sweater with black patterned knit, arms raised behind her head, with a gold crown graphic with a pink heart and the word 'Princess' in pink-and-gold lettering. Chinese-language overlay text and chat bubbles sit over the lower half of the photo, with a heart-shaped gift icon and pink floating hearts on the right side; a row of small circular avatars sits above a bottom input bar reading 说点什么吧. Top-left of the screen has a username card 杉树卤虾 with viewer count text and a pill button 守护排行榜. Lighting is flat and even, the photo is warm cream and brown with pink accents. The phone screens are not cropped and are boxed by their device frames; the left phone is a rendered device with a gradient-free black body.
Slide 43
Frictionless
computing
No buttons, apps or intermediate steps,
no ‘computer stuff’ between you and the
service – just use it (hopefully).
Hardware sensors as unbundled apps -
deep links within apps.
Apps moved to a new context.
And of course all built with commodity
components from the smartphone
supply chain.
42
ANDREESSEN HOROWITZ
Visuals: Two product photographs on a white background, no captions. (1) Amazon Echo smart speaker: a tall black cylinder, roughly three times as tall as wide, photographed straight-on in a studio setting with soft even lighting and no visible cast shadow. The top cap carries a thin blue light ring and small touch controls (microphone and action buttons). The lower half has a dense perforated black speaker mesh, and the base has the word 'amazon' in small light grey lettering with a smile arrow. The image is not cropped and sits inside a plain white field. (2) Eyewear with cameras, the Snapchat Spectacles style: a turquoise-teal frame with round mirrored light blue lenses, a bridge and a thin top bar, photographed front-on with the arms folded out of view, lit evenly with soft highlights on the lenses. Each outer corner has a small dark camera lens with a yellow ring. Dominant colours are teal #1FB5C4 and light blue #8FD3E8 on the lenses. The image is not cropped and is not boxed. Several other embedded image objects on the slide are 1 pixel spacers and are invisible.
Slide 44
Lighting everything up with machine learning / Smartphone supply chain enables this – machine learning makes it useful / Sensors / Smartphone, or / cheap smartphone / components / Machine learning / Speech recognition, / computer vision / Action / 43 / ANDREESSEN HOROWITZ
Visuals: Three outlined circles, each about 25.9% of slide width and 46% of slide height, in a row. Circle 1 (left) has a dark grey #666666 stroke about 3 px wide and holds the labels Sensors (bold) and Smartphone, or cheap smartphone components. Circle 2 (centre) has an orange #C97B3D stroke of the same width and holds Machine learning (bold) and Speech recognition, computer vision. Circle 3 (right) has a pale blue-grey #C9D3E0 stroke and holds Action (bold). Between circles 1 and 2 is a solid grey #A3A3A3 right-pointing block arrow (about 4.3% wide, 7.5% high) at x 29.9%, y 55.0%. Between circles 2 and 3 is an identical arrow at x 64.0%, y 54.0%, 5.2% wide and 9.3% high. Arrows point from left to right, connecting the three circles in sequence. The circles have no fill and sit on the grey band. No photographs or icons.
Slide 45
(If the machine can answer)
Still need to narrow the domain to things you can actually do, and tell your users
“I’m sorry Dave…”
Sensors
Smartphone, or
cheap smartphone
components
Machine learning
Speech recognition,
computer vision
Action
44
ANDREESSEN HOROWITZ
Visuals: Two outlined circles with arrows and one illustration. (1) Left circle: thin grey outline ring (about #666666, about 0.3% of slide height stroke), no fill, centre about x 14.9%, y 58.7%, diameter about 25.9% of slide width, containing the text Sensors / Smartphone, or / cheap smartphone / components. (2) Grey arrow: solid right-pointing block arrow, fill #A3A3A3, x 29.9%, y 54.8%, w 4.3%, h 7.6%. (3) Middle circle: thin orange outline ring (about #D07F3A), no fill, x 36.1%, y 35.6%, diameter about 25.9% of slide width, containing Machine learning / Speech recognition, / computer vision. (4) Grey arrow: solid right-pointing block arrow, fill #A3A3A3, x 64.0%, y 54.0%, w 5.2%, h 9.3%. (5) Illustration: a close-up of the HAL 9000 camera eye, square 500 by 500 px image, placed at x 70.8%, y 33.7%, w 27.6%, h 49.1%, unboxed and not cropped, circular subject on a transparent-looking background. Brushed metallic silver bezel with dark grey rim; black inner lens; central radial glow from bright yellow-white centre through red to black at edges; a few light grey segmented lens bars across the upper arc. Lighting is a soft spotlight from the centre. Dominant colours: red, black, silver grey. (6) Wordmark logo: ANDREESSEN HOROWITZ in light grey serif capitals, x 19.1%, y 92.8%, w 21.1%, h 2.1%.
Slide 46
Changing friction and changing choices
Massive proliferation of UX models. All about removing friction. And choices…
Removing questions and friction
But also choices
Do you have the printer driver?
Questions are also choices
What’s your password?
Where did you save that file?
Huge strategic incentive for big
platforms to be the ones to answer
…
the question for you
What soap do you want to buy?
With which app?
“Who owns the customer?”
45
ANDREESSEN HOROWITZ
Visuals: A chevron divider running the full height of the grey panel: a white stripe about 3% of the width wide, pointing right, with its apex near x 52.5% and y 62%, bordered on its right edge by a thin mid-grey (#BFBFBF) band that forms a shadow-like edge. Left of the chevron is a flat light grey (#F2F2F2) panel; right of it is another flat light grey panel of the same tone. No photographs, charts, icons or diagrams other than the wordmark logo.
Slide 47
From direct, physical interaction with data…
46
ANDREESSEN HOROWITZ
Source: IBM
Visuals: One photograph: a black-and-white photograph of two hands interacting with a light grey rectangular block with raised dot patterns resembling Braille. A hand with fingers spread presses on the upper part of the block from the top-left, and a second hand approaches from the right edge with the index finger extended toward the block. The block occupies the centre-left of the frame, with its face covered in small dark raised dots in irregular clusters. The composition is a wide landscape crop, full-bleed across the slide width, running from about 12% to the bottom edge and partly covered by the footer band. Lighting is soft and directional from the upper left, with a dark background at the top right. Dominant colours are greys: near-black background, mid-grey skin tones and light grey block (#D9D9D9 approximately). The bottom of the photograph shows a faint ruler-like object partly under the footer band. No overlay on the photo apart from the footer band.
Slide 48
To direct, physical interaction with data
47
ANDREESSEN HOROWITZ
Source: Magic Leap
Visuals: Photograph (full-bleed, spanning the full slide width, visible from about 24.7% of the height down to the footer). Subject: an animated 3D character, a young woman with a brown ponytail, brown jacket with a pink emblem, dark trousers and white boots, standing on a white table at the left and pointing a wooden wand with a glowing tip toward a wall. On the wall, projected blue-and-dark numerals float in mirrored-looking form: a vertical fraction showing '+29' over '107', a row reading '72 80 87 91 107' with blue arcs (jumps) drawn above them, and '10 10 1 8' above the row, with the number 107 circled in red. At right, a real child (a girl with dark curly hair, looking left, denim shirt with a white arrow print over a grey t-shirt with a red collar) holds a pencil and a sheet of paper. Composition: wide horizontal frame, the animated figure at left third, the child at right, the wall with numbers in the centre. Lighting: soft natural indoor daylight. Dominant colours: warm beige, grey-white wall, denim blue, dark brown wood chair, pale table. The photo is not boxed and has no tint, but the bottom strip is overlaid by white at 60% and 80% opacity, which fades the lower part and the wordmark. A thin strip of table and paper is visible behind the footer. No charts, tables or icons. Logo: the Andreessen Horowitz wordmark in light grey serif capitals, faded by the white overlay.
Slide 49
Ecommerce
ANDREESSEN HOROWITZ
Visuals: One logo: the Andreessen Horowitz wordmark, set in white serif capitals reading ANDREESSEN HOROWITZ on one line with a wider word space between the two words. It sits at bottom-left, about 364 by 22 pixels. No photographs, charts, or other graphics.
Slide 50
Retailers as newspapers
“History doesn’t repeat, but sometimes it rhymes”
Fixed cost base with falling revenue.
Shift from paid to freemium, unbundling, different skills.
The distribution advantage moves.
New medium means different consumption – you buy different things, not just in different places.
ANDREESSEN HOROWITZ
49
Visuals: One photograph and one arrow. Photograph: a cut-out, greyscale stack of folded newspapers, roughly square-pyramidal, with the top sheet showing a printed page of grey newsprint columns and tables; the stack is seen from slightly above, centred in its box, with a white background cut out around it and a soft natural light from the upper left, no shadow. The stack is not cropped, boxed or tinted; its dominant colours are light grey, off-white and charcoal. Arrow: a solid right-pointing block arrow, flat fill #A3A3A3, shaft about 3% of slide height thick with a triangular head, its left end tucked behind the right edge of the newspaper stack, pointing at the body text. Also a small wordmark logo (see elements) in light grey serif capitals.
Slide 51
Everything the internet did to media will / happen to retail / Break up old / bundles and / aggregators / New / aggregators / emerge / And they shape / consumption in / different ways / 50 / ANDREESSEN HOROWITZ
Visuals: Three filled circles of equal size (about 24.7 by 43.9 percent of the slide, rendered as true circles) arranged left to right: dark charcoal #3F3F3F, burnt orange #CE7B3B, and mid grey #7F7F7F, each containing centred white light-weight sans-serif text. Between the first and second circle and between the second and third circle sits a solid right-pointing block arrow in #A3A3A3 with no outline (about 5.4 by 11.2 percent each, vertically centred on the circles). No chart, photograph or icon. The Andreessen Horowitz wordmark is a pale grey serif all-caps logo.
Slide 52
So far, mostly, what you already know you want / Ecommerce is much better at logistics than demand generation / Ecommerce as % US retail revenue* / 14% / Amazon / US ecommerce / 12% / 10% / 8% / 6% / 4% / 2% / 0% / 1998 1999 2000 2001 2002 2003 2004 2005 2006 2007 2008 2009 2010 2011 2012 2013 2014 2015 / 51 / ANDREESSEN HOROWITZ / *Ex. food service, gasoline, auto. Source: US Census Bureau, Amazon, a16z
Visuals: Line chart titled 'Ecommerce as % US retail revenue*'. X-axis: years 1998 to 2015, one label per year, no axis title. Y-axis: 0% to 14% in 2% steps, labels at left, no axis title. Dotted grey horizontal gridlines at each 2% step. Solid baseline at 0%. Two series. Series 'US ecommerce' (dark grey line, about 0.3% in 1998, about 0.9% in 1999, about 1.6% in 2000, about 2.0% in 2001, about 2.4% in 2002, about 3.0% in 2003, about 3.6% in 2004, about 4.3% in 2005, about 5.0% in 2006, about 5.9% in 2007, about 6.0% in 2008, about 6.4% in 2009, about 7.3% in 2010, about 8.2% in 2011, about 9.0% in 2012, about 9.8% in 2013, about 10.8% in 2014, about 12.0% in 2015). Series 'Amazon' (orange line, starting 2003, about 0.15% in 2003, about 0.15% in 2004, about 0.2% in 2005, about 0.2% in 2006, about 0.3% in 2007, about 0.35% in 2008, about 0.5% in 2009, about 0.8% in 2010, about 1.0% in 2011, about 1.3% in 2012, about 1.6% in 2013, about 1.9% in 2014, about 2.2% in 2015). No values are printed on the chart; all values are estimates. Legend at upper left: orange line swatch labelled Amazon above dark grey line swatch labelled US ecommerce. No highlighted points. Footnote explains exclusions. Small faint wordmark ANDREESSEN HOROWITZ in the footer, rendered as a light grey logo image about 21 percent wide.
Slides 53 to 78 continue in the full text file.
Download this deck
The hosted PDF of every library deck is free for readers of the SlideDeck Co newsletter. Join with your email and the viewer and download appear here.
Building a deck of your own? The SlideDeck Co Standard Deck is a slide library for business presentations: reviews, updates and plans.







