

The deck opens with a title slide and a short framing before moving into its argument that mobile is driving technology's reach and scale. Early sections chart how smartphones bring more people online, using bar and line charts sourced from ITU, a16z and Ericsson, and then cover device costs and the growth of the mobile market. The middle sections argue that mobile has remade the tech industry, the internet and consumer electronics, with market share and unit-sales comparisons against PCs, cameras and games consoles. Later sections shift to how mobile dominates attention and how businesses are increasingly built around new technology, using Amazon and Wal-Mart as examples. The closing slides use Google Books frequency charts for railways, steel, computerization and software to argue that mature technology fades into the background, ending on the line that software is eating the world. Slides 4 to 7 and 14 to 21 are the most useful to study, as they show how a single chart is paired with one headline claim and a short source line.
Slides worth studying
Questions about this deck
How many slides does the Benedict Evans mobile deck have?
The Benedict Evans deck has 54 slides. It opens with a title slide on slide 1 and closes with the line 'Software is eating the world' on slide 54.
What does the Benedict Evans deck say about smartphone unit sales compared with PCs?
Slide 15 states '4bn people buying phones every 2 years instead of 1.6bn buying PCs every 5 years.' The chart on that slide shows quarterly unit shipments for iOS and Android against PCs.
What does the Benedict Evans deck say about Amazon's share of US retail?
Slide 47 states that 'Amazon still only has 1.5% of US retail revenue.' The slide pairs this with a line chart of Amazon North America ecommerce as a percentage of US retail.
What outlook does the Benedict Evans deck give for smartphone adoption by 2020?
Slide 8 says 'By 2020 80% of adults on earth will have a smartphone.' The slide sources this to World Bank, GSMA and a16z.
Details
- Company: Benedict Evans
- Year: 2015
- Type: Conference talk
- Industry: Technology
- Pages: 54
More from Benedict Evans
- Benedict Evans conference talk, 2026
- Benedict Evans conference talk, Autumn 2025
- Benedict Evans conference talk, Spring 2025
- Benedict Evans conference talk, 2023
- Benedict Evans conference talk, 2023
- Benedict Evans strategy presentation, 2022
All Benedict Evans decks in the library
Review score: 8 out of 10, Strong
Presentation quality, judged with the SlideDeck Co review heuristic. Ask, evidence and idea merit are not rated here.
The deck has a clear spine: section dividers (3, 14, 23, 34, 42, 54) set up each claim, and the pages after them carry it with one chart and a plain headline plus a one-line takeaway (6, 7, 15, 16, 17). The template is consistent, with a restrained grey and orange palette where orange marks the key series, and legible chart text with a source line on every data slide. Weaknesses remain: slides 4 and 5 have bland titles and no stated takeaway, slides 43 and 50 to 53 have thin or vague titles, 7's rotated year labels are crowded, and the abstract diagrams (22, 43, 49) are weak. Slide 9 is text with no visual, and slide 35 uses a foreign purple palette that is hard to read.
Worth keeping: Keep the one-chart, one-claim pattern with a headline, a subhead stating the takeaway and a source line (slides 6, 15, 16, 17), and the orange divider slides that mark the argument's sections.
Most useful repair: Give slides 4, 5, 50 to 53 and 43 action titles that state the point, and rebuild the weak diagram pages (22, 43, 49) so the structure is visible rather than loose text in chevrons.
What would change the score: I would recolour slide 35 into the deck palette, thin the year labels on slide 7, and use a big number or visual on slides 9, 32 and 40 instead of plain text.
Confidence high. 54 of 54 pages inspected on contact sheets, 4 at readable size. Reviewed 2026-11-08. Model-assisted review (claude-sonnet-5-5).
Full text of the slides (54 slides)
Every slide's words and a description of its charts and images, so the deck can be searched and rebuilt. Also available as Markdown.
Slide 1
Mobile is eating the world
Benedict Evans
May 2015
www.ben-evans.com
Benedict Evans
–– January 2020
1
Visuals: Three non-text shapes and one line, no photographs, charts or icons. (1) Full-slide rectangle filled #EB483F, edge to edge. (2) Panel rectangle at x 17.3%, y 20.4%, w 78.1%, h 61.1%, filled white at 4% opacity, giving a slightly lighter red tint. (3) White horizontal rule, about 0.4% of slide height thick, running along the bottom edge of the panel from x 17.3% to x 95.4% at about y 81.4%. A solid #EB483F rectangle at x 71.2%, y 86.7%, w 26.1%, h 13.3% sits over the bottom-right corner and masks the footer and page number.
Slide 2
ANDREESSEN HOROWITZ
MOBILE IS
EATING THE
WORLD
BENEDICT EVANS
@BenedictEvans
May 2015
Visuals: One image: the Andreessen Horowitz wordmark, a white serif logotype in all capitals spanning about 33% of slide width at top-left (496 by 30 pixels). No photographs, charts or other graphics.
Slide 3
Mobile is making
technology universal
Slide 4
Growth into the bubble
Billion people online
0.5
0.4
0.3
0.2
0.1
0.0
1995
2000
Source: ITU, a16z
Visuals: Vertical bar chart. Chart title: Billion people online. Y axis: 'Billion people online', linear, labelled 0.0 to 0.5 in steps of 0.1 with dotted light grey horizontal gridlines at each step (0.5 at about 36.4% of slide height, 0.4 at 45.9%, 0.3 at 55.2%, 0.2 at 64.6%, 0.1 at 74.0%, baseline 0.0 at 83.4%). X axis: two categories, 1995 and 2000, with no axis title and no units printed. Series: one series, dark grey bars #666666. 1995 bar: about 0.045 (no value printed, estimated from height). 2000 bar: about 0.415 (no value printed, estimated from height). No legend. No highlighted points. Bars are unlabelled with data values. Baseline is a thin grey #7F7E7B horizontal axis line at 0.0.
Slide 5
Growth since the bubble
Billion people online
3
People online
Smartphones
2
1
0
1995
2000
2014
Source: ITU, a16z
Visuals: Bar chart, clustered (grouped), vertical. Title: 'Billion people online'. Y-axis: 0 to 3 billion people, labelled 0, 1, 2, 3, with dotted horizontal gridlines at 1, 2 and 3 and a solid baseline at 0. X-axis: categories 1995, 2000, 2014, with no axis title. Series 1, 'People online' (grey #666666): about 0.04 billion in 1995, about 0.4 billion in 2000, about 2.95 billion in 2014 (no values printed; these are estimates read from bar heights). Series 2, 'Smartphones' (orange #CE7C3B): only one bar, in 2014, about 2.0 billion (no value printed). Legend: top-left of the chart, vertical, square swatches with labels 'People online' (grey) and 'Smartphones' (orange). No highlighted points. The 2014 bars are the tallest and the smartphone bar is drawn beside the people-online bar.
Slide 6
Growth into the future - everyone
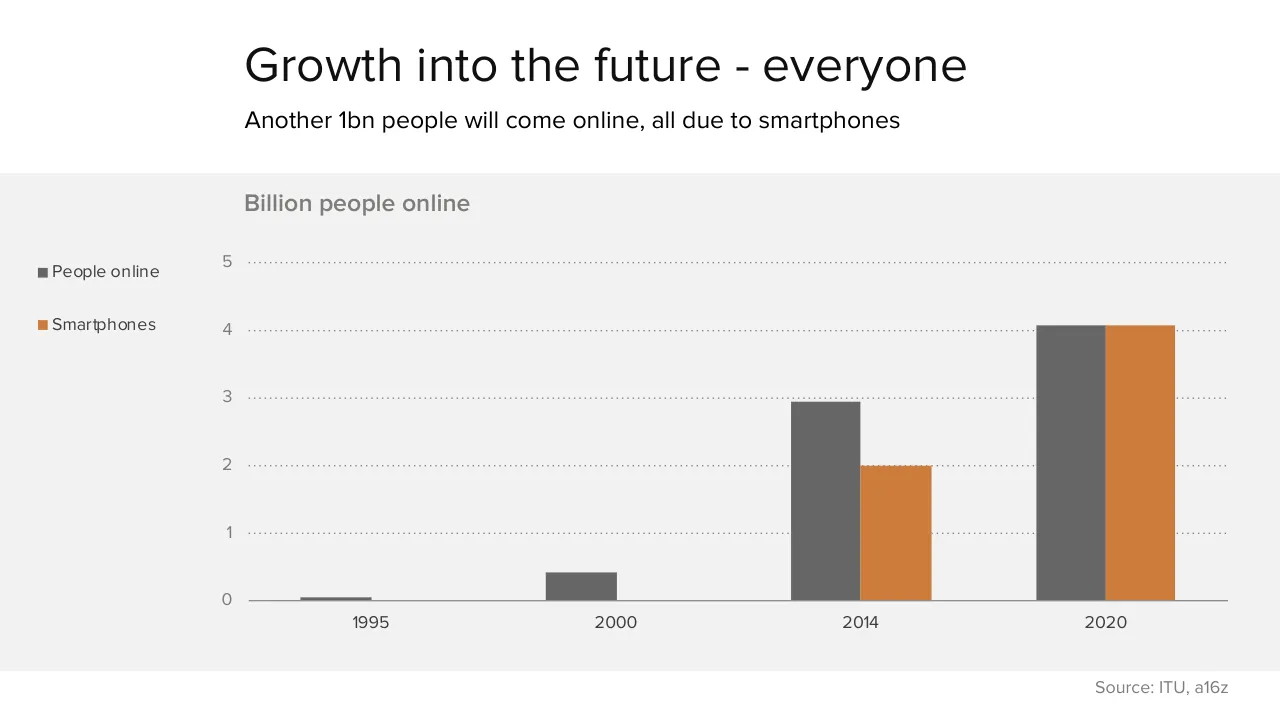
Another 1bn people will come online, all due to smartphones
Billion people online
5
People online
Smartphones
4
3
2
1
0
1995
2000
2014
2020
Source: ITU, a16z
Visuals: Clustered vertical bar chart titled Billion people online. Y axis: Billion people, linear scale 0 to 5 with gridlines at each whole number, labels 0 1 2 3 4 5. X axis: years 1995, 2000, 2014, 2020, categorical. Series 1 People online, dark grey #666666: 1995 about 0.05, 2000 about 0.42, 2014 about 2.95, 2020 about 4.08. Series 2 Smartphones, orange #CE7C3B: 2014 about 2.0, 2020 about 4.08; no bars for 1995 or 2000. Legend at the left of the chart: dark grey square with People online, orange square with Smartphones. Gridlines are dotted mid-grey lines at each unit, and the zero baseline is a solid grey line. No bars are highlighted. Values are estimates from bar heights because no values are printed on the bars.
Slide 7
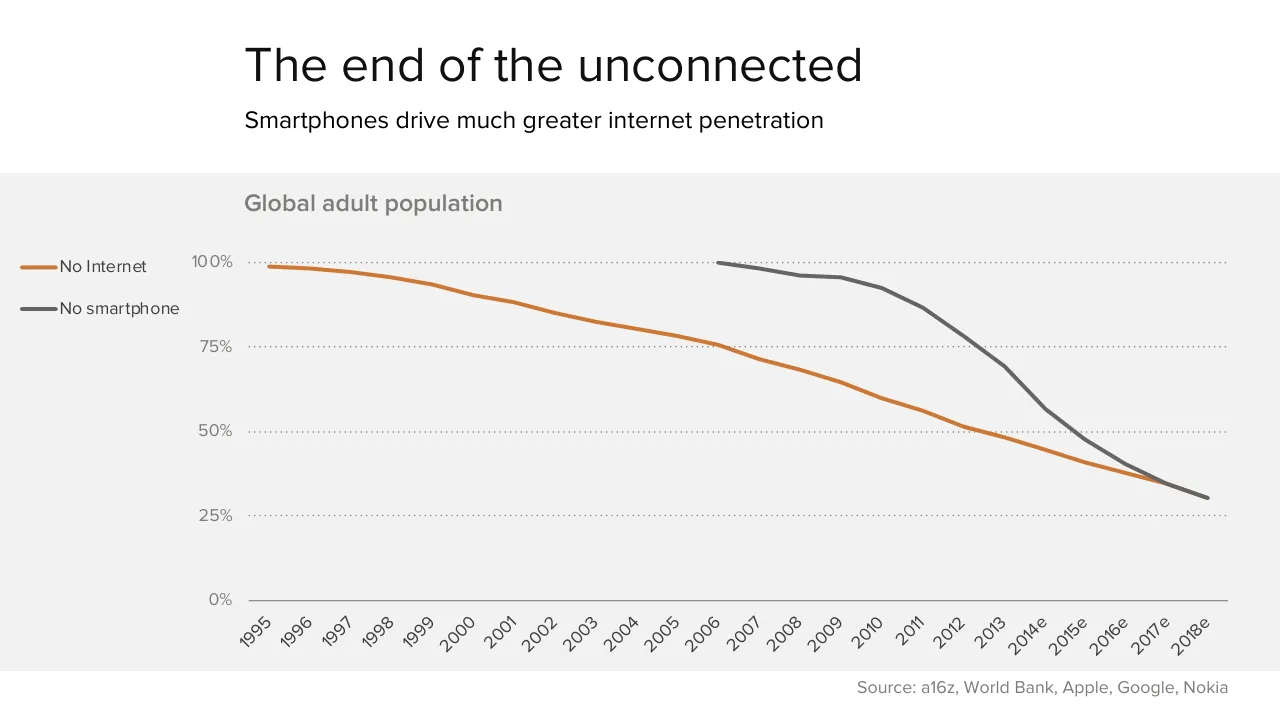
The end of the unconnected / Smartphones drive much greater internet penetration / Global adult population / 100% / No Internet / No smartphone / 75% / 50% / 25% / 0% / 1995 / 1996 / 1997 / 1998 / 1999 / 2000 / 2001 / 2002 / 2003 / 2004 / 2005 / 2006 / 2007 / 2008 / 2009 / 2010 / 2011 / 2012 / 2013 / 2014e / 2015e / 2016e / 2017e / 2018e / Source: a16z, World Bank, Apple, Google, Nokia
Visuals: Line chart titled Global adult population. Y axis: percent of global adult population, 0% to 100%, gridlines and labels at 0%, 25%, 50%, 75%, 100%. X axis: calendar years 1995 to 2018, labels 1995 to 2013 then 2014e, 2015e, 2016e, 2017e, 2018e (e = estimate), labels rotated about 45 degrees. Series 1, No Internet (orange line, about #D07A35, about 3 px stroke): about 99% in 1995, about 98% in 1996, about 97% in 1997, about 96% in 1998, about 94% in 1999, about 90% in 2000, about 88% in 2001, about 85% in 2002, about 82% in 2003, about 80% in 2004, about 78% in 2005, about 75% in 2006, about 71% in 2007, about 68% in 2008, about 64% in 2009, about 60% in 2010, about 56% in 2011, about 51% in 2012, about 48% in 2013, about 45% in 2014e, about 41% in 2015e, about 37% in 2016e, about 34% in 2017e. Series 2, No smartphone (dark grey line, about #666666, about 3 px stroke): about 100% in 2006, about 98% in 2007, about 96% in 2008, about 95% in 2009, about 92% in 2010, about 86% in 2011, about 78% in 2012, about 69% in 2013, about 57% in 2014e, about 48% in 2015e, about 40% in 2016e, about 35% in 2017e, about 30% in 2018e. The values are estimates read from the line positions, since no values are printed. Legend at left: orange line with No Internet, grey line with No smartphone, both stacked vertically. No highlighted points. Gridlines are dotted grey lines at each 25% step. The two series cross near 2017e.
Slide 8
The world in 2020 / By 2020 80% of adults on earth will have a smartphone / Global population (bn) / Growth to 2020 / 2014 / 8 / 7 / 6 / 5 / 4 / 3 / 2 / 1 / 0 / Population / Adults / Mobile / Online population / Smart phones / PCs / Source: World Bank, GSMA, a16z
Visuals: Chart: vertical stacked column chart titled 'Global population (bn)'. Y-axis is labelled with integers 0 to 8 (unit: billions, bn), gridlines at each integer as dotted grey lines, no axis title. X-axis categories left to right: Population, Adults, Mobile, Online population, Smart phones, PCs. Two series stacked: 2014 (dark grey #666666, bottom segment) and Growth to 2020 (orange #CE7C3B, top segment). No values are printed on the bars; estimated values: Population about 7.0 (2014) plus about 0.4 growth, total about 7.4; Adults about 5.2 plus about 0.2, total about 5.4; Mobile about 3.6 plus about 0.7, total about 4.3; Online population about 2.7 plus about 1.3, total about 4.0; Smart phones about 2.0 plus about 2.0, total about 4.0; PCs about 1.6 (2014 only, no growth segment). Legend at top-left of the chart: orange square 'Growth to 2020' above dark grey square '2014'. No highlighted points. Bars are flat, solid, with no outlines and no data labels.
Slide 9
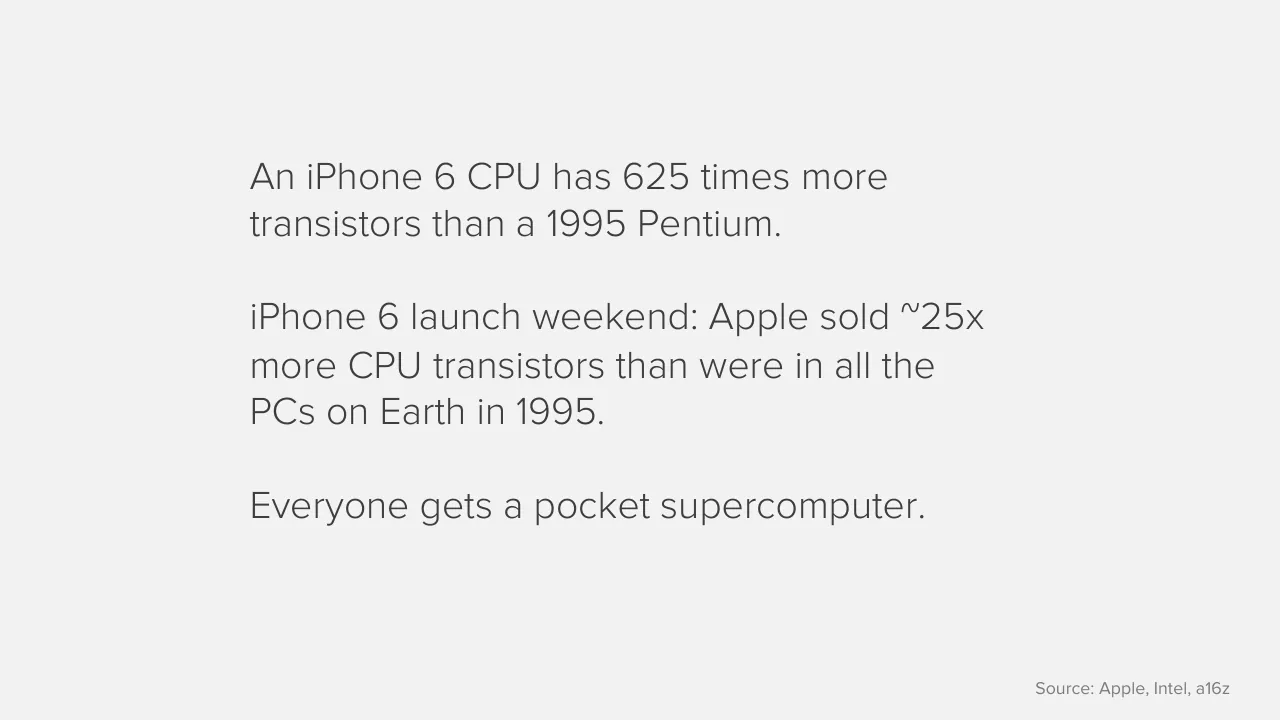
An iPhone 6 CPU has 625 times more / transistors than a 1995 Pentium. / iPhone 6 launch weekend: Apple sold ~25x / more CPU transistors than were in all the / PCs on Earth in 1995. / Everyone gets a pocket supercomputer. / Source: Apple, Intel, a16z
Slide 10
Yes, everyone
The utility of mobile increases as income falls
Sub-Saharan Africa population coverage
80%
70%
60%
50%
40%
30%
20%
10%
0%
Cellular coverage
3G coverage now
3G coverage by
2019
Improved water
Electricity
Mobile users
Source: Ericsson, McKinsey
Visuals: Bar chart, vertical bars. Chart title: 'Sub-Saharan Africa population coverage'. Value axis: 0% to 80% in 10% steps, labelled at left, unit percent of population, gridlines dotted grey at each 10% step, baseline solid grey at 0%. Category axis: six categories. No values are printed on the bars, so estimates are given. Series, left to right: Cellular coverage, about 70%, dark grey #666666. 3G coverage now, about 20%, mid grey #666666 at 67% opacity (renders as lighter grey #929292). 3G coverage by 2019, about 65%, dark grey #666666. Improved water, about 60%, dark grey #666666. Electricity, about 32%, dark grey #666666. Mobile users, about 37%, orange #CE7C3B, the only highlighted bar. No legend. Bars are flat rectangles with no outline, all of equal width about 5% of slide width, evenly spaced.
Slide 11
$35 Android takes computing everywhere / Cost of power and connectivity becomes as material as the cost of the device / Device price ($) / 800 / 700 / 600 / 500 / 400 / 300 / 200 / 100 / 0 / PC average / iPhone average / Android average / Android entry price / Source: Barclays Capital, Apple, a16z
Visuals: One vertical bar chart. Chart title: 'Device price ($)' in semibold grey text at the top left of the grey band. Y-axis: linear, unit US dollars, range 0 to 800, labelled every 100 (0, 100, 200, 300, 400, 500, 600, 700, 800), with dotted horizontal gridlines at each labelled value. X-axis: four categories, no axis title, with a solid grey baseline at 0. Series (single series, values not printed on the slide, so estimates are marked 'about'): PC average, dark grey bar, about $655; iPhone average, dark grey bar, about $685 (the tallest bar); Android average, dark grey bar, about $250; Android entry price, orange bar, about $35 (the only highlighted point, drawn in orange against the grey bars). No legend. Bars are about 6% of the slide width each with wide gaps between them. Source line: 'Source: Barclays Capital, Apple, a16z'.
Slide 12
We go from this…
Source: James Cridland (https://www.flickr.com/photos/jamescridland/612782641)
Visuals: One photograph, boxed as a full-width rectangle with no crop, rounded corners, shadow or overlay. Subject: a very large outdoor stadium concert at night, seen from an elevated viewpoint. Tens of thousands of spectators fill the tiers and floor, and many hold up illuminated mobile phones, giving scattered blue-white points of light across the crowd. The stage is at lower centre, with a bright white-lit structure and a tall lighting truss or crane rising at left-centre. A red-lit roof canopy with angled spikes runs across the top edge. Composition: wide landscape frame, crowd filling most of the area, sky a dark grey-black strip at the top. Lighting: night, artificial, mixed red stage and roof wash with cool white-blue phone lights. Dominant colours: crimson red, magenta, purple-white specks, near-black shadows. The photograph is the only visual element.
Slide 13
… To this
Source: Alan Knott-Craig
Visuals: One photograph, a landscape rectangle with sharp square corners and no border or frame. Subject: a man in a purple zip-up track jacket with orange and white trim, dark green trousers and black boots, wearing a white cap and holding a mobile phone in both hands at chest height while looking down at it. He stands beside a rendered mud house with a thatched dark-brown roof, a turquoise-painted wall and an open black doorway to his left. To his right is a sloped bank of bare orange-ochre earth with green grass above it. Lighting is hard, bright sunlight from the front left, casting a long shadow of the man onto the ground to his right and a shadow on the wall. Dominant colours are turquoise, ochre, green, purple and dark thatch brown. Framing is a wide shot with the man near the centre-right. Nothing is cropped at the edges, and there is no overlay or tint. The photo's visible area is about x 19.2, y 27.6, w 76.5, h 36.5 of the slide.
Slide 14
Mobile remakes the / tech industry
Slide 15
The smartphone industry dwarfs PCs / 4bn people buying phones every 2 years instead of 1.6bn buying PCs every 5 years / Quarterly unit shipments (m) / 400 / iOS & Android / PCs / 300 / 200 / 100 / 0 / Mar-95 Sep-96 Mar-98 Sep-99 Mar-01 Sep-02 Mar-04 Sep-05 Mar-07 Sep-08 Mar-10 / Sep-11 / Mar-13 / Sep-14 / Source: Gartner, Apple, Google, a16z
Visuals: Line chart, titled 'Quarterly unit shipments (m)'. Y axis: unit shipments in millions, linear, 0 to 400, labelled at 0, 100, 200, 300 and 400, with light dotted horizontal gridlines at each labelled value and a solid grey baseline at 0. X axis: quarterly time from Mar-95 to Sep-14, labelled every 2 years (Mar-95, Sep-96, Mar-98, Sep-99, Mar-01, Sep-02, Mar-04, Sep-05, Mar-07, Sep-08, Mar-10, Sep-11, Mar-13, Sep-14). Legend at far left, top to bottom: orange line swatch labelled 'iOS & Android'; dark grey line swatch labelled 'PCs'. Series 1, iOS & Android, orange line (#D17E3B) about 3 pt wide, starting near 0 around Mar-07 and reaching about 1 to 2 near 2007 to 2008, about 0 near Sep-08, rising to about 20 near Mar-10, about 44 near Sep-10, about 118 near Sep-11, about 138 near Dec-11, about 197 near Mar-13, about 268 near Sep-13, about 310 near Mar-14, ending at about 358 at Sep-14 (the last point, highest on the chart). Series 2, PCs, dark grey line (#666666) about 3 pt wide, starting at about 12 at Mar-95, about 18 near Sep-96, about 25 near Mar-98, about 37 near Sep-02, about 45 near Mar-04, about 62 near Mar-07, about 70 near Sep-08, about 97 near Sep-11 (peak, where it crosses the iOS & Android line), about 85 near Mar-13, ending at about 83 at Sep-14. No highlighted points or annotations. The two lines cross near Sep-11 at about 97 to 118 on the scale. No markers on the lines.
Slide 16
Phones have scale that’s unique in tech
The first tech product to be bought by almost everyone on earth, every 2-3 years
Unit sales, 2014 (bn)
2.0
1.5
1.0
0.5
0.0
Games consoles
Cameras
TVs
PCs
Smartphones
Mobile phones
Source: CIPA, Displaysearch, Gartner, companies, a16z
Visuals: Vertical bar chart titled 'Unit sales, 2014 (bn)'. Y-axis: 0.0 to 2.0 in steps of 0.5, labelled only by tick values, with no axis title beyond the chart caption. X-axis: six categories with no axis title. Series (one series, values read as estimates because no values are printed): Games consoles about 0.03 bn; Cameras about 0.06 bn; TVs about 0.25 bn; PCs about 0.31 bn; Smartphones about 1.05 bn; Mobile phones about 1.8 bn. Highlighted point: the Smartphones bar is orange (#CE7C3B) while all other bars are dark grey (#666666). Horizontal dotted gridlines in mid grey at 0.5, 1.0, 1.5 and 2.0, with a solid grey baseline at 0.0. No legend.
Slide 17
Mobile scale eats consumer electronics
Smartphones & tablets are now close to half of the consumer electronics industry
Smartphone & tablet share of global CE retail revenue
50%
40%
30%
20%
10%
0%
2008
2009
2010
2011
2012
2013
2014
Source: GfK, a16z
Visuals: One line chart. Type: line chart with a single series. Title: 'Smartphone & tablet share of global CE retail revenue' (printed above the plot). Y-axis: share of global CE retail revenue, percent, 0% to 50% in 10% steps, with dotted horizontal gridlines at each 10% step. X-axis: years 2008 to 2014, one tick per year, solid grey baseline at 0%. Series values are not printed on the slide; estimated from the line position: 2008 about 6%, 2009 about 7%, 2010 about 11%, 2011 about 22%, 2012 about 33%, 2013 about 42%, 2014 about 47%. Line is a single solid orange-brown stroke about 3 px wide, #C87A3A, with straight segments between yearly points and no markers. No legend. No highlighted points. The line ends at about 47% in 2014, just below the 50% gridline.
Slide 18
Shift away from Microsoft / Microsoft’s near-absence from mobile has ended its dominance / Microsoft share of personal computing device sales* / 100% / 75% / 50% / 25% / 0% / Mar-09 / Sep-09 / Mar-10 / Sep-10 / Mar-11 / Sep-11 / Mar-12 / Sep-12 / Mar-13 / Sep-13 / Mar-14 / Sep-14 / * Smartphones, tablets, PCs & Macs. Source: Gartner, Apple, Google, Microsoft, Nokia, Blackberry, a16z
Visuals: One line chart. Type: line chart with a single series. Chart title: 'Microsoft share of personal computing device sales*' (semibold, grey). Footnote: '* Smartphones, tablets, PCs & Macs. Source: Gartner, Apple, Google, Microsoft, Nokia, Blackberry, a16z'. Y-axis: Microsoft share, percent, range 0% to 100%, labelled at 0%, 25%, 50%, 75%, 100%, with light dotted horizontal gridlines at each labelled value. X-axis: time, semi-annual, first label Mar-09 and last label Sep-14, labels at Mar-09, Sep-09, Mar-10, Sep-10, Mar-11, Sep-11, Mar-12, Sep-12, Mar-13, Sep-13, Mar-14, Sep-14, with a solid grey baseline at 0%. The series is a single orange line (about #CD7A35), stroke about 0.5% of slide height thick, with 24 vertices and no markers. No values are printed; estimated values, marked 'about', for the labelled dates: Mar-09 about 91%, Sep-09 about 82%, Mar-10 about 82%, Sep-10 about 67%, Mar-11 about 56%, Sep-11 about 49%, Mar-12 about 34%, Sep-12 about 29%, Mar-13 about 22%, Sep-13 about 21%, Mar-14 about 18%, Sep-14 about 17%, final point about 16%. Legend: none. Highlighted points: none; the line ends at about 16% at the right edge.
Slide 19
China is the biggest smartphone market / Historic dominance starting to shift / Million people / Chinese mobile / internet users / EU population / USA population / 600 / 500 / 400 / 300 / 200 / 100 / 0 / 2007 / 2008 / 2009 / 2010 / 2011 / 2012 / 2013 / 2014 / Source: CNNIC, US Census Bureau, Eurostat
Visuals: Line chart titled by the caption 'Million people'. Y-axis: 0 to 600 in steps of 100, unit million people, dotted horizontal gridlines at each 100 step, solid grey baseline at 0. X-axis: years 2007 to 2014 with labels at each year, points plotted at roughly half-year intervals. Series 1, 'Chinese mobile internet users', orange line rising from about 50 (2007) to about 62 (2007.25), about 72 (2007.5), about 92 (2007.75), about 112 (2008), about 135 (2008.25), about 155 (2008.5), about 200 (2008.75), about 233 (2009), about 278 (2009.5), about 303 (2010), about 320 (2010.5), about 355 (2011), about 388 (2011.5), about 418 (2012), about 462 (2012.5), about 500 (2013), about 527 (2013.5) and about 556 (2014); no values are printed, all are estimates. Series 2, 'EU population', dark grey line nearly flat at about 497 in 2007, about 503 from 2008.75 to 2013, and about 507 to 2014; estimates. Series 3, 'USA population', light blue-grey line at about 302 in 2007, about 310 from 2008.75, about 315 from 2011, about 318 from 2013 and about 320 in 2014; estimates. Legend at left: three short thick line swatches with labels in the same order as the series. No highlighted points; the orange line crosses the EU line near 2013 and the USA line near 2010.5. Lines are thick (about 0.5% of slide height) with rounded joins and no markers.
Slide 20
Chinese handset players growing fast
Chinese brands are stronger than any foreign company – except Apple
What phone brands do Chinese teenagers want? (Q4 2014)
Other, 23%
iPhone, 34%
Huawei, 4%
Samsung, 8%
MEIZU, 11%
Xiaomi, 20%
Apple has 15% of the overall / market (same as global) - / but much stronger brand / appeal
New Chinese OEMs with / premium positioning are / growing fast
Source: Baidu
Visuals: Donut chart with a title 'What phone brands do Chinese teenagers want? (Q4 2014)'. Series are five segments, with values printed as labels: iPhone 34%, Xiaomi 20%, MEIZU 11%, Samsung 8%, Huawei 4%, Other 23%. The segments sum to 100%. Segments are separated by small gaps and the iPhone segment is offset slightly outward. No axes, no legend; each segment carries its label outside the ring. Segment colours clockwise from the top: iPhone dark grey #666666 (starts at top-right, spanning roughly 12 o'clock to 4 o'clock), Xiaomi orange #CE7C3B (about 4 to 6 o'clock), MEIZU pale blue-grey #C9D3E1 (about 6 to 7:30), Samsung steel blue #708CB0 (about 7:30 to 8:30), Huawei slate grey #4F6A6C (about 8:30 to 9), Other dark navy #093E58 (about 9 to 12). No segments are highlighted beyond the iPhone segment being pulled out. The ring is open-centred with no centre label.
Slide 21
Tech center of gravity moves from Seattle
and Finland (and Japan)
Old
New
Computing platform
Microsoft
Apple & Google
Chips
ARM, Qualcomm,
Mediatek
Intel
Mobile
Nokia & DoCoMo
China, San Francisco
Visuals: Table with 2 data columns (Old, New) and 3 rows (Computing platform, Chips, Mobile), plus a row-label column. Row 'Computing platform': Old = Microsoft; New = Apple & Google (cell highlighted in orange #CE7C3B, the only highlighted cell). Row 'Chips': Old = Intel; New = ARM, Qualcomm, Mediatek (wrapped over two lines as 'ARM, Qualcomm,' / 'Mediatek'). Row 'Mobile': Old = Nokia & DoCoMo; New = China, San Francisco. Cells are flat grey #A6A6A6 rectangles separated by thin white gutters of about 0.3% of slide height; the table sits on a #F2F2F2 band. No photographs, icons, or charts; no legend.
Slide 22
Mobile supply chain dominates all tech
The size of the smartphone business means it is driving into every other part of tech
Flood of smartphone / components – Lego for / technology
Augmented Reality, / Virtual Reality, / Wearables, Internet of / Things, connected cars, / connected home, / drones etc
Hardware tech for / almost anything is on / the shelf
Contract manufacturers / can assemble those / components into / anything
The challenge is vision / and route to market
Visuals: A three-stage horizontal process band made of three adjacent light grey panels separated by two chevron-shaped dashed borders. The left panel has an orange dashed outline (about #C87A3C) on its top, left and right-chevron edges; the boundary between the middle and right panels and the top and bottom edges of the middle and right panels use a slate grey dashed line (about #5A6670). The chevron points are at about 35.7% and 73% of slide width, pointing right. No photographs, icons, logos or charts are present.
Slide 23
Mobile remakes the / internet
Slide 24
The growth of post-PC devices
Smartphones and tablets taking half of browsing and a third of purchasing
Mobile share of 'Black Friday' ecommerce
60%
Traffic
Value
50%
40%
30%
20%
10%
0%
2012
2013
2014
Source: IBM, a16z
Visuals: Chart: grouped column chart titled 'Mobile share of 'Black Friday' ecommerce'. Y-axis: share of ecommerce, percent, range 0% to 60% in 10% steps, labels 0%, 10%, 20%, 30%, 40%, 50%, 60%. X-axis: years 2012, 2013, 2014 as categories. Series 1 'Traffic' in dark grey #666666: about 24% (2012), about 39% (2013), about 49% (2014). Series 2 'Value' in orange #CE7C3B: about 15% (2012), about 22% (2013), about 28% (2014). No data labels are printed, so all bar values are estimates marked 'about'. Legend at left: square swatch #666666 labelled Traffic above square swatch #CE7C3B labelled Value. No highlighted points. Gridlines are dotted mid-grey lines at each 10% step; the 0% baseline is a solid grey line.
Slide 25
‘Mobile’ doesn’t really mean mobile
Mobile devices are used everywhere, not just when people are ‘mobile’
Where do you use the internet on your phone? (UK, Q1 2014)
Both at home and outside
66%
Mainly at home
16%
Only at home
8%
Only out of home
1%
Mainly out of home
9%
Source: Ofcom
Visuals: One donut chart with no axes or legend. Chart title: 'Where do you use the internet on your phone? (UK, Q1 2014)'. Segments, clockwise from the top: 'Both at home and outside' 66% in pale blue-grey #C9D3E1, large and unexploded, running from about 12 o'clock round the left side to about 6 o'clock; 'Mainly at home' 16% in orange #CE7C3B, from about 6 o'clock to about 4 o'clock, pulled slightly outward; 'Only at home' 8% in dark grey #666666, pulled outward; 'Only out of home' 1% in near-black #1E1E1E, a very thin exploded sliver (colour about, not printed); 'Mainly out of home' 9% in slate teal #50676E, pulled outward at about 1 o'clock. The gaps between the exploded segments are about 1 percent of the slide width. Every segment has its label and percentage printed beside it, so no legend is used. No axes, gridlines or highlighted points.
Slide 26
For 20 years, ‘internet’ meant web browsers, / mouse and keyboard. Mobile ended that.
Half of all time spent online in the USA is in / smartphone apps.
Post-Netscape, post-PageRank.
Slide 27
Interaction models are totally unsettled
Rapid innovation and change continues
“Android”? Chrome, Xiaomi…
“I installed an app on my Android
smartphone ”
“Installed” an “app”? Web apps,
APIs, push notifications, messaging,
Google Now…
“Smartphone?” Watches,
Glass, wearables, TV,
tablets…
Visuals: None photographic. Four outlined rectangles (no fill, thin dark grey stroke, about 1 px) sit behind the words 'installed', 'app', 'Android' and 'smartphone' in the pull-quote line, boxing each word tightly with its box edges touching the adjacent box at 'Android' and 'smartphone'. No charts, tables, icons or images.
Slide 28
Platforms are more complex / Ecosystem dynamics depend on where you are and what you’re doing / Mobile platform share, Q4 2014 / 100% / Android / iOS / 75% / 50% / 25% / 0% / Phone unit sales / Global Browsing / Delhi FB users / SF FB users / App store revenue / Source: Facebook, Apple, Google, Gartner, Akamai, a16z
Visuals: Stacked column chart, titled 'Mobile platform share, Q4 2014'. Y-axis: 0% to 100% in 25% steps, with light dotted horizontal gridlines at 25%, 50%, 75% and 100%. X-axis categories: Phone unit sales, Global Browsing, Delhi FB users, SF FB users, App store revenue. Series: iOS (dark grey #666666, bottom segment) and Android (orange #CE7C3B, top segment). Values are not printed; estimated from bar heights: Phone unit sales iOS about 10%, Android about 50% (total about 60%); Global Browsing iOS about 50%, Android about 40% (total about 90%); Delhi FB users iOS about 7%, Android about 62% (total about 69%); SF FB users iOS about 58%, Android about 33% (total about 91%); App store revenue iOS about 67%, Android about 33% (total 100%). Legend at top left: orange square labelled Android above dark grey square labelled iOS. No highlighted points. Bars are evenly spaced, roughly 120 px wide each at slide width 2000 px. Baseline is a solid grey axis line at 0%.
Slide 29
Phones are more sophisticated than PCs
Proliferation of sensors creates far more capability and sophistication than PCs
A computer shouldn’t ask anything that it should know
Sensors profoundly change what a computer can know
Every new sensor creates a new business
Visuals: Three filled circles connected left to right by two solid block arrows. Circle 1: dark charcoal #3F3F3F, about 20.4% wide by 36.2% tall, at x 19.1%, y 40.5%, containing centred white text 'A computer / shouldn’t ask / anything that / it should / know'. Arrow 1: right-pointing solid block arrow, fill #3F3F3F, at x 41.6%, y 54.0%, about 4.5% by 9.3%, pointing from circle 1 to circle 2. Circle 2: burnt orange #CE7B3B, about 20.4% by 36.2%, at x 47.9%, y 40.5%, containing centred white text 'Sensors / profoundly / change what / a computer / can know'. Arrow 2: right-pointing solid block arrow, fill #CE7B3B, at x 70.4%, y 54.0%, about 4.5% by 9.3%, pointing from circle 2 to circle 3. Circle 3: mid grey #7F7F7F, about 20.4% by 36.2%, at x 76.7%, y 40.5%, containing centred white text 'Every new / sensor / creates a / new / business'. No photographs, logos, icons or charts.
Slide 30
Mobile’s multiplier effect
Increased sophistication from mobile is as important as the increase in scale
2-3x more
smartphones
than PCs by
2020
x
Personal
Taken everywhere
Frictionless access
Sensors, cameras
Location
Payment
Social platform
Much easier to use
=
Vastly bigger
opportunity
Visuals: One orange filled circle (#CE7C3B), centred at about x 86%, y 64%, diameter about 20% of slide width, with the text 'Vastly bigger / opportunity' centred in white. Two operator glyphs, a large 'x' and a large '=' in dark grey #3F3F3F, sit between the text blocks. No charts, photographs or logos.
Slide 31
Facebook’s mobile ad explosion / Mobile ads are now 68% of revenue and brought in $7.4bn in 2014 / Facebook revenue by source ($bn) / 4 / Mobile ads / Payments & Other / 3 / Desktop ads / 2 / 1 / 0 / Jun-11 Sep-11 Dec-11 Mar-12 Jun-12 Sep-12 Dec-12 Mar-13 Jun-13 Sep-13 Dec-13 Mar-14 Jun-14 Sep-14 Dec-14 Mar-15 / Source: Facebook, a16z
Visuals: Stacked area chart titled 'Facebook revenue by source ($bn)'. Y-axis: $bn from 0 to 4, gridlines dotted at 1, 2, 3, 4, labels 0 to 4 at left of plot. X-axis: quarterly time points from Jun-11 to Mar-15 (16 points, labels every quarter shown as Jun-11, Sep-11, Dec-11, Mar-12, Jun-12, Sep-12, Dec-12, Mar-13, Jun-13, Sep-13, Dec-13, Mar-14, Jun-14, Sep-14, Dec-14, Mar-15). Three stacked series from bottom to top: Desktop ads (dark grey #666666, about 0.78 at Jun-11, about 0.93 at Sep-12, about 0.88 at Mar-13, about 1.08 at Dec-13, about 1.00 at Jun-14, about 1.11 at Dec-14, about 0.88 at Mar-15); Payments & Other (light blue-grey #C9D3E1, thin band about 0.1 to 0.2 thick throughout); Mobile ads (orange #CE7C3B, about 0 at Jun-11 rising to about 1.25 at Sep-12, about 2.0 at Sep-13, about 2.57 at Dec-13, about 2.9 at Jun-14, about 3.83 at Dec-14, about 3.53 at Mar-15 as top of stack). Legend at left, top to bottom: Mobile ads (orange square), Payments & Other (light blue-grey square), Desktop ads (dark grey square). No highlighted points.
Slide 32
Global SMS: 20bn messages a day.
WhatsApp: 30bn messages a day.
(with just 40 engineers)
Source: GSMA, WhatsApp
Slide 33
Fundamental change in opportunity / Mobile leverage plus collapse of development costs / 2000 / 100 staff / 1m users / $10m raised / Today / 10 staff / 10m users / $1m raised / ? / 1 engineer / 1m users / $0 raised
Visuals: Three filled circles of equal size (about 20.4% of slide width, 35.2% of slide height each) arranged left to right, each containing four centred white lines of text: first circle dark charcoal #3F3F3F reading 2000 / 100 staff / 1m users / $10m raised; second circle orange #CE7B3B reading Today / 10 staff / 10m users / $1m raised; third circle mid grey #7F7F7F reading ? / 1 engineer / 1m users / $0 raised. Between circles are two solid right-pointing block arrows (chevron-tipped block arrows, about 4.5% wide by 9.3% tall): the first is #3F3F3F and sits between the charcoal and orange circles; the second is #CE7B3B and sits between the orange and grey circles. Arrows are vertically centred on the circles and have no outline or shadow. No photographs, logos or charts.
Slide 34
Mobile dominates / our attention
Slide 35
Screens dominate our lives
More than half our time awake is spend on media and communications
100%
90%
80%
70%
60%
50%
40%
30%
20%
10%
0%
Other activities
(Time awake but not undertaking
media/ comms activities)
Any media and communications activity
Sleep
06:00 06:23 06:46 07:09 07:32 07:55 08:18 08:41 09:04 09:27 09:50 10:13 10:36 10:59 11:22 11:45 12:08 12:31 12:54 13:17 13:40 14:03 14:26 14:49 15:12 15:35 15:58 16:21 16:44 17:07 17:30 17:53 18:16 18:39 19:02 19:25 19:48 20:11 20:34 20:57 21:20 21:43 22:06 22:29 22:52 23:15 23:38 00:01 00:24 00:47 01:10 01:33 01:56 02:19 02:42 03:05 03:28 03:51 04:14 04:37 05:00 05:23 05:46
Breakfast time
6:00am to
8.59am
Day time
9:00am to
5.30pm
Peak
5:30pm to
10.59pm
Post peak
11:00pm to
12.29am
Night time
12:30pm to
5.59am
Source: Ofcom
Visuals: Chart: 100% stacked area chart, untitled, showing the share of time awake spent on activities across the day. Y axis: 0% to 100% in 10% steps, labelled on the left. X axis: clock time from 06:00 to 05:46 in 23-minute steps, tick labels printed vertically in small bold purple text. Series (bottom to top): 'Any media and communications activity' in dark purple #652266, rising from about 4% at 06:00 to about 40% by 08:00, about 43-45% through the daytime, peaking at about 73% around 21:20, then falling to about 50% at 22:52, about 33% at 23:15 and under 5% by about 01:30; 'Other activities (Time awake but not undertaking media/ comms activities)' in lime green #A4CE3A, the band above the purple; 'Sleep' in light grey #E8E8E8, the top band at the start and end of the day, reaching about 93% at 06:00 and falling to about 50% by 08:41, with the sleep share rising again after about 22:00 to near 100% by 02:00 and about 94% at 05:46. No printed numeric values other than axis ticks; the values above are estimates. Four thin pale lavender vertical divider lines (#D9B8E0, about 1 px) run from the top to the baseline at about 08:41, 17:30, 22:52 and 00:24. Band labels beneath the axis: Breakfast time (6:00am to 8.59am) spanning the first divider, Day time (9:00am to 5.30pm), Peak (5:30pm to 10.59pm), Post peak (11:00pm to 12.29am), Night time (12:30pm to 5.59am), in bold purple titles with regular purple times. No legend; labels are placed directly on the areas. No highlighted points.
Slide 36
Glass is eating the world / Close to a square foot of screen sold for every adult on earth / Global LCD screen sales (bn square feet) / 5 / 4 / 3 / 2 / 1 / 0 / 2000 / 2001 / 2002 / 2003 / 2004 / 2005 / 2006 / 2007 / 2008 / 2009 / 2010 / 2011 / 2012 / 2013 / 2014 / 2015e / Source: Corning
Visuals: One line chart. Chart title: Global LCD screen sales (bn square feet). Type: single-series line chart with straight segments and a slightly rounded look at the joints. Y axis: linear, labelled 0 to 5 at intervals of 1, unit bn square feet, gridlines dotted grey at 1, 2, 3, 4 and 5, with a solid grey baseline at 0. X axis: years 2000 to 2015e, the last point marked as an estimate by the suffix e. Series (values about, as the slide prints no data labels): 2000 about 0.1; 2001 about 0.13; 2002 about 0.2; 2003 about 0.3; 2004 about 0.5; 2005 about 0.8; 2006 about 1.2; 2007 about 1.6; 2008 about 1.9; 2009 about 2.3; 2010 about 2.9; 2011 about 3.25; 2012 about 3.5; 2013 about 3.85; 2014 about 4.4; 2015e about 4.8. Line is a thick (about 0.5% of slide height) burnt-orange stroke, colour about #C97A3A, with no markers, no data labels and no highlighted points. No legend.
Slide 37
TV sets are in the minority / Computing devices used for video now far outnumber actual ‘televisions’ / Global install base of video players, 2014 / TVs / 24% / PCs & Macs / 30% / WP/RIM / 1% / iOS / 13% / Google Android / 23% / Chinese Android / 9% / “By the summer of 2012, / the majority of the / televisions you see in / stores will have Google / TV embedded” / - Eric Schmidt / Source: Apple, Google, Nokia, Blackberry, Displaysearch, a16z
Visuals: Donut chart titled 'Global install base of video players, 2014', semibold grey text above the ring. Five-plus segments with labelled values, clockwise from top: TVs 24% (dark grey #666666, slightly offset/exploded outward at top), iOS 13% (orange #CE7C3B, exploded slightly), Google Android 23% (pale blue-grey #C9D3E1), Chinese Android 9% (slate #50676E), WP/RIM 1% (near-black #222222, thin sliver), PCs & Macs 30% (dark teal-navy #093E58, starts at top after the gap and runs counter-clockwise). Labels sit outside the ring with thin leader lines connecting to each segment, except Google Android and its 23% label which sit inside the ring's lower opening. No axes, no legend, no highlighted points beyond the exploded segments. Ring thickness is about one-quarter of the outer radius; a small gap separates TVs from iOS and PCs from TVs. No photograph or logo.
Slide 38
What would children miss the most? Mobile
Mobile dwarfs legacy media platforms
'Media you would miss most', UK aged 11-15, 2014
100%
Other
TV set
Games console
75%
PC
Mobile & tablet
50%
25%
0%
Boys
Girls
Source: Ofcom
Visuals: Chart: 100% stacked column chart titled 'Media you would miss most', UK aged 11-15, 2014. Two columns, Boys (left, x about 31-46%) and Girls (right, x about 69-84%). Y-axis runs 0% to 100% in 25% steps, labelled 0%, 25%, 50%, 75%, 100%, with light dotted horizontal gridlines at each step. X-axis categories: Boys, Girls. Series, stacked bottom to top: Mobile & tablet (#CE7C3B orange), PC (#666666 grey), Games console (#3F3F3F near-black), TV set (#C9D3E1 pale blue-grey), Other (#50676E dark slate teal). No data values are printed on the chart, so the values are estimates: Boys is about 38% Mobile & tablet, about 18% PC, about 21% Games console, about 18% TV set, about 5% Other. Girls is about 64% Mobile & tablet, about 10% PC, about 3% Games console, about 18% TV set, about 5% Other. Legend at the left, listed top to bottom: Other, TV set, Games console, PC, Mobile & tablet, each with a small coloured square of the series colour. No highlighted points. Flat fills, no shadows or gradients.
Slide 39
Comms are going pure digital, pure mobile
Email is for grandparents
Share of communication activity, UK, 2014
100%
Photo messages
Messaging apps
Social networks
75%
Phone calls
50%
25%
0%
Adults
11 to 15
Source: Ofcom
Visuals: A stacked column chart titled 'Share of communication activity, UK, 2014'. Y axis: percent of communication activity, 0% to 100%, gridlines at 0%, 25%, 50%, 75% and 100%, shown as dotted grey lines. X axis: two categories, 'Adults' and '11 to 15'. Series, bottom to top: Email (orange #CE7C3B), Phone calls (dark grey #666666), Social networks (light blue-grey #AEBED2), Messaging apps (slate #50676E), Photo messages (navy #093E58). No data labels are printed; values are estimates. Adults: Email about 33%, Phone calls about 20%, Social networks about 18%, Messaging apps about 26%, Photo messages about 3%. 11 to 15: Email about 2%, Phone calls about 3%, Social networks about 37%, Messaging apps about 48%, Photo messages about 10%. Legend at the left, listed top to bottom: Photo messages, Messaging apps, Social networks, Phone calls, Email, each with a small square swatch in the series colour. No highlighted points. Bars are flat-filled with no outlines, roughly 15% of slide width each, and the category axis line is mid-grey.
Slide 40
1999 – 80bn consumer photos taken on film. / 2014 – 800bn photos shared on social networks. / More iPhones & Android phones sold than Japanese cameras ever. / More photos taken this year than taken on film ever. / Source: Kodak, Companies, CIPA, a16z
Slide 41
Digital gives and it takes away
Digital’s convenience led to a surge in camera sales, but then smartphones took over
Japanese camera unit sales (m)
Film
120
Digital, DSLR
100
etc
Digital, Fixed
lens
80
60
40
20
0
1951 1953 1955 1957 1959 1961 1963 1965 1967 1969 1971 1973 1975 1977 1979 1981 1983 1985 1987 1989 1991 1993 1995 1997 1999 2001 2003 2005 2007 2009 2011 2013
Source: CIPA, a16z
Visuals: Line chart titled 'Japanese camera unit sales (m)'. Y-axis: unit sales in millions, linear scale 0 to 120, labelled at 0, 20, 40, 60, 80, 100, 120, with dotted grey horizontal gridlines at each label. X-axis: years 1951 to 2013 labelled every two years, rotated vertically, with a solid grey baseline at 0. Three series: Film (orange #C87A3A line), Digital, DSLR etc (dark grey #666666 line), and Digital, Fixed lens (light blue-grey #A9B8CC line). Film: about 0.3 in 1951, about 7 in 1976, about 17 around 1981, peak about 37 in 1997, falling to about 10 in 2005 and about 0 by 2008 where the line ends. Digital, DSLR etc: starts about 0 in 2002, about 2 in 2004, about 10 in 2007, peaks about 21 in 2011, and falls to about 13 in 2014. Digital, Fixed lens: starts about 0 in 1998, about 14 in 2002, about 57 in 2004, about 61 in 2005, about 74 in 2006, peaks about 110 in 2008, dips to about 96 in 2009, about 108 in 2010, about 99 in 2011, and falls to about 46 in 2013 and about 30 in 2014. Legend: vertical list at left with line swatches and labels in the order Film, Digital DSLR etc, Digital Fixed lens. No values are printed on the chart, so all values are estimates.
Slide 42
Tech outgrows tech
Slide 43
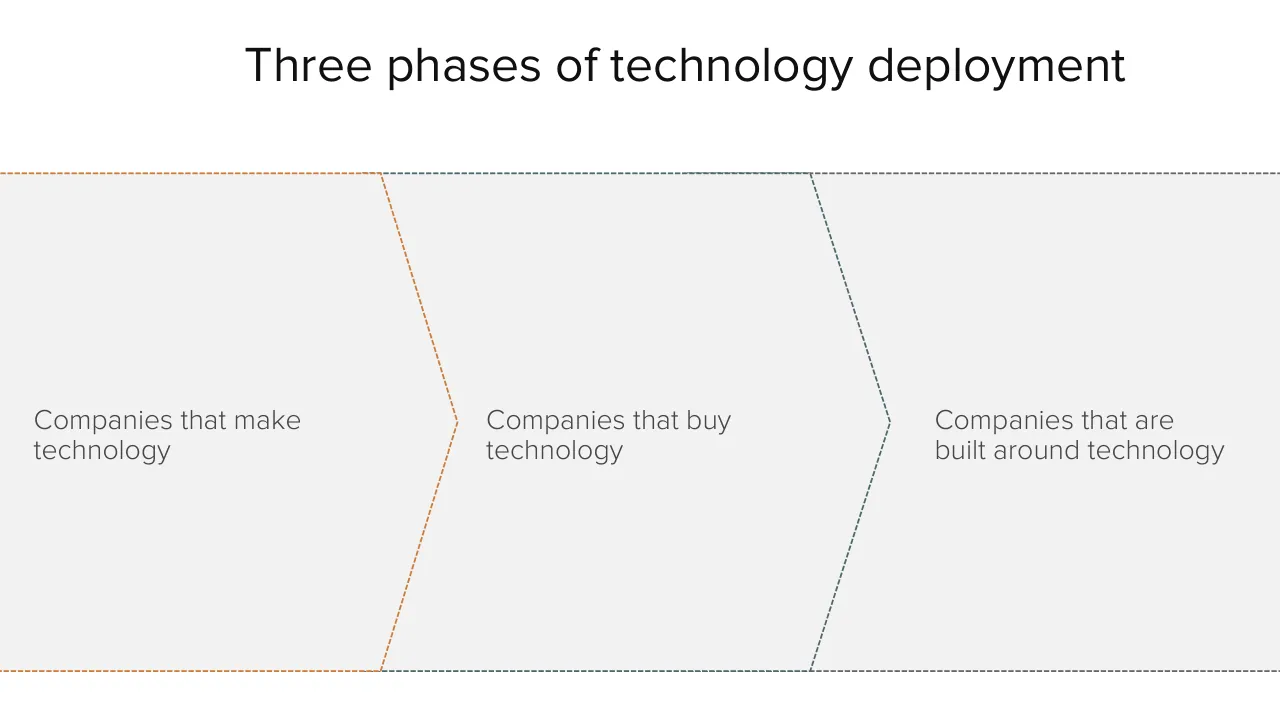
Three phases of technology deployment
Companies that make / technology
Companies that buy / technology
Companies that are / built around technology
Visuals: Three adjacent chevron/arrow-shaped panels drawn with dashed outlines, pointing right, arranged left to right as a process sequence: panel 1 (orange dashed outline) contains 'Companies that make technology'; panel 2 (slate grey dashed outline) contains 'Companies that buy technology'; panel 3 (slate grey dashed outline, extending to the right slide edge) contains 'Companies that are built around technology'. Each chevron's point nests into the notch of the next panel. No photographs, charts, icons or logos.
Slide 44
Companies that buy technology
Tech has become part of every office
Like plants, tech is part of facilities
But is the business built around it?
Visuals: One photograph of a potted plant: a dracaena-type houseplant with long, upright, strap-like green leaves with pale cream/white longitudinal striping and some yellow-tipped leaf edges, growing from a terracotta-orange plastic nursery pot with a rolled rim and small dark drainage feet. The plant is shot straight-on against a pure white background, so it appears cut out with no visible background. Composition is centred on the pot, full plant visible from the pot base to the top leaves, lit evenly with soft light and no visible shadow. Dominant colours: several greens (#2E6B2F to #7FA86A), terracotta orange (#B5543A) for the pot. The image is not cropped, not full-bleed, and has no overlay or tint; it sits unboxed on the white slide.
Slide 45
Building companies around new technology
The really important new businesses are native to new technologies
Trucks &
highways
Trucks &
highways
Web &
Smartphones
Smartphones
McDonald’s
Wal-Mart
Airbnb
Uber / Lyft
Food
Retail
Travel
Transport
Visuals: A row of four adjacent rectangular tiles forming a diagram-like comparison table. Each tile is a flat solid block with no shadow, no rounded corners and no outline. Thin white gaps (about 0.1% of slide width) separate neighbouring tiles. Tile 1 is grey #7F7F7F and labelled McDonald’s, under the header Trucks & highways and above the category Food. Tile 2 is grey #7F7F7F and labelled Wal-Mart, under the header Trucks & highways and above the category Retail. Tile 3 is orange #CE7C3B and labelled Airbnb, under the header Web & Smartphones and above the category Travel. Tile 4 is orange #CE7C3B and labelled Uber / Lyft, under the header Smartphones and above the category Transport. The grey tiles are the older-company group and the orange tiles are the new-technology group; the slide itself does not label these groups. No photographs, icons or logos are shown. Colours are flat, with no gradient or tint.
Slide 46
Amazon: a retailer built around tech
Amazon is building the Sears Roebuck of the 21st Century – not a tech company
Amazon since launch ($bn)
100
Revenue
Net income
80
60
40
20
0
1995 1996 1997 1998 1999 2000 2001 2002 2003 2004 2005 2006 2007 2008 2009 2010 2011 2012 2013 2014
-20
Source: Amazon
Visuals: Line chart titled 'Amazon since launch ($bn)'. Y-axis in $bn, labelled 100, 80, 60, 40, 20, 0 and -20, with dotted horizontal gridlines at each label and a solid grey zero line. X-axis shows years 1995 to 2014, one label per year. Two series: Revenue (dark grey #3F3F3F, thick line) rises from about 0 in 1995-1997 to about 1 in 1999, about 3 in 2001, about 5 in 2003, about 8 in 2005, about 11 in 2006, about 15 in 2007, about 19 in 2008, about 25 in 2009, about 34 in 2010, about 48 in 2011, about 61 in 2012, about 75 in 2013 and about 89 in 2014 (no values are printed; all are estimates). Net income (orange #CC7A3A, thick line) is about 0 in 1995-1998, about -1.5 in 2000, about 0 in 2002-2003, about 0.5 in 2004, about 0 in 2005-2006, about 0.5 in 2007-2009, about 1 in 2010, about 0.5 in 2011, about 0 in 2012-2013 and about -0.7 in 2014 (estimates). Legend at left: Revenue (dark grey line) above Net income (orange line). No highlighted points.
Slide 47
And Amazon is only 1.5% of the way
Amazon still only has 1.5% of US retail revenue
Amazon North America ecommerce as % US retail*
2.0%
1.8%
1.6%
1.4%
1.2%
1.0%
0.8%
0.6%
0.4%
0.2%
0.0%
2003
2004
2005
2006
2007
2008
2009
2010
2011
2012
2013
2014
* Excludes automobiles & parts, gasoline and food service. Source: BLS, Amazon, a16z
Visuals: Line chart titled 'Amazon North America ecommerce as % US retail*'. Type: single-series line chart with a smooth-looking straight-segment line in orange-brown (#C87A3A approx.) about 0.4% of slide width thick, no markers. Y-axis: percent of US retail, range 0.0% to 2.0% with labelled gridlines every 0.2% (0.0%, 0.2%, 0.4%, 0.6%, 0.8%, 1.0%, 1.2%, 1.4%, 1.6%, 1.8%, 2.0%); horizontal gridlines are dotted grey. X-axis: years 2003 to 2014, one label per year, no axis title, baseline is a solid grey line. Series values are not printed; estimated values (about): 2003 about 0.15%, 2004 about 0.17%, 2005 about 0.19%, 2006 about 0.22%, 2007 about 0.29%, 2008 about 0.37%, 2009 about 0.48%, 2010 about 0.68%, 2011 about 0.91%, 2012 about 1.12%, 2013 about 1.35%, 2014 about 1.61%. No legend. No highlighted points; the line ends at the 2014 point, the highest value shown.
Slide 48
Amazon versus Wal-Mart / (Why would you stop to take profits?) / Quarterly revenue ($bn) / 140 / Amazon / Wal-Mart / 120 / 100 / 80 / 60 / 40 / 20 / 0 / 1989 / 1991 / 1993 / 1995 / 1997 / 1999 / 2001 / 2003 / 2005 / 2007 / 2009 / 2011 / 2013 / Source: Bloomberg
Visuals: One line chart titled Quarterly revenue ($bn), with a legend at left listing Amazon in orange and Wal-Mart in dark grey. Y axis: revenue in $bn, linear, range 0 to 140, gridlines and labels every 20 (0, 20, 40, 60, 80, 100, 120, 140), drawn as dotted grey horizontal lines. X axis: calendar years labelled every two years from 1989 to 2013 (1989, 1991, 1993, 1995, 1997, 1999, 2001, 2003, 2005, 2007, 2009, 2011, 2013), with the series running on to about 2014 at the right edge. Series Wal-Mart (dark grey line, about 2.5 px stroke): starts about 5 in 1989, rises slowly to about 20 by 1995, about 40 by 1999, about 60 by 2002, about 80 by 2005, about 100 by 2007, and ends about 131 at the right edge, with a zig-zag pattern of quarterly peaks and dips, the largest peaks about 120 to 128 in 2012 to 2014. Series Amazon (orange line, about 2.5 px stroke): about 0 from 1997 to 1999, about 1 to 2 from 2000 to 2003, about 2 to 4 through 2004 to 2008, about 5 to 10 in 2009 to 2010, about 14 in 2011, about 17 to 21 in 2012 to 2013, rising to about 25 in 2014 and ending about 29 at the right edge. Individual values are not printed, so these are estimates. No points are highlighted. A horizontal solid grey baseline runs along 0 across the plot.
Slide 49
Mobile scale allows far more Amazons
Most tech is bought and paid for,
not used to create new businesses
10 years ago, AirBnB would have
sold software to Hilton
Uber would have sold software to
taxi companies
Scale of mobile, software mean the
opportunity is vastly bigger
More and more companies
following Amazon, Uber, AirBnB to
disrupt existing industries with tech
Visuals: No photographs, charts, icons or logos. The only visual is a pale grey chevron-shaped band (#F2F2F2) with dashed outlines. Its top and bottom edges run horizontally from the left and right edges of the slide and meet a central point at about 55% x and 59% y. The left portion of the outline is dashed in burnt orange (#C87A3E) and the right portion in slate grey (#6B6F76), with dashes of about 1 pt and an even gap. The diagonal notch edges run from about (49%, 24%) to (55%, 59%) to (49%, 93%) and are dashed orange.
Slide 50
When tech is fully adopted, it disappears
Frequency of ‘Railways’ in Google Books
1800 1810 1820 1830 1840 1850 1860 1870 1880 1890 1900 1910 1920 1930 1940 1950 1960 1970 1980 1990 2000
Source: Google
Visuals: Line chart, untitled apart from the panel heading 'Frequency of ‘Railways’ in Google Books'. Y-axis: no tick labels, no axis title, no units; values are unlabelled, so relative heights are estimates only. X-axis: years 1800 to about 2008, labelled every 10 years from 1800 to 2000, no axis title. Single series, a continuous orange line (about 0.4% of slide height thick) with no markers, labelled with no series name and no legend. Gridlines: six horizontal dotted grey lines at equal intervals, with a solid grey baseline at the bottom. Estimated shape: near zero from 1800 to about 1825; slow rise to about 1.5 grid intervals by 1845; a spike to about 2.4 intervals around 1850; a dip near 1855; about 3.2 intervals by 1880; a secondary peak of about 3.7 intervals around 1890; a dip near 1895; a steep climb to the main peak of about 4.6 intervals around 1915; a decline to about 3.0 intervals around 1930; a plateau near 2.6 intervals from 1950 to 1965; a steady fall to about 1.2 intervals by 1990; a flattening near 0.9 intervals from 2000 to 2008 with a small uptick at the end. No highlighted or annotated points.
Slide 51
Steel
Frequency of ‘Steel’ in Google Books
1800 1810 1820 1830 1840 1850 1860 1870 1880 1890 1900 1910 1920 1930 1940 1950 1960 1970 1980 1990 2000
Source: Google
Visuals: One line chart. Type: line chart. Title: 'Frequency of ‘Steel’ in Google Books', printed above the plot. X axis: years 1800 to about 2008, labelled every 10 years from 1800 to 2000, unit years. Y axis: no axis labels, unit unstated, values not printed; relative frequency only. Series: one series, a single orange line about 4 px thick in #D07A35, drawn as a monthly-resolution curve. Approximate shape: about 1800 to 1840 low and nearly flat; rising from about 1850; a sharp climb from about 1895; first peak about 1918 to 1920; dip to a trough about 1932; second, higher peak about 1943 to 1944 (highest point on the chart); decline through the 1950s; a shoulder around 1970 to 1985; then a steady fall to a low at about 2008. Values are not printed, so the peak and trough values are estimates only: the 1944 peak is about the top of the plot and the 1800 start is about one-tenth of that height. Gridlines: horizontal dotted grey lines, about 10 of them, evenly spaced, with no labels. Baseline: solid mid-grey horizontal axis line at the bottom of the plot. No legend. No highlighted points.
Slide 52
Computerization / Frequency of ‘Computerization’ in Google Books / 1800 1810 1820 1830 1840 1850 1860 1870 1880 1890 1900 1910 1920 1930 1940 1950 1960 1970 1980 1990 2000 / Source: Google
Visuals: One line chart. Type: line chart with a single series. Title: ‘Frequency of ‘Computerization’ in Google Books’ shown above the plot, bold grey. X-axis: years from 1800 to about 2008, labelled every 10 years from 1800 to 2000 (1800, 1810, …, 2000), no unit printed. Y-axis: no axis labels, tick values or units printed; gridlines are unlabelled. Gridlines: about ten evenly spaced horizontal dotted grey lines across the plot, with a solid grey baseline at zero. Series: one orange line, about 3 px thick. Values are not printed, so estimates are marked: about 0 from 1800 to about 1955; a small bump around 1945 to 1950; a rise starting about 1958; steep climb from about 1963; about 35% of plot height around 1971; a dip and second rise to about 60% around 1976 to 1980; peak of about 95% of plot height near 1988 to 1989, the highest point on the chart; decline to about 45% by 1995; about 30% by 2000; about 20% by 2008, where the line ends. Legend: none. Highlighted points: the peak around 1989 is the highest point on the line; no markers or annotations.
Slide 53
Software / Software is changing the world just as much / Frequency of ‘Software’ in Google Books / 1800 1810 1820 1830 1840 1850 1860 1870 1880 1890 1900 1910 1920 1930 1940 1950 1960 1970 1980 1990 2000 / Source: Google
Visuals: One line chart. Type: time-series line chart. Title: 'Frequency of ‘Software’ in Google Books' (printed above the plot). Horizontal axis: years from 1800 to about 2008, labelled every 10 years from 1800 to 2000, no unit printed. Vertical axis: no axis title, no unit, no tick labels or numeric range printed; values are not printed, so relative values are about estimates: the series is about 0 from 1800 to about 1960, begins rising about 1963, climbs gradually to about 1975, steepens sharply between about 1977 and 1985, continues rising to about 1990, and reaches a peak of about 100% of the plotted maximum around 2002 to 2004 before falling to about 80% of the maximum by about 2008. Series: one series, orange line about 4 px thick, labelled with no legend. Highlighted points: none. Gridlines: seven dotted grey horizontal gridlines at equal spacing above a solid grey baseline at zero. No legend. No photographs, icons or logos.
Slide 54
Software is eating / the world / Tech is outgrowing / the tech industry
Download this deck
The hosted PDF of every library deck is free for readers of the SlideDeck Co newsletter. Join with your email and the viewer and download appear here.
Building a deck of your own? The SlideDeck Co Standard Deck is a slide library for business presentations: reviews, updates and plans.







