

The deck opens with a forward-looking statements disclaimer, then moves to Tesla's mission of sustainable energy for all, framed by a comparison of the current fossil-fuel-heavy energy economy with a sustainable one. It then sets out a five-part plan to repower the grid, switch to electric vehicles, adopt heat pumps, electrify high-temperature heat and hydrogen, and fuel planes and boats, with investment and deployment figures for each step. Resource availability and mineral extraction follow. The middle sections cover vehicle design and manufacturing, powertrain, electronic architecture, software, full self-driving, charging, supply chain, factories, energy storage, impact and financials, with a capital allocation framework. The deck closes with a summary of the master plan goals, a Gigafactory Mexico slide and Q&A. Key slides include the 2050 sustainability investment stack, the Model 3 to next-generation vehicle manufacturing comparison, and the heat pump efficiency chart. Slides use large numbers and short headline-style titles, with charts that carry the argument.
Slides worth studying
Questions about this deck
How many slides does Tesla's Investor Day deck have?
The Tesla deck has 169 pages. Slide 1 is titled INVESTOR DAY, and slide 2 is a forward-looking statements disclaimer.
What does Tesla's deck say about the investment needed to repower the grid with renewables?
Slide 11, titled 1. Repower the Existing Grid With Renewables, lists a 35% Reduction In Fossil Fuel Use, 24TWh Stationary Storage, 10TW Solar + Wind, and $0.8T Manufacturing Investment.
What efficiency gains does Tesla's deck give for next generation vehicle manufacturing?
Slide 47, titled Next Generation Vehicle Manufacturing Efficiencies, shows a >40% Reduction In Manufacturing Footprint and a 50% Reduction in Cost. Slide 43 separately gives a 44% Operator Density Improvement and a 30% Space Time Efficiency Improvement for the Next Generation Vehicle.
How does Tesla's deck present heat pump efficiency?
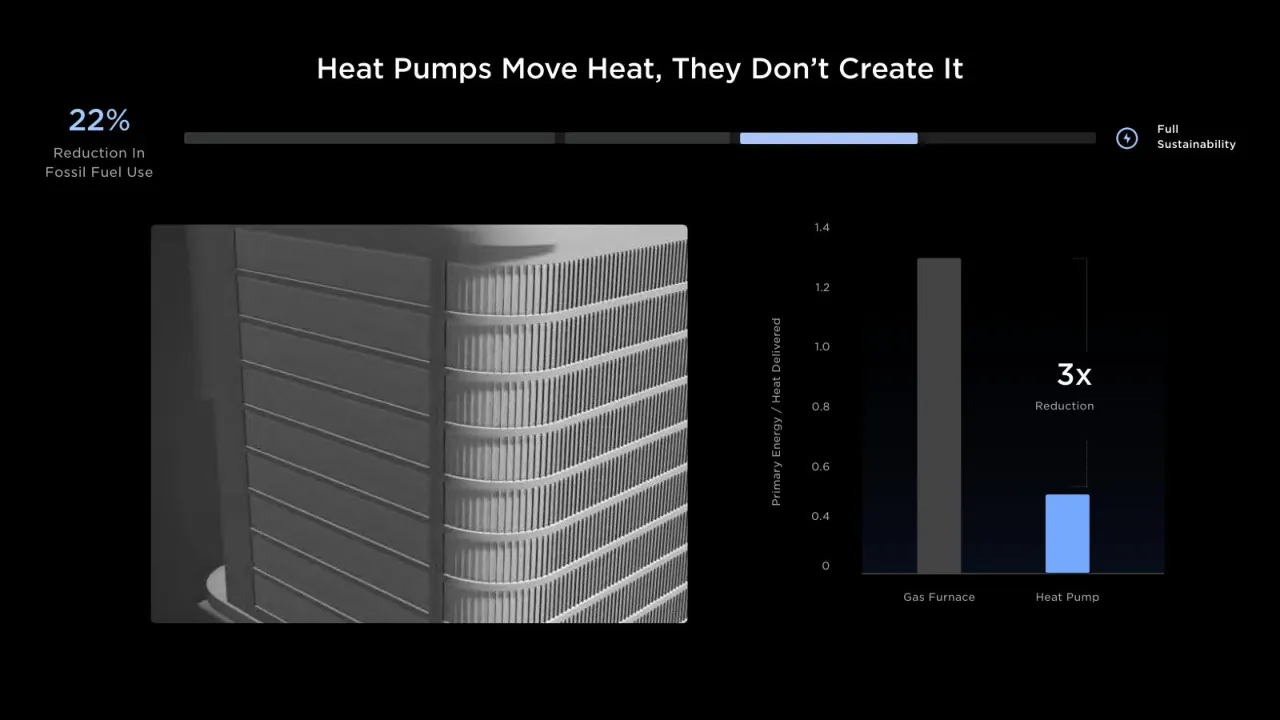
Slide 16 is titled Heat Pumps Move Heat, They Don't Create It, and its bar chart compares Gas Furnace and Heat Pump on Primary Energy per Heat Delivered, with a 3x Reduction label.
Details
- Company: Tesla
- Year: 2023
- Type: Investor presentation
- Industry: Automotive
- Pages: 169
More from Tesla
- Tesla investor presentation, 2026
- Tesla investor presentation, 2025
- Tesla investor presentation, Q4 2023 update
- Tesla investor presentation, Q4 2024 update
- Tesla investor presentation, 2024 annual shareholder meeting
- Tesla investor presentation, Q4 2022 update
All Tesla decks in the library
Review score: 8 out of 10, Strong
Presentation quality, judged with the SlideDeck Co review heuristic. Ask, evidence and idea merit are not rated here.
The deck has a strong, consistent identity: dark ground, short headline titles, large numbers and full-bleed photography. The argument builds clearly from problem (6) to plan (10) to proof (20, 22, 23), and the progress bar with a running fossil-fuel reduction percentage on slides 11 to 19 gives the audience a clear sense of where they are. Weaknesses are small, low-contrast labels on many charts and diagrams (slides 10, 14, 24, 29, 66, 69), a few sparse or ambiguous pages (slides 14, 38, 39, 52), and a legal disclaimer at illegible size on slide 2. For a keynote shown on a large screen and presented live, most pages are understandable, but the detail would be hard to read on a laptop.
Worth keeping: Keep the waterfall on slide 20, the single-message headline titles, the large-number callouts and the progress bar that tracks the five-step plan.
Most useful repair: Enlarge and brighten axis labels, legends and captions on slides 10, 14, 24, 29, 66 and 69, and fill or cut the near-empty diagram pages 38 and 39.
What would change the score: I would reduce the text-light atmospheric pages, such as repeated map, truck and exploded vehicle states, and add clear takeaway labels to the charts with faint annotations.
Confidence medium. 72 of 169 pages inspected on contact sheets, 4 at readable size. Reviewed 2026-11-08. Model-assisted review (claude-sonnet-5-5).
Full text of the slides (169 slides)
Every slide's words and a description of its charts and images, so the deck can be searched and rebuilt. Also available as Markdown.
Slide 1
INVESTOR DAY
Visuals: Full-bleed textured background of a dense grid of raised, metallic-looking blue tiles or mesh cells, lit from above so that the cell edges glow pale blue and fall into near-black at the cell gaps; the pattern is uniform across the whole slide. Behind the title sits a large, dark near-black silhouette of a stylised T-shaped emblem (a flattened arc over an upright stem), roughly centred, partly obscured by the title and by the tile texture. No photographs, charts, tables, icons or separate logos besides this emblem.
Slide 2
Certain statements in this presentation, including, but not limited to, statements relating to the future development, ramp, production capacity and output rates, supply chain, demand and market growth, cost, pricing and profitability, deliveries, deployment, availability and other features and improvements and timing of existing and future Tesla products and technologies such as Model 3, Model Y, Model X, Model S, Cybertruck, Tesla Semi, Robotaxi, our next generation vehicle platform, our Autopilot, Full Self-Driving and other vehicle software and our energy storage and solar products; statements regarding operating margin, operating profits, spending and liquidity; and statements regarding expansion, improvements and/or ramp and related timing at existing or new factories are “forward-looking statements” that are subject to risks and uncertainties. These forward-looking statements are based on management’s current expectations, and as a result of certain risks and uncertainties, actual results may differ materially from those projected. The following important factors, without limitation, could cause actual results to differ materially from those in the forward-looking statements: uncertainties in future macroeconomic and regulatory conditions arising from the current global pandemic; the risk of delays in launching and manufacturing our products and features cost-effectively; our ability to grow our sales, delivery, installation, servicing and charging capabilities and effectively manage this growth; consumers’ demand for electric vehicles generally and our vehicles specifically; the ability of suppliers to deliver components according to schedules, prices, quality and volumes acceptable to us, and our ability to manage such components effectively; any issues with lithium-ion cells or other components manufactured at Gigafactory Nevada and Gigafactory Shanghai; our ability to ramp Gigafactory Shanghai, Gigafactory Berlin-Brandenburg, Gigafactory Texas and new factories in accordance with our plans; our ability to procure supply of battery cells, including through our own manufacturing; risks relating to international expansion; any failures by Tesla products to perform as expected or if product recalls occur; the risk of product liability claims; competition in the automotive and energy product markets; our ability to maintain public credibility and confidence in our long-term business prospects; our ability to manage risks relating to our various product financing programs; the status of government and economic incentives for electric vehicles and energy products; our ability to attract, hire and retain key employees and qualified personnel and ramp our installation teams; our ability to maintain the security of our information and production and product systems; our compliance with various regulations and laws applicable to our operations and products, which may evolve from time to time; risks relating to our indebtedness and financing strategies; and adverse foreign exchange movements. More information on potential factors that could affect our financial results is included from time to time in our Securities and Exchange Commission filings and reports, including the risks identified under the section captioned “Risk Factors” in our annual report on Form 10-K filed with the SEC on January 31, 2023. Tesla disclaims any obligation to update information contained in these forward-looking statements whether as a result of new information, future events or otherwise.
Slide 3
INVESTOR / DAY
Visuals: A dark, near-black silhouette of a stylised T-shaped emblem (a rounded top bar with a tapering vertical stem) is centred behind the text, roughly spanning the middle 38% to 65% of the width and from about 35% to 78% of the height. It is rendered as a flat, slightly transparent black shape that the textured background shows through. The full background is a repeating tiled mesh of small beveled blue-grey metallic squares with bright blue edge highlights, evenly spaced across the whole slide, with a darker vignette toward the corners. Lighting is a soft blue glow emanating from the title letters.
Slide 4
Master Plan 3
Slide 5
Master Plan 3
Sustainable Energy For All of Earth
Slide 6
Our Energy Economy Is Dirty & Wasteful
Current State
SUSTAINABLE
FOSSIL FUELS
Primary Energy
Consumption
165 PWh/yr
Over 80% of Global Energy Comes From Fossil Fuels
Only 1/3 of Global Energy Delivers Useful Work or Heat
Visuals: Full-bleed photograph of an industrial plant at sunset: rows of tall grey cylindrical storage towers and chimneys on the left, pipe racks running across the middle, and two tall red-and-white striped smokestacks on the right emitting thick dark-grey smoke that drifts across a warm orange and brown sky. Lighting is low sun from the left, haze-diffused. Dominant colours are burnt orange, charcoal grey, and dark navy at top right. The photo is uncropped and full-bleed, with a dark gradient overlay that darkens from about 40% opacity at mid-height to near black at the bottom. A segmented bar graphic: a light grey rounded segment labelled SUSTAINABLE covering about 13% of the bar width, and a dark charcoal rounded segment labelled FOSSIL FUELS covering the remaining width. No chart values are shown.
Slide 7
But there’s a better way
Visuals: Aerial photograph of a desert solar installation. Foreground: a rectangular grid of rows of dark solar panels running diagonally across the left and center, with a paved road running from lower center-right toward upper right, and a dark-panelled array beyond it on the right. Mountains of tan and brown rock run across the horizon on the left and right. Near lower center there is a substation cluster of small grey equipment and, to its right, about 40 rows of white rectangular battery storage containers arranged in a grid. Sky occupies the top half: pale blue-navy gradient at top right fading to a hazy warm beige near the horizon, with scattered white cumulus clouds, larger on the right and left edge. Lighting is bright daylight, warm and hazy on the left, cooler on the right. Composition is wide landscape, full frame, not cropped inside a box; a dark brown-grey overlay (roughly 40 to 50 percent opacity) tints the whole photograph, darkening it. Dominant colours: navy #1E3A5A in sky top right, beige #B8A48A near horizon, dark brown #3B2A22 for panels, white #F2F2F2 for containers.
Slide 8
A Sustainable Energy Economy Is Within Reach & We Should Accelerate It
Current State
SUSTAINABLE
FOSSIL FUELS
Primary Energy / Consumption
165 PWh/yr
Sustainable / Energy Economy
SUSTAINABLE SOURCES
82 PWh/yr
End Use Efficiency
Visuals: Photograph, full-bleed, aerial view of a desert solar installation. Rows of dark photovoltaic panel arrays run diagonally across the left and right foreground. A paved two-lane road runs diagonally from lower-centre to the right edge. Near the bottom centre, a substation with transformers sits above a dense grid of grey-white battery storage containers, about 60 units in rows. Mid-distance shows brown, rugged mountains; the sky is dark blue at top right fading to pale haze, with white cumulus clouds. Lighting is bright daylight, slightly hazy. Dominant colours are tan and ochre ground, dark navy sky and near-black panels. The photo is cropped to the full slide and overlaid with a dark navy-grey tint of roughly 45% opacity to lower contrast behind the text. Chart elements: a two-row horizontal bar comparison with no axes or scale. Row 1 (Current State): a blue segment labelled SUSTAINABLE about 13% of the bar width, followed by a dark charcoal segment labelled FOSSIL FUELS about 87% of the bar width, total 165 PWh/yr. Row 2 (Sustainable Energy Economy): one blue segment labelled SUSTAINABLE SOURCES about 73% of the row width, followed by a blue double-headed arrow spanning the remaining gap, labelled End Use Efficiency below it, ending at 82 PWh/yr. No legend, no highlighted points beyond the blue segments.
Slide 9
A Sustainable Energy Economy Is Within Reach & We Should Accelerate It
HOW THE MASTER PLAN WORKS
240TWh
Storage
30TW
Renewable / Power
$10T
Manufacturing / Investment
1/2
The Energy / Required
<0.2%
Land Area / Required
10%
2022 / World GDP
ZERO
Insurmountable / Resource Challenges
Visuals: Aerial photograph of a desert utility-scale solar installation. In the foreground centre-bottom is a battery energy storage site: rows of about 40 white rectangular battery containers arranged in diagonal rows, with a small electrical substation (transformers and switchgear, pale grey and beige) at the upper left of the cluster. Mid-ground: large dark blue-black solar panel arrays in rectangular blocks running across the left and right halves, with a paved access road running diagonally from the lower centre to the right edge. Background: brown and tan mountain ridge across the middle, desert scrub in the foreground, and a sky with cumulus clouds, deep blue at the top right and warm light haze near the horizon. Composition is wide-angle, elevated viewpoint, full frame with no cropping of the title area. Lighting is late-afternoon sun, warm on the ground and shadowed on the panels. Dominant colours: dark slate blue #1E2F40 in the sky, warm tan #8A6A55 in the ground, near-black #1B1B1F in the panels. A dark overlay of roughly 40 to 50 percent black covers the whole photograph to improve text contrast.
Slide 10
The Plan To Eliminate Fossil Fuels
Reduction In
Fossil Fuel Use
35%
21%
22%
17%
5%
Renewably Power
The Existing Grid
46 PWh/yr
Switch to
Electric Vehicles
28 PWh/yr
Switch to
Heat Pumps
29 PWh/yr
High Temp Heat
Delivery & Hydrogen
22 PWh/yr
Sustainably Fuel
Planes & Boats
7 PWh/yr
Displaced
Fossil Fuels
Visuals: Horizontal segmented bar chart with no axes or chart title, drawn as five contiguous rounded blue rectangles whose lengths are proportional to the reduction shares printed above them. Segment 1 (35%, renewably power the existing grid) is the longest, segment 2 (21%, switch to electric vehicles) second, segment 3 (22%, switch to heat pumps) third, segment 4 (17%, high temp heat delivery and hydrogen) fourth, and segment 5 (5%, sustainably fuel planes and boats) is the shortest sliver at the right. Each segment has a grey tick line below its left edge and one at the right end. Beneath each segment sits a greyscale illustration with its caption and a value in PWh/yr: solar panel on a tilted mounting frame (46 PWh/yr); a small side view of a car (28 PWh/yr); a stack of cylindrical heat-pump tanks beside a compressor unit (29 PWh/yr); an industrial pipe elbow with a wheel valve on a tall stand (22 PWh/yr); and a rectangular battery or fuel-system unit with a flat base (7 PWh/yr). The illustrations are monochrome grey on a near-black background, lit from the upper left with soft shading, and are not cropped, sitting free on the panel with no boxes or overlays. The left label 'Displaced Fossil Fuels' has no numeric value or series beside it.
Slide 11
1. Repower the Existing Grid With Renewables
35%
Reduction In / Fossil Fuel Use
Full / Sustainability
24TWh
Stationary / Storage
10TW
Solar + Wind
$0.8T
Manufacturing / Investment
Visuals: 1) Progress bar: a horizontal bar with a dark grey track (#222222) spanning about x 14.4% to x 85.6% at y 18.2%, height about 1.8%, with rounded ends. The filled portion in light blue (#9CC3FF) runs from the left end to about 29% of the track length, which is the value the 35% figure describes. 2) Status icon: a thin outlined circle (about 1.8% wide) in light blue (#9CC3FF) with a lightning bolt inside, at x 87.2%, y 17.6%. 3) Photograph: an aerial, slightly angled view of a utility-scale battery storage yard at sunset. Rows of white rectangular battery containers (about 60 to 70 visible in each block, arranged in three clusters with access roads between them) fill the centre and right of the frame. A few larger grey-white enclosures stand on raised platforms at the lower left and centre. A substation with steel lattice towers and wires is at the lower left corner. A flat wheat or stubble field fills the upper half in golden-brown tones (about #A87A4A to #6B4A2E), with faint circular tracks in the field. Warm low sunlight from the right gives orange highlights; the containers are off-white (about #E6E6E6) with grey shading. The image is boxed (not full-bleed) and rectangular with sharp corners, and its bottom edge fades into the black background through a dark gradient. There is no overlay or tint beyond that fade. No logos or icons are shown in the photograph.
Slide 12
2. Switch to Electric Vehicles
21%
Reduction In
Fossil Fuel Use
Full
Sustainability
115TWh
Vehicle Batteries
& Stationary Storage
4TW
Solar + Wind
$7.0T
Manufacturing
Investment Needs
Visuals: Photograph of four Tesla electric cars parked side by side at a Tesla Supercharger station in a desert landscape at sunset. From left to right: a dark grey Model S, a blue Model 3, a white Model X, and a red Model Y. Each car is plugged into or sits beside a white Supercharger pillar with red Tesla wordmarks. Composition is a wide horizontal frame with the cars roughly centred, mountains and green tree line behind, and a pale warm sky. Lighting is low warm sunset light from the right with lens flare at upper right; the lower portion of the photo fades to black. Dominant colours are warm peach, orange and dark asphalt with black. The photo is not cropped and sits in a rectangular box with small rounded corners, with a dark gradient fading into the black background at the bottom edge. Progress bar: a long thin rounded bar about 1.2% of slide height tall, dark grey #3A3A3A track spanning from about x 14% to x 85%, with a light blue #A9C8F5 filled segment from about x 44% to x 57%. Icon: a thin outlined circle with a lightning bolt, light blue #A9C8F5 stroke, at the right of the bar.
Slide 13
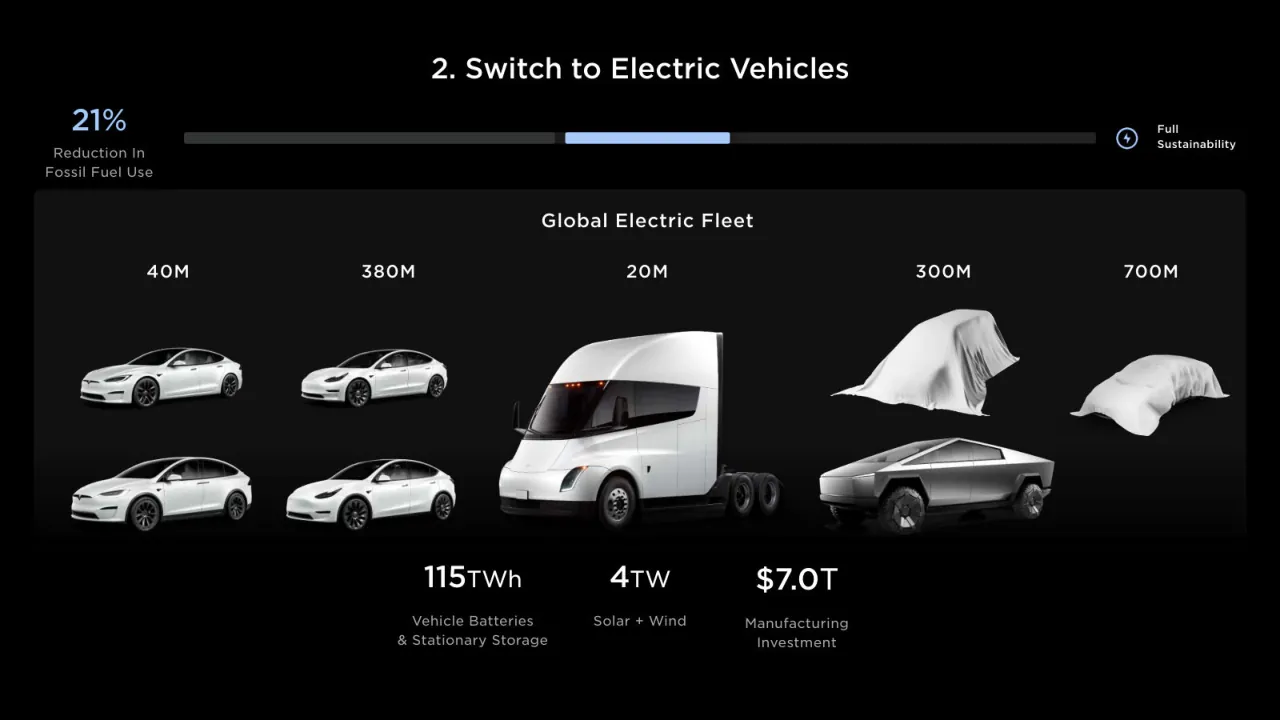
2. Switch to Electric Vehicles
21%
Reduction In / Fossil Fuel Use
Full / Sustainability
Global Electric Fleet
40M
380M
20M
300M
700M
115TWh
Vehicle Batteries / & Stationary Storage
4TW
Solar + Wind
$7.0T
Manufacturing / Investment
Visuals: Progress bar: a long thin horizontal track in dark grey (#2A2A2A) spanning roughly x 14% to 85%, with a light blue (#A3C4F3) filled segment from about x 44% to 57% at the same height, indicating progress. A small circled lightning-bolt icon in light blue outline sits at the right end beside 'Full Sustainability'. Global Electric Fleet panel: a near-black rounded rectangle (#111111) with the title 'Global Electric Fleet' centred at its top. Five columns, each with a label above and white vehicle renderings on black: column 1 labelled 40M shows two white Model S and Model X style cars (a sedan on top, an SUV below); column 2 labelled 380M shows two white Model 3 and Model Y style cars (sedan on top, SUV below); column 3 labelled 20M shows a single large white Tesla Semi truck tractor in three-quarter view facing left; column 4 labelled 300M shows a white draped cover over a shape on top and a grey Cybertruck below; column 5 labelled 700M shows a white draped cover shape, with no vehicle visible. All vehicles are shown in side or three-quarter view, lit from above with soft studio lighting, against a black background, with no overlays. Statistics: three figures with labels, no chart.
Slide 14
EVs Use Energy Far More Efficiently
21%
Reduction In / Fossil Fuel Use
Full / Sustainability
Tesla Model 3
4x
More Efficient / Oil Well to Wheel
Toyota Corolla
Visuals: Two horizontal bar-style comparison lines, each with a small car photograph at its end, plus a segmented progress bar and a circular bolt icon. (1) Progress bar: a long rounded-corner track from about 14% to 85% of slide width, dark grey #2A2A2A, with a light-blue segment #A8C8F8 from about 44% to 57% of width; no axis or values. (2) Icon: a thin light-blue #8DB8F0 circle outline containing a lightning bolt, at the left of the 'Full Sustainability' label. (3) Tesla line: a 3 px blue #2E9BF5 horizontal line from about 7% to about 79% of width at about 43% of height, with a short vertical tick at its left end, ending under the Tesla car. (4) Tesla Model 3 photo: a monochrome grey side-view photograph of a sedan, facing left, on a pure black background, full image unboxed, with soft grey highlights on the body and dark wheels. (5) Toyota Corolla line: a 2 px grey #9A9A9A horizontal line from about 7% to about 22% of width at about 85% of height, with a short vertical tick at its left end, ending under the Corolla car. (6) Toyota Corolla photo: a monochrome grey side-view photograph of a compact sedan, facing left, on pure black, unboxed, with soft grey highlights. Relative length: the Tesla line is about 3.5 times longer than the Corolla line, and the 4x stat labels the Tesla comparison. No chart axes, legend or table.
Slide 15
3. Switch To Heat Pumps in Homes, Businesses & Industry
22%
Reduction In / Fossil Fuel Use
Full / Sustainability
6TWh
Stationary / Storage
5TW
Solar + Wind
$0.3T
Manufacturing / Investment
Visuals: One photograph: industrial pipework in a plant. Subject: large orange-painted pipes curve through the frame; several stainless steel cylindrical housings stand upright; green rectangular signs with a white upward arrow and vertical white 'CHS' lettering sit on the steel housings; black valve actuators and grey flanges are mounted on the pipes; a blue-tinted valve sits at the right edge. Composition: wide landscape crop, full-width within a box, sharp corners, pipes running diagonally from lower left to upper right, a slightly soft focus toward the bottom. Lighting: dim, low-key industrial light with warm highlights on the orange pipes and some overhead glare at the top right. Dominant colours: orange #C8581E, green #1E7A2A, steel grey #6E7378, black #101010. Not cropped beyond the box; the bottom edge fades into the black background through a dark gradient overlay. One progress bar made of four segments: three dark grey segments #3A3A3A and one light blue segment #A9C4FF filling the third quarter of the track. One outline icon: a circle with a lightning bolt in light blue #A9C4FF, stroke about 2 px.
Slide 16
22%
Reduction In / Fossil Fuel Use
Heat Pumps Move Heat, They Don't Create It
Full / Sustainability
1.4 / 1.2 / 1.0 / 0.8 / 0.6 / 0.4 / 0
Primary Energy / Heat Delivered
Gas Furnace
Heat Pump
3x
Reduction
Visuals: Chart: vertical bar chart, two bars. Title: none printed. Y axis: 'Primary Energy / Heat Delivered', rotated, no units printed, ticks 0, 0.4, 0.6, 0.8, 1.0, 1.2, 1.4 (no unit labels). X categories: 'Gas Furnace' and 'Heat Pump'. Series values are not printed; estimated: Gas Furnace bar about 1.3 in dark grey #3A3A3A; Heat Pump bar about 0.5 in light blue #8AB4F8. Dotted grey bracket lines connect the top of the Gas Furnace bar to the Heat Pump bar area, annotated '3x' with 'Reduction' in the middle of the chart. No legend. Highlighted point: the Heat Pump bar in blue. Photograph: greyscale photo of an outdoor heat pump condenser unit, shown close up. Left portion has vertical grey louvred metal panels with horizontal slanted ribs, right portion shows dense finned aluminium coil with many fine vertical fins and curved tube bends. A curved white-grey base or foot is visible at the bottom left. Lighting is soft and diffuse from the upper left, dominant colours are mid to light greys with near-black shadows. Photo is boxed with slightly rounded corners, not full-bleed and not cropped in shape. Icon: thin blue circular outline (#A8C8FF, about 0.2% stroke) containing a lightning bolt, to the left of 'Full Sustainability'. Progress bar: segmented horizontal bar made of four dark grey (#262626) rectangles with a blue (#A8C8FF) highlighted section, with a small gap between segments.
Slide 17
4. Electrify High Temp Heat Delivery & Hydrogen
17%
Reduction In / Fossil Fuel Use
Full / Sustainability
48TWh
Stationary / Storage
6TW
Solar + Wind
$0.8T
Manufacturing / Investment
Visuals: Top band: a four-segment horizontal progress bar; the first three segments are dark grey (#3A3A3A) and the fourth segment, from about 72% to 83% of the bar width, is filled light blue (#A9C8F5); the bar has rounded ends and a thin dark gap between segments; the bar is not labelled with numbers. Left of the bar, a large light blue stat (17%) with a small grey caption. Right of the bar, a small outlined circle icon containing a lightning bolt, stroked light blue (#A9C8F5) at about 1.5 px, followed by the label 'Full Sustainability'. Middle: a photograph of molten metal being poured from a large industrial ladle or furnace spout; a bright orange-yellow stream of liquid metal pours down diagonally from upper centre-right, with sparks scattering in the lower centre; the foreground and left show dark steel machinery and a rounded metal cradle; a hazy orange glow fills the left side; the composition is landscape, cropped wide, with the metal stream as the focal point; lighting is intense and warm, dominant colours are orange (#E0601A), yellow (#F5C542), and near-black (#1A1210); the photograph has a dark gradient fading into black at the bottom edge and is boxed with slightly rounded corners, not full-bleed. Bottom: three stat figures with no chart or graphics.
Slide 18
4. Electrify High Temp Heat Delivery & Hydrogen
17%
Reduction In
Fossil Fuel Use
Full
Sustainability
48TWh
Stationary
Storage
6TW
Solar + Wind
$1.0T
Manufacturing
Investment
Visuals: One photograph: a wide, cropped view of an outdoor industrial plant. White insulated pipes bend over the frame, with horizontal cylindrical heat exchangers or vessels with rounded end caps. A lattice tower with a small antenna and two black birds in flight stands near the centre-right. Blue steel railings and a staircase are at the lower left, and red valve handwheels are scattered along the pipes. The sky is overcast grey-blue. Lighting is flat daylight. Dominant colours are white, slate blue-grey and small accents of blue and red. The image is cropped to a rectangle, boxed rather than full-bleed, with a slight darkening along its bottom edge. A progress bar of four segments: three segments are dark grey (#3A3A3A) and the fourth, which is highlighted, is light blue (#A9C8F5). A thin white-grey outline circle with a lightning bolt inside sits at the left of the Full Sustainability label.
Slide 19
5. Sustainably Fuel Planes & Boats
5%
Reduction In / Fossil Fuel Use
Full / Sustainability
44TWh
Vehicle Batteries / & Stationary Storage
4TW
Solar + Wind
$0.8T
Manufacturing / Investment
Visuals: Photograph: an aerial top-down view of a large white container ship with stacked multicoloured shipping containers (red, teal, orange) on its deck, sailing forward through dark teal ocean. Turbulent bright turquoise wake and foam trail behind the hull, with the bow pointing up the frame. Composition is centred and vertically oriented within a wide band; the ship is cropped at the top edge by the photo band. Lighting is soft daylight; dominant colours are deep teal, turquoise, white and rust-red. Left side of the photo shows streaked brownish-tan water texture. Photo is boxed with rounded corners and slightly darkened edges fading into the black background. Progress bar: four dark grey (#333333) segments with a light blue (#A9C8F5) filled segment at the right end, segments separated by small gaps. Icon: a thin light-blue circle outline containing a lightning-bolt glyph, to the right of the bar.
Slide 20
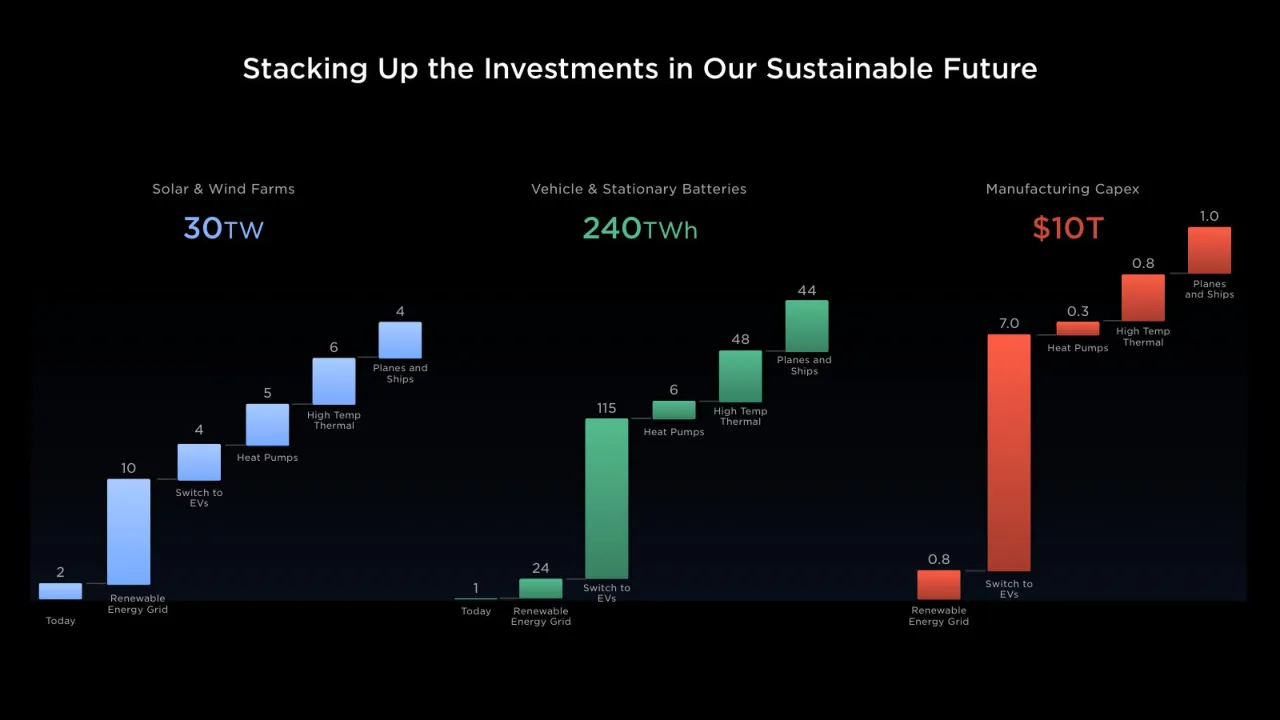
Stacking Up the Investments in Our Sustainable Future
Solar & Wind Farms
30TW
Vehicle & Stationary Batteries
240TWh
Manufacturing Capex
$10T
2
10
4
4
5
6
4
Today
Renewable Energy Grid
Switch to EVs
Heat Pumps
High Temp Thermal
Planes and Ships
1
24
115
6
48
44
Today
Renewable Energy Grid
Switch to EVs
Heat Pumps
High Temp Thermal
Planes and Ships
0.8
7.0
0.3
0.8
1.0
Renewable Energy Grid
Switch to EVs
Heat Pumps
High Temp Thermal
Planes and Ships
Visuals: Three stacked-bar waterfall charts with no axes, gridlines or legend; each bar is labelled with its value above it and its category below it, and short thin grey connector lines link the top of each bar to the next. Chart 1, Solar & Wind Farms, headline 30TW, blue bars: Today 2 (about 2 units, starting at baseline), Renewable Energy Grid 10 (floating step), Switch to EVs 4, Heat Pumps 5, High Temp Thermal 6, Planes and Ships 4; the running total rises from 2 to 31 to 35 to 40 to 45 to 51 to 55 (values are printed, totals are about). Chart 2, Vehicle & Stationary Batteries, headline 240TWh, green bars: Today 1, Renewable Energy Grid 24, Switch to EVs 115, Heat Pumps 6, High Temp Thermal 48, Planes and Ships 44 (values printed; running total about 1 to 25 to 140 to 146 to 194 to 238). Chart 3, Manufacturing Capex, headline $10T, red bars: Renewable Energy Grid 0.8, Switch to EVs 7.0, Heat Pumps 0.3, High Temp Thermal 0.8, Planes and Ships 1.0 (values printed; running total about 0.8 to 7.8 to 8.1 to 8.9 to 9.9). No highlighted points; bars are drawn at proportional heights with no printed scale, so heights are relative to each chart's own values.
Slide 21
It's Entirely Feasible
Slide 22
If We Grow our Production Capacity as Shown by 2030
We Can Be 100% Sustainable by 2050
Solar & Wind Deployment (TW/Yr)
2022 Deployment
Required Deployment
Per Year
.36
1.0
3x
Vehicle, Stationary, & Thermal
Battery Production TWh/Yr
2022 Deployment
Required Deployment
Per Year
.54
16
29x
Electric Vehicle Production Millions/Yr
2022 Deployment
Required Deployment
Per Year
8
85
11x
Visuals: Three side-by-side bar charts, each with two vertical bars and a dotted bracket connecting the bar tops with a multiplier label. Chart 1: Solar & Wind Deployment (TW/Yr); bars labelled 2022 Deployment = .36 (light blue, about 0.36 of scale) and Required Deployment Per Year = 1.0 (light blue, taller, the value printed above it); bracket labelled 3x. No axis lines or numeric axes are printed; baseline is a thin grey line. Chart 2: Vehicle, Stationary, & Thermal Battery Production TWh/Yr; bars 2022 Deployment = .54 (green, about 0.54 of scale) and Required Deployment Per Year = 16 (green, about 16 of scale); bracket labelled 29x. Chart 3: Electric Vehicle Production Millions/Yr; bars 2022 Deployment = 8 (red-orange, about 8 of scale) and Required Deployment Per Year = 85 (red-orange, about 85 of scale); bracket labelled 11x. Bars have flat tops with no outline; each chart has a faint dark-grey gradient panel behind it. No legend; no highlighted points beyond the multiplier brackets.
Slide 23
A Sustainable Energy Economy Is 60% / The Cost of Continuing Fossil Fuel Investments / $14T / $10T / $16 / $14 / $12 / $10 / $8 / $6 / $4 / $2 / $- / Dollars of Capital Investment [Trillions] / 20 Years of Investment / In Fossil Fuels at 2022 Rate / 20 Years Investment in / Sustainable Energy Economy / Coal / Natural Gas / Oil
Visuals: Chart: stacked and single-series vertical bar chart with no chart title beyond the slide title. Y-axis title 'Dollars of Capital Investment [Trillions]', rotated 90 degrees, grey, running from about $- to $16 in $2 steps, with tick labels '$-', '$2', '$4', '$6', '$8', '$10', '$12', '$14', '$16'. X-axis categories: '20 Years of Investment In Fossil Fuels at 2022 Rate' (left bar) and '20 Years Investment in Sustainable Energy Economy' (right bar). Left series, stacked bottom to top: Coal, dark grey #3A3A3A, about $1.8T; Natural Gas, red-orange #FF6347, about $6.6T; Oil, grey #8D9A99, about $6T; total labelled '$14T' above the bar in grey #8D9A99. Right series: single blue bar #76A6F8, labelled '$10T' above the bar in blue #76A6F8, value printed as $10T. The printed values are only the totals $14T and $10T; the segment values are estimates marked 'about'. Legend below the chart: short line swatches with labels 'Coal' (dark grey #3A3A3A text), 'Natural Gas' (red #FF6347 text), 'Oil' (light grey #8D9A99 text), spaced evenly in one row. Highlighted points: none. Baseline is a thin grey #3A3A3A horizontal axis line. No gridlines.
Slide 24
More Than Enough Renewable Resources Available / Solar Direct Land Area / 0.14% of Land / Wind Direct Land Area / 0.03% of Land
Visuals: Illustration: a flat, dark grey silhouette world map (continents only, no borders, no labels, no graticule) in Mercator-style projection, showing North and South America, Europe, Africa, Asia, Australia and New Zealand, with Greenland and Arctic islands at the top. The map is about 1 to 2 tones lighter than the black background, so it reads as low-contrast. Two data markers sit on central Asia: a solid green square (about 12 px on a 2000 px wide slide) at roughly 64% of the width and 51% of the height, and a much smaller solid blue square just to its right. Several tiny single-pixel green dots appear on North America, Europe, Africa and South America, and a faint white dot appears on Australia; they are barely visible. Legend: a green square marker followed by 'Solar Direct Land Area' and '0.14% of Land' in green text, and a blue square marker followed by 'Wind Direct Land Area' and '0.03% of Land' in blue text. No chart axes, no photographs.
Slide 25
More Than Enough Renewable Resources Available
Solar Direct Land Area
0.14% of Land
Wind Direct Land Area
0.03% of Land
Total Earth Land Area = 32,111,167,147 Acres
12.5% of Land Use for Agriculture = 4B Acres
= 2x Contiguous US
Visuals: Illustration: a flat dark-grey world map (about #1E1E1E) on a pure black background, continents shown as solid silhouettes with no borders or labels, in a simple equirectangular-style projection. Small markers sit on the map: a green square about 0.6% by 1.1% of slide size at x 64.4%, y 50.8% over central Asia (Kazakhstan area); a blue square about 0.4% by 0.7% immediately to its right at x 65.7%, y 50.8%; and tiny green dots over North America (about x 29%, y 48%), Europe (about x 51%, y 44.5%), Africa (about x 50%, y 57.5%) and South America (about x 36%, y 69%). A dashed white-grey rectangle outlines Australia, from x 68.6% to 76.9% and y 65.9% to 80.6%. Legend: a solid green square key, a solid blue square key, and a dashed grey square key. No chart axes, no photographs, no logos.
Slide 26
A Sustainable Energy Economy Involves Less Mineral Extraction
EACH TRUCK IS 1 GIGATON
Everything Else
Fossil Fuel Extraction
Visuals: 68 identical side-profile mining dump-truck icons arranged in a grid of seven rows. Each truck is in flat grey metallic shading with a lighter grey body and dark wheels with light hubcaps. The trucks are shaded in two tones: about the first 40 are light grey (about #C8C8C8) and the rest, mostly on the right-hand side of rows one to seven, are darker grey (about #4A4A4A). No chart axes, legend values or highlighted points are printed. Two outlined rectangles at the bottom serve as legend keys: 'Everything Else' (light outline) and 'Fossil Fuel Extraction' (grey outline). Each truck is one gigaton per the subtitle.
Slide 27
A Sustainable Energy Economy Involves Less Mineral Extraction
EACH TRUCK IS 1 GIGATON
Everything Else
Sustainable Economy Materials
Visuals: Pictogram chart of 54 identical grey dump-truck icons arranged in 7 rows (rows 1 to 5 have 8 trucks, rows 6 and 7 have 7 trucks). Each icon is a side-view dump truck with a tipped bed and two visible wheels. Four trucks are filled green and are the highlighted points: one at the right end of row 2, one at the right end of row 3, one at the right end of row 4 and one at the right end of row 5. The remaining 50 trucks are silver-grey. Subtitle states each truck is 1 gigaton; no axis, scale or legend values are printed beyond the two legend labels. Legend: an outlined grey box reading Everything Else and an outlined green box reading Sustainable Economy Materials.
Slide 28
The Resources Are There To Support the Transition / Cumulative Demand Until 2050, / Relative to 2023 USGS Estimated Resources / NICKEL / LITHIUM / ZINC / COPPER / COBALT / IRON / MANGANESE / ALUMINUM / GRAPHITE / 0% / 10% / 20% / 30% / 40% / 50% / 60% / 70% / 80% / 90% / 100%
Visuals: Horizontal bar chart. Title: none inside the chart; chart subtitle reads 'Cumulative Demand Until 2050, Relative to 2023 USGS Estimated Resources'. Y-axis: material categories listed top to bottom: Nickel, Lithium, Zinc, Copper, Cobalt, Iron, Manganese, Aluminum, Graphite. X-axis: percentage from 0% to 100% in 10% steps, with unit percent, gridlines at each 10% as thin dark grey vertical lines. Series (values printed on the slide: none; estimates): Nickel about 29.5%; Lithium about 28%; Zinc about 2.3%; Copper about 2.3%; Cobalt about 1.8%; Iron about 0.6%; Manganese about 0.5%; Aluminum about 0.1%; Graphite about 0.1%. Bars are light blue gradient from medium blue #6E9CF5 at left to pale blue #A8C4FF at right end. No legend. No highlighted points.
Slide 29
And History Teaches: The More We Look, The More We Find / What People Think Happens / Reserves / 9 / 8 / 7 / 6 / 5 / 4 / 3 / 2 / 1 / 0 / '02 / '06 / '10 / '14 / '18 / '22 / What Actually Happens / Reserves, Normalized To 2000 Reserves / 9 / 8 / 7 / 6 / 5 / 4 / 3 / 2 / 1 / 0 / '02 / '06 / '10 / '14 / '18 / '22 / Ni / Li / Co / Cu
Visuals: Two charts. Left chart: titled 'What People Think Happens', no printed series values; a single straight white line with an arrowhead at its lower-right end runs diagonally from about (2.5 on the x-axis at '02, value about 8.3) down to about (value 2.4 at '22), drawn over the plot. Y-axis titled 'Reserves', range 0 to 9 with ticks every 1, no units printed; x-axis labelled '02, '06, '10, '14, '18, '22 with no unit. Right chart: titled 'What Actually Happens'; y-axis titled 'Reserves, Normalized To 2000 Reserves', range 0 to 9 with ticks every 1, unitless index; x-axis labelled '02, '06, '10, '14, '18, '22, roughly annual points from 2000 to 2022. Four series: Li (red-orange #E8473A) starts about 1.0 in 2000, rises slowly to about 1.3 by 2008, jumps to about 3.0 around 2010, about 3.9 at 2011, about 4.4 at 2016, dips to about 4.5 at 2018, rises to about 6.5 at 2020 and ends highest at about 7.8 in 2022 (highlighted by being the only steep series). Ni (light blue #9DBBF2) starts about 1.0, rises to about 2.0 by 2012, about 2.2 by 2017 and about 2.65 by 2021 to 2022. Co (light grey #C8C8C8) dips to about 0.8 in 2001, rises to about 1.5 by 2003, stays about 1.6 until 2014, and ends about 1.9 in 2022. Cu (blue #4F80E0) starts about 1.0, runs about 1.5 to 2010, about 1.6 to 2016, about 1.9 by 2019 and ends about 2.1 in 2022. Legend below the right chart: light blue line Ni, red line Li, grey line Co, blue line Cu, each short horizontal stroke followed by its label. No gridlines; thin grey axis baseline at 0 on both charts; plot areas have a faint navy-to-black vertical gradient.
Slide 30
Recycling Will Further Reduce Mineral Demand / Mining / Recycling / Refining / Lifetime Usage / Cathode Production / Cell Production
Visuals: Diagram: a circular cycle of five glowing arrow segments drawn as curved light-blue strokes with triangular arrowheads, flowing clockwise. A straight horizontal arrow runs from the left (starting near x 27%) to the top of the circle at about x 50%, y 29%, where it joins the loop. Segments: Mining (straight horizontal arrow, top-left, pointing right into the loop), Refining (upper-right arc with arrowhead pointing down at about x 65%, y 52%), Cathode Production (lower-right arc with arrowhead pointing down-left at about x 56%, y 76%), Cell Production (bottom arc with arrowhead pointing up-left at about x 40%, y 80%), Lifetime Usage (left arc, unlabelled arrowhead pointing up at about x 37%, y 45%), Recycling (upper-left arc connecting back to the mining arrow). Labels sit beside each segment. The strokes have a soft white-blue glow with a bloom halo; no legend, no values, no highlighted points beyond the glow.
Slide 31
A Sustainable Energy Economy Is Within Reach & We Should Accelerate It
HOW THE MASTER PLAN WORKS
240TWh
Storage
30TW
Renewable
Power
$10T
Manufacturing
Investment
1/2
The Energy
Required
<0.2%
Land Area
Required
10%
2022
World GDP
ZERO
Insurmountable
Resource Challenges
Visuals: Aerial photograph of a desert solar installation. Foreground: a grid of rows of dark solar panels on the left and centre, with a long straight access road running diagonally to the right. Lower centre: a substation with transformers and a field of white rectangular battery storage containers arranged in rows. Background: brown mountain ridges and a pale desert floor with sparse shrubs. Sky: blue at the top right fading to pale warm haze, with cumulus clouds. Lighting: bright daylight, with a darkening overlay applied across the whole image. Dominant colours: brown, tan, dark navy and slate blue. The photograph is full-bleed, uncropped at the edges, with a dark translucent tint of roughly 40% black over it. No charts, tables, logos or icons.
Slide 32
01 / Vehicle Design / Franz von Holzhausen, Lars Moravy
Visuals: One circular ring graphic. It is a full circle of about 500 px diameter on the 2000 px wide frame, centred near x 530, y 560. The ring is a grey (#6B6B6B) stroke about 8 px thick, broken into about nine arc segments by small gaps, with gaps at roughly 12 o'clock, 1:30, 3, 4:30, 6, 7:30, 9 and 10:30. The arc from 12 o'clock clockwise to about 1:30 is bright, glowing pale blue-white (#DDE8F5) with a soft blue halo, and it is the only lit segment. There are no photographs, charts, icons or logos. The background carries a subtle dark tile or woven grid texture in dark slate blue, visible mainly on the left and centre.
Slide 33
The Early Days
MODEL S
Visuals: One photograph, a wide horizontal image of workers in a factory or workshop around a partly built silver car body. Subject: two men standing in the centre, one in a light grey crew-neck t-shirt with dark trim with hands clasped in front, the other in a dark navy polo shirt gesturing with one hand and talking. In the foreground a bald man in a navy shirt leans over the car's side with his head bowed, and on the right a man in a dark green-black shirt leans into the car body from behind. The car is an unpainted silver body with a yellow protective cover on the roof and a black cable running along it. Background contains a red fire extinguisher on a bracket, a blue curtain, a white wall and a partly visible white sign with blue letters. Composition: medium-wide framing, subjects at mid-height, car body crossing the lower half diagonally. Lighting: flat, even overhead fluorescent light with soft reflections on the metal. Dominant colours: silver grey, black, white, navy, with a yellow accent on the roof cover and red on the extinguisher. The photo is not cropped on its sides, has rounded corners of about 1% of slide width, is boxed rather than full-bleed, and has no overlay or tint.
Slide 34
2012 Model S
1
DESIGN
2
ENGINEERING
3
MANUFACTURING
Visuals: Photograph: a black Tesla Model S (2012, with the badge 'MODEL S' visible on the rear flank) seen in side-rear three-quarter view, parked on a dark brick-paved forecourt. Behind it is a dark grey concrete building with two tall garage-style windows on the left, lit warmly on the far left edge. On the right, a forest of conifers and a pale, hazy mountain rise under soft daylight. The car fills the centre of the frame and the lighting is low, warm sunlight from the left with cool shade across the paving. Dominant colours are black, charcoal, slate blue-grey and muted green. The image is a wide rectangular crop with slightly rounded corners, boxed rather than full-bleed, and its lower edge fades into a dark gradient overlay. Timeline: a thin mid-grey horizontal line with a filled grey circle at the left end, a small grey arrowhead at about 49% of the width, and a grey arrowhead at the right end. Three dark grey rectangular cards hold the numbers and labels described in the elements.
Slide 35
Model 3
1
DESIGN
ENGINEERING
MANUFACTURING
2
AUTOMATION
Visuals: One photograph: a dark blue sedan (Model 3) in three-quarter front view, driving left to right on a grey asphalt road, with a lane line running diagonally across the lower right. Behind it are a green grassy plain, pale blue mountain ranges on both sides and a clear pale blue sky with a soft gradient. Lighting is bright daylight from the upper left, with a slight motion blur on the background. The photo is boxed with square corners and its lower portion fades to black. A horizontal timeline rule in mid grey (#6B6E72), about 2 px thick, runs from a filled grey dot at the left to a small grey triangular arrowhead at the right. No other visuals.
Slide 36
Model 3 Production Hell
Visuals: Photograph of a Tesla Model 3 body-in-white on the assembly line. A dark grey car body shell with its doors open and bonnet raised sits in a red tubular steel frame fixture. Two yellow industrial robot arms (FANUC-style) stand at the left and right edges, with black hoses and cables. Bright yellow-green ratchet straps hang from the frame and hold the body. A red wheel-shaped fixture is at the left and a gold wheel-shaped fixture at the right. Behind are a grey ceiling with ductwork and light fittings, steel columns, wire-mesh cages and stacked cardboard boxes. The photo is in natural, even indoor lighting, with a slightly cool grey-white tone in the background. It is full-bleed and not cropped, with no tint or overlay. The dominant colours are red, yellow, yellow-green, grey and dark grey.
Slide 37
Cybertruck
STEEL EXOSKELETON
Visuals: Photograph of a silver Tesla Cybertruck in side profile, facing left, parked on a polished concrete floor in a dark studio space. The vehicle is centred horizontally, spanning roughly 21% to 81% of the slide width and from about 37% to 71% of the slide height, with the front headlight on the left casting a bright white beam across the floor and the rear taillight on the right glowing red. The left side of the frame has a bright white light beam and haze; the right side has a warm red glow and reddish haze on the floor. Dark charcoal concrete wall behind the vehicle with faint vertical panel seams. Lighting is low-key studio lighting with strong directional highlights. Dominant colours: steel grey #B8BEC4 on the body, near-black #1A1A1A on the wall and tyres, cool grey #8A9096 on the floor, red #C8102E accent at the taillight. Full-bleed, uncropped on the sides, no overlay or tint other than the vignette-like darkening at top.
Slide 38
Combining the Processes for the Future
1
DESIGN
ENGINEERING
MANUFACTURING
AUTOMATION
Visuals: One rounded rectangular panel (dark charcoal #121517, corner radius about 1% of slide width, no border, no shadow) holding a large numeral '1' in dark grey #2A2D30 and four centred labels. No photographs, charts, logos or icons.
Slide 39
Current Way of Assembling a Vehicle / Stamp / Body / Paint / Final Assembly
Visuals: Diagram: a linear process flow of four horizontal blue arrows, each a straight line with a solid triangular arrowhead at the right end, pointing right. Arrow 1 labelled 'Stamp' (short arrow, left); arrow 2 labelled 'Body' (short arrow); arrow 3 labelled 'Paint' (short arrow); arrow 4 labelled 'Final Assembly' (long arrow, spanning the right half). Arrows are not explicitly connected to shapes; they sit in sequence on one horizontal line at about 50% of slide height. Arrow colour light cornflower blue about #7A9CF0, stroke about 0.6% of slide height thick, arrowheads about 3% of slide height long. A very faint slightly lighter rectangle band (about #0A0A0A) sits behind the arrows, spanning roughly 3% to 97% horizontally and 47% to 57% vertically. No photographs, logos or icons.
Slide 40
Current Way of Assembling a Vehicle
Visuals: One photograph of a disassembled silver aluminium vehicle body shown as an exploded view. In the upper centre a roof and pillar section stands with its two curved roof rails rising upward; at the left a rear quarter panel and rear floor pan sit separately; at the right a front fender and front wheel arch section sit apart; the central side-body section, with door openings and a floor pan with battery-tray style cross members, sits low and forward, facing left. The subject is shown in a studio setting with a dark, reflective surface casting soft shadows beneath each part. Composition is wide and centred, the subject fills about 18% to 87% of the width and 20% to 88% of the height, and nothing is cropped. Lighting is a directional spotlight from above and the left, giving bright specular highlights on the metal and deep black shadows. Dominant colours are black #000000 and silver-grey #B8BCC2 with white highlights. The photograph is full-bleed behind all content, with no tint or overlay.
Slide 41
Current Way of Assembling a Vehicle
Visuals: Photographic-style 3D render of a red crossover SUV shown as an exploded assembly. Subject: a red body shell with side doors removed, a red hood/bonnet raised at the right-hand front, a red rear bumper cover floating at far right, a small red bracket at far left, and a black-grey roof and frame structure lifted above the shell (roof rails, pillars and cross bars). Below the car a dark grey floor pan and a light grey/silver cross member are shown separated from the body. Lighting is a single soft key light from above, creating glossy red highlights on the body and dark shadows underneath. Composition is a centred side-on view, full-bleed on black, not boxed and not cropped. Dominant colours: black background, saturated red #C8102E on body parts, dark grey #3A3D42 and silver #B8BCC2 on structural parts.
Slide 42
Structural Pack Sub-Assembly
Visuals: One photograph, full-bleed, landscape. Subject: two black leather-look car seats hang side by side from overhead pneumatic lift hoists in a factory assembly hall. Each seat is suspended from a silver hoist unit by a chain and hook, and each is held by an orange-red steel frame with a cross bar. Blue coiled pneumatic hoses run from the hoists. Two workers stand at the bottom corners: on the left, a worker in a black cap, black face mask, safety glasses and tan gloves is adjusting the left seat frame with one hand; on the right, a worker in a black cap, black face mask, safety glasses and tan gloves works at the right seat frame. Both wear black long-sleeved shirts. A black component tray sits on the floor between the seats. Yellow tags hang from the hoists. Visible signage reads KNIGHT GLOBAL 4110 SERIES, 450 LB / 204 KG CAPACITY, and KNIGHT GLOBAL on a rail in the centre background. Composition: symmetrical, centred on the two seats, with the ceiling rails converging toward a vanishing point at the centre. Framing is medium wide, with the workers cropped at the lower edge. Lighting: bright overhead fluorescent light, neutral and slightly cool. Dominant colours: grey and off-white ceiling and walls, black seats and clothing, orange-red frames, blue hoses. No overlay or tint; a soft darkening is visible at the top edge behind the title.
Slide 43
More People Can Work Simultaneously on Next Generation Vehicle
Model 3
Next Gen Vehicle
44%
Operator Density
Improvement
30%
Space Time
Efficiency
Improvement
Visuals: Two 3x3 dotted-line grids, both on black. Left grid (Model 3): a top-down greyscale render of a Model 3 car fills the centre and spans the middle row and middle column; four greyscale human figures in top-down view stand at the top, bottom, left and right of the centre cell, with their arms out. Right grid (Next Gen Vehicle): a greyscale top-down wireframe of a vehicle structure (skeleton chassis) fills the centre cell; four matching greyscale human figures stand at the top, bottom, left and right. Between the grids is a horizontal blue arrow with a solid triangular head pointing right, from the Model 3 grid towards the Next Gen Vehicle grid. Two statistics: 44% with caption 'Operator Density Improvement' and 30% with caption 'Space Time Efficiency Improvement'. No chart, table or logo.
Slide 44
Parallel & Serial Assembly / Left Side / Right Side / Floor / Stamp & Paint / Vehicle Assembly / Casting / Front / Rear / Other
Visuals: A flow diagram drawn in flat blue (#6B9BEA) arrows on a black-to-charcoal panel. Top row: a thick horizontal block arrow labelled Stamp & Paint points right into a gap; three thin diagonal arrows slope down-right from the labels Left Side, Right Side and Floor. Middle: one long thick horizontal arrow runs from about 43% to 72% of slide width, ending in a solid arrowhead, with the label Vehicle Assembly sitting above its right half. Bottom row: a thick horizontal block arrow labelled Casting points right into a gap; three thin diagonal arrows slope up-right toward the Vehicle Assembly line, labelled Front, Rear and Other from left to right beneath their start points. Arrowheads are solid triangles. No chart, table, photograph or icon.
Slide 45
Unboxed Process
Visuals: Illustration (3D render) of an electric vehicle being unboxed into its sub-assemblies, arranged in a loose cluster on a dark floor. Top row left to right: a blue front door and a second blue door with interior trim, shown open and floating; a blue-and-silver body shell (unibody) with the roof, pillars and rear quarter visible, seen from the side. Left: a white and grey rear section with a black tyre and red brake caliper, seen at an angle. Centre-lower: a white seat and grey floor pan with battery-tray frame, seen from above. Right: a dark grey front end with a crumpled bonnet area and a wheel with red brake caliper. Bottom right: a complete blue electric crossover body in side profile with black glass, shown fully assembled as the reference. Lighting is a soft spotlight from above producing a pale grey pool on the floor and soft cast shadows beneath each piece. Dominant colours are black, dark grey, metallic blue and white; the image is full-bleed within the black background with no border, crop or tint.
Slide 46
Unboxed Process
Visuals: Photograph-style 3D render of exploded car components on a black background with soft spotlight pools beneath each part. Six components: at left, a rear seat/rear bench assembly with white upholstery on a dark frame, with a red brake caliper visible on the wheel; at upper centre, a blue painted front door set with four open doors and door frames, lit with cast shadows below; at upper right, a blue and grey body shell (side frame of a vehicle with roof and pillars, unpainted sections in grey); at centre-lower, a white front seat mounted on a grey floor pan with a dark carpet area; at right edge, a damaged front end section with a grey bumper and a red brake caliper; at lower right, a complete blue vehicle body shell in side profile with glass and wheel arches, shown without wheels and with cast shadow beneath. Lighting is a single top-down spotlight creating a dark-grey shadowed floor; dominant colours are black, deep blue, white and grey, with red brake calipers as small accents. Parts are full-frame within the slide with no cropping of the slide edges and no boxes or overlays.
Slide 47
Next Generation Vehicle Manufacturing Efficiencies / >40% / Reduction In / Manufacturing / Footprint / LEGACY FOOTPRINT / NEW FOOTPRINT / Cost of Goods Sold / Car / Model 3/Y / Next Gen / Innovation & / Size / 50% / Reduction in Cost
Visuals: Two octagonal footprint diagrams and a bar chart. Footprint 1: a chamfered-corner octagon outlined in grey, filled dark charcoal, labelled LEGACY FOOTPRINT in the centre; it is full and unfilled-looking, indicating legacy size. Footprint 2: a chamfered-corner octagon outlined in grey with black interior, containing a blue chamfered-left-corner rectangle filling about half its width, labelled NEW FOOTPRINT in white capitals that overlaps the blue fill edge. Bar chart: vertical bar chart titled by its y-axis label Cost of Goods Sold / Car, with an arrowed y-axis and an arrowed x-axis, no numeric tick labels or scale. Category labels on the x-axis: Model 3/Y, Next Gen, and Innovation and Size placed above a grey bar. Series: Model 3/Y bar blue, about full height (about 100 units); Innovation and Size bar dark grey, about 60 percent of the Model 3/Y height, floating above the axis at its top; Next Gen blue bar about 45 percent of the Model 3/Y height. No legend. Thin grey dashed bracket lines on the left of the left stat and on the right of the chart, marking the 50 percent reduction between the Model 3/Y bar top and the Next Gen bar top.
Slide 48
02 / Powertrain / Colin Campbell
Visuals: One illustration-style graphic: a circular dial about 25% of slide width, made of about 12 short grey segments (grey #6B6B6B, stroke about 0.6% of slide height, rounded caps) evenly spaced around the circumference with small gaps between them. A bright white-blue arc (#E8F0FF core, glowing light blue #8FB8FF edge) covers the upper-right quadrant, running from about 12 o'clock to about 3 o'clock, with a soft glow. The inside of the ring is empty. Background is a dark woven or grid-textured pattern of fine blue-grey lines, full-bleed, with a faint vignette darkening toward the right edge. No photographs, logos or icons.
Slides 49 to 169 continue in the full text file.
Download this deck
The hosted PDF of every library deck is free for readers of the SlideDeck Co newsletter. Join with your email and the viewer and download appear here.
Preparing a results presentation or business update of your own? The SlideDeck Co Standard Deck is a slide library for business reviews, updates and plans.







