The deck opens on a title slide for the Third Quarter 2015 Earnings Call, presented by Jeff Woodbury, Vice President of Investor Relations, on October 30, 2015. It is followed by a long cautionary statement on forward-looking information and frequently used terms, then a headlines slide summarising third quarter earnings of $4.2 billion and the quarter's main points. The middle sections cover the business environment, financial results, and sources and uses of funds, then earnings and volume comparisons for Upstream, Downstream and Chemical against both 3Q14 and 2Q15. A business fundamentals slide covers cost management and reliability, followed by project updates and new opportunity growth, selective investments in Downstream, and year-to-date sources and uses of cash. The deck closes with a summary slide and a questions slide. Many of the content slides use waterfall charts that show each driver of change as a bar between two totals, so the reader can follow the movement from one quarter to the next. Slides 11 and 12 are good examples, with a clear headline sentence above a single chart.
Slides worth studying
- Slide 7: A waterfall chart runs from 3Q14 earnings to 3Q15 with each segment colour-coded, so the total change is readable at a glance.
- Slide 9: The headline sentence states the conclusion and the chart beneath it isolates the realization effect as the dominant bar.
- Slide 3: Four short bullet headlines with generous spacing give a clean one-idea-per-line summary of the quarter.
Details
- Company: ExxonMobil
- Year: 2015
- Type: Investor presentation
- Industry: Oil and gas
- Pages: 23
The hosted copy of this deck is being prepared. Newsletter readers will find the download here.
Review score: 7 out of 10, Effective
Presentation quality, judged with the SlideDeck Co review heuristic. Ask, evidence and idea merit are not rated here.
The strength is the results section from slide 7 to slide 16, where each page has a segment eyebrow, a title naming the two periods, one sentence that states the change with its figure, and one waterfall with every bar labelled. Slide 7 says earnings decreased $3.8B and shows 8,070 falling to 4,240 by segment, and slide 11 names foreign exchange and the absence of tax items as the reason for the 550 Other bar. The bottleneck is what the deck leaves out and how thin it gets after slide 16. There is no outlook page, slides 5, 6 and 22 give single-period tables with no comparison column, and the market cost savings chart on slide 17 shows ranges up to 50% with no period, source or definition. Slides 18 to 20 are a photo beside three to six bullets, and the headlines on slide 3 are slogans apart from the $4.2 billion figure.
Worth keeping: Keep the one-sentence finding with its figure above each waterfall, as on slides 7, 9 and 13.
Most useful repair: Add a prior-period column to the table on slide 5 and give the chart on slide 17 a period, a source and a definition of what the percentage ranges measure.
What would change the score: If the call's spoken remarks supplied the outlook and the company's separate supplement supplied the comparisons, a live listener lost little; the score assumes the slides are also read alone.
Confidence high. 23 of 23 pages inspected on contact sheets, 12 at readable size. Reviewed 2026-11-15. Model-assisted review (claude-fable-5-2, in session).
Full text of the slides (23 slides)
Every slide's words and a description of its charts and images, so the deck can be searched and rebuilt. Also available as Markdown.
Slide 1
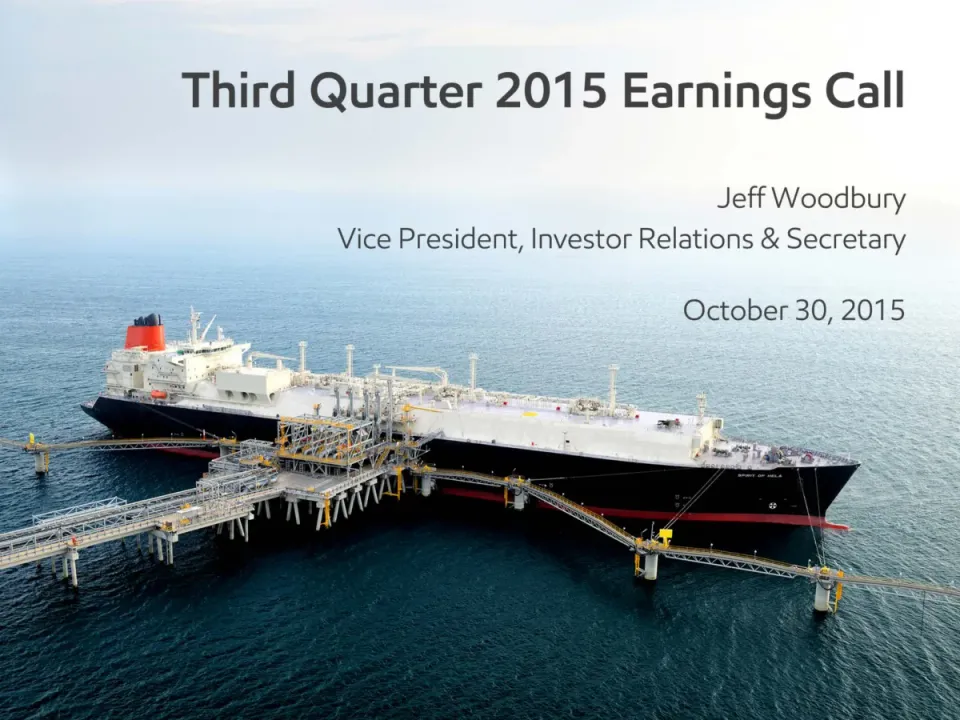
Third Quarter 2015 Earnings Call
Jeff Woodbury
Vice President, Investor Relations & Secretary
October 30, 2015
SPIRIT OF HELA
Visuals: One photograph, full-bleed: an aerial three-quarter view of the LNG carrier SPIRIT OF HELA moored alongside an offshore LNG transfer terminal. The ship has a black hull with a red boot-top stripe, a white superstructure and deck, a red-topped funnel at the bow-left, and a white deckhouse midship. Pale yellow-railed steel gangways and trestles run from the terminal platform to the ship and out to the right and left edges of the frame. The sea is deep teal-blue at the bottom and lighter blue-grey toward the horizon. The sky is pale hazy white-blue at the top and fades to near-white at the top right. The image is not cropped in a visible way and has no tint, border, or overlay beyond the natural haze.
Slide 2
Cautionary Statement
• Forward-Looking Statements. Outlooks, expectations, forecasts, estimates, targets, business plans, and other statements of future events or conditions in this presentation or the subsequent discussion period are forward-looking statements. Actual future results, including financial and operating performance; demand growth and mix; ExxonMobil's volume/production growth and mix; the amount and mix of capital expenditures; resource additions and recoveries; finding and development costs; project plans, timing, costs, and capacities; drilling programs; product sales and mix; dividend and share purchase levels; cash and debt balances; corporate and financing expenses; and the impact of technology could differ materially due to a number of factors. These include changes in oil or gas prices or other market conditions affecting the oil, gas, and petrochemical industries; the occurrence and duration of economic recessions; reservoir performance; the outcome of exploration; timely completion of development projects; war and other political or security disturbances; changes in law or government regulation, including sanctions as well as tax and environmental regulations; the outcome of commercial negotiations; opportunities for investments or divestments that may arise; the actions of competitors and customers; unexpected technological developments; unforeseen technical difficulties; and other factors discussed here and under the heading "Factors Affecting Future Results" in the Investors section of our Web site at exxonmobil.com. See also Item 1A of ExxonMobil's 2014 Form 10-K. Forward-looking statements are based on management's knowledge and reasonable expectations on the date hereof, and we assume no duty to update these statements as of any future date.
• Frequently Used Terms. References to resources, the resource base, barrels of oil, volumes of gas and liquids, and similar terms include quantities that are not yet classified as proved reserves under SEC definitions but that we believe will likely be developed and moved into the proved reserves category in the future. Shareholder distributions referred to in this presentation mean cash dividends plus shares purchased to reduce shares outstanding (excluding anti-dilutive purchases). For definitions and more information regarding resources, reserves, cash flow from operations and asset sales, free cash flow, and other terms used in this presentation, including information required by SEC Regulation G, see the "Frequently Used Terms" posted on the Investors section of our Web site and the additional information provided in this presentation and in the 8-K filed today with our earnings press release and IR supplement. The Financial and Operating Review on our Web site also shows ExxonMobil's net interest in specific projects.
• The term 'project' as used in this presentation can refer to a variety of different activities and does not necessarily have the same meaning as in any government payment transparency reports.
ExxonMobil
2
Visuals: Decorative header band only: a blue gradient bar across the top of the slide with faint concentric wave or grid lines on its right half. It contains no chart, table, photograph or diagram. The ExxonMobil red wordmark at bottom right is the only logo. The page number is a text element, not an image.
Slide 3
Headlines
Third quarter earnings of $4.2 billion
■ Relentless focus on business fundamentals, including cost management
■ Delivering on our investment and operating commitments
■ Downstream and Chemical results underscore resilience of integrated model
■ YTD Cash flow from operations and asset sales $27.6B1; positive free cash flow
1 Includes Proceeds Associated with Asset Sales of $1.6B
3
Visuals: Decorative header band: a horizontal gradient from deep blue (left) to bright cyan-blue (right) across the top of the slide, with a fine concentric-circle line pattern in lighter blue and white on the right half, full width and about 13% of slide height. Small black square bullet glyphs before each of the four bullet lines. One logo: the red ExxonMobil wordmark at bottom right. No charts, photographs or tables.
Slide 4
Business Environment / Global economic growth slowed during the third quarter / U.S. growth tapered / China continued to decelerate, and recovery in Japan remained weak / Europe’s economy stabilized / Crude oil prices resumed decline / Global refining margins strengthened / Chemical commodity and specialty margins improved / ExxonMobil / 4
Visuals: Decorative header image only: a full-slide picture whose top band is a horizontal blue gradient, darker blue (about #0A4A9E) at the left fading to a brighter cyan-blue (about #1AA3E0) at the right, overlaid with a fine pattern of thin white concentric arcs that radiate from the right edge and fade toward the left. Below the band the picture is plain white. The ExxonMobil logo is the only other graphic: the word ExxonMobil in bold red sans-serif (about #E4002B) with a stylised red X crossing the letters x and o. Nothing else is pictorial; there are no charts, tables or photographs.
Slide 5
3Q15 Financial Results
Earnings
Earnings Per Share - Diluted (dollars)
Shareholder Distributions
CAPEX
Cash Flow from Operations and Asset Sales¹
Cash
Debt
4.2
1.01
3.6
7.7
9.7
4.3
34.3
Billions of dollars unless specified otherwise
¹ Includes Proceeds Associated with Asset Sales of $0.5B
ExxonMobil
5
Visuals: Table with 7 rows and 2 columns, no header row. Column 1 labels: Earnings; Earnings Per Share - Diluted (dollars); Shareholder Distributions; CAPEX; Cash Flow from Operations and Asset Sales (superscript 1); Cash; Debt. Column 2 values in black cells: 4.2; 1.01; 3.6; 7.7; 9.7; 4.3; 34.3. Thin black horizontal rules separate each row across the label column only. Row values are billions of dollars except EPS (dollars). Footnote 1 reads Includes Proceeds Associated with Asset Sales of $0.5B. No charts, photographs or icons on the body; the header band carries a blue gradient with faint concentric arc texture on its right half. ExxonMobil wordmark logo in red at bottom right.
Slide 6
3Q15 Sources and Uses of Funds
Cash balances decreased by $100M in the third quarter
Beginning Cash¹
Earnings
Depreciation
Working Capital / Other
Proceeds Associated with Asset Sales
PP&E Adds / Investments and Advances²
Shareholder Distributions
Debt / Other Financing
Ending Cash
4.4
4.2
4.6
0.4
0.5
(6.2)
(3.6)
0.0
4.3
9.7
Billions of dollars
1 Beginning balance includes restricted cash of $0.1B
2 Includes PP&E Adds of ($6.4B) and net advances of $0.2B
ExxonMobil
6
Visuals: Table with 2 columns and 11 rows. Left column: row labels. Right column: values in white bold numerals on a solid black block. Rows in order: Beginning Cash¹ 4.4; Earnings 4.2; Depreciation 4.6; Working Capital / Other 0.4; Proceeds Associated with Asset Sales 0.5; PP&E Adds / Investments and Advances² (6.2); Shareholder Distributions (3.6); Debt / Other Financing 0.0; Ending Cash 4.3. Values are in billions of dollars. A thin dark grey curly brace spans the four rows Earnings through Proceeds Associated with Asset Sales (values 4.2, 4.6, 0.4, 0.5) and points to the label 9.7 at its right, the sum of those four values. Beginning Cash and Ending Cash labels are bold; the other labels are regular. Footnote superscripts 1 and 2 mark the two notes. The ExxonMobil wordmark in red with a stylised X is the only logo.
Slide 7
Total Earnings – 3Q15 vs. 3Q14
Earnings decreased $3.8B due to lower Upstream earnings, partially offset by
stronger Downstream results and lower corporate costs
Millions of Dollars
8,070
(5,058)
1,009
27
192
4,240
3Q14
U/S
D/S
Chem
C&F
3Q15
ExxonMobil
7
Visuals: One waterfall (bridge) chart titled 'Millions of Dollars' (unit label above the plot, no axis numbers, no gridlines, no y-axis scale, no legend). Horizontal category axis along a thin grey baseline at about 84% of slide height, spanning x 10.6% to 89.5%. Six columns, each with its printed value above or on it: 3Q14 total bar blue #0070C0 printed 8,070, rising from baseline to about 44% of slide height; U/S negative bar red #C00000 printed (5,058), floating from about 44% to 69%; D/S positive bar green #009900 printed 1,009, floating from about 64% to 69%; Chem thin green bar printed 27, about 64%; C&F green bar printed 192, floating about 63% to 64%; 3Q15 total bar blue #0070C0 printed 4,240, rising from baseline to about 63%. Bars are solid, flat, square-cornered, with no shadows; the connector lines between bars are absent. Value labels are dark grey #595959 bold Calibri above each bar; the category labels are dark grey #595959 regular Calibri under the baseline. Highlighted points: none beyond the colour coding (blue totals, red decrease, green increases). The ExxonMobil logo is a red (#E30613) wordmark with a stylised red X in the middle of the word.
Slide 8
Total Earnings – 3Q15 vs. 2Q15
Earnings comparable to 2Q15 as lower Upstream earnings offset stronger
Downstream results and lower corporate costs
Millions of Dollars
4,190
(673)
527
(19)
215
4,240
2Q15
U/S
D/S
Chem
C&F
3Q15
ExxonMobil
8
Visuals: Waterfall chart titled implicitly by the header, with the unit label 'Millions of Dollars' centred above the plot. Vertical value axis is not printed. Horizontal baseline is a thin grey line under the bars. Categories left to right: 2Q15 (total bar, printed value 4,190, blue #0070C0, from baseline to about 4,190 height); U/S (decrease, printed value (673), red #C00000, floating below the 2Q15 level, about 673 units tall); D/S (increase, printed value 527, green #009900, floating, about 527 units tall); Chem (decrease, printed value (19), thin red #C00000 bar, about 19 units, nearly flat); C&F (increase, printed value 215, green #009900, about 215 units tall); 3Q15 (total bar, printed value 4,240, blue #0070C0, rising to about 4,240). Value labels sit above each bar in dark grey #404040 bold Calibri. Category labels sit below the baseline in dark grey #595959 regular Calibri. No legend. No axis ticks or range printed; values for bar heights are about proportional to printed values. No highlighted points beyond the colour coding of blue totals, red decreases and green increases. The ExxonMobil wordmark is a red logo (#E4002B) with a stylised X.
Slide 9
Upstream / Earnings – 3Q15 vs. 3Q14 / Earnings down $5.1B due to lower realizations, partly offset by favorable / volume / mix effects / Millions of Dollars / 6,416 / (5,100) / 110 / (70) / 1,358 / 3Q14 / Realization / Vol/Mix / Other / 3Q15 / ExxonMobil / 9
Visuals: Waterfall chart, title 'Millions of Dollars' centred above the bars, unit millions of US dollars, no visible axis scale or gridlines. Five columns read left to right: 3Q14 = 6,416 (blue bar, full height from baseline, about 40% of slide height); Realization = (5,100) (red floating bar from about 6,416 down to about 1,316, labelled above as (5,100)); Vol/Mix = 110 (thin green bar, label above); Other = (70) (thin red bar, label above); 3Q15 = 1,358 (blue total bar from baseline, label above). Values are printed on the slide, so no estimates are needed beyond bar heights, which are drawn to scale. No legend. No highlighted points. Logo: ExxonMobil wordmark in red, bottom right, with the 'X' stylised as a crossed double-stroke.
Slide 10
Upstream / Volumes – 3Q15 vs. 3Q14 / Volumes increased 2.3%: Liquids +266 kbd, natural gas -1.1 bcfd / koebd / 100 / (17) / 4 / 3,831 / 3,918 / Price, Spend, & Other: +132 / Net Interest: -32 / Liquids: +155 / Gas: -151 / 3Q14 / Entitlements / Divestments / Growth/Other / 3Q15 / ExxonMobil / 10
Visuals: Waterfall bar chart titled 'koebd' (thousand oil-equivalent barrels per day), centred above the bars at about 46.8% x. No y-axis or scale is shown and no axis ranges are printed. Series, left to right: 3Q14 total bar labelled 3,831 (blue, full height from baseline); Entitlements floating increment labelled 100 (green thin bar), with annotation 'Price, Spend, & Other: +132' and 'Net Interest: -32' beneath it; Divestments decrement labelled (17) (red thin bar); Growth/Other increment labelled 4 (green thin line), with annotation 'Liquids: +155' and 'Gas: -151' beneath it; 3Q15 total bar labelled 3,918 (blue, full height). No legend. No points are highlighted beyond the colour coding: blue totals, green increases, red decrease. Bars are flat with no shadows or gradients. The header band contains a decorative blue-to-light-blue gradient with fine concentric ring/wave line pattern, bright at the right edge.
Slide 11
Upstream
Earnings – 3Q15 vs. 2Q15
Earnings decreased $673M, as lower liquids realizations were partly offset by favorable foreign exchange impacts and the absence of unfavorable tax items
Millions of Dollars
2,031
(1,190)
(30)
550
1,358
2Q15
Realization
Vol/Mix
Other
3Q15
ExxonMobil
11
Visuals: One waterfall (bridge) chart titled 'Millions of Dollars', centred above the bars. Categories left to right: 2Q15, Realization, Vol/Mix, Other, 3Q15. Values: 2Q15 = 2,031 (blue bar, rising from baseline to the top of the bar); Realization = (1,190) (red floating bar, decrease, spanning from about the 2,031 level down to about 841); Vol/Mix = (30) (thin red floating bar, decrease, about 30 units tall, sitting just under the Realization bar's lower edge); Other = 550 (green floating bar, increase, spanning from about 811 up to about 1,361); 3Q15 = 1,358 (blue bar from baseline to the top). Value labels sit above each bar in dark grey bold numerals, with parentheses for negatives. The vertical axis has no printed tick labels or range; bar heights are proportional to values, so the axis is about 0 to 2,100 (estimate). No legend; no gridlines; a thin grey horizontal baseline runs under all bars. No highlighted points beyond the colour coding (blue totals, red decreases, green increase). Chart is flat, with no shadows or 3D effects. The ExxonMobil wordmark in red is the only logo.
Slide 12
Upstream
Volumes – 3Q15 vs. 2Q15
Volumes decreased 1.5%: Liquids +40 kbd, natural gas -604 mcfd
koebd
3,979
(30)
Price, Spend, / & Other: -26 / Net Interest: -4
(4)
(27)
Liquids: +35 / Gas: -62
3,918
2Q15
Entitlements
Divestments
Growth/Other
3Q15
ExxonMobil
12
Visuals: Waterfall (bridge) chart titled 'koebd' (thousand oil-equivalent barrels per day), centred above the bars in grey. No axis scale or gridlines are printed. Columns left to right: 2Q15 total bar, solid blue #0070C0, labelled 3,979, height about 38% of slide height; Entitlements floating negative step, red #C00000 bar, labelled (30), with sub-labels 'Price, Spend, & Other: -26' and 'Net Interest: -4' printed beneath it, bar about 11% of slide width; Divestments negative step, thin red #C00000 line, labelled (4), no sub-label; Growth/Other negative step, red #C00000 bar, labelled (27), with sub-labels 'Liquids: +35' and 'Gas: -62' beneath it; 3Q15 total bar, solid blue #0070C0, labelled 3,918, about 37% of slide height. Totals bars are about equal width. Negative steps are shown as red bars sitting at the top of the preceding level; the bars are drawn on a shared horizontal baseline (thin grey #7F7F7F line). No legend. No highlighted points beyond the red negative steps. Values are printed, so no estimates are needed.
Slide 13
Downstream
Earnings – 3Q15 vs. 3Q14
Earnings increased $1.0B due to stronger refining margins, partially offset by
higher maintenance
Millions of Dollars
1,400
(280)
(110)
2,033
1,024
3Q14
Margins
Vol/Mix
Other
3Q15
ExxonMobil
13
Visuals: Waterfall chart titled 'Millions of Dollars' (unit subtitle centred above the bars, grey Calibri). Values in millions of dollars, no value axis or gridlines printed; bars are labelled with their values. Categories left to right: 3Q14 = 1,024 (blue bar, total, from baseline up to about 67% height); Margins = +1,400 (green bar, increase, floating from the top of 3Q14 level to about 44% height); Vol/Mix = (280) (red bar, decrease, about 44% to 49% height); Other = (110) (red bar, decrease, about 49% to 51% height); 3Q15 = 2,033 (blue bar, total, from baseline to about 51% height). Highlighted points: none beyond colour coding (green increase, red decreases, blue totals). No legend. Baseline is a thin grey horizontal line across the bottom of the plot. Bars are flat rectangles with no shadows. ExxonMobil wordmark logo in red, the X rendered as a stylised crossed glyph, bottom right.
Slide 14
Downstream / Earnings – 3Q15 vs. 2Q15 / Earnings increased $527M on stronger margins and lower maintenance / Millions of Dollars / 1,506 / 320 / 270 / (60) / 2,033 / 2Q15 / Margin / Vol/Mix / Other / 3Q15 / 14 / ExxonMobil
Visuals: Waterfall chart, title Millions of Dollars (centred above the plot, about 33% from top). Categories left to right on the horizontal axis: 2Q15, Margin, Vol/Mix, Other, 3Q15; no numeric axis or gridlines shown. Values in millions of dollars: 2Q15 = 1,506 (total bar, blue, floating from baseline to about 59% height); Margin = +320 (green floating bar, from about 59.5% to 54.2% height); Vol/Mix = +270 (green floating bar, from about 54.3% to 49.8% height); Other = (60) (red floating bar, thin, from about 49.8% to 50.8% height); 3Q15 = 2,033 (total bar, blue, from baseline to about 50.7% height). Bar heights are proportional to the values; the 2Q15 and 3Q15 totals are the tallest bars. Each bar is about 11.3% of slide width wide, with equal gaps. Data labels sit centred above each bar in dark grey bold numerals. Legend: none. Highlighted points: none beyond colour coding (blue totals, green increases, red decrease). Logo: ExxonMobil wordmark in red at bottom right.
Slide 15
Chemical / Earnings – 3Q15 vs. 3Q14 / Earnings comparable to 3Q14 with stronger margins offset by unfavorable foreign exchange effects / Millions of Dollars / 1,200 / 210 / 30 / (210) / 1,227 / 3Q14 / Margin / Vol/Mix / Other / 3Q15 / ExxonMobil / 15
Visuals: Chart: waterfall (bridge) chart, title 'Millions of Dollars' centred above the bars, no axes or gridlines shown. Units: millions of US dollars. Categories left to right: 3Q14, Margin, Vol/Mix, Other, 3Q15. Series values: 3Q14 = 1,200 (blue total bar, full height from baseline, top at about 52% of slide height); Margin = +210 (green floating bar, about 5.8% of slide height, labelled '210' above); Vol/Mix = +30 (green floating bar, about 0.8% of slide height, labelled '30' above); Other = (210) (red floating bar, about 5.7% of slide height, labelled '(210)' above); 3Q15 = 1,227 (blue total bar, top at about 51% of slide height, labelled '1,227' above). Value labels are bold grey, category labels bold grey below a thin grey horizontal baseline. No legend. No highlighted points beyond the colour coding: blue for totals, green for increases, red for the decrease. Logo: ExxonMobil wordmark in red at bottom right.
Slide 16
Chemical
Earnings – 3Q15 vs. 2Q15
Earnings flat sequentially with stronger margins and favorable sales mix offset by the absence of asset management gains
Millions of Dollars
2Q15
Margin
Vol/Mix
Other
3Q15
1,246
160
40
(220)
1,227
ExxonMobil
16
Visuals: One waterfall chart titled 'Millions of Dollars' (units: millions of US dollars; no axes or gridlines shown; baseline at zero; no legend). Five columns left to right: 2Q15 total bar blue at 1,246 (about 1,246 by bar height); Margin floating green bar labelled 160 rising from 1,246; Vol/Mix floating green bar labelled 40 (thin bar) rising from 1,406 to 1,446; Other floating red bar labelled (220) falling from 1,446 to 1,226; 3Q15 total bar blue at 1,227. Bars are approximately 11.3% of slide width each, evenly spaced. Value labels sit above each bar in dark grey bold numerals. Category labels sit below the baseline in dark grey. Also one ExxonMobil wordmark logo in red bottom right and a blue wave-pattern header band (illustration) at the top.
Slide 17
Business Fundamentals / Relentless focus regardless of commodity prices / Market Cost Savings / ■ Operational integrity / ■ Maximize reliability / ■ Cost management / ● $8 billion YTD net reduction in capital and cash operating costs / ● Upstream unit cost down 10% / ■ Superior project execution / ExxonMobil / 17
Visuals: Floating-bar (range) column chart titled Market Cost Savings. Y axis: Percent, 0% to 50%, gridlines every 10%. X axis: categories Offshore Rigs, Energy, Base Metals, U.S. Onshore D&C, Drilling Services, Engineering Services, Oilfield Chemicals, Craft Labor, labels rotated about 45 degrees. Each bar is a vertical blue gradient (light cyan #CFEFFB at the ends fading to saturated blue #0A9BE0 in the middle) spanning a range, with no printed values; estimates: Offshore Rigs about 20% to 52%, Energy about 20% to 50%, Base Metals about 14% to 43%, U.S. Onshore D&C about 20% to 40%, Drilling Services about 10% to 25%, Engineering Services about 1% to 9%, Oilfield Chemicals about 4% to 9%, Craft Labor about 0% to 5%. No legend; no highlighted points. Bullets are black filled squares for top-level items and black filled circles for sub-items. ExxonMobil wordmark logo in red, bottom right.
Slide 18
Upstream / Projects Update / Demonstrating world-class project development capabilities / Erha FPSO, offshore Nigeria / 21 Major project start-ups since 2012 / Added +750 KOEBD of working interest production capacity / Achieving strong reliability / PNG LNG capacity up to 7.3 MTA / Two capital-efficient projects completed 3Q: / Nigeria: Erha North Phase 2 / Norway: Aasgard Subsea Compression / Banyu Urip CPF starting up by year end / 18
Visuals: One photograph: an offshore floating production vessel (FPSO) named Erha FPSO at sea offshore Nigeria. The hull is a red upper band over a blue lower band, with the text ERHA FPSO painted small on the red hull. A tall red and white lattice derrick tower stands at the left, with yellow cranes and a dense grey and yellow process-equipment deck in the centre and right. The vessel is seen side-on from a low sea-level viewpoint, centred in its box, fully in frame with sky occupying the upper half. Lighting is flat overcast daylight. Dominant colours are grey-white sky, red, blue and yellow. The photo is a sharp rectangular box with square corners, not cropped, not full-bleed, with no overlay or tint. One logo: the ExxonMobil wordmark in red at bottom right.
Slide 19
Upstream
New Opportunity Growth
Highgrading the resource base through new opportunity captures
■ Guyana: large 3D seismic underway
■ Nigeria: secured two high-potential blocks
■ Permian: acquired interest in 48,000 acres
3D Seismic acquisition offshore Guyana
ExxonMobil
19
Visuals: One photograph and one logo. Photograph: an aerial, nadir-to-oblique view of open deep-blue ocean showing a large offshore seismic survey vessel at the upper-left edge of the frame, with a long thin towed cable line running from its stern to the right edge; the vessel's wake is pale turquoise foam trailing diagonally down-right toward the centre. Three white-foamed seismic streamer/tow-boat wakes and small boats appear in the lower-right quadrant, and a small yellow vessel or buoy sits near the lower-right edge and another small yellow object near bottom-centre. Composition: landscape, wide frame showing mostly open water with the vessel small in the upper-left; the image is a rectangle with square corners, not cropped to a shape, and is boxed with white margin on the slide. Lighting: bright daylight, high sun, saturated blues. Dominant colours: deep blue #1A3F8F to #2A5FB0 water, white #FFFFFF foam, pale turquoise #7FD3E8 wake. No overlay or tint. Logo: ExxonMobil wordmark in red at bottom-right, with the 'x' rendered as a stylised crossed mark; dominant red #ED1C24 with black-free lettering.
Slide 20
Downstream / Selective Investments / Growing higher-value products / ■ Rotterdam hydrocracker / ● High performance lubricant basestocks and ultra-low sulfur diesel / ● Integrated investment at advantaged site / ● 2018 start-up / ■ Singapore synthetic lubricant oil blending plant / ● Manufacture Mobil 1 in Asia / ● Supports growing demand / ● 2017 start-up / Rotterdam Refinery is a world-scale, integrated complex / 20 / ExxonMobil
Visuals: One photograph and one logo. Photograph: a petrochemical refinery at blue hour (dusk), viewed from a low elevated angle across the complex; tall dark distillation columns and towers rise from the centre and right, dense networks of pipes, stairs and railings, and many lit process units glowing yellow-white and orange against a deep blue sky with streaked clouds; a lit storage tank and a grey box-like structure sit in the lower foreground. Composition: landscape, the towers form vertical lines across the frame, the foreground is in shadow. Lighting: artificial sodium and white lights from the plant against blue twilight sky. Dominant colours: deep blue #1E3A6E, warm yellow #F5C451, near-black #1A1A1A. The photo is a full rectangular box, not cropped, not full-bleed, with no overlay or tint. Logo: the red ExxonMobil wordmark with a stylised red X crossing the 'x' of 'Exxon'; red #E31837.
Slide 21
YTD Sources and Uses of Cash
Integrated cash flows support distributions and fund investments
$B
35
30
Cash Draw $0.4
Debt & Other Financing $3.7
Asset Sales $1.6
25
20
Cash Flow From Operations $26.0
15
PP&E Adds / Investments and Advances² $20.2
10
Shareholder Distributions $11.5
5
0
Sources of Cash
Uses of Cash
■ Financial flexibility to invest through cycle
■ Dividends per share up 5.8% vs. 3Q14
■ Buyback program maintained
■ $7.4 billion YTD Free Cash Flow¹
¹ Calculated as Cash Flow from Operations and Asset Sales ($27.6B) less PP&E Adds / Investments and Advances ($20.2B)
² Includes PP&E Adds of ($20.4B) and net advances of $0.2B
21
ExxonMobil
Visuals: Stacked column chart. Y-axis labelled '$B' at top, linear scale from 0 to 35 with ticks at 0, 5, 10, 15, 20, 25, 30, 35. Two columns with category labels 'Sources of Cash' (left) and 'Uses of Cash' (right). Sources of Cash column, bottom to top: Cash Flow From Operations $26.0 (about 0 to 26, dark blue #0D4DA1), Asset Sales $1.6 (about 26 to 27.6, medium blue #3A7BD5), Debt & Other Financing $3.7 (about 27.6 to 31.3, light blue #8DB4F0), Cash Draw $0.4 (about 31.3 to 31.7, navy #0A2A66 thin top band). Uses of Cash column, bottom to top: Shareholder Distributions $11.5 (about 0 to 11.5, dark green #006600), PP&E Adds / Investments and Advances² $20.2 (about 11.5 to 31.7, bright green #33CC33). Value labels sit to the right of each segment. No legend; segments labelled inside or beside. No highlighted points. Bullet markers are solid black squares. The ExxonMobil logo is red wordmark #E00000 with a stylised X. The background band contains a blue gradient with a faint concentric-ring pattern on the right.
Slide 22
Summary
Delivering on our investment and operating commitments
Billions of dollars / unless specified otherwise
YTD15
Highlights
Earnings
13.4
Upstream Production (MOEBD)
4.0
Cash Flow from Operations and Asset Sales 1
27.6
Free Cash Flow 2
7.4
Shareholder Distributions
11.5
Capturing Downstream & Chemical value
Superior project execution capabilities
Continued investment and cost discipline
Positive free cash flow
1 Includes Proceeds Associated with Asset Sales of $1.6B
2 Calculated as Cash Flow from Operations and Asset Sales ($27.6B) less PP&E Adds / Investments and / Advances ($20.2B)
ExxonMobil
22
Visuals: One table with two columns and five data rows, plus a header row. Header row: left cell italic 'Billions of dollars unless specified otherwise', right cell bold 'YTD15'. Rows: Earnings 13.4; Upstream Production (MOEBD) 4.0; Cash Flow from Operations and Asset Sales (superscript 1) 27.6; Free Cash Flow (superscript 2) 7.4; Shareholder Distributions 11.5. Label column is white with bold dark grey text; value column is solid black with bold white numerals. Black horizontal rules separate rows and frame the table. No chart, photograph, or diagram. The header band is a decorative blue gradient with faint concentric wave lines at right. Highlights list uses four black square bullets. Logo: ExxonMobil wordmark in red.
Slide 23
Questions
Visuals: One full-bleed photograph of an industrial gas processing or compression plant, seen from a raised angle in daylight. Three tall silver-grey stacks with open lattice caps and yellow-railed platforms rise along the back, with a white equipment house at the centre-right and a long grey deck with yellow handrails in the foreground. Pipes, valves, cable trays and steel framing fill the lower half. The sky is blue with broken white and grey cumulus clouds. Lighting is flat, even daylight with high contrast in the clouds. Dominant colours are blue sky (about #3F7CC0), silver-grey steel (about #9AA3AB) and safety yellow (about #F2C200). The photo is not cropped, boxed or tinted, and no overlay is applied. In the file, a black ArialMT bullet and a black Calibri text box reading 'QuesCons' sit at the title area's lower position but are not visible in the render.
Download this deck
The hosted PDF of every library deck is free for readers of the SlideDeck Co newsletter. Join with your email and the viewer and download appear here.
Preparing a results presentation or business update of your own? The SlideDeck Co Standard Deck is a slide library for business reviews, updates and plans.