
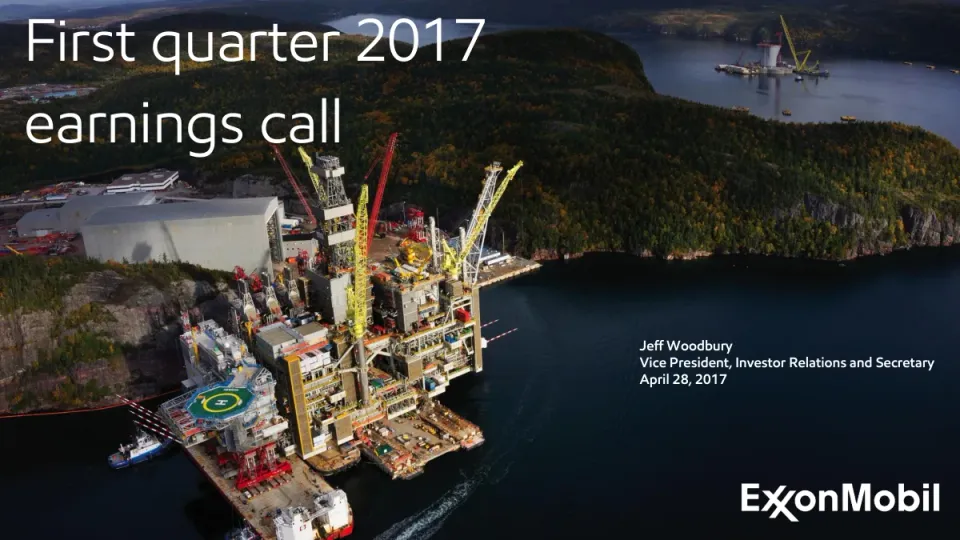
The deck opens with a title slide for the first quarter 2017 earnings call, presented by Jeff Woodbury, Vice President of Investor Relations, on April 28, 2017. A long forward-looking statements and frequently used terms disclaimer follows. Next come a headlines slide and a business environment slide covering the global economy, oil prices and the rig count. The financial section includes a results table and a sources and uses of cash waterfall. Earnings are then broken down by business segment, comparing the first quarter of 2017 with the year-earlier quarter and the prior quarter, with bridge charts for upstream, downstream and chemical results. Upstream volumes receive their own pair of bridges. The closing section covers strategic growth, including a gas acquisition in Area 4 and several value chain projects, followed by a summary of value growth and a question and answer slide. The deck relies on bar and waterfall charts, tables and large photographs of industrial sites, with each slide headed by a short takeaway statement.
Slides worth studying
- Slide 4: A line chart of Brent crude prices sits beside a short bulleted list of economic observations, pairing data with a plain takeaway.
- Slide 7: A waterfall chart bridges quarterly earnings from the prior year to the current one, with green and red bars making the direction of each segment change clear at a glance.
- Slide 10: A volume waterfall in thousands of barrels of oil equivalent per day uses small annotations beneath the bars to explain the liquids and gas components of each change.
- Slide 19: A summary slide places key figures in a column on the left while the four takeaways stack on the right, giving a clear closing message.
Details
- Company: ExxonMobil
- Year: 2017
- Type: Investor presentation
- Industry: Energy
- Pages: 20
The hosted copy of this deck is being prepared. Newsletter readers will find the download here.
Review score: 7 out of 10, Effective
Presentation quality, judged with the SlideDeck Co review heuristic. Ask, evidence and idea merit are not rated here.
The strength is honest handling of a distorted comparison: slides 8 and 11 add a '4Q16 Ex-Impairment' bar (3,707 against a reported 1,680, and 1,385 against (642)) with a footnote naming the $2B Upstream impairment, so the sequential bridge is not flattered by a one-off. Each change slide carries a plain subtitle such as 'Volumes down 4%: Liquids -205 kbd, natural gas +184 mcfd' on slide 10, and slide 17 gives the Mozambique deal a map with a legend and the price of $2.8 billion. The bottleneck is that about half of every waterfall slide from 7 to 16 is a decorative photograph, which shrinks the exhibit and leaves no room to explain the Other bars (300 on slide 11, (110) on slide 15). The headlines on slide 3 are qualitative apart from 'First quarter earnings of $4 billion', there is no outlook slide, and the footnotes on slide 19 sit on a sunset photo at low contrast.
Worth keeping: Keep the ex-impairment reference bar with its footnote on slides 8 and 11 and the quantified one-line subtitles.
Most useful repair: On slides 7 to 16 replace the half-page photos with short notes beside each bar, starting with the Other bars on slides 11 and 15.
What would change the score: If the photographs were a deliberate choice for a webcast audience watching rather than reading, the lost explanation space would cost less and the score would hold at 7 rather than fall.
Confidence high. 20 of 20 pages inspected on contact sheets, 12 at readable size. Reviewed 2026-11-15. Model-assisted review (claude-fable-5-2, in session).
Full text of the slides (20 slides)
Every slide's words and a description of its charts and images, so the deck can be searched and rebuilt. Also available as Markdown.
Slide 1
First quarter 2017 / earnings call
Jeff Woodbury
Vice President, Investor Relations and Secretary
April 28, 2017
ExxonMobil
Visuals: Photograph: aerial view of a large offshore oil production platform (topsides with yellow and white cranes, red crane booms, grey modular buildings, a green-and-yellow helicopter deck at the lower left) moored in a deep fjord-like inlet. Behind it a forested hillside with autumn orange and green foliage, rocky cliffs at right, a grey industrial building complex and dock at left, a second floating structure with a tall white cylindrical tower and a yellow crane on the upper right water, and a red-and-white tug at lower left. Composition is a diagonal aerial view with the platform in the centre-left and water occupying the lower right. Lighting is soft natural daylight; dominant colours are dark teal-navy water, deep green and orange-brown forest, yellow and red equipment, and grey steel. The photo is full-bleed, not cropped inside a box, with no overlay; the upper-left area is darkened by the forest shading to support the white title. Logo: ExxonMobil wordmark in white bold sans-serif with the double-x red-and-white mark, lower right, about 20.9% wide.
Slide 2
Cautionary statement
•
Forward-Looking Statements. Statements of future events or conditions in this presentation or the subsequent discussion period are forward-looking statements. Actual / future results, including financial and operating performance; demand growth and mix; ExxonMobil’s volume/production growth and mix; the amount and mix of capital / expenditures; resource recoveries; finding and development costs; project plans, timing, costs, and capacities; drilling programs; product sales and mix; dividend and share / purchase levels; cash and debt balances; asset valuations; corporate and financing expenses; and the impact of technology could differ materially due to a number of factors. / These include changes in oil or gas prices or other market conditions affecting the oil, gas, and petrochemical industries; the occurrence and duration of economic recessions; / reservoir performance; the outcome and timeliness of exploration and development projects; war and other political or security disturbances; changes in law or government / regulation, including sanctions as well as tax and environmental regulations; the outcome of commercial negotiations; the impactof fiscal and commercial terms; / opportunities for investments or divestments that may arise; the actions of competitors and customers; unexpected technological developments; unforeseen technical / difficulties; and other factors discussed here and under the heading "Factors Affecting Future Results" in the Investors section of our Web site at exxonmobil.com. The closing / of announced acquisition transactions is subject to satisfaction of conditions to closing provided under the applicable agreement. Forward-looking statements are based on / management’s knowledge and reasonable expectations on the date hereof, and we assume no duty to update these statements as of any future date.
•
Frequently Used Terms. References to resources, the resource base, barrels of oil, volumes of gas, liquids, condensate, and similar terms include quantities that are not yet / classified as proved reserves under SEC definitions but that we believe will likely be developed and moved into the proved reserves category in the future. Shareholder / distributions referred to in this presentation mean cash dividends plus any shares purchased to reduce shares outstanding (excluding anti-dilutive purchases). For definitions / and more information regarding resources, reserves, cash flow from operations and asset sales, free cash flow, earnings excluding impairment charge, operating costs, and / other terms used in this presentation, see the "Frequently Used Terms" posted on the Investors section of our Web site and the additional information in this presentation and / the earnings release 8-K filed today. The Financial and Operating Review on our Web site also shows ExxonMobil's net interest in specific projects.
•
The term ‘project’ as used in this presentation can refer to a variety of different activities and does not necessarily have the same meaning as in any government payment / transparency reports.
2
ExxonMobil first quarter 2017 earnings call
Slide 3
Headlines
First quarter earnings of $4 billion
Cash flow from operations and asset sales more than covered dividends and net investments
Solid results from all three business segments
Continued focus on managing costs and operating efficiently
Advancing key initiatives across the value chain for strategic growth
3
ExxonMobil first quarter 2017 earnings call
Visuals: One photograph: an illuminated petrochemical refinery at dusk. Tall distillation columns on the left, rows of pipe racks, stacks, storage vessels and dense clusters of lit lamps across the middle and right, with blue steel pipework in the foreground. The sky is a deep blue twilight with soft clouds and a faint pink-orange glow on the horizon at left. Composition is a wide landscape view, full width, cropped at top by the white header and at bottom by the footer band. Lighting is warm orange-yellow artificial light against cool blue ambient sky. Dominant colours are blue, amber and steel grey. No overlay or tint is visible behind the text beyond the natural darkness of the sky. The footer band carries a faint diagonal hatch pattern in lighter blue on its right side.
Slide 4
Business environment
Global economy showed modest growth in the quarter
Slower expansion in the U.S.
Stable growth in China and Europe
Slight improvement in Japan
Price environment improved
Global rig count up
Refining and chemical margins increased
Brent
$/Barrel
75
50
25
0
Mar 2015
Jun 2015
Sep 2015
Dec 2015
Mar 2016
Jun 2016
Sep 2016
Dec 2016
Mar 2017
Source: Platt’s
4
ExxonMobil first quarter 2017 earnings call
Visuals: Photograph: full-bleed aerial view of an offshore semi-submersible drilling rig on open ocean, centred at about x 36 to 59% and y 25 to 90% of the slide. The rig has a red and white lattice derrick rising from a turquoise and grey hull with a helideck at the left, cranes and piping on the deck, and small lettering on the hull. Daylight, even lighting, deep navy water surface with fine ripples, camera slightly above and to the side. Dominant colours navy blue, turquoise, red and white. The photo is not cropped and is not boxed; no overlay or tint is evident. Line chart: titled Brent, unit $/Barrel. Y axis runs 0 to 75 with horizontal gridlines at 0, 25, 50 and 75; no axis title beyond the unit. X axis is time from Mar 2015 to Mar 2017 with labels every three months (Mar 2015, Jun 2015, Sep 2015, Dec 2015, Mar 2016, Jun 2016, Sep 2016, Dec 2016, Mar 2017), labels rotated about 45 degrees. Single series, a daily Brent price line in teal, values about: starts near 60 in Mar 2015, peaks near 66 around Jun 2015, falls to about 45 by Dec 2015, bottoms near 27 around Feb 2016, recovers to about 50 by Jun 2016, dips to about 43 around Dec 2016 and ends near 52 in Mar 2017. No legend and no highlighted points. Source line Source: Platt’s below the chart. Bullets: five square white bullets in Wingdings before the list items, no other graphics. Footer band: blue gradient image with fine diagonal hatching, blue #0B4FA8 at left to light blue #1EA7E1 at right.
Slide 5
First quarter 2017 financial results
Earnings
4.0
Earnings Per Share – Diluted (dollars)
0.95
Shareholder Distributions
3.1
CAPEX
4.2
Cash Flow from Operations and Asset Sales 1
8.9
Cash
4.9
Debt
43.6
Billions of dollars unless specified otherwise
1 Includes Proceeds Associated with Asset Sales of $0.7B
5
ExxonMobil first quarter 2017 earnings call
Visuals: A seven-row table with two columns and no header row. Column 1 holds the row labels and column 2 holds the values in bold white numerals on a blue gradient cell. Rows, top to bottom: Earnings | 4.0; Earnings Per Share – Diluted (dollars) | 0.95; Shareholder Distributions | 3.1; CAPEX | 4.2; Cash Flow from Operations and Asset Sales (superscript 1) | 8.9; Cash | 4.9; Debt | 43.6. Row label cells alternate white and pale blue (#CCECFF) starting with white. Values are in dollars billions unless specified otherwise, with no chart axes or legend. A photograph occupies the right column: an illuminated petrochemical or refinery plant at dusk, with dense piping, steel structures, stacks and towers, and many lit lamps. The sky is deep blue at top shading to dark navy, the structures are lit warm amber and orange, and the frame is full-height and boxed with hard edges, not cropped to a shape. No overlay or tint is visible on the photo.
Slide 6
First quarter 2017 sources and uses of cash / Beginning Cash / 3.7 / Earnings / 4.0 / Depreciation / 4.5 / Working Capital / Other / (0.3) / Proceeds Associated with Asset Sales / 0.7 / Shareholder Distributions / (3.1) / PP&E Adds / Investments and Advances 1 / (4.5) / Debt / Other Financing 2 / (0.1) / Ending Cash / 4.9 / 8.9 / Billions of dollars / 1 Includes PP&E Adds of ($2.9B) and net investments and advances of ($1.6B) / 2 Includes anti-dilutive share purchases of ($0.5B) / 6 / ExxonMobil first quarter 2017 earnings call
Visuals: Table with two columns and nine rows. Column 1 holds labels; column 2 holds values in white bold numerals on blue gradient cells. Row 1 Beginning Cash 3.7 (bold label, light blue row). Row 2 Earnings 4.0. Row 3 Depreciation 4.5. Row 4 Working Capital / Other (0.3). Row 5 Proceeds Associated with Asset Sales 0.7. Row 6 Shareholder Distributions (3.1). Row 7 PP&E Adds / Investments and Advances with superscript 1, value (4.5). Row 8 Debt / Other Financing with superscript 2, value (0.1). Row 9 Ending Cash (bold, light blue row) 4.9. Rows alternate white and light grey (#F2F2F2). Units stated as billions of dollars. A thin dark curly brace spans rows 2 to 5 (about y 30.7% to 52.4%) and points to a bold total 8.9. No chart or highlighted points. Photograph: an industrial refinery or petrochemical plant at dusk, seen from a low angle across a water channel; dense steel towers, distillation columns, pipe racks and stairways, many lit with warm orange and yellow lights. The sky is deep blue gradient at the top. Lighting is evening artificial light against blue dusk. Dominant colours: blue #2B4D8C, amber #F2A93B, steel grey #7A8290. Full-bleed to the right edge and bottom, cropped at the top of the frame. Footer band has a faint diagonal hatch texture on the right side.
Slide 7
Total earnings – 1Q17 vs. 1Q16
Earnings increased $2.2 billion on stronger Upstream results
Millions of Dollars
210
(184)
(154)
2,328
4,010
1,810
1Q16
U/S
D/S
Chem
C&F
1Q17
7
ExxonMobil first quarter 2017 earnings call
Visuals: A photograph of the drillship STENA CARRON at night, positioned in the left column (x 0 to 48.2%, y 19 to 95.5%) at its native 1413 by 1261 pixel proportion, so it is not cropped; it is boxed with hard edges against the footer band and the white subtitle area, with no overlay or tint. The subject is a tall drilling derrick with lattice steel towers and a cantilevered deck, lit by many warm yellow and white work lights, sitting on dark water; the sky is dark navy with scattered dark clouds and a small amount of orange light reflected on the water below the hull. Dominant colours are navy #0E2740, warm amber #E0A040 and white light points. The hull is near-black with the name STENA CARRON in small white capitals on the side. A waterfall chart with the title Millions of Dollars, a horizontal baseline and no vertical axis, no axis scale or gridlines, and no legend. Bars run left to right as floating steps, each labelled with its value: 1Q16 is a blue total bar labelled 1,810; U/S is a green increase bar labelled 2,328; D/S is a green increase bar labelled 210; Chem is a red decrease bar labelled (184); C&F is a red decrease bar labelled (154); 1Q17 is a blue total bar labelled 4,010. Values are in millions of dollars and the bar heights are proportional to these values as drawn, with no printed numeric scale. No points are highlighted beyond the colour coding (blue totals, green increases, red decreases).
Slide 8
Total earnings – 1Q17 vs. 4Q16 / Earnings1 increased $303 million with stronger Upstream and Chemical results partly offset by higher corporate costs / Millions of Dollars / 867 / (125) / 299 / (738) / 4,010 / 3,707 / 1,680 / 4Q16 / 4Q16 Ex- / Impairment1 / U/S / D/S / Chem / C&F / 1Q17 / 1 Excluding $2B 4Q16 Upstream impairment charge / 8 / ExxonMobil first quarter 2017 earnings call
Visuals: Photograph (left half, x 0 to 48.2%, y 19 to 95.4%): an offshore drilling vessel named STENA CARRON seen from the side at dusk, with a tall derrick tower and a dense cluster of lit deck machinery, cranes and a helideck on the right; the hull is dark at the waterline with a warm orange reflection of lights on calm dark sea in the foreground. Lighting is artificial deck lights against a deep blue twilight sky with dark scattered clouds. Composition is a landscape crop with the vessel spanning most of the width and sitting in the lower-middle of the frame. The photo is full-bleed to its panel edge, not boxed, with no overlay or tint. Dominant colours: deep navy #1B2A44 sky, warm amber #E8A33D lights, black hull #101418. Waterfall chart (right panel, titled 'Millions of Dollars', units millions of US dollars, no value axis printed, values labelled on each bar): seven columns left to right. Totals in cyan #00B0F0: 4Q16 = 1,680 (bar from baseline to about 1,680); 4Q16 Ex-Impairment1 = 3,707 (bar, tallest of the first two); 1Q17 = 4,010 (bar, tallest in chart). Movements as floating bars: U/S = 867 increase in green #009900 (about 867 height above the 4Q16 Ex-Impairment top); D/S = (125) decrease in red #C00000 (thin bar); Chem = 299 increase in green #009900; C&F = (738) decrease in red #C00000 (about 738 tall). Bars for D/S, Chem and C&F are estimated from the render, no further values printed beyond those listed. No legend. No highlighted points beyond colour coding: blue totals, green increases, red decreases. Baseline is a thin dark grey horizontal axis line under all columns. No logos or icons are visibly rendered in the top band.
Slide 9
Upstream earnings – 1Q17 vs. 1Q16
Earnings up $2.3 billion due to higher realizations
Millions of Dollars
2,310
(150)
170
2,252
(76)
1Q16
Realization
Vol/Mix
Other
1Q17
9
ExxonMobil first quarter 2017 earnings call
Visuals: Photograph (left column, x 0.1%, y 18.9%, w 48.1%, h 76.5%): a drilling rig in a flat, dry landscape at dusk. A tall white and yellow lattice derrick rises from a blue-grey base unit with a yellow walkway, with a horizontal pipe-rack and small white portable buildings and a red-roofed trailer along its base. In the foreground three white pickup trucks are parked along a gravel road behind a wire fence, and the ground is pale sandy-orange with scrub. The sky is a gradient of cool blue-grey at the top to pinkish-orange cumulus clouds near the horizon, lit by low warm sunlight from the left. The photo is a hard-edged rectangle, not cropped in shape and not overlaid or tinted, butting against the chart panel on the right and the footer band below. Dominant colours: slate blue-grey #6E7F99 sky, warm sand #D9A77A ground, white trucks #F2F2F2. Waterfall chart (right column, built from filled rectangles): titled 'Millions of Dollars', centred above the bars. No axis scale or gridlines are shown; values are printed on each bar. Five categories left to right with printed values: 1Q16 (76) (a small cyan bar below the baseline, drawn down from the baseline at about 75.3% to 76.6% of slide height); Realization 2,310 (a tall green bar rising from the baseline to about 38.5%); Vol/Mix (150) (a red bar floating from about 38.5% to 41.0%, width about x 70.8 to 77.2%); Other 170 (a green bar floating from about 38.1% to 41.0%, x 79.8 to 86.1%); 1Q17 2,252 (a tall cyan bar rising from the baseline to about 38.2%). Baseline is a thin dark grey horizontal line at y 75.3% from x 51.7% to 96.3%. Bars are about 6.4% of slide width each, with no legend, no highlighted points beyond the colour coding (green increases, red decrease, cyan totals), and no connector lines between bars. Logos and icons: none.
Slide 10
Upstream volumes – 1Q17 vs. 1Q16 / Volumes down 4%: Liquids -205 kbd, natural gas +184 mcfd / koebd / 4,325 / (110) / Price, Spend, / & Other: -114 / Net Interest:+4 / (6) / (58) / Liquids: -87 / Gas: +29 / 4,151 / 1Q16 / Entitlements Divestments / Growth/ / Other / 1Q17 / 10 / ExxonMobil first quarter 2017 earnings call
Visuals: Chart: waterfall bar chart of upstream volumes, 1Q16 to 1Q17, unit koebd (thousand oil-equivalent barrels per day). Bars in order: 1Q16 total bar with value 4,325, Entitlements step (110) drawn as a red bar, Divestments step (6) drawn as a thin grey line, Growth/Other step (58) drawn as a red bar, 1Q17 total bar with value 4,151. Totals are solid bright blue bars rising from a shared baseline at about 84% of slide height; the 1Q16 bar top is at about 33.7% and the 1Q17 bar top at about 35.7%. Sub-labels: Entitlements breakdown reads Price, Spend, & Other: -114 and Net Interest:+4; Growth/Other breakdown reads Liquids: -87 and Gas: +29. No axis scale or gridlines are printed. No legend. Highlighted points: the two red decrement bars. Photograph: aerial view of a red-hulled LNG carrier moored alongside a long concrete breakwater-lined terminal jetty with pipework and loading arms; the ship's bow points toward the lower left, deck structures and the letters L, N and G are visible on the red hull; the composition is diagonal with the ship in the foreground and the jetty receding to the upper left; the lighting is warm low-angle sunlight on the ship and jetty against dark blue-grey water; dominant colours are red, cream, ochre and deep navy; the photo is cropped to a rectangle at the left half, not full-bleed. Footer band: a blue gradient image with faint diagonal hatch lines across it.
Slide 11
Upstream earnings – 1Q17 vs. 4Q16 / Earnings1 increased $867 million due to higher realizations and lower operating expenses / Millions of Dollars / 300 / 2,252 / 570 / ‒ / 1,385 / (642) / 4Q16 / 4Q16 Ex- / Realization / Vol/Mix / Other / 1Q17 / Impairment1 / 1 Excluding $2B 4Q16 Upstream impairment charge / 11 / ExxonMobil first quarter 2017 earnings call
Visuals: Left: an aerial photograph of an LNG processing plant on a coastal site, with white storage tanks, dense pipework and process units in the centre, a long pipeline running diagonally to a jetty at the sea, dark blue ocean and overcast grey clouds at the top, green vegetation and bare tan earth in the foreground; daylight, muted colours, full-bleed to the left edge and top of the content area, not boxed. Right: a waterfall chart titled 'Millions of Dollars' with no visible axes or gridlines and a horizontal baseline. Bars from left to right: 4Q16 = (642) negative blue bar hanging below the baseline (about -642 million); 4Q16 Ex-Impairment1 = 1,385 blue total bar rising from baseline; Realization = 570 green increase floating above 1,385; Vol/Mix = dash (‒) with no bar, value zero; Other = 300 green increase floating above the Realization bar; 1Q17 = 2,252 blue total bar. Legend: none. Highlighted points: none beyond colour coding of totals (blue) and increases (green).
Slide 12
Upstream volumes – 1Q17 vs. 4Q16
Volumes increased 1%: Liquids -51 kbd, natural gas +484 mcfd
koebd
4,121
(61)
(3)
94
4,151
Price, Spend,
& Other: -61
Liquids: +8
Gas: +86
4Q16
Entitlements Divestments
Growth/
Other
1Q17
12
ExxonMobil first quarter 2017 earnings call
Visuals: One waterfall (bridge) chart titled 'koebd' (thousand oil-equivalent barrels per day), placed on the right panel. Categories left to right: 4Q16, Entitlements, Divestments, Growth/Other, 1Q17. The vertical axis has no printed scale or tick labels; the bars are not drawn to a numeric axis. Series values: 4Q16 = 4,121 (solid bar, about 52.9% of slide width, blue #00B0F0, top at about 30.7% of slide height, extending to the baseline); Entitlements = (61) (small floating red bar #C00000 under the 4Q16 level, annotated 'Price, Spend, & Other: -61'); Divestments = (3) (a very thin red line #C00000 at the same level, no annotation); Growth/Other = 94 (small floating green bar #009900, annotated 'Liquids: +8' and 'Gas: +86', summing to +94); 1Q17 = 4,151 (solid blue bar #00B0F0 at the right, top about 30.3% of slide height). Bars are narrow and evenly spaced, with the baseline as a thin dark grey horizontal line spanning the chart width. No legend. No highlighted points beyond the colour coding of increases (green) and decreases (red). Photograph: a row of orange-and-black oil pumping units (pumpjacks) against a deep blue sky with white cumulus clouds at upper left and lower right; a fenced industrial site and a line of dark green conifer trees are visible at the bottom right, and a warning sign is partly visible at lower left. The pumpjacks are shown in side view, angled diagonally from lower left to upper right, with strong daylight from the upper left, saturated blue and orange tones, and framing that crops the machines at the top and left edges. The photo is full-height in its column, not boxed, with no tint or overlay. Footer band: a full-width blue gradient strip (#0072C6 to #00B0F0 tones) with a faint diagonal white hatch pattern at its right half.
Slide 13
Downstream earnings – 1Q17 vs. 1Q16
Earnings up $210 million due to increased operational efficiency
Millions of Dollars
906
10
160
40
1,116
1Q16
Margin
Vol/Mix
Other
1Q17
13
ExxonMobil first quarter 2017 earnings call
Visuals: 1) Photograph (left half, x0 y18.6 w49.8 h76.8): a close, slightly high-angle shot of many grey Mobil 1 5W-30 Advanced Full Synthetic motor oil bottles, with blue Mobil logos and black label panels, arranged in rows on a shelf, with a row of boxed bottles on a top shelf behind them. The front bottles are sharp and the rear rows fall off into shadow. Lighting is soft artificial light. Dominant colours are silver-grey, black, blue and red. The photo is cropped by the left and bottom slide edges and is boxed to its panel with no border or overlay. 2) Waterfall chart (right panel, about x51.4 to 98.8, y52.8 to 83.7): titled 'Millions of Dollars', with no visible value axis or gridlines. Categories left to right: 1Q16 (total bar, value 906), Margin (increase, 10), Vol/Mix (increase, 160), Other (increase, 40), 1Q17 (total bar, value 1,116). Totals are light-blue #00B0F0 bars standing on a dark-grey baseline. Increases are green floating bars: Margin is a thin sliver, Vol/Mix is a block about 160 units tall, and Other is a thin block. No legend. No points are highlighted beyond the colour coding of totals and increases. Bar heights are proportional to value; the 906 bar is about 25% of slide height and the 1,116 bar about 30.8%. 3) Footer band (x0 y95.4 w100 h4.6): a blue gradient strip with fine diagonal hatching. 4) Thin white vertical divider line in the footer at about x3.1, between the page number and footer text.
Slide 14
Downstream earnings – 1Q17 vs. 4Q16
Earnings down $125 million due to higher planned maintenance and the absence of divestment gains
Millions of Dollars
200
(220)
1,241
(110)
1,116
4Q16
Margin
Vol/Mix
Other
1Q17
14
ExxonMobil first quarter 2017 earnings call
Visuals: Waterfall chart titled 'Millions of Dollars' occupying the right half. Five bars on a shared baseline with no y-axis, gridlines or scale shown. Values printed above each bar: 4Q16 = 1,241 (blue, full bar from baseline); Margin = 200 (green, floating increase above the 4Q16 level); Vol/Mix = (220) (red, floating decrease); Other = (110) (red, smaller floating decrease); 1Q17 = 1,116 (blue, full bar from baseline). Category labels below the baseline: 4Q16, Margin, Vol/Mix, Other, 1Q17. No legend and no highlighted points beyond the colour coding. Photograph on the left half: an industrial oil refinery with tall grey-white distillation columns and towers, stacked ladders and platforms, pipe racks and large horizontal pipes in the foreground, shot from a low angle with a deep blue sky and thin wispy clouds at upper right. Lighting is clear daylight with warm highlights on the steel; dominant colours are steel grey, rust brown and sky blue. The photo is rectangular, not cropped to a shape, with no overlay or tint and it is boxed against the white header.
Slide 15
Chemical earnings – 1Q17 vs. 1Q16 / Earnings decreased $184 million due to lower specialties margins and increased turnaround activities / Millions of Dollars / 1,355 / (70) / ‒ / (110) / 1,171 / 1Q16 / Margin / Vol/Mix / Other / 1Q17 / 15 / ExxonMobil first quarter 2017 earnings call
Visuals: Photograph: a petrochemical or refinery plant. Tall columns and towers, pipe racks, stairways and vessels fill the frame. The sky is clear blue at the top. The scene is in bright daylight with soft shadows on the ground. Dominant colours are steel blue, silver-grey, and dark asphalt, with some yellow railings at right. The photo is cropped to the left half, boxed (not full-bleed across the slide), and sits flush against the subtitle area above. Chart: a waterfall (bridge) chart titled 'Millions of Dollars', with no visible y-axis, no gridlines and no axis range. Categories left to right: 1Q16 total bar, value 1,355, blue; Margin, value (70), red bar floating down; Vol/Mix, value shown as a dash (zero), no bar; Other, value (110), red bar floating down; 1Q17 total bar, value 1,171, blue. The totals are drawn from the baseline up. The bars are sized relative to the values, with the 1Q16 bar about 37% of slide height and the 1Q17 bar about 32%. The red negative bars are about 2% and 3% of slide height. No legend. No connector lines. Highlighted points: none beyond the colour coding of totals (blue) and decreases (red). A thin dark grey horizontal baseline runs under the bars.
Slide 16
Chemical earnings – 1Q17 vs. 4Q16 / Earnings increased $299 million on higher commodity margins and lower operating expenses / Millions of Dollars / 140 / 1,171 / 170 / (10) / 872 / 4Q16 / Margin / Vol/Mix / Other / 1Q17 / 16 / ExxonMobil first quarter 2017 earnings call
Visuals: Chart: waterfall (bridge) chart titled 'Millions of Dollars', centred above the bars in EMprint regular dark slate text. There are no printed axes, gridlines or axis ranges; the only axis is a thin dark grey horizontal baseline at about y 83.6% spanning x 52.5 to 97.5%. Five columns, left to right, each with its printed value: 4Q16 = 872 (blue total bar, rising from the baseline to about y 59.6%); Margin = 170 (green floating bar, x 61.9 to 68.9%, y 54.9 to 59.6%, rising from the top of the 4Q16 bar level); Vol/Mix = (10) (a thin red horizontal line, about 0.5% tall, x 71.4 to 78.4%, at about y 55%, showing a negative change); Other = 140 (green floating bar, x 81.0 to 87.9%, y 51.3 to 55.2%); 1Q17 = 1,171 (blue total bar, x 90.7 to 97.4%, rising to y 51.4%). Totals 872 and 1,171 are printed above their bars; the change values are printed above their bars. No legend. No points are highlighted beyond the colour coding: blue for totals, green for increases, red for the decrease. Photograph: a man in a white hard hat and light grey-beige work shirt with dark trousers stands on a steel catwalk or platform at the right of the frame, holding a handheld radio to his mouth and looking up and to the left. Behind and to the left spreads a night-time refinery or petrochemical plant, with illuminated distillation columns, pipes and ground lights. A steel structure frame and railings run diagonally through the right side. Composition: vertical, subject placed right of centre, plant spreading across the lower left. Lighting: dusk or blue-hour sky with warm artificial yellow-orange lights from the plant. Dominant colours: deep navy blue sky (about #1B2A4A at top, fading to warm glow near the horizon), amber and gold lights (about #E0A030), dark brown-black steel. Not cropped in a box; it is full-bleed to the left and top/bottom of its area, with a hard vertical edge at x 49.9% where the pale panel begins. No overlay or tint. Logos/icons: none. Title: rendered as two picture objects, not text; no icons.
Slide 17
Mozambique: Strategic portfolio addition
Access to world-class gas resources
Acquiring 25% interest in Area 4 from Eni for $2.8 billion cash
6 major discoveries with 85 TCF of gas in-place
More than 100 MCFD well deliverability
Competitive cost of supply
ExxonMobil to operate onshore LNG facilities
More than 40 MTA of onshore LNG developments
Leveraging industry-leading project and operational capabilities
Ongoing evaluation of 3 high-potential exploration blocks
Tanzania
Area 4
Mozambique
Malawi
-1000 m
-2000 m
-3000 m
Gas Fields
Held by others
XOM interest
Area 4 acquisition
0 100 200 Kilometers
17
ExxonMobil first quarter 2017 earnings call
Visuals: Map of Mozambique (boxed, not cropped inside the box, full map visible) with a legend and scale bar. Map type: thematic gas-field location map. Country outlines drawn as thin dark grey lines over a pale grey shaded relief. Country labels: Tanzania (top centre-right), Malawi (left), Mozambique (centre-right). Bathymetry: thin blue contour lines labelled -1000 m, -2000 m and -3000 m running parallel to the coast in the offshore area. Shapes: small red filled gas-field blobs near Area 4 in the far north-east, near the coast in the south-west (Inhambane area), and off the coast. Pale lilac/pink blocks labelled as held by others: several near the northern coast, one mid-coast on the shore, and one diagonal block offshore in the central-south. Yellow solid blocks labelled XOM interest: one diagonal block offshore at centre-right and two blocks in the south-offshore area. Area 4 acquisition: yellow block with diagonal hatch pattern in the far north-east at the coast. Legend box (white fill, thin grey border) at lower right of the map listing Gas Fields (red blob swatch), Held by others (lilac swatch), XOM interest (solid yellow swatch), Area 4 acquisition (yellow hatched swatch), and a scale bar 0, 100, 200 Kilometers with a black-and-white bar. No photographs or logos.
Slide 18
Solid project and exploration progress
Advancing high-quality opportunities
Closed PNG and Permian acquisitions
18 Major value chain projects in execution
6 Upstream, 8 Downstream, 4 Chemical
Australia: Gorgon-Jansz Train 3 start-up
Focused exploration program
Guyana: Snoek discovery
U.S.: Apparent high bidder on 19 GoM blocks
PNG: Successful farm-in to 2 offshore blocks
Cyprus: Executed Block 10 EPSC
18
ExxonMobil first quarter 2017 earnings call
Visuals: One photograph: a drillship (the Stena Carron) at sea, seen from an elevated three-quarter aerial view. The bow points to the lower left and the stern to the upper right. The vessel has a tall lattice derrick tower in the centre, a round helideck with a yellow ring at the bow, yellow cranes and pipe racks on the deck, and the word Stena with a red and white livery on the hull side, plus small hull lettering reading STENA CARRON. The sea is dark navy blue with fine ripples. Lighting is bright daylight from above, with soft shadows. The photo is boxed to the right half of the slide, running from the title band down to the footer band, with hard straight edges and no tint or overlay. Dominant colours are deep navy #0E2A52 for the sea, white and grey for the superstructure, and yellow #E8B424 for the cranes. Other visuals: a background gradient image on the left half and a footer band image, both described under elements.
Slide 19
Summary
Focused on value growth
Earnings
4.0
Upstream production (MOEBD)
4.2
CAPEX
4.2
Cash Flow from Operations and Asset Sales1
8.9
Free Cash Flow2
4.4
Shareholder Distributions
3.1
Billions of dollars unless specified otherwise
■ Solid business performance
■ Investment discipline
■ Cash coverage
■ Reliable, growing dividend
1 Includes Proceeds Associated with Asset Sales of $0.7B
2 Calculated as Cash Flow from Operations and Asset Sales of $8.9B less PP&E Adds / Investments & Advances of ($4.5B)
19
ExxonMobil first quarter 2017 earnings call
Visuals: Photograph: sunset over calm sea, with a dark silhouetted offshore drilling vessel and tall derrick at lower right, its lights visible. Composition is landscape, full-bleed across the lower 80 percent of the slide from y 18.7 to 95.4 percent, not cropped at the sides. Lighting is low dusk light: blue-grey sky at top fading to orange and yellow glow at the horizon, with scattered dark clouds. Dominant colours are dark navy, slate blue and orange, with a dark blue tint over the top of the photo. Overlay: a dark blue gradient sits across the upper area beneath the table. Table: a six-row, two-column table with no column headers. Column 1 holds row labels and column 2 holds values. Rows: Earnings 4.0; Upstream production (MOEBD) 4.2; CAPEX 4.2; Cash Flow from Operations and Asset Sales (superscript 1) 8.9; Free Cash Flow (superscript 2) 4.4; Shareholder Distributions 3.1. Row fills alternate #0070C0 at 65 percent and 50 percent opacity. Bulleted list of four square bullets. Footer band: blue gradient strip with diagonal hatch texture across the full width. No chart. No logo is visibly legible in the render.
Slide 20
Q&A
Visuals: Photograph in the upper 80.9% of the slide: an offshore oil platform walkway seen from above. Red and blue safety railings run diagonally from the upper left, with dark rippling sea water visible beyond them on the left. A yellow handrail runs diagonally from the lower left to the upper right beside a grated steel deck with white and grey pipework, flanges, valves, a hand wheel and a grey electrical junction box. Two workers in orange coveralls with reflective stripes, white hard hats and yellow ear defenders stand on the grating; the left worker wears brown boots and a green-and-white badge, and the right worker, with glasses and a radio held near his chest, gestures with yellow-green gloves. Lighting is daylight, overcast and even; dominant colours are red, blue, orange, yellow and grey steel. The photo is full-bleed and not boxed, with no overlay or tint. Below it, a blue banner image (about 19.3% of height) shows a saturated blue gradient with a faint pattern of concentric curved lines on the right side.
Download this deck
The hosted PDF of every library deck is free for readers of the SlideDeck Co newsletter. Join with your email and the viewer and download appear here.
Preparing a results presentation or business update of your own? The SlideDeck Co Standard Deck is a slide library for business reviews, updates and plans.







