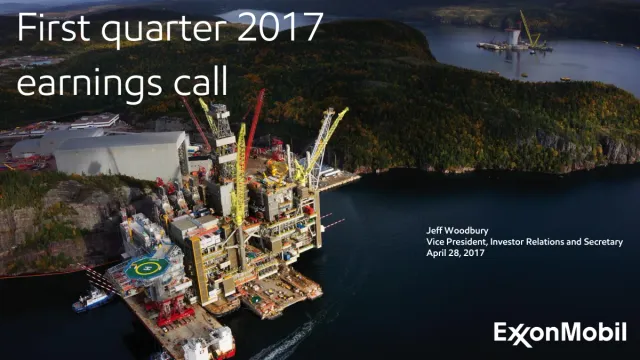
This is the slide deck for ExxonMobil's second quarter 2016 earnings call, presented by Jeff Woodbury, Vice President of Investor Relations. It opens with a title slide and a lengthy cautionary statement on forward-looking statements and defined terms. A headlines slide then summarises second quarter earnings of $1.7 billion and three main messages. The core financial section follows, covering the business environment, financial results, a sources and uses of cash bridge, and total earnings bridges comparing the quarter with 2Q15 and 1Q16. Segment pages address Upstream, Downstream and Chemical, each with earnings and volume waterfall charts and brief headline captions. Project and exploration updates come next, including the proposed InterOil acquisition, the Hebron and Guyana developments, and a U.S. unconventional portfolio slide with a combined bar and line chart. The deck closes with a year-to-date sources and uses of cash summary, a year-to-date summary table, and a questions slide. The earnings waterfall charts, which show the drivers of change at a glance, and the Upstream portfolio slide, which packs several data series into one readable graphic, are worth studying.
Slides worth studying
- Slide 7: A clean waterfall chart with colour-coded increases and decreases lets the reader see the drivers of the earnings change at a glance.
- Slide 19: The U.S. unconventional slide combines bar and line series with a short bullet column, pairing a dense chart with a clear takeaway.
- Slide 9: A simple waterfall with one headline caption states the single message of the page and keeps the chart uncluttered.
Details
- Company: ExxonMobil
- Year: 2016
- Type: Investor presentation
- Industry: Energy
- Pages: 23
The hosted copy of this deck is being prepared. Newsletter readers will find the download here.
Review score: 7 out of 10, Effective
Presentation quality, judged with the SlideDeck Co review heuristic. Ask, evidence and idea merit are not rated here.
The strength is a disciplined run of earnings bridges, each with a one-sentence takeaway that states the change and its cause, such as slide 7 ("Earnings decreased $2.5B on lower Upstream and Downstream results") and slide 9 ("Earnings decreased $1.7B due to sharply lower realizations"). Every segment gets the same year-over-year and sequential pair, with units printed above the chart, so a reader can find a number quickly. The bottleneck is that the bridges lump important movement into an unexplained "Other" bar, for example 450 on slide 9 and (250) on slide 15, and the opening Headlines on slide 3 gives "$1.7 billion" with three upbeat bullets and no mention that earnings fell from 4,190 to 1,700. There is no outlook or guidance page, so the deck reports the past quarter only.
Worth keeping: Keep the one-sentence takeaway above each bridge and the matched year-over-year and sequential pairs for every segment.
Most useful repair: Add a short line under each bridge on slides 9, 11, 13 and 15 saying what the "Other" bar contains, and put the year-over-year decline on slide 3.
What would change the score: If the spoken remarks or a companion supplement were meant to carry the "Other" explanations and any outlook, the gaps matter less for the live setting and the score could rise to 8.
Confidence high. 23 of 23 pages inspected on contact sheets, 12 at readable size. Reviewed 2026-11-15. Model-assisted review (claude-fable-5-2, in session).
Full text of the slides (23 slides)
Every slide's words and a description of its charts and images, so the deck can be searched and rebuilt. Also available as Markdown.
Slide 1
Second Quarter 2016 Earnings Call
Jeff Woodbury
Vice President, Investor Relations & Secretary
July 29, 2016
ExxonMobil
Energy lives here
Visuals: Photograph of an illuminated industrial refinery or petrochemical plant at dusk. Subject: dense steel towers, distillation columns, pipe racks, staircases, and catwalks lit by many warm white and amber lights, with a tall smokestack at left and another at upper right. Foreground shows a paved access road with stacked metal scaffolding and a few white storage containers at lower right. Composition is a wide, elevated, landscape view with the plant spanning the full width and the horizon low. Lighting is blue-hour dusk: deep blue to purple sky with dark clouds at top, and warm orange-yellow artificial light from the plant and ground. Dominant colours: deep blue #1C3F7A at top, warm amber #E0A040 and gold in the lower half. The photo is full-bleed, uncropped to the frame, with no overlay or tint. Logo: red ExxonMobil wordmark with the 'X' stylised, red about #E31937, with the tagline 'Energy lives here' in white beneath it, small and sans-serif, with a trademark mark.
Slide 2
Cautionary Statement / Forward-Looking Statements. Statements of future events or conditions in this presentation or the subsequent discussion period are forward-looking statements. Actual future results, including financial and operating performance; demand growth and mix; ExxonMobil’s volume/production growth and mix; the amount and mix of capital expenditures; resource additions and recoveries; finding and development costs; project plans, timing, costs, and capacities; the results of announced transactions; drilling programs; product sales and mix; dividend and share purchase levels; cash and debt balances; corporate and financing expenses; and the impact of technology could differ materially due to a number of factors. These include changes in oil or gas prices or other market conditions affecting the oil, gas, and petrochemical industries; the occurrence and duration of economic recessions; reservoir performance; the outcome and timeliness of exploration and development projects; war and other political or security disturbances; changes in law or government regulation, including sanctions as well as tax and environmental regulations; the outcome of commercial negotiations; the impact of fiscal and commercial terms; opportunities for investments or divestments that may arise; the actions of competitors and customers; unexpected technological developments; unforeseen technical difficulties; and other factors discussed here and under the heading "Factors Affecting Future Results" in the Investors section of our Web site at exxonmobil.com. See also Item 1A of ExxonMobil’s most recent Form 10-K. The closing of announced acquisition transactions is also subject to satisfaction of conditions to closing provided under the applicable agreement. Forward-looking statements are based on management’s knowledge and reasonable expectations on the date hereof, and we assume no duty to update these statements as of any future date. / Frequently Used Terms. References to resources, the resource base, barrels of oil, volumes of gas, liquids, condensate, and similar terms include quantities that are not yet classified as proved reserves under SEC definitions but that we believe will likely be developed and moved into the proved reserves category in the future. Shareholder distributions referred to in this presentation mean cash dividends plus any shares purchased to reduce shares outstanding (excluding anti-dilutive purchases). For definitions and more information regarding resources, reserves, cash flow from operations and asset sales, free cash flow, and other terms used in this presentation, including information required by SEC Regulation G, see the "Frequently Used Terms" posted on the Investors section of our Web site and the additional information provided in this presentation and in the 8-K filed today with our earnings press release and IR supplement. The Financial and Operating Review on our Web site also shows ExxonMobil's net interest in specific projects. / The term ‘project’ as used in this presentation can refer to a variety of different activities and does not necessarily have the same meaning as in any government payment transparency reports. / 2 / ExxonMobil
Visuals: A full-width header banner image, 2000 by 157 pixels, covering the top 14.2% of the slide: a horizontal blue gradient from deep blue at the left to bright cyan-blue at the right, overlaid with a fine light curved mesh or wave-line pattern that is most visible on the right side. One logo: the red ExxonMobil wordmark (bold red sans-serif with a stylised X crossing the lower letters), 295 by 59 pixels, placed bottom right at x 83.4%, y 93.2%, w 14.0%, h 3.7%. No charts, photographs or other illustrations.
Slide 3
Headlines
Second quarter earnings of $1.7 billion
■
Cash flow reflects durability of the integrated portfolio amid industry volatility
■
Strong Chemical results highlight sustainable competitive advantages
■
Advancing attractive new investment opportunities across the value chain
3
Visuals: One illustration: a full-width header band (0 to 14.2% of slide height, flush to top and left/right edges) with a blue gradient running from deep blue at the left to bright cyan at the right, overlaid with a fine white concentric wave-line mesh pattern that is densest at the right. One logo: the ExxonMobil wordmark in red, bottom right, with the double-X stylised as a crossing mark. Three black square bullet glyphs (■) are text characters, not images.
Slide 4
Business Environment / Global economy mixed during the second quarter / Brent / $ per Barrel / 150 / 100 / 50 / 0 / Jun 2014 / Dec 2014 / Jun 2015 / Dec 2015 / Jun 2016 / ■ U.S. growth recovered / ■ Signs of stabilization in China / ■ Slower growth in Europe and Japan / ■ Crude oil prices increased / ■ Natural gas prices decreased / ■ Global refining margins improved modestly / ■ Chemical product margins weakened / ExxonMobil / 4
Visuals: Line chart titled 'Brent' with unit label '$ per Barrel'. Y axis from 0 to 150 with gridlines at 0, 50, 100 and 150. X axis labelled at Jun 2014, Dec 2014, Jun 2015, Dec 2015, Jun 2016, labels rotated about 45 degrees. Single series, a dark blue (#0B4EA2) line with a thick stroke. Approximate values: starts about 112 at Jun 2014, falls to about 60 by late 2014, about 38 near Dec 2014 low around 48 to 50, rises to about 67 in mid 2015, falls to about 25 around early 2016 trough, rises to about 50 by Jun 2016. No legend and no highlighted points. Right side bulleted list uses solid black square bullets. ExxonMobil red wordmark logo bottom right in red #E30613.
Slide 5
2Q16 Financial Results
Earnings
1.7
Earnings Per Share – Diluted
(dollars)
0.41
Shareholder Distributions
3.1
CAPEX
5.2
Cash Flow from Operations and Asset Sales
1
5.5
Cash
4.4
Debt
44.5
Billions of dollars unless specified otherwise
1 Includes Proceeds Associated with Asset Sales of $1B
5
Visuals: One illustration and one table. The illustration is the header band: a horizontal gradient from deep blue (left) to bright cyan-blue (right) with a fine white concentric wave/mesh line pattern across the right half, full-width and unboxed, about 14.2% of slide height. The table has 7 rows and 2 columns with no header row: Row 1 Earnings = 1.7; Row 2 Earnings Per Share – Diluted (dollars) = 0.41; Row 3 Shareholder Distributions = 3.1; Row 4 CAPEX = 5.2; Row 5 Cash Flow from Operations and Asset Sales (superscript 1) = 5.5; Row 6 Cash = 4.4; Row 7 Debt = 44.5. Values are in billions of dollars unless specified otherwise, as printed. Label column is grey text on white; value column is solid black cells with white numerals. Thin black horizontal rules separate the rows, spanning the label column (about x 16.2% to 70.6%). One logo: the ExxonMobil wordmark in red at bottom right.
Slide 6
2Q16 Sources and Uses of Cash / Cash balances decreased by $400M in the second quarter / Beginning Cash / 4.8 / Earnings / 1.7 / Depreciation / 4.8 / 5.5 / Working Capital / Other / (2.0) / Proceeds Associated with Asset Sales / 1.0 / Shareholder Distributions / (3.1) / PP&E Adds / Investments and Advances 1 / (4.1) / Debt / Other Financing / 1.3 / Ending Cash / 4.4 / Billions of dollars / 1 Includes PP&E Adds of ($4.3B) and net advances of $0.2B / ExxonMobil / 6
Visuals: A financial waterfall-style table, not a chart. Columns: row label (left) and value in billions of dollars (right, in a black column). Rows top to bottom: Beginning Cash 4.8 (bold label, bold value); Earnings 1.7; Depreciation 4.8; Working Capital / Other (2.0); Proceeds Associated with Asset Sales 1.0; Shareholder Distributions (3.1); PP&E Adds / Investments and Advances superscript 1 (4.1); Debt / Other Financing 1.3; Ending Cash 4.4 (bold label, bold value). Rows Earnings through Debt / Other Financing are indented about 4% from the left edge. A grey (#595959) curly brace spans the Earnings to Proceeds Associated with Asset Sales rows, drawn with a thin stroke of about 0.15% of slide height, and points right to the bold total 5.5. Horizontal black rules of about 0.2% height separate every row. Caption Billions of dollars is in italic under the table. No photographs, icons or chart axes are present.
Slide 7
Total Earnings – 2Q16 vs. 2Q15
Earnings decreased $2.5B on lower Upstream and Downstream results
Millions of Dollars
4,190
(1,737)
(681)
(29)
(43)
1,700
2Q15
U/S
D/S
Chem
C&F
2Q16
7
Visuals: Waterfall chart titled by the caption 'Millions of Dollars' (units: millions of US dollars), no visible y-axis or gridlines, category axis labelled 2Q15, U/S, D/S, Chem, C&F, 2Q16. Six bars: 2Q15 total bar in blue #0070C0 with value 4,190; U/S decrease bar in red #C00000 with value (1,737) spanning from top of 2Q15 downward; D/S decrease bar in red #C00000 with value (681); Chem decrease bar in red #C00000 with value (29), a thin bar; C&F decrease bar in red #C00000 with value (43), a thin bar; 2Q16 total bar in blue #0070C0 with value 1,700. Bars are not drawn to a printed scale, so approximate heights are about 4,190 for the first bar and about 1,700 for the last bar. No legend. No highlighted points. Thin grey #8C8C8C baseline under the bars. Header band is a blue gradient from #0B4AA0 on the left to #0AA0E0 on the right with a faint concentric wave pattern texture; the ExxonMobil logo is a red #E00000 wordmark with an X-shaped stylised letter.
Slide 8
Total Earnings – 2Q16 vs. 1Q16
Earnings decreased by $110M as stronger Upstream results partly offset
lower Downstream and Chemical earnings and higher corporate charges
Millions of Dollars
370
(81)
(138)
(261)
1,810
1,700
1Q16
U/S
D/S
Chem
C&F
2Q16
8
ExxonMobil
Visuals: Waterfall chart titled by the caption 'Millions of Dollars' (no axis labels or y-axis scale shown; values are printed on the bars). Categories left to right on the horizontal baseline: 1Q16 total 1,810 (blue bar), U/S +370 (green bar, rising), D/S (81) (red bar, falling), Chem (138) (red bar, falling), C&F (261) (red bar, falling), 2Q16 total 1,700 (blue bar). Bars are floating step bars connected in sequence; the total bars are about 1,810 and 1,700 high from the baseline, the green increase is about 370 and the red decreases are about 81, 138 and 261. Baseline is a thin grey horizontal line spanning the chart width. Legend: none. Highlighted points: none beyond colour coding (blue totals, green increase, red decreases). Also a background band image: blue gradient header with a fine concentric wave/ripple pattern, lighter cyan toward the right, and the ExxonMobil logo in red wordmark at bottom right.
Slide 9
Upstream / Earnings – 2Q16 vs. 2Q15 / Earnings decreased $1.7B due to sharply lower realizations / Millions of Dollars / 2,031 / (2,240) / 50 / 450 / 294 / 2Q15 / Realization / Vol/Mix / Other / 2Q16 / ExxonMobil / 9
Visuals: Waterfall chart, titled 'Millions of Dollars' (centred caption above the plot, no axis labels or scale shown). Five columns on a horizontal zero baseline (thin grey line, about #808080, about 0.1% of slide height, at about 80.5% from the top): 2Q15 = 2,031 (blue #0070C0 bar rising above baseline, top at about 52.2%); Realization = (2,240) (red #C00000 bar hanging below the baseline, bottom at about 83.5%, value label printed above the bar top); Vol/Mix = 50 (green #009900 bar, about 44.3% to 55.6% horizontally, from about 82.5% to 83.4% from the top, value label 50 above it; the bar is about 1% of slide height tall); Other = 450 (green #009900 bar, about 60.2% to 71.4% horizontally, spanning about 76.4% to 82.7% from the top, value label 450 above it); 2Q16 = 294 (blue #0070C0 bar, about 76.0% to 87.2% horizontally, spanning about 76.4% to 80.5% from the top, value label 294 above it). No legend. No highlighted points beyond the colour coding: blue for totals, red for negative realization, green for the two movement bars. Values are printed on the slide, so no estimates are needed. Blue header banner image: a horizontal gradient from deep blue #0B4BA0 at left to bright cyan-blue #1AA3E0 at right, with fine concentric wave/ripple line texture in lighter blue and white across the right half.
Slide 10
Upstream / Volumes – 2Q16 vs. 2Q15 / Volumes comparable to 2Q15: Liquids +39 kbd, natural gas –366 mcfd / koebd / 3,979 / 16 / (39) / 1 / 3,957 / Price, Spend, / & Other: +9 / Net Interest: +7 / Liquids: +41 / Gas: -40 / 2Q15 / Entitlements / Divestments / Growth/Other / 2Q16 / 10
Visuals: Waterfall chart in koebd (thousand oil-equivalent barrels per day), titled 'koebd', no visible y-axis or gridlines, baseline at about 84% of slide height. Bars: 2Q15 total bar 3,979 (solid blue #0070C0, full height from baseline); Entitlements increment 16 shown as a thin green (#008000-like) horizontal floating bar with sub-items 'Price, Spend, & Other: +9' and 'Net Interest: +7'; Divestments decrement (39) shown as a thick red (#C00000-like) floating bar; Growth/Other increment 1 shown as a thin green floating bar with sub-items 'Liquids: +41' and 'Gas: -40'; 2Q16 total bar 3,957 (solid blue #0070C0, full height from baseline). Value labels sit above each bar in semibold grey. Category labels sit below the baseline in semibold grey. Logo: ExxonMobil wordmark in red.
Slide 11
Upstream
Earnings – 2Q16 vs. 1Q16
Earnings increased $370M on higher liquids realizations, partially offset by
lower seasonal gas demand in Europe and other items
Millions of Dollars
960
(280)
(310)
294
(76)
1Q16
Realization
Vol/Mix
Other
2Q16
ExxonMobil
11
Visuals: One waterfall (bridge) chart with the title 'Millions of Dollars' printed centred above it, in millions of US dollars. No y-axis, gridlines or numeric axis scale are printed; only a thin grey horizontal zero baseline spans x about 10.5% to 89.5% at y 78.9%. Categories left to right: 1Q16, Realization, Vol/Mix, Other, 2Q16. Values as printed: 1Q16 (76) in blue #0070C0 hanging just below the baseline, value label above the bar; Realization 960 in green #009900 rising from baseline to about y 64.1%, label above; Vol/Mix (280) in red #C00000 floating from about y 64.1% down to about y 68.8%, label above; Other (310) in red #C00000 floating from about y 68.8% down to about y 74.0%, label above it; 2Q16 294 in blue #0070C0 rising from baseline to about y 74.0%, label above. Bar heights are approximately proportional to the values, with the 1Q16 bar height estimated at about 1.3% of the slide height. No legend, no highlighted points beyond colour coding: green for increase, red for decrease, blue for totals. Bars are 11.2% of slide width each, boxed by no outline, flat fills, no shadows. A small ExxonMobil wordmark logo sits bottom-right in red.
Slide 12
Upstream
Volumes – 2Q16 vs. 1Q16
Volumes decreased 8.5%: Liquids -208 kbd, natural gas -962 mcfd
koebd
4,325
(45)
(5)
(318)
3,957
Price, Spend,
& Other: -50
Net Interest: +5
Liquids: -154
Gas: -164
1Q16
Entitlements
Divestments
Growth/Other
2Q16
ExxonMobil
12
Visuals: Waterfall column chart titled koebd (thousand oil-equivalent barrels per day), no visible axis scale or gridlines, horizontal baseline in grey. Columns from left to right: 1Q16 total bar blue #0070C0 labelled 4,325, rising to top of chart; Entitlements floating red #C00000 bar labelled (45), a thin bar about 0.3 of the height of the step, with sub-labels Price, Spend, & Other: -50 and Net Interest: +5 beneath; Divestments thin red line labelled (5), nearly zero height; Growth/Other floating red #C00000 bar labelled (318), with sub-labels Liquids: -154 and Gas: -164 beneath; 2Q16 total bar blue #0070C0 labelled 3,957. Totals are not to scale with axis values; no legend; the negative steps are highlighted in red. Bars are flat-filled with no shadow.
Slide 13
Downstream
Earnings – 2Q16 vs. 2Q15
Earnings decreased $681M on weaker refining margins partly offset by
improved U.S. reliability and lower maintenance activity
Millions of Dollars
1,506
(850)
130
40
825
2Q15
Margin
Vol/Mix
Other
2Q16
13
Visuals: Chart: waterfall (bridge) chart, titled 'Millions of Dollars' (units in millions of US dollars; no axis labels or numeric axis shown; bars scaled to values). Categories left to right: 2Q15 = 1,506 (blue #0070C0 bar, full bar from baseline, top at about 44.5% height); Margin = (850) (red #C00000 floating bar, spanning from the top of the 2Q15 level down to about 66.4% height); Vol/Mix = 130 (green #009900 floating bar, about 44.4% to 55.7% width, about 63% to 66.5% height); Other = 40 (green #009900 thin floating bar, about 60.2% to 71.5% width, about 62% to 63.1% height); 2Q16 = 825 (blue #0070C0 bar, about 76% to 87.2% width, top at about 62.1% height). Data labels sit above each bar in bold grey. No legend. No highlighted points beyond the colour coding: blue for totals, red for the negative change, green for positive changes. Thin grey horizontal baseline (#7F7F7F, about 0.1% height) under the bars. Logo: ExxonMobil wordmark in red, bottom right.
Slide 14
Downstream
Earnings – 2Q16 vs. 1Q16
Earnings decreased $81M due to unfavorable foreign exchange effects and
higher maintenance costs partly offset by improved margins
Millions of Dollars
906
80
20
(180)
825
1Q16
Margin
Vol/Mix
Other
2Q16
14
Visuals: Waterfall chart, titled 'Millions of Dollars' (centred above the plot, grey #595959). No y-axis or gridlines are drawn; values are printed above or below each bar. Five categories on a shared baseline, left to right: 1Q16 (total bar, 906, blue #0070C0, top at about y 60%); Margin (increase of 80, green, about #009900, floating above the 1Q16 level); Vol/Mix (increase of 20, thin green bar, about #009900); Other (decrease of (180), red #C00000, hanging below the green step); 2Q16 (total bar, 825, blue #0070C0, top at about y 62.1%). Each bar is 11.2% of slide width. Value labels are bold grey #595959 above each bar: 906, 80, 20, (180), 825. Category labels sit below the baseline in bold grey: 1Q16, Margin, Vol/Mix, Other, 2Q16. The baseline is a thin grey #808080 line from about x 10.5% to 89.5%. No legend and no highlighted points beyond the colour coding. The ExxonMobil logo is a red wordmark on white (see elements).
Slide 15
Chemical
Earnings – 2Q16 vs. 2Q15
Earnings comparable to 2Q15 with stronger margins and higher sales
volumes offset by the absence of asset management gains
Millions of Dollars
1,246
150
70
(250)
1,217
2Q15
Margin
Vol/Mix
Other
2Q16
ExxonMobil
15
Visuals: Chart: waterfall (bridge) chart, title printed as Millions of Dollars, centred above the plot at about y 32%. Categories left to right: 2Q15, Margin, Vol/Mix, Other, 2Q16. No value axis or tick labels are printed; the only axis is a thin grey horizontal baseline at about y 83.4% spanning x 10.6% to 89.4%. Series values printed: 2Q15 = 1,246 (total bar, blue #0070C0, top at about y 51.2%); Margin = 150 (increase, green #009900, floating from about y 47.3% to 51.2%); Vol/Mix = 70 (increase, green #009900, about y 45.3% to 47.3%, label 70 printed above, value shown as estimate from bar height); Other = (250) (decrease, red #C00000, floating from about y 45.4% to 52.0%); 2Q16 = 1,217 (total bar, blue #0070C0, top at about y 52.0%). Value labels sit above each bar in bold grey #595959. Highlighted points: none beyond the colour coding of increases (green) and the decrease (red). No legend. The ExxonMobil logo is a red wordmark with a stylised double X, in the bottom right corner. No photographs or icons.
Slide 16
Chemical
Earnings – 2Q16 vs. 1Q16
Earnings decreased $138M due to weaker margins and increased
maintenance activity
Millions of Dollars
1,355
(90)
20
(70)
1,217
1Q16
Margin
Vol/Mix
Other
2Q16
16
Visuals: Chart: vertical waterfall (bridge) chart, titled 'Millions of Dollars' (unit: millions of US dollars). The value axis has no printed scale, no tick labels and no gridlines; the category axis is a single thin grey horizontal baseline at y 83.4% spanning about x 10.5% to 89.5%. Five columns left to right: 1Q16 total bar, Margin decrease, Vol/Mix increase, Other decrease, 2Q16 total bar. Labelled values: 1Q16 = 1,355 (total, printed above bar); Margin = (90) (decrease, printed above bar); Vol/Mix = 20 (increase, printed above bar); Other = (70) (decrease, printed above bar); 2Q16 = 1,217 (total, printed above bar). Estimated heights where no scale is printed: 1Q16 bar about 35% of the slide height from baseline; 2Q16 bar about 32%; floating bars are thin, about 2.5% (Margin), 0.7% (Vol/Mix) and 1.9% (Other) of the slide height. Floating bars are placed as a running total: Margin bar spans about 48.3% to 50.8% in y, Vol/Mix about 50.1% to 50.8%, Other about 50.1% to 52.0%. No legend. No highlighted points beyond colour coding: totals in blue, decreases in red, the increase in green. Logo: ExxonMobil wordmark in red with a stylised red X crossing the 'x'.
Slide 17
Upstream / Papua New Guinea / Adding quality resource to a successful business / Proposed acquisition of InterOil Corporation / Agreement worth more than $2.5 billion / $45 per share stock transaction / Contingent resource payment / Access to six licenses covering four million / acres / Large Elk-Antelope field; 6+ TCFe / Additional exploration upside / Strategic fit with existing PNG business / Potential project expansion / Project development and operating / excellence / Commercial/stakeholder relationships / ExxonMobil Operated PNG LNG Facilities / 17
Visuals: Photograph (aerial view, landscape, boxed with hard square corners, not cropped, not full-bleed) of the ExxonMobil-operated PNG LNG Facilities: a dense industrial gas processing plant of grey and silver pipe racks, process towers, vessels and structures on tan cleared ground, with two large white spherical/domed LNG storage tanks at upper right, a dark green vegetated coastline and a pale hazy sea horizon behind at top. Lighting is soft overcast daylight; dominant colours are tan/ochre, grey-silver, dark green and pale blue-grey haze. Framing is an elevated oblique aerial view from the front-left, subject filling the frame. Logo: ExxonMobil wordmark in red at bottom right. No overlay or tint on the photo. The header band is a blue gradient with a faint white fine-line wave/mesh pattern at its right half.
Slide 18
Upstream
Projects and Exploration Update
Advancing attractive new investment opportunities
■ On track to achieve 10 start-ups 2016/17
● Hebron Utilities and Process Module fabrication complete
● Upper Zakum island production reached 100 KBD
■ Sanctioned Tengiz Expansion Project
■ Progressing Guyana resource development
● Liza-2 confirms significant oil discovery
● Developing early production concept
● Drilling Skipjack exploration well
● Kaieteur Block farm-in
Hebron Utilities and Process Module Load-out
18
ExxonMobil
Visuals: One photograph: an aerial-angle view of the Hebron Utilities and Process Module being towed or moved on a large orange-red and grey barge across calm green-blue sea. The topside is a dense structure of white and grey process modules, yellow cranes and gantries, tall vertical flare-type stacks at left, and yellow handrails. A small blue-and-red tug boat sits at the left edge and a red vessel and distant hills with industrial structures and a tall white chimney appear on the horizon. A white wake trails at the lower left of the barge. Lighting is soft daylight with a pale hazy sky, blue to white gradient at top. Dominant colours: blue-green sea, orange-red barge hull, yellow and grey structure. The photo is rectangular, unrounded, unframed, not cropped to full bleed, sitting in the left column with no overlay or tint. No charts, tables or diagrams.
Slide 19
Upstream
U.S. Unconventional Operated Portfolio
Operations expertise drives growth, efficiency, inventory
Permian/Bakken Production
Gross Operated Production (koebd)
Development Cost
$/OEB
Permian/Bakken Inventory2
Cumulative Drillwell Inventory
Permian horizontal
Bakken
200
150
100
50
0
1Q13 3Q13 1Q14 3Q14 1Q15 3Q15 1Q16
Permian1
Bakken
30
25
20
15
10
5
0
'12 '13 1H14 2H14 1H15 2H15 1Q16
4,000
3,000
2,000
1,000
0
<$40 <$50 <$60
Permian1
Bakken
■ Leading operator and driller
■ Tripled gross operated production
■ Decreasing development cost
■ Cash operating cost ~ $8/OEB
■ Robust, price-resilient inventory
■ 9 Years of inventory at
2015 rig levels ($40 WTI)
1 Data specific to horizontal Wolfcamp / Spraberry wells
2 Drillwell inventory with 10% rate of return at flat real WTI prices
19
ExxonMobil
Visuals: Three charts, each with a legend in the upper-left of its plot area. (1) Area chart, titled 'Permian/Bakken Production', subtitle 'Gross Operated Production (koebd)'. Y-axis 0 to 200 (gridline labels 0, 50, 100, 150, 200), no gridlines. X-axis labels 1Q13, 3Q13, 1Q14, 3Q14, 1Q15, 3Q15, 1Q16. Two stacked series: Bakken (dark blue #0C479D, bottom) and Permian horizontal (lime green #B4D405, top). Values are not printed; about: Bakken starts near 52 at 1Q13 and rises to about 88 at 3Q14, about 110 at 3Q15, a peak about 127 at 1Q16, then about 123 at the last point. Total rises from about 56 at 1Q13 to about 185 at the last point (Permian horizontal band about 60 at the end). No highlighted points. (2) Clustered bar chart, titled 'Development Cost', subtitle '$/OEB'. Y-axis 0 to 30 with labels 0, 5, 10, 15, 20, 25, 30. X-axis categories '12, '13, 1H14, 2H14, 1H15, 2H15, 1Q16. Series Bakken (dark blue) and Permian1 (lime green). Values are not printed; about: Bakken '12 about 21.2, '13 about 16.8, 1H14 about 15.1, 2H14 about 14.3, 1H15 about 13.7, 2H15 about 10.8, 1Q16 about 9.9. Permian about: 2H14 about 25.8, 1H15 about 17.9, 2H15 about 9.8, 1Q16 about 8.0. Bakken has no bar for 2H14 Permian pairing beyond the adjacent slot. No highlighted points. (3) Stacked column chart, titled 'Permian/Bakken Inventory2', subtitle 'Cumulative Drillwell Inventory'. Y-axis 0 to 4,000 with labels 0, 1,000, 2,000, 3,000, 4,000. X-axis categories <$40, <$50, <$60. Stacked series Bakken (dark blue, bottom) and Permian1 (lime green, top). Values are not printed; about: <$40 Bakken about 780, total about 2,120; <$50 Bakken about 1,480, total about 2,930; <$60 Bakken about 2,160, total about 3,620. No highlighted points. Legend for each chart: lime green square followed by label, then dark blue square followed by label, stacked vertically. Other visuals: a blue header band with a fine lighter-blue wave/mesh line pattern on the right. A red ExxonMobil wordmark logo at bottom-right. Black square bullet glyphs before each bullet line.
Slide 20
Downstream & Chemical
Growing Higher-Value Product Sales
Selective investments in performance products
■ Completed Taicang lubricants plant expansion
■ Launched Exceed XP performance polymers
■ U.K. Santoprene products plant expansion FID
■ Beaumont ultra-low sulfur fuels FID
■ Evaluating project with SABIC for ethane
cracker and derivative units on U.S. Gulf Coast
Taicang lubricants plant
20
Visuals: One photograph: an aerial view of the Taicang lubricants plant in China, showing a dense cluster of white and beige cylindrical storage tanks on concrete hardstanding, with low-rise industrial buildings, a grey-green canal curving along the left edge, and flat farmland and haze in the far background. The camera looks down at an oblique angle from above and to one side, with the complex filling most of the frame. Lighting is soft, overcast daylight. Dominant colours are off-white, grey-beige, muted green and hazy grey. The photo is rectangular, not cropped to a shape, not full-bleed, and carries no overlay or tint. A photo caption sits below it. The header band is a blue gradient image with a fine curved line pattern, shading from deep blue #0B4FA8 at left to lighter cyan #1FA6E8 at right. The ExxonMobil logo is a red wordmark. Five black square bullet glyphs precede the bullet items.
Slide 21
YTD 2016 Sources and Uses of Cash
Integrated cash flow supports distributions and funds investments
$B
16
14
12
10
8
6
4
2
0
Debt & Other
Financing
$5.1B
Asset Sales
$1.2B
Cash Flow
From
Operations
$9.3B
Sources of Cash
Uses of Cash
Cash Build
$0.7B
PP&E Adds /
Investments
and
Advances²
$8.7B
Shareholder
Distributions
$6.2B
■ Financial flexibility to invest through cycle
■ Dividends per share up 2.7 percent vs. 2Q15
■ $1.8B of Free Cash Flow¹
¹ Calculated as Cash Flow from Operations and Asset Sales $10.5B less PP&E Adds / Investments and Advances ($8.7B)
² Includes PP&E Adds of ($8.9B) and net advances of $0.2B
21
Visuals: Chart: stacked column chart, two stacked columns, no chart title. Y-axis labelled $B, range 0 to 16 in steps of 2, with gridlines absent and a thin light grey horizontal baseline at 0. Left column 'Sources of Cash' stacks, bottom to top: Cash Flow From Operations $9.3B (dark blue #0C479D), Asset Sales $1.2B (medium blue #317EEF), Debt & Other Financing $5.1B (light blue #8EB8F6); total about 15.6. Right column 'Uses of Cash' stacks, bottom to top: Shareholder Distributions $6.2B (dark green #006600), PP&E Adds / Investments and Advances $8.7B (bright green #33CC33), Cash Build $0.7B (pale mint, about #C4F5D0); total about 15.6. Values are printed on each segment's right side; no legend, segments are labelled directly. No highlighted points. Logo: ExxonMobil wordmark in red, bottom right. Header: blue gradient banner with fine diagonal line texture, full width.
Slide 22
Summary
Delivering on commitments; creating long-term shareholder value
Billions of dollars
unless specified otherwise
YTD16
Highlights
Earnings
3.5
■ Resilient, integrated business
Cash Flow from Operations
and Asset Sales 1
10.5
■ Progressing investment plans
Upstream Production (MOEBD)
4.1
■ Extending competitive advantages
CAPEX
10.3
■ Reliable, growing dividend
Shareholder Distributions
6.2
1 Includes Proceeds Associated with Asset Sales of $1.2B
ExxonMobil
22
Visuals: Table with two columns and five rows, no column header other than YTD16 printed above the value column. Units line reads Billions of dollars unless specified otherwise (italic). Rows: Earnings 3.5; Cash Flow from Operations and Asset Sales (superscript 1) 10.5; Upstream Production (MOEBD) 4.1; CAPEX 10.3; Shareholder Distributions 6.2. Label column is white with thin black row rules and an outer black border of about 1.5 px; value column is solid black with white numerals centred. Four black square bullet glyphs (Arial) beside highlights, one per item. Decorative header band: blue gradient from deep blue at left to bright cyan at right with faint concentric wave lines over the right two-thirds. ExxonMobil wordmark logo in red at bottom right. No photographs or charts.
Slide 23
Questions
Visuals: Full-bleed landscape photograph of snow-dusted badlands hills in winter. A tall drilling rig stands on a ridge right of centre (about x 69-79%, y 19-63%): a white and blue substructure at its base, a steel lattice derrick rising to a yellow crown block at the top, and a black mast section beside it. A few small white and grey site buildings and a blue-grey tank sit at the far right of the ridge. Foreground has dark green conifers and rust-orange deciduous shrubs at the bottom, and snowy tan slopes on the left and right. The sky at the top is blue, fading to white and pale grey wispy clouds across the middle. Composition is a wide landscape frame with the rig placed on the right third, uncropped. Lighting is low winter sun with warm light on the slopes and cool blue shadows. Dominant colours: sky blue about #5FA8D3, cloud grey-white about #E4E7EB, snow white about #F2F4F5, badlands tan about #C8B79A, evergreen about #2B3A2A, rust orange about #B0643A. No overlay or tint is visible.
Download this deck
The hosted PDF of every library deck is free for readers of the SlideDeck Co newsletter. Join with your email and the viewer and download appear here.
Preparing a results presentation or business update of your own? The SlideDeck Co Standard Deck is a slide library for business reviews, updates and plans.