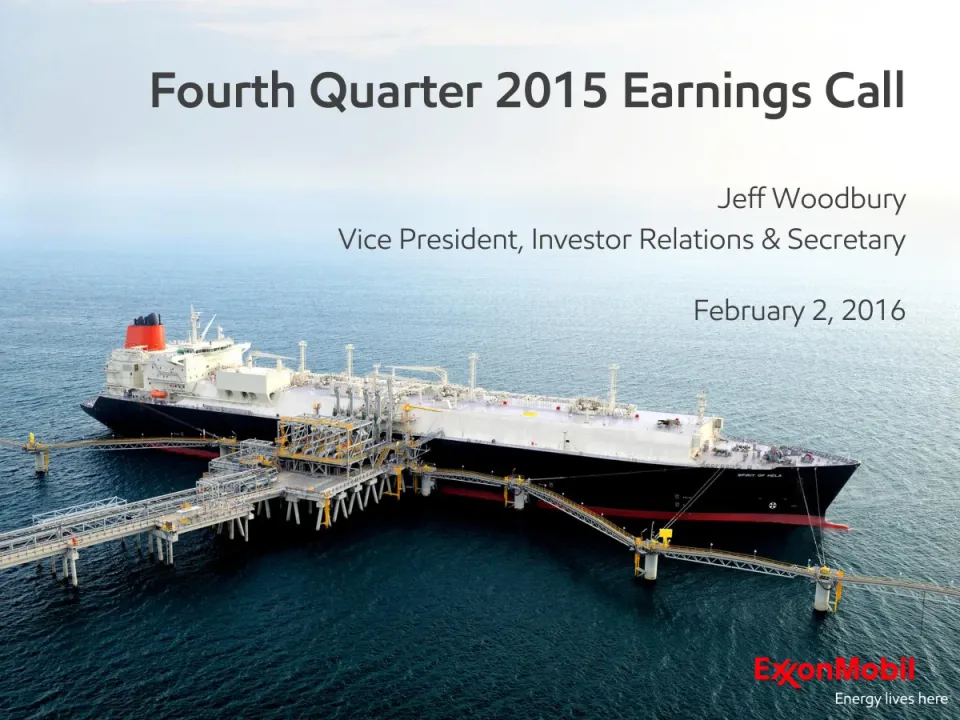
The deck opens with a title slide for the Fourth Quarter 2015 Earnings Call, presented by Jeff Woodbury on February 2, 2016, followed by a cautionary statement on forward-looking information and frequently used terms. It then moves to headlines and the business environment, noting slowing global growth and weaker crude, gas, refining and chemical prices. The core section compares fourth-quarter 2015 results with 4Q14 and 3Q15 across the company as a whole and within Upstream, Downstream and Chemical, using waterfall charts for earnings and volume bridges. Next come full-year 2015 financial results, sources and uses of cash, and a free cash flow discussion with the 2016 capital expenditure outlook. The deck then covers project start-ups and new acreage captures in Upstream, and closes with a summary table of 2015 results and a Questions slide. Slides worth studying include the 4Q15 financial results table, which uses a black-and-white value column for quick reading, the 4Q15 vs. 4Q14 total earnings waterfall, and the 2015 sources and uses of cash chart, which shows where cash came from and went in a single graphic.
Slides worth studying
- Slide 7: A simple waterfall bridge in red and green makes the direction and size of each segment's change readable at a glance.
- Slide 19: The sources and uses bar chart places inflows and outflows side by side, with callouts that turn a complex cash picture into one image.
- Slide 5: The high-contrast black value column with short labels presents key financial figures clearly with minimal text.
Details
- Company: ExxonMobil
- Year: 2016
- Type: Investor presentation
- Industry: Oil and gas
- Pages: 28
The hosted copy of this deck is being prepared. Newsletter readers will find the download here.
Review score: 7 out of 10, Effective
Presentation quality, judged with the SlideDeck Co review heuristic. Ask, evidence and idea merit are not rated here.
The strength is that every variance chart carries a one-sentence headline with the amount and the cause, so slide 7 reads 'Earnings decreased $3.8B as lower Upstream earnings were partially offset by stronger Downstream results' above a waterfall from 6,570 to 2,780, and the same pattern holds on slides 8, 11, 13, 16 and 21. Units sit on every chart and the cash tables on slides 6 and 18 bracket the lines that sum to 5.1 and 32.7. The bottleneck is that the exhibits stop at competence: the results table on slide 5 shows only the current quarter with no comparison column, the 'Other' bars are left unexplained on the page (for example (2,440) on slide 21), and the only outlook is one bullet on slide 19, 'Anticipate 2016 CAPEX of $23.2B, down $7.9B or 25% from 2015', sitting inside a results slide. Quarter and full-year sequences run back to back from slide 5 to slide 24 with no divider, and there is no definitions or reconciliation section beyond footnotes.
Worth keeping: Keep the sentence headline with amount and cause above each waterfall, as on slides 7, 8, 11, 13 and 16.
Most useful repair: Add prior-quarter and prior-year columns to the tables on slides 5 and 17 and a one-line note for each 'Other' bar on slides 9, 11, 13, 16 and 21, and move the 2016 CAPEX bullet from slide 19 to its own outlook slide.
What would change the score: If the 16 pages seen only on contact sheets carry explanations of the 'Other' bars or a separate outlook page that I could not read at that size, the score would move to 8.
Confidence high. 28 of 28 pages inspected on contact sheets, 12 at readable size. Reviewed 2026-11-15. Model-assisted review (claude-fable-5-2, in session).
Full text of the slides (28 slides)
Every slide's words and a description of its charts and images, so the deck can be searched and rebuilt. Also available as Markdown.
Slide 1
Fourth Quarter 2015 Earnings Call
Jeff Woodbury
Vice President, Investor Relations & Secretary
February 2, 2016
ExxonMobil
Energy lives here
Visuals: One full-bleed aerial photograph of an LNG carrier named SPIRIT OF HELA moored alongside an offshore loading jetty. The black-hulled ship with a white deck and superstructure and a red funnel runs diagonally across the centre-right. Yellow-and-white steel trestles and a loading platform extend from the left and bottom of the frame into the sea. The sky is pale hazy blue-white at the top, the sea is blue-grey and darkens toward the bottom. The lighting is soft, diffuse daylight. The image is not cropped inside a box, has no tint, and is uncropped at the edges. A small ExxonMobil wordmark in red with the tagline Energy lives here in white sits bottom right.
Slide 2
Cautionary Statement
Forward-Looking Statements. Outlooks, expectations, forecasts, estimates, targets, business plans, and other
statements of future events or conditions in this presentation or the subsequent discussion period are forward-looking
statements. Actual future results, including financial and operating performance; demand growth and mix;
ExxonMobil’s volume/production growth and mix; the amount and mix of capital expenditures; resource additions and
recoveries; finding and development costs; project plans, timing, costs, and capacities; drilling programs; product sales
and mix; dividend and share purchase levels; cash and debt balances; corporate and financing expenses; and the impact
of technology could differ materially due to a number of factors. These include changes in oil or gas prices or other
market conditions affecting the oil, gas, and petrochemical industries; the occurrence and duration of economic
recessions; reservoir performance; the outcome of exploration; timely completion of development projects; war and
other political or security disturbances; changes in law or government regulation, including sanctions as well as tax and
environmental regulations; the outcome of commercial negotiations; the impact of fiscal and commercial terms;
opportunities for investments or divestments that may arise; the actions of competitors and customers; unexpected
technological developments; unforeseen technical difficulties; and other factors discussed here and under the heading
"Factors Affecting Future Results" in the Investors section of our Web site at exxonmobil.com. See also Item 1A of
ExxonMobil’s 2014 Form 10-K. Forward-looking statements are based on management’s knowledge and reasonable
expectations on the date hereof, and we assume no duty to update these statements as of any future date.
Frequently Used Terms. References to resources, the resource base, barrels of oil, volumes of gas and liquids, and
similar terms include quantities that are not yet classified as proved reserves under SEC definitions but that we believe
will likely be developed and moved into the proved reserves category in the future. Shareholder distributions referred
to in this presentation mean cash dividends plus shares purchased to reduce shares outstanding (excluding anti-dilutive
purchases). For definitions and more information regarding resources, reserves, cash flow from operations and asset
sales, free cash flow, and other terms used in this presentation, including information required by SEC Regulation G,
see the "Frequently Used Terms" posted on the Investors section of our Web site and the additional information
provided in this presentation and in the 8-K filed today with our earnings press release and IR supplement. The
Financial and Operating Review on our Web site also shows ExxonMobil's net interest in specific projects.
The term ‘project’ as used in this presentation can refer to a variety of different activities and does not necessarily have
the same meaning as in any government payment transparency reports.
2
Visuals: Header band: a full-width blue gradient image (2000 by 157 px) across the top 14.2% of the slide, with a faint concentric curved line pattern of thin light lines, lighter cyan toward the right edge; not boxed, no border. ExxonMobil logo: red wordmark 'ExxonMobil' with a stylised X crossing the 'x', bottom right on white, not overlapping any text. No charts, tables or photographs.
Slide 3
Headlines / Full-year earnings of $16.2B; fourth quarter earnings of $2.8B / ■ Relentless focus on business fundamentals, including project execution / and cost management / ■ Downstream and Chemical results highlight strength of integrated businesses / ■ Six major Upstream projects contribute to 3.2 percent volume growth / ■ 2015 Cash flow from operations and asset sales $32.7B1; positive free cash flow / 1 Includes Proceeds Associated with Asset Sales of $2.4B. See slide 19 for calculation of free cash flow / ExxonMobil / 3
Visuals: A decorative header band image, 2000 by 157 pixels, spanning the full slide width at the top: a blue gradient from deep blue at the left to bright cyan at the right, overlaid with fine concentric arc line-work pattern, mostly on the right half. A small ExxonMobil wordmark logo in red at the bottom right, in red #E30613-like red with the 'Exx' and 'onMobil' letterforms and a stylised X. No charts, tables or photographs.
Slide 4
Business Environment
Global economic growth continued to slow during the fourth quarter
■ U.S. growth softened
■ China continued to decelerate; ongoing economic weakness in Japan
■ Europe remained stable with continued tepid growth
■ Crude oil and natural gas prices extended declines
■ Global refining and chemical margins weakened
ExxonMobil
4
Visuals: A decorative blue header band image (2000 by 157 px) with a gradient from deep blue at left to bright cyan at right and fine concentric wave-line pattern overlaid on the right half. The ExxonMobil wordmark logo in red at bottom right, approximately 14% wide and 3.7% high, with the red 'X' stylised as a crossed mark. No charts, tables or photographs.
Slide 5
4Q15 Financial Results / Earnings / 2.8 / Earnings Per Share – Diluted (dollars) / 0.67 / Shareholder Distributions / 3.6 / CAPEX / 7.4 / Cash Flow from Operations and Asset Sales 1 / 5.1 / Cash / 3.7 / Debt / 38.7 / Billions of dollars unless specified otherwise / 1 Includes Proceeds Associated with Asset Sales of $0.8B / 5 / ExxonMobil
Visuals: Table with two columns and seven rows, no header row. Column 1 holds row labels: Earnings; Earnings Per Share – Diluted (dollars); Shareholder Distributions; CAPEX; Cash Flow from Operations and Asset Sales with superscript 1; Cash; Debt. Column 2 holds values in white bold on solid black cells: 2.8; 0.67; 3.6; 7.4; 5.1; 3.7; 38.7. Each row is separated by a 2 px black horizontal rule running from x 16.2% to x 70.6%, with rules at about y 33.2%, 41.8%, 50.1%, 58.1%, 66.5%, 74.8% and 83.1%. The value cells are contiguous black blocks with no gaps. Header band: a photographic-style abstract illustration of concentric and radiating thin white arc lines over a blue gradient, dark blue #0B4EA2 at the left fading to bright cyan #1AA3E0 at the right, full-bleed across the top edge. ExxonMobil logo: red wordmark in bold sans-serif with a stylised X, at lower right.
Slide 6
4Q15 Sources and Uses of Cash
Cash balances decreased by $600M in the fourth quarter
Beginning Cash
4.3
Earnings
2.8
Depreciation
4.7
Working Capital / Other
(3.2)
Proceeds Associated with Asset Sales
0.8
PP&E Adds / Investments and Advances1
(6.0)
Shareholder Distributions
(3.6)
Debt / Other Financing
3.9
Ending Cash
3.7
5.1
Billions of dollars
1 Includes PP&E Adds of ($6.1B) and net advances / other of $0.1B
6
Visuals: Table with two columns and ten rows. Column 1 (labels): Beginning Cash; Earnings; Depreciation; Working Capital / Other; Proceeds Associated with Asset Sales; PP&E Adds / Investments and Advances (superscript 1); Shareholder Distributions; Debt / Other Financing; Ending Cash. Column 2 (values, billions of dollars, white text on solid black cells): 4.3; 2.8; 4.7; (3.2); 0.8; (6.0); (3.6); 3.9; 3.7. Beginning Cash and Ending Cash labels are bold; Beginning Cash, Ending Cash and their values are the bold rows, and the four indented rows Earnings through Proceeds Associated with Asset Sales are grouped by a grey curly brace on the right pointing to the bracketed total 5.1, which is the sum of the grouped values. Row labels other than the total rows are indented. Thin black horizontal rules separate rows (about 0.1% of slide height, spanning from x 16.6% to 69.9%). Value cells are solid black rectangles, all of equal width, with no highlighted points. The banner is a photograph-free abstract illustration: a blue gradient from deep blue on the left to bright cyan at the right with a fine concentric wave pattern of lighter blue lines on the right half, full-bleed, unboxed and uncropped. ExxonMobil wordmark logo in red at bottom-right, with the X drawn as a stylised crossing of two strokes. Footnote superscript 1 precedes the footnote text.
Slide 7
Total Earnings – 4Q15 vs. 4Q14
Earnings decreased $3.8B as lower Upstream earnings were partially offset
by stronger Downstream results
Millions of Dollars
6,570
(4,611)
854
(264)
231
2,780
4Q14
U/S
D/S
Chem
C&F
4Q15
7
Visuals: Waterfall chart titled 'Millions of Dollars' (no numeric axis shown; values printed on each bar). Categories left to right: 4Q14 = 6,570 (blue #0070C0 bar, starts from baseline, height about 43.8% of slide, top at y 40.4%); U/S = (4,611) (red #C00000 floating bar, top at 40.4% and bottom at 71.2%, i.e. decrease); D/S = 854 (green #009900 floating bar, top at 65.5%, bottom at 71.2%, increase); Chem = (264) (red #C00000 floating bar, decrease, about 1.8% of slide height, sits just below the D/S bar level); C&F = 231 (green #009900 floating bar, increase, about 1.6% of slide height); 4Q15 = 2,780 (blue #0070C0 bar from baseline, top at 65.7%). Bars are full-solid rectangles with no outlines; a thin grey (#999999 approximately) horizontal baseline runs under all bars from about x 14% to x 89%. No legend, no axis ticks, no highlighted points. Data labels sit above each bar in semibold grey. Photo: none; a logo is present (ExxonMobil wordmark in red).
Slide 8
Total Earnings – 4Q15 vs. 3Q15 / Earnings down $1.5B due to lower earnings across all business segments / Millions of Dollars / 4,240 / (501) / (682) / (264) / (13) / 2,780 / 3Q15 / U/S / D/S / Chem / C&F / 4Q15 / ExxonMobil / 8
Visuals: Waterfall chart with six categories on a horizontal baseline. Title: none inside the chart; caption 'Millions of Dollars' centred above the bars. Values: 3Q15 4,240 (blue total bar); U/S (501) (red decrease); D/S (682) (red decrease); Chem (264) (red decrease); C&F (13) (red decrease, very thin); 4Q15 2,780 (blue total bar). Y axis: no axis or scale is printed; bar heights are proportional to the printed values, so the 4,240 bar is about 28.3% of slide height and the 2,780 bar about 18.5%. Each bar's value label sits just above its bar, in grey. Legend: none. Highlighted points: none beyond the colour split of blue totals and red decreases. Baseline: thin grey horizontal line at the bottom of the bars, spanning about 8.5% to 91.5% of slide width. The ExxonMobil logo (red wordmark with stylised X) is a corner logo at bottom right.
Slide 9
Upstream
Earnings – 4Q15 vs. 4Q14
Earnings down $4.6B reflecting lower realizations as well as the absence of
prior year deferred income tax effects
Millions of Dollars
5,468
(3,750)
100
(960)
857
4Q14
Realization
Vol/Mix
Other
4Q15
9
ExxonMobil
Visuals: Waterfall chart titled 'Millions of Dollars' (unit label centred above plot), no visible y-axis or gridlines, value labels above each bar. Categories left to right: 4Q14 = 5,468 (blue bar, total, from baseline up to top); Realization = (3,750) (red bar, floating downward from the 4Q14 level, length about 3,750 units); Vol/Mix = 100 (green bar, thin, small positive step up); Other = (960) (red bar, floating downward); 4Q15 = 857 (blue bar, total, from baseline). Bars are drawn to scale against the 5,468 total: the 4Q14 bar is tallest, Realization is the largest red step. Horizontal grey baseline runs under all bars. Highlighted colours: blue for totals, red for decreases, green for the increase. A small ExxonMobil logo (red wordmark with stylised X) sits bottom right. Header band behind the title is a blue gradient with a faint wave/mesh texture on the right.
Slide 10
Upstream / Volumes – 4Q15 vs. 4Q14 / Volumes increased 4.8%: Liquids +299 kbd, natural gas -631 mcfd / koebd / 4,054 / 178 / Price, Spend, / & Other: +185 / Net Interest: -7 / (19) / 35 / Liquids: +167 / Gas: -132 / 4,248 / 4Q14 / Entitlements / Divestments / Growth/Other / 4Q15 / ExxonMobil / 10
Visuals: Waterfall bar chart in koebd (thousand oil-equivalent barrels per day), titled koebd, placed above the chart area. No value axis or gridlines are printed. Categories left to right: 4Q14 total 4,054; Entitlements +178 with sub-labels Price, Spend, & Other +185 and Net Interest -7; Divestments (19); Growth/Other +35 with sub-labels Liquids +167 and Gas -132; 4Q15 total 4,248. Total bars are blue #0070C0 and rise from the baseline, with the 4Q14 bar about 39% of the slide height tall and the 4Q15 bar about 41% tall. Increase is green #008000 (Entitlements, Growth/Other) and decrease is red #C00000 (Divestments), floating as thin bars at the level of the running total. The 4Q14 and 4Q15 bar tops sit at about the same visual step as the floating bars. Thin grey #A6A6A6 baseline runs across the chart. No legend and no highlighted points beyond the colour coding. The ExxonMobil logo is a red #ED1C24 wordmark, and a blue gradient header image with concentric curved line pattern runs across the top.
Slide 11
Upstream / Earnings – 4Q15 vs. 3Q15 / Earnings decreased $501M as lower realizations were partly offset by / higher volumes and other items / Millions of Dollars / 1,358 / (840) / 250 / 90 / 857 / 3Q15 / Realization / Vol/Mix / Other / 4Q15 / ExxonMobil / 11
Visuals: Vertical waterfall chart in millions of dollars with the chart title 'Millions of Dollars' centred above the plot. There is no printed value axis or gridlines; each bar carries its value label above it. Five bars, left to right: 3Q15 = 1,358 (blue #0070C0, total bar starting from the baseline, top about 44.4% of slide height); Realization = (840) (red #C00000, decrease floating from the level of 1,358 down to about 61.7% of slide height); Vol/Mix = 250 (green #009900, increase floating above the Realization bar bottom, spanning about 61.7% to 68.9%); Other = 90 (green #009900, increase about 59.0% to 61.7%); 4Q15 = 857 (blue #0070C0, total bar from the baseline up to about 59.1% of slide height). Category labels under each bar: 3Q15, Realization, Vol/Mix, Other, 4Q15. A thin grey horizontal baseline runs under all bars at about 84.2% of slide height, from about 10.6% to 89.6% horizontally. No legend. No bars are highlighted beyond their colour coding. Value labels are bold grey #595959. Bar width is about 11.2% of slide width. Logo: ExxonMobil wordmark in red #E30613-style red with the 'x' drawn as a crossed stroke, on white, about 14% wide.
Slide 12
Upstream / Volumes – 4Q15 vs. 3Q15 / Volumes increased 8.4%: Liquids +150 kbd, natural gas +1.1 bcfd / koebd / 223 / 4,248 / 119 / (12) / 3,918 / Liquids: +88 / Price, Spend, / Gas: +135 / & Other: +116 / Net Interest: +3 / 3Q15 / Entitlements / Divestments / Growth/Other / 4Q15 / ExxonMobil / 12
Visuals: Waterfall chart of volumes in koebd (thousand oil-equivalent barrels per day), titled 'koebd' above the bars. Five categories along the x-axis: 3Q15, Entitlements, Divestments, Growth/Other, 4Q15. Bars: 3Q15 total 3,918 (blue #0070C0 column from baseline up to about 47% height); Entitlements increase 119 (green floating bar, sub-labels 'Price, Spend, & Other: +116' and 'Net Interest: +3'); Divestments decrease (12) (thin red line at the step level, no fill); Growth/Other increase 223 (green floating bar, sub-labels 'Liquids: +88' and 'Gas: +135'); 4Q15 total 4,248 (blue column reaching about 43% height). No y-axis or gridlines are printed; no legend; no values are estimated, all values are printed. Baseline is a thin grey horizontal line across the chart. Highlighted points: none beyond the colour coding green for increases and red for the decrease. The ExxonMobil logo is a red wordmark with stylised X.
Slide 13
Downstream
Earnings – 4Q15 vs. 4Q14
Earnings increased $854M due to stronger refining margins, favorable / volumes mix, and lower maintenance activities
Millions of Dollars
170
1,351
70
610
497
4Q14
Margin
Vol/Mix
Other
4Q15
13
Visuals: Chart: waterfall (bridge) column chart. Title: 'Millions of Dollars' centred above the plot in grey, no axis labels or tick values printed, value labels printed above each bar. Categories left to right: 4Q14, Margin, Vol/Mix, Other, 4Q15. Series values: 4Q14 = 497 (blue total bar, about 0 to 497 on the scale), Margin = 610 (green floating bar, rising from 497 to 1,107), Vol/Mix = 70 (green floating bar, rising from 1,107 to 1,177), Other = 170 (green floating bar, rising from 1,177 to 1,347), 4Q15 = 1,351 (blue total bar, about 0 to 1,351). Value labels are about 1,351 and 170 above the tall bars at the top. Increase bars are green #009900, totals are blue #0070C0. No legend. No highlighted points beyond the colour coding. A thin grey horizontal baseline runs under all bars. Logo: ExxonMobil wordmark in red at bottom right. Header: decorative blue banner with a fine white concentric-ring ripple pattern fading to lighter cyan at the right.
Slide 14
Downstream
Earnings – 4Q15 vs. 3Q15
Earnings decreased $682M on lower margins
Millions of Dollars
2,033
(860)
60
120
1,351
3Q15
Margin
Vol/Mix
Other
4Q15
14
ExxonMobil
Visuals: Waterfall chart titled 'Millions of Dollars' (label placed top centre of plot area), units millions of US dollars, no visible axis scale or gridlines; values printed above each bar. Categories left to right: 3Q15 = 2,033 (blue total bar, full height reference); Margin = (860) (red decrease bar floating from 2,033 down to about 1,173); Vol/Mix = 60 (small green increase bar, about 60 units above its start); Other = 120 (green increase bar floating above Vol/Mix); 4Q15 = 1,351 (blue total bar). Bar heights are proportional to values; the 3Q15 bar is about 2,033 units tall and the 4Q15 bar about 1,351 units tall. No legend. Highlighted points: the Margin decrease in red, the increases in green, the totals in blue. Baseline is a thin grey horizontal line. Bars are flat with no shadows.
Slide 15
Chemical
Earnings – 4Q15 vs. 4Q14
Earnings down $264M reflecting weaker margins and unfavorable other
items, partly offset by favorable volumes mix
Millions of Dollars
1,227
(210)
170
(230)
963
4Q14
Margin
Vol/Mix
Other
4Q15
15
ExxonMobil
Visuals: Waterfall chart, titled 'Millions of Dollars' centred above the plot. Vertical axis not labelled with a scale; values printed above each bar. Categories left to right: 4Q14 value 1,227 (blue bar, total); Margin value (210) (red bar, decrease, floating from about 1,227 down to about 1,017); Vol/Mix value 170 (green bar, increase, floating from about 1,017 up to about 1,187 position above the margin step bottom); Other value (230) (red bar, decrease, floating down to about 963); 4Q15 value 963 (blue bar, total). Bars are about 11% of slide width each, evenly spaced, with a thin grey horizontal baseline under them spanning from about 10.6% to 89.4% of width. No legend. No highlighted points beyond colour coding: blue totals, red decreases, green increase. Logo: ExxonMobil wordmark in red, bottom right.
Slide 16
Chemical / Earnings – 4Q15 vs. 3Q15 / Earnings declined $264M as weaker margins and higher maintenance / activities were partly offset by favorable volumes mix / Millions of Dollars / 1,227 / (190) / 80 / (160) / 963 / 3Q15 / Margin / Vol/Mix / Other / 4Q15 / 16
Visuals: Waterfall chart, titled 'Millions of Dollars' (centred above the plot, not a formal axis title), with no y-axis scale or gridlines printed. Categories left to right on a horizontal baseline: 3Q15, Margin, Vol/Mix, Other, 4Q15. Values: 3Q15 = 1,227 (blue total bar, full height from baseline to about 46.6% of slide height); Margin = (190) (red floating bar, decrease, hanging from the 3Q15 top level down to about 52.5%); Vol/Mix = 80 (green floating bar, increase, between about 49.8% and 52.5%); Other = (160) (red floating bar, decrease, from about 49.8% down to about 54.7%); 4Q15 = 963 (blue total bar, top at about 54.7%). Bars are about 11% of slide width wide, evenly spaced. Data labels sit directly above each bar in bold grey. Category labels sit below the baseline in bold grey. No legend. Highlighted points: the two decrease bars are red and the one increase bar is green; the two totals are blue. Baseline is a thin grey horizontal line spanning about 10.6% to 89.6% of width at about 84% of height. Decorative header banner is a full-width illustration: blue gradient with fine concentric curved-line texture, not a photograph.
Slide 17
2015 Financial Results
Earnings
16.2
Earnings Per Share – Diluted
(dollars)
3.85
Shareholder Distributions
15.1
CAPEX
31.1
Cash Flow from Operations and Asset Sales
1
32.7
Cash
3.7
Debt
38.7
Billions of dollars unless specified otherwise
1
Includes Proceeds Associated with Asset Sales of $2.4B
ExxonMobil
17
Visuals: Table with two columns and seven rows, no header row. Column 1 (labels, left-aligned, dark grey #595959 semibold): Earnings; Earnings Per Share – Diluted (dollars); Shareholder Distributions; CAPEX; Cash Flow from Operations and Asset Sales (with superscript 1); Cash; Debt. Column 2 (values, centred, white semibold on black cells): 16.2; 3.85; 15.1; 31.1; 32.7; 3.7; 38.7. Row rules: thin black horizontal lines separate each row from the next across the label column, and the value cells are solid black blocks stacked with no gap. The word (dollars) is set in italic. A black caption below the table reads Billions of dollars unless specified otherwise in italic. Header graphic: a blue banner with fine concentric ring and mesh line texture running from deep blue on the left to bright cyan on the right, cropped to a full-width strip. Logo: the red ExxonMobil wordmark with the X drawn as a stylised cross, placed bottom right.
Slide 18
2015 Sources and Uses of Cash
Cash balances decreased by $1B in 2015
Beginning Cash1 / 4.7
Earnings / 16.2
Depreciation / 18.0
Working Capital / Other / (3.9)
Proceeds Associated with Asset Sales / 2.4
PP&E Adds / Investments and Advances2 / (26.2)
Shareholder Distributions / (15.1)
Debt / Other Financing / 7.6
Ending Cash / 3.7
32.7
Billions of dollars
1 Beginning balance includes restricted cash of $0.1B
2 Includes PP&E Adds of ($26.5B) and net advances / other of $0.3B
18
ExxonMobil
Visuals: A table with two columns and ten rows, with thin black horizontal rules between rows. Left column labels, right column values in white bold numerals on solid black cells. Rows top to bottom: Beginning Cash (bold) 4.7; Earnings 16.2; Depreciation 18.0; Working Capital / Other (3.9); Proceeds Associated with Asset Sales 2.4; PP&E Adds / Investments and Advances (superscript 2) (26.2); Shareholder Distributions (15.1); Debt / Other Financing 7.6; Ending Cash (bold) 3.7. A grey curly bracket spans the rows Earnings through Proceeds Associated with Asset Sales (values 16.2, 18.0, (3.9), 2.4) on the right side of the value column, labelled 32.7 in bold grey to its right. Units: billions of dollars, stated in italic below the table. Header band is a blue gradient with a faint white concentric wave-line pattern on the right half, full-bleed across the top. ExxonMobil red wordmark logo at bottom-right.
Slide 19
2015 Sources and Uses of Cash
Integrated cash flow supports distributions and funds investments
$B
45
40
35
30
25
20
15
10
5
0
Cash Draw
$1.0B
$7.6B
Debt & Other
Financing
$2.4B
Asset Sales
$30.3B
Cash Flow
From
Operations
$26.2B
PP&E Adds /
Investments
and
Advances2
$15.1B
Shareholder
Distributions
Sources of Cash
Uses of Cash
Financial flexibility to invest through cycle
2015 Dividends per share up 6.7% vs. 2014
Buy-back program tapered
$6.5B of Free Cash Flow1
Anticipate 2016 CAPEX of $23.2B,
down $7.9B or 25% from 2015
1 Calculated as Cash Flow from Operations and Asset Sales $32.7B less PP&E Adds / Investments and Advances ($26.2B)
2 Includes PP&E Adds of ($26.5B) and net advances / other of $0.3B
19
Visuals: Stacked column chart with two columns on a shared $B axis running 0 to 45 in steps of 5, with axis tick labels at the left and a thin light grey baseline. Left column 'Sources of Cash' stacks from bottom to top: Cash Flow From Operations $30.3B (dark blue #0C479D, white label), Asset Sales $2.4B (about #2F7DE1, white label), Debt & Other Financing $7.6B (light blue #8EB8F6, white label), Cash Draw $1.0B (about #0B2A66 navy, dark grey label above the bar); the column tops at about 41 on the axis. Right column 'Uses of Cash' stacks from bottom to top: Shareholder Distributions $15.1B (dark green #006600, white label) and PP&E Adds / Investments and Advances2 $26.2B (bright green #33CC33, white label), with a thin white separator between them; the column top is about 41 on the axis. Value labels sit to the right of each segment in grey #595959. Column labels 'Sources of Cash' and 'Uses of Cash' sit under the baseline. No legend; segments are labelled directly. No points highlighted. Bulleted list at right uses black square glyphs (Arial) before each statement; superscript 1 follows '$6.5B of Free Cash Flow' and superscript 2 follows 'Advances' in the chart label, both as footnote markers. ExxonMobil wordmark logo in red at bottom right.
Slide 20
Total Earnings – 2015 vs. 2014 / Earnings decreased $16.4B on weaker Upstream results, partially offset by / stronger Downstream performance and lower corporate costs / Millions of Dollars / 32,520 / (20,447) / 3,512 / 103 / 462 / 16,150 / 2014 / U/S / D/S / Chem / C&F / 2015 / ExxonMobil / 20
Visuals: Waterfall chart titled 'Millions of Dollars' (no explicit axis labels or numeric axis; values printed on each bar). Six bars left to right with labelled values: 2014 total bar 32,520 (blue #0070C0, starts from baseline); U/S bar (20,447) (red #C00000, floating downward from top of 2014 bar, about 26.2% of slide height tall); D/S bar 3,512 (green #009900, floating, about 4.5% of slide height tall, positioned below the U/S bar bottom); Chem bar 103 (green #009900, very thin floating bar); C&F bar 462 (green #009900, thin floating bar); 2015 total bar 16,150 (blue #0070C0, starts from baseline). Thin grey horizontal baseline (about #808080) under all bars. No legend. No highlighted points beyond colour coding: blue totals, red negative, green positives. Value labels sit above each bar in semibold grey.
Slide 21
Upstream
Earnings – 2015 vs. 2014
Earnings decreased $20.4B due to sharply lower realizations and lower asset
management gains, partly offset by favorable volumes mix effects
Millions of Dollars
27,548
(18,820)
810
(2,440)
7,101
2014
Realization
Vol/Mix
Other
2015
ExxonMobil
21
Visuals: Waterfall bar chart. Chart title/unit label: 'Millions of Dollars', centred above the bars at about y 32%. No value axis or gridlines are printed; the baseline is a thin grey horizontal line at about y 84.2%. Five categories left to right, with each value printed above or beside its bar: 2014 total bar in blue #0070C0 labelled 27,548; Realization negative bar in red #C00000 labelled (18,820), spanning from the top of the 2014 level down; Vol/Mix positive bar in green (about #008000) labelled 810, a thin bar; Other negative bar in red #C00000 labelled (2,440); 2015 total bar in blue #0070C0 labelled 7,101. Category labels under the baseline: 2014, Realization, Vol/Mix, Other, 2015. No legend, no highlighted points, no series beyond the single waterfall series. Bar heights are proportional to values; the 2014 bar and the Realization bar are the tallest. Also a full-width header photograph-like banner (see elements) is non-chart visual.
Slide 22
Upstream
Volumes – 2015 vs. 2014
Volumes increased 3.2%: Liquids +234 kbd, natural gas -630 mcfd
koebd
3,969
148
Price, Spend,
& Other: +168
Net Interest: -20
(25)
5
Liquids: +122
Gas: -117
4,097
2014
Entitlements
Divestments
Growth/Other
2015
22
Visuals: Waterfall chart titled 'koebd' (thousand oil-equivalent barrels per day), centred above the plot at about y 31%. Five columns left to right: 2014 total bar 3,969 (blue #0070C0, full-height bar from baseline to about y 46%); Entitlements increment bar 148 (green, floating, about x 32% to 40%, y 44% to 47%) with detail labels 'Price, Spend, & Other: +168' and 'Net Interest: -20' printed beneath it; Divestments decrement bar (25) (red, thin floating bar about x 48% to 56%, y 44.5% to 45.5%); Growth/Other increment bar 5 (thin green line about x 60% to 72%, y 44%) with sub-labels 'Liquids: +122' and 'Gas: -117' beneath it; 2015 total bar 4,097 (blue #0070C0, about x 76% to 87%, top at about y 44.8%). Values are printed above each column. Axis: horizontal baseline in grey (about #A6A6A6) at about y 84.5%, from about x 10% to 90%; no vertical axis or scale shown; no legend; no highlighted points beyond the colour coding (blue totals, green increases, red decrease). Header band is a photographic-style blue gradient with fine concentric curved line pattern on the right, spanning the full width at the top.
Slide 23
Downstream / Earnings – 2015 vs. 2014 / Earnings increased $3.5B on stronger margins, partially offset by higher / maintenance activities / Millions of Dollars / 4,130 / (200) / (420) / 6,557 / 3,045 / 2014 / Margin / Vol/Mix / Other / 2015 / 23
Visuals: Chart: vertical waterfall (bridge) chart titled by the axis label Millions of Dollars, with no visible y-axis scale, gridlines or tick values. Categories left to right: 2014, Margin, Vol/Mix, Other, 2015. Series values: 2014 = 3,045 (total bar, blue #0070C0, spans about 67.9% to 84.2% of slide height); Margin = 4,130 (increase, green #009900, floating from the 3,045 level up to about 45.7% of slide height); Vol/Mix = (200) (decrease, red #C00000, about 45.7% to 46.9% of slide height, about 11.2% wide); Other = (420) (decrease, red #C00000, about 46.7% to 49.1% of slide height); 2015 = 6,557 (total bar, blue #0070C0, top at about 49.0% of slide height). Bars are about 11.2% of slide width each, with even spacing and value labels in bold grey above each bar. A thin grey #A6A6A6 horizontal baseline runs under all bars from about 10.6% to 89.6% of slide width at about 84.2% of slide height. No legend. No highlighted points beyond the colour coding of increases (green) and decreases (red). Image: ExxonMobil logo, red wordmark #E31B23 with the X drawn as a stylised cross, bottom right. Header banner: decorative blue gradient graphic with faint concentric wave/ripple line pattern across the right two-thirds, lighter toward the right edge.
Slide 24
Chemical / Earnings – 2015 vs. 2014 / Earnings increased $103M driven by stronger margins and favorable / volumes mix, mostly offset by unfavorable foreign exchange effects / Millions of Dollars / 220 / (710) / 590 / 4,418 / 4,315 / 2014 / Margin / Vol/Mix / Other / 2015 / 24
Visuals: Waterfall bar chart titled Millions of Dollars, with no axis tick labels printed. Categories left to right: 2014, Margin, Vol/Mix, Other, 2015. Printed values: 2014 = 4,315 (blue total bar); Margin = 590 (green increase floating above 2014 level); Vol/Mix = 220 (green increase, about 220 in height above Margin level); Other = (710) (red decrease floating down); 2015 = 4,418 (blue total bar). Bar heights are drawn to scale against an unlabelled baseline at about 84.2% of slide height, with a thin grey horizontal axis line. Totals are blue #0070C0, increases green #009900, decrease red #C00000. No legend, no gridlines, no highlighted points beyond the colour coding. The ExxonMobil wordmark logo in red sits bottom right.
Slide 25
Upstream / Projects Update / Adding higher-value production capacity to meet long-term demand growth / Six 2015 major project start-ups added / 300 KOEBD of working interest capacity / Permian and Bakken work programs / added 85 KOEBD gross production / Banyu Urip CPF started up in 4Q, ramping / to full capacity / Anticipate six major project start-ups in 2016 / Banyu Urip Central Processing Facility, Indonesia / 25 / ExxonMobil
Visuals: Aerial photograph of the Banyu Urip Central Processing Facility, Indonesia. Subject: a large onshore gas processing plant with dense pipe racks, process vessels, spherical and cylindrical storage tanks, grey industrial buildings, a circular clarifier basin, a red-and-white lattice flare or telecom tower, roads and cleared construction land with green vegetation at the top edge. Composition: elevated oblique aerial view looking down across the site, filling a rectangular box 799 by 660 pixels, unframed and not cropped to a shape. Lighting: daylight, even, soft. Dominant colours: grey, beige, tan earth, green vegetation, with red accents on the tower. No overlay or tint. Photograph is boxed with hard square corners and no border.
Slide 26
Upstream
New Opportunity Growth
Executing paced, focused program
Drilling Update
Guyana: seismic acquisition nearly
complete; drilling planned 1Q16
Romania: completed Black Sea drilling
Argentina: beginning production
pilot program
New Acreage Captures
Guyana: acquired 521,000 net acres in
Canje Block
Uruguay: captured 579,000 net acres in
deepwater Block 14
Eastern Canada: awarded 652,000 net acres
offshore Newfoundland
Western Canada: added 10,000 net acres
in Alberta’s Duvernay shale
Canada
Romania
Canada
East Coast
Guyana
Argentina
Uruguay
Drilling
Acreage Capture
26
Visuals: Illustration: a flat world map in pale blue-grey land with thin darker country borders and coastlines, shown unboxed with no frame, on white. Five markers are overlaid: a green circle with a yellow star for Guyana (the star slightly right of the circle, and the two overlapping), a green circle with a yellow star for Uruguay (star to the right of the Argentina circle, nearly touching), a yellow star for Canada (north-west, above the label 'Canada'), a yellow star for Canada East Coast (east of the Canada star), and a green circle for Romania in Eastern Europe. Labels 'Canada', 'Romania', 'Canada East Coast', 'Guyana', 'Argentina' and 'Uruguay' sit beside their markers in bold black. Legend beneath the map: green circle (#66FF33 fill, black outline) labelled 'Drilling'; yellow star (#FFD21F fill, black outline) labelled 'Acreage Capture'. Header band: a photographic-style abstract blue gradient with fine concentric wave lines, dark blue #0B4DA2 at left shifting to bright cyan #1AA3E0 at right, full width, unboxed. ExxonMobil logo: red wordmark (#E30613) with the double-x stylised, bottom right.
Slide 27
Summary
Integrated business delivers resilient performance
Billions of dollars / unless specified otherwise
2015
Highlights
Earnings
16.2
Upstream Production (MOEBD)
4.1
Cost Reductions
11.5
Cash Flow from Operations / and Asset Sales1
32.7
Free Cash Flow2
6.5
Shareholder Distributions
15.1
■ Capturing Downstream & Chemical value
■ Leading project execution capabilities
■ Continued investment and cost discipline
■ Positive free cash flow
■ Reliable, growing dividend
1 Includes Proceeds Associated with Asset Sales of $2.4B
2 Calculated as Cash Flow from Operations and Asset Sales $32.7B less PP&E Adds / Investments and / Advances ($26.2B)
ExxonMobil
27
Visuals: Table with 6 rows and 2 columns plus a header row. Header row: column one has the italic note 'Billions of dollars unless specified otherwise' and column two has '2015'. Rows: Earnings | 16.2; Upstream Production (MOEBD) | 4.1; Cost Reductions | 11.5; Cash Flow from Operations and Asset Sales (superscript 1) | 32.7; Free Cash Flow (superscript 2) | 6.5; Shareholder Distributions | 15.1. Label cells are white with thin black horizontal rules between rows and a black outer border; value cells are solid black fill (#000000) with white bold numerals, centred. Right side has five black square bullets (■, Arial) before the highlight lines. Top banner is a blue gradient from deep blue #0B4A9C at left to bright cyan-blue #1AA3DC at right, with fine concentric arc line-pattern texture on the right half. ExxonMobil red wordmark logo bottom-right in red #E30613.
Slide 28
Questions / ExxonMobil
Visuals: Photograph, full-bleed, covering 100% of the slide. Subject: an industrial gas-processing plant seen from an elevated three-quarter view. Three tall silver-grey stacks or towers with caged top platforms and yellow handrailed landings stand across the middle distance, joined by steel pipe racks, valves, cylindrical vessels and a long flat galvanised structure in the foreground. Action: none; the scene is static. Composition: wide landscape frame, horizon near the middle, plant spanning the full width, sky occupying the top 40%. Lighting: bright overcast daylight with strong HDR-style contrast and detail in clouds and metal. Dominant colours: blue sky (about #3F78B8), white-grey cumulus clouds (about #E6EAEE), silver-grey steel (about #9AA3AB), safety yellow railings (about #F2C200), and a red valve (about #C8102E). The photo is not cropped, boxed or tinted, and carries no overlay. Logo: ExxonMobil wordmark in white, placed over the photo in the bottom-right corner.
Download this deck
The hosted PDF of every library deck is free for readers of the SlideDeck Co newsletter. Join with your email and the viewer and download appear here.
Preparing a results presentation or business update of your own? The SlideDeck Co Standard Deck is a slide library for business reviews, updates and plans.