

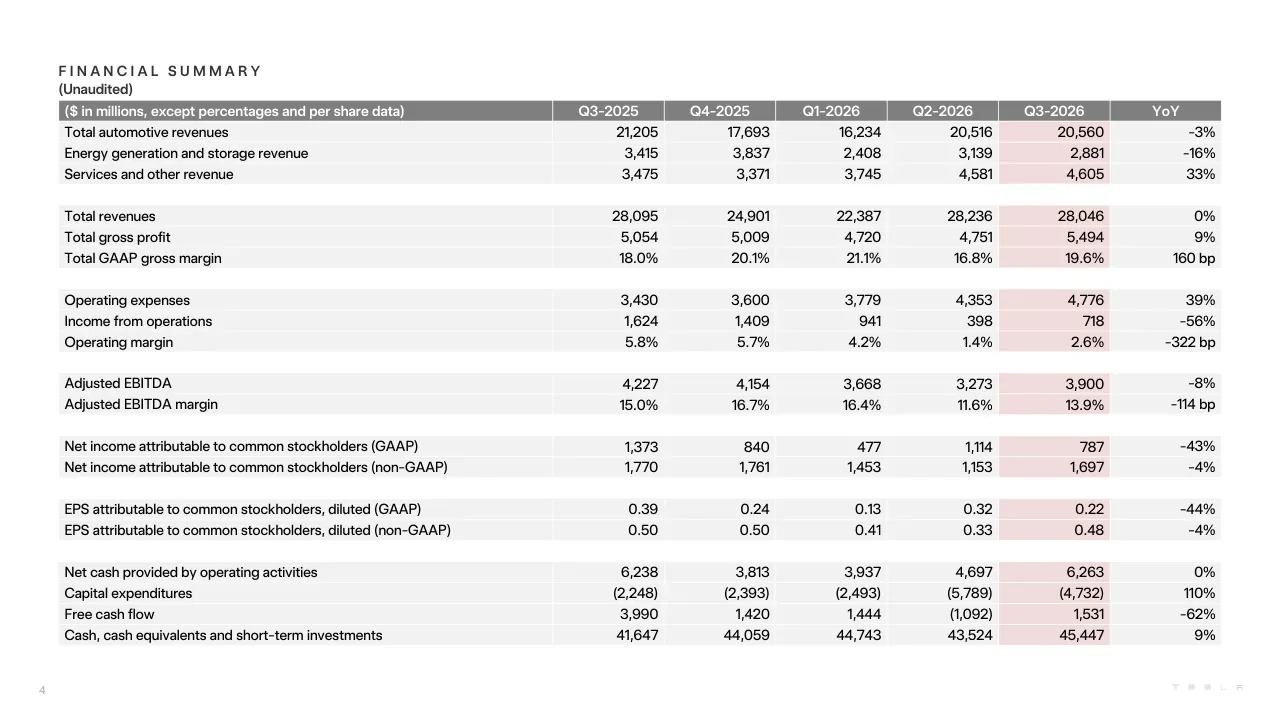
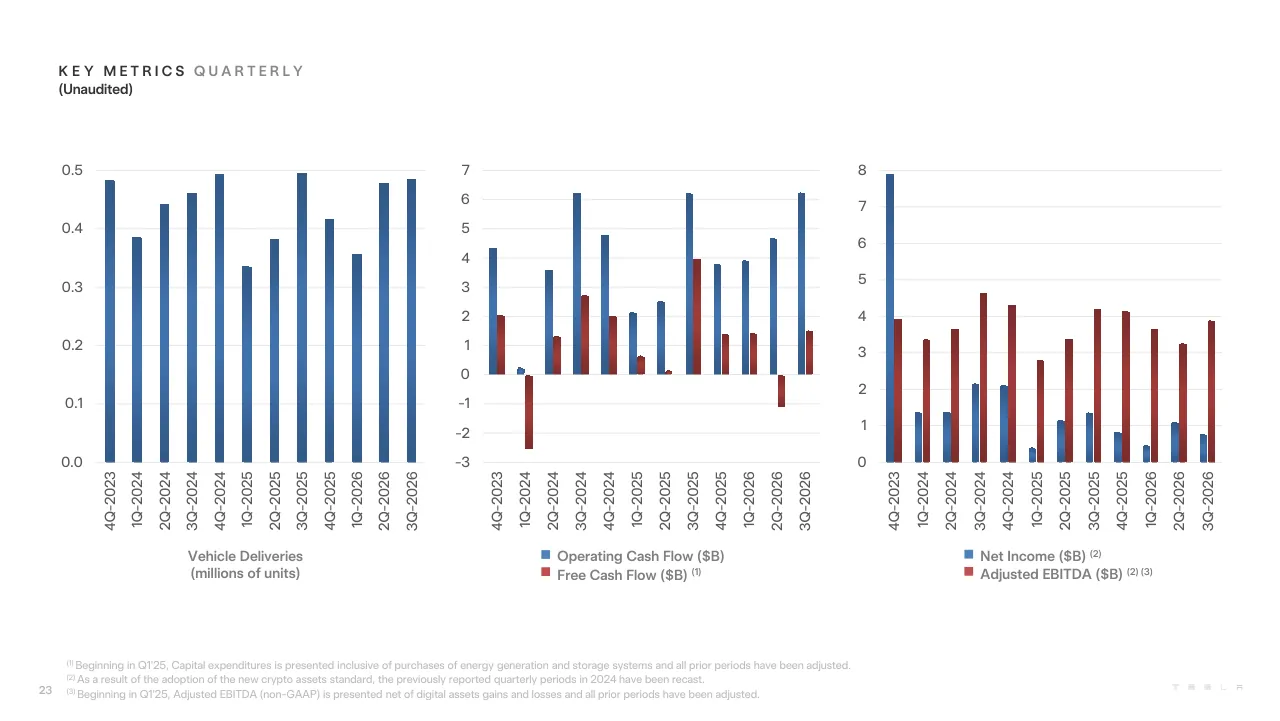
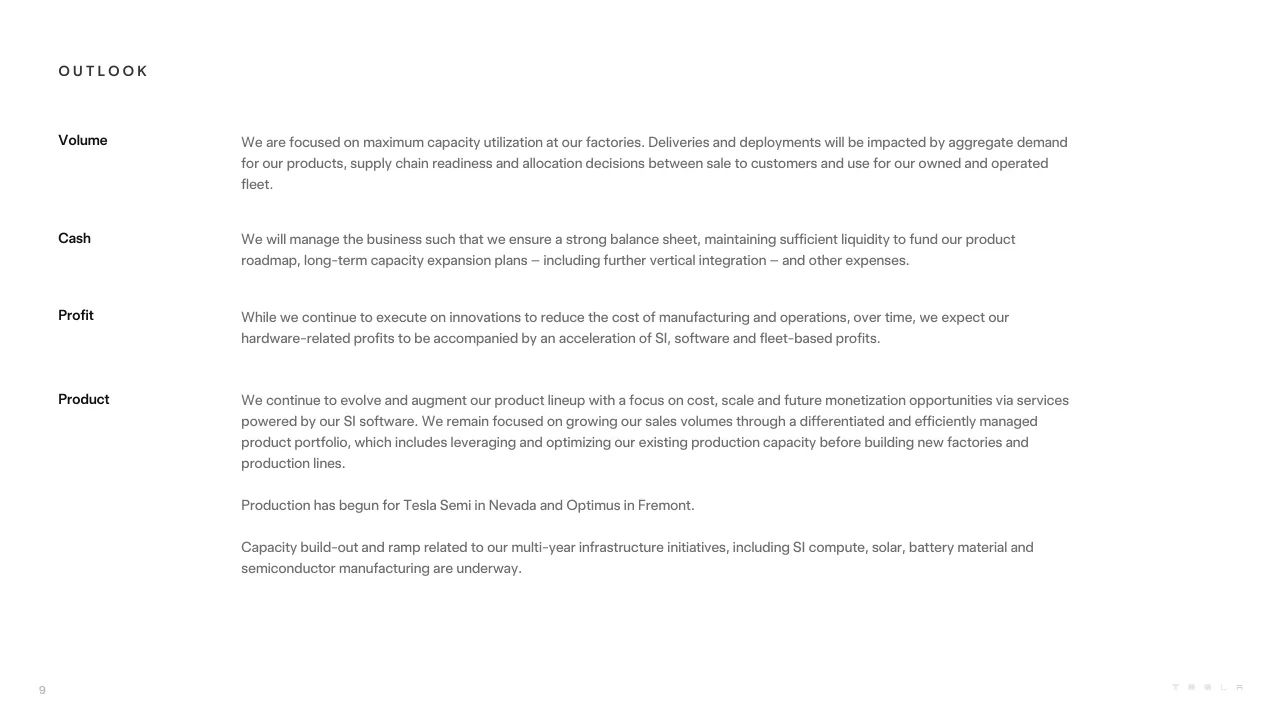
The deck opens with a Summary and Highlights slide covering profitability, cash, and operations, followed by a Financial Summary and an Operational Summary with delivery, production, and storage figures. It then covers Manufacturing and Hardware, Supporting Infrastructure, and SI and Other Services, including FSD and Robotaxi metrics. An Outlook slide sets out priorities on volume, cash, profit, and product. A Photos and Charts section with product imagery and trend charts follows, then Key Metrics, Financial Statements (statement of operations, balance sheet, cash flows), and reconciliations of GAAP to non-GAAP measures. The closing Additional Information slide covers the webcast, defined terms, non-GAAP explanations, and forward-looking statements. Slides worth studying include the Financial Summary table, which compresses five quarters into one page, and the Key Metrics pages, where small multiples of quarterly and trailing twelve month trends sit side by side. The Outlook slide shows how four short headline-led themes can replace a longer narrative.
Slides worth studying
Questions about this deck
How many slides are in the Tesla Q3 2026 Update deck?
The deck has 33 pages. Slide 2 lists its sections, from the Financial Summary on slide 4 through Additional Information on page 32.
What does the Tesla Q3 2026 Update say about total revenues in the Financial Summary?
On slide 4, Tesla's Financial Summary shows total revenues of 28,046 in millions of dollars for Q3-2026, with a YoY change of 0%. The same table shows income from operations of 718 for Q3-2026.
What are the four themes in Tesla's Outlook slide in the Q3 2026 Update?
Slide 9 sets out Outlook themes for Tesla under the headings Volume, Cash, Profit, and Product. The Volume theme says the company is focused on maximum capacity utilization at its factories.
How many cumulative unsupervised Robotaxi miles does Tesla report in its Q3 2026 Update?
Slide 8 says Tesla reached nearly two million cumulative unsupervised miles for its Robotaxi service as of the end of the quarter. The same slide notes that Cybercab is being deployed into the Robotaxi fleet in Austin.
Details
- Company: Tesla
- Year: 2026
- Type: Investor presentation
- Industry: Automotive and Energy
- Pages: 33
More from Tesla
- Tesla investor presentation, 2025
- Tesla investor presentation, Q4 2023 update
- Tesla investor presentation, Q4 2024 update
- Tesla investor presentation, 2024 annual shareholder meeting
- Tesla investor presentation, Q4 2022 update
- Tesla investor presentation, Investor Day 2023
All Tesla decks in the library
Review score: 7 out of 10, Effective
Presentation quality, judged with the SlideDeck Co review heuristic. Ask, evidence and idea merit are not rated here.
This is a competent, consistent investor reference document. The agenda on slide 2 is accurate, the tables on slides 4 and 5 are cleanly aligned with the current quarter shaded, and the photo section (slides 11 to 22) is large, well cropped and labelled. The weaknesses are consequential for anyone presenting it: slide 3 is a dense wall of small grey text, slide 9 is four paragraphs of grey prose with no numbers or emphasis, and the key metrics charts on slide 23 have unlabeled units and rely on small year labels. The route is also uneven, with eleven photo slides sitting between the narrative and the metrics, and the closing legal text on slide 32 is unreadably small.
Worth keeping: Keep the shaded current-quarter column and grouped rows on slide 4, the section-label headers, and the full-bleed captioned photos on slides 11 to 22.
Most useful repair: Give the narrative slides (3, 6, 7, 8, 9) a lead number or headline per block and darker, larger body text so the main message reads without parsing paragraphs.
What would change the score: Cut the photo run to a few images, and add takeaway titles and direct labels to the charts on slides 23 and 24, with units on the first axis.
Confidence medium. 33 of 33 pages inspected on contact sheets, 4 at readable size. Reviewed 2026-11-08. Model-assisted review (claude-sonnet-5-5).
Full text of the slides (33 slides)
Every slide's words and a description of its charts and images, so the deck can be searched and rebuilt. Also available as Markdown.
Slide 1
Q3 2026 Update
TESLA
Visuals: One logo: the Tesla wordmark, rendered as small white capital letters with wide letter-spacing, placed in the bottom-right corner. No photographs, charts or other graphics.
Slide 2
Highlights
03
Financial Summary
04
Operational Summary
05
Manufacturing & Hardware
06
Supporting Infrastructure
07
SI & Other Services
08
Outlook
09
Photos & Charts
10
Key Metrics
23
Financial Statements
26
Additional Information
32
T E S L A (logo)
2
Slide 3
HIGHLIGHTS
SUMMARY
Profitability
$0.7B GAAP operating income
$0.8B GAAP net income
$1.7B non-GAAP net income1
Cash
Operating cash flow of $6.3B
Free cash flow2 of $1.5B
$1.9B increase in our cash and investments3
Operations
Produced and delivered our 10 millionth vehicle
Launched Cybercab into the Robotaxi fleet in Austin
Record production at Gigafactory Berlin
In Q3, we maintained strong momentum on many projects spanning Super Intelligence (SI),
robotics and renewable energy that will be critical to building a future of Amazing
Abundance. Strength in our core business also continued, and we achieved our second
consecutive quarter of TTM revenue in excess of $100B.
FSD (Supervised)4 attach rate continued to grow, reaching over 75% of new vehicle
deliveries in North America – our most mature market – a nearly twenty percentage point
sequential increase. We believe that FSD is driving demand in markets where it is available,
and we continue to work with regulators to get it approved in other markets.
We started providing Robotaxi rides using Cybercabs on September 3 in Austin. Cumulative
unsupervised Robotaxi miles grew eightfold quarter over quarter, driven by sustained
double-digit weekly growth.
We ended the quarter with the largest backlog for our passenger vehicles in four years. We
rolled out the updated Tesla Semi that is produced on our high-volume manufacturing line in
Nevada and unveiled the Next Gen Roadster on October 15. While battery availability
continued to be the limiting factor in increasing auto volumes in the quarter, we have made
additional progress in securing future supply, as we work toward our goal of maximum
utilization of our factories.
Demand for our Energy Storage business remained strong in the quarter, with our highest-
ever order rate and backlog. Energy storage is the fastest way to add power to the existing
grid and is critical to data center uptime. We expect rising data center demand to continue
driving demand for our products. Megafactory Texas began production, with planned
capacity of 50 GWh. We also advanced LFP supply domestication in the U.S., shipping the
first Megapacks built with LFP cells from our factory in Nevada.
We continue to invest in the future through R&D and Capex spend across our businesses,
including SI, robotics and energy. Much hard work lies ahead, but we are as optimistic as
ever. Thank you to our supporters as we continue to execute on many challenging and
important projects.
3
(1) Refer to the Reconciliation of GAAP to Non–GAAP Financial Information slide (2) Free cash flow = operating cash flow less capex; (3) Includes cash, cash equivalents and short-term investments; (4) Active driver supervision required; does not make the vehicle / autonomous; Note: all information herein refers to the current quarter unless otherwise noted.
Visuals: None of the slide's content is a chart, table, photograph or illustration. The only non-text mark is the faint letter-spaced TESLA wordmark in the bottom-right corner, which is a logo element.
Slide 4
FINANCIAL SUMMARY / (Unaudited) / ($ in millions, except percentages and per share data) / Q3-2025 / Q4-2025 / Q1-2026 / Q2-2026 / Q3-2026 / YoY / Total automotive revenues / 21,205 / 17,693 / 16,234 / 20,516 / 20,560 / -3% / Energy generation and storage revenue / 3,415 / 3,837 / 2,408 / 3,139 / 2,881 / -16% / Services and other revenue / 3,475 / 3,371 / 3,745 / 4,581 / 4,605 / 33% / Total revenues / 28,095 / 24,901 / 22,387 / 28,236 / 28,046 / 0% / Total gross profit / 5,054 / 5,009 / 4,720 / 4,751 / 5,494 / 9% / Total GAAP gross margin / 18.0% / 20.1% / 21.1% / 16.8% / 19.6% / 160 bp / Operating expenses / 3,430 / 3,600 / 3,779 / 4,353 / 4,776 / 39% / Income from operations / 1,624 / 1,409 / 941 / 398 / 718 / -56% / Operating margin / 5.8% / 5.7% / 4.2% / 1.4% / 2.6% / -322 bp / Adjusted EBITDA / 4,227 / 4,154 / 3,668 / 3,273 / 3,900 / -8% / Adjusted EBITDA margin / 15.0% / 16.7% / 16.4% / 11.6% / 13.9% / -114 bp / Net income attributable to common stockholders (GAAP) / 1,373 / 840 / 477 / 1,114 / 787 / -43% / Net income attributable to common stockholders (non-GAAP) / 1,770 / 1,761 / 1,453 / 1,153 / 1,697 / -4% / EPS attributable to common stockholders, diluted (GAAP) / 0.39 / 0.24 / 0.13 / 0.32 / 0.22 / -44% / EPS attributable to common stockholders, diluted (non-GAAP) / 0.50 / 0.50 / 0.41 / 0.33 / 0.48 / -4% / Net cash provided by operating activities / 6,238 / 3,813 / 3,937 / 4,697 / 6,263 / 0% / Capital expenditures / (2,248) / (2,393) / (2,493) / (5,789) / (4,732) / 110% / Free cash flow / 3,990 / 1,420 / 1,444 / (1,092) / 1,531 / -62% / Cash, cash equivalents and short-term investments / 41,647 / 44,059 / 44,743 / 43,524 / 45,447 / 9% / 4
Visuals: A single table with 7 columns and 1 header row plus 19 data rows. Columns: label column (($ in millions, except percentages and per share data) in header); Q3-2025; Q4-2025; Q1-2026; Q2-2026; Q3-2026; YoY. Header row is filled #7F7F7F with white text. Data rows are banded with #F2F2F2 fills, with white spacer rows between groups. Numbers are right-aligned in each column. The Q3-2026 column is highlighted with a pale pink tint (about #F2D9DB) across its data cells, and the spacer rows are not tinted. Rows, in order: Total automotive revenues 21,205 / 17,693 / 16,234 / 20,516 / 20,560 / -3%; Energy generation and storage revenue 3,415 / 3,837 / 2,408 / 3,139 / 2,881 / -16%; Services and other revenue 3,475 / 3,371 / 3,745 / 4,581 / 4,605 / 33%; (spacer); Total revenues 28,095 / 24,901 / 22,387 / 28,236 / 28,046 / 0%; Total gross profit 5,054 / 5,009 / 4,720 / 4,751 / 5,494 / 9%; Total GAAP gross margin 18.0% / 20.1% / 21.1% / 16.8% / 19.6% / 160 bp; (spacer); Operating expenses 3,430 / 3,600 / 3,779 / 4,353 / 4,776 / 39%; Income from operations 1,624 / 1,409 / 941 / 398 / 718 / -56%; Operating margin 5.8% / 5.7% / 4.2% / 1.4% / 2.6% / -322 bp; (spacer); Adjusted EBITDA 4,227 / 4,154 / 3,668 / 3,273 / 3,900 / -8%; Adjusted EBITDA margin 15.0% / 16.7% / 16.4% / 11.6% / 13.9% / -114 bp; (spacer); Net income attributable to common stockholders (GAAP) 1,373 / 840 / 477 / 1,114 / 787 / -43%; Net income attributable to common stockholders (non-GAAP) 1,770 / 1,761 / 1,453 / 1,153 / 1,697 / -4%; (spacer); EPS attributable to common stockholders, diluted (GAAP) 0.39 / 0.24 / 0.13 / 0.32 / 0.22 / -44%; EPS attributable to common stockholders, diluted (non-GAAP) 0.50 / 0.50 / 0.41 / 0.33 / 0.48 / -4%; (spacer); Net cash provided by operating activities 6,238 / 3,813 / 3,937 / 4,697 / 6,263 / 0%; Capital expenditures (2,248) / (2,393) / (2,493) / (5,789) / (4,732) / 110%; Free cash flow 3,990 / 1,420 / 1,444 / (1,092) / 1,531 / -62%; Cash, cash equivalents and short-term investments 41,647 / 44,059 / 44,743 / 43,524 / 45,447 / 9%. Negative values are shown in parentheses.
Slide 5
OPERATIONAL SUMMARY / (Unaudited) / (blank) Q3-2025 Q4-2025 Q1-2026 Q2-2026 Q3-2026 YoY / Model 3/Y production 435,826 422,652 394,611 442,936 457,387 5% / Other models production 11,624 11,706 13,775 8,822 7,004 -40% / Total production(1) 447,450 434,358 408,386 451,758 464,391 4% / Model 3/Y deliveries 481,166 406,585 341,893 467,762 478,237 -1% / Other models deliveries 15,933 11,642 16,130 12,364 8,295 -48% / Total deliveries(1) 497,099 418,227 358,023 480,126 486,532 -2% / of which subject to operating lease accounting 10,230 10,996 3,430 7,580 6,911 -32% / Cumulative deliveries(2) (all-time; mil) 8.5 8.9 9.2 9.7 10.2 20% / Active FSD Subscriptions(3) (mil) 1.04 1.10 1.28 1.48 1.74 67% / Total end of quarter operating lease (new vehicle) count(4) 167,163 163,075 151,991 141,876 133,720 -20% / Global vehicle inventory (days of supply)(5) 10 15 27 15 11 10% / Storage deployed (GWh) 12.5 14.2 8.8 13.5 13.7 10% / Supercharger stations 7,753 8,182 8,463 8,704 8,904 15% / Supercharger connectors 73,817 77,682 79,918 82,357 84,465 14% / (1) Vehicle production and delivery numbers represent passenger vehicles sold to customers. / (2) In accordance with our 2025 CEO Performance Award, metric includes all new Tesla vehicles delivered to customers plus any unsupervised Robotaxis placed into commercial operation. For further detail see our 2025 Proxy Statement. / (3) In accordance with our 2025 CEO Performance Award, metric includes both upfront payment and monthly subscriptions and excludes free trials. For further detail see our 2025 Proxy Statement. / (4) Beginning in Q4’25, end of quarter operating lease count pertains only to new vehicles. Q3’25 has been adjusted to exclude used vehicles. / 5 (5) Days of supply is calculated by dividing new vehicle ending inventory by the relevant quarter’s deliveries and using 75 trading days (aligned with Automotive News definition).
Visuals: One data table with 6 value columns and a label column. Columns: blank label column, Q3-2025, Q4-2025, Q1-2026, Q2-2026, Q3-2026 (highlighted pink), YoY. Header row is a solid #7F7F7F bar with white text. Rows: Model 3/Y production 435,826 / 422,652 / 394,611 / 442,936 / 457,387 / 5%; Other models production 11,624 / 11,706 / 13,775 / 8,822 / 7,004 / -40%; Total production (bold) 447,450 / 434,358 / 408,386 / 451,758 / 464,391 / 4%; blank spacer row; Model 3/Y deliveries 481,166 / 406,585 / 341,893 / 467,762 / 478,237 / -1%; Other models deliveries 15,933 / 11,642 / 16,130 / 12,364 / 8,295 / -48%; Total deliveries (bold) 497,099 / 418,227 / 358,023 / 480,126 / 486,532 / -2%; indented row of which subject to operating lease accounting 10,230 / 10,996 / 3,430 / 7,580 / 6,911 / -32%; blank spacer row; Cumulative deliveries (all-time; mil) 8.5 / 8.9 / 9.2 / 9.7 / 10.2 / 20%; Active FSD Subscriptions (mil) 1.04 / 1.10 / 1.28 / 1.48 / 1.74 / 67%; blank spacer row; Total end of quarter operating lease (new vehicle) count 167,163 / 163,075 / 151,991 / 141,876 / 133,720 / -20%; Global vehicle inventory (days of supply) 10 / 15 / 27 / 15 / 11 / 10%; blank spacer row; Storage deployed (GWh) 12.5 / 14.2 / 8.8 / 13.5 / 13.7 / 10%; blank spacer row; Supercharger stations 7,753 / 8,182 / 8,463 / 8,704 / 8,904 / 15%; Supercharger connectors 73,817 / 77,682 / 79,918 / 82,357 / 84,465 / 14%. The Q3-2026 column data cells are filled light pink. No chart, photograph or illustration. Small Tesla wordmark at bottom right, pale grey, letters widely spaced, very small.
Slide 6
MANUFACTURING & HARDWARE
Installed Annual Manufacturing Capacity
Automotive
Region
Product
Capacity
Status
Automotive
We achieved record quarterly deliveries in several markets, including Canada, Australia, / Japan and Taiwan. Given the strong demand we are seeing across various markets, we / remain focused on increasing production across our factories and attained record / production at Gigafactory Berlin.
California
Model 3 / Model Y
>550,000
Production
Shanghai
Model 3 / Model Y
>950,000
Production
Berlin
Model Y
>375,000
Production
Texas
Model Y
>375,000
Production
Cybertruck
>125,000
Production
We began volume production of Tesla Semi, our Class 8 heavy-duty truck. The top variant / can go 500 miles at full 82,000 lbs gross combination weight while achieving an efficiency / of 1.7 kWh/mile. That efficiency allows the Tesla Semi to use a third of the energy used by a / comparable diesel truck to haul the same payload. In a transportation market where energy / is one of the largest components of total cost per mile, this will provide a meaningful / advantage to Tesla Semi operators.
Cybercab
>125,000
Production
Nevada
Tesla Semi
25,000
Production
TBD
Roadster
-
Design development
Energy Generation and Storage
Energy Generation and Storage
California
Megapack
40 GWh
Production
Nevada
Powerwall
>6 GWh
Production
We began production at Megafactory Texas. Energy storage demand is increasingly aligned / with SI infrastructure demand as grid constraints and power availability create more / opportunities for Megapack to be deployed. Megapack excels in off-grid and on-grid / applications, supplying large data center loads, buffering oscillating demand, helping / interconnection grid-compliance and strengthening the grid – all with less local fossil fuel / generation.
Shanghai
Megapack
20 GWh
Production
Texas
Megapack
50 GWh
Production
Robotics
California
Optimus
-
Early Ramp
Robotics
Texas
Optimus
-
Construction
Optimus production began in Fremont on our high-volume lines. The bots coming off this / line are the first production-quality bots that we have manufactured. While we will continue / to iterate on the hardware and manufacturing process, we have proven that the current / manufacturing process for Optimus is suitable for a commercial product.
Installed capacity ≠ current production rate and there may be limitations discovered as production rates / approach capacity. Production rates depend on a variety of factors, including equipment uptime, / component supply, downtime related to factory upgrades, regulatory considerations and other factors. / Construction includes factory and infrastructure buildout as well as tool installation.
T E S L A
6
Visuals: One table, titled Installed Annual Manufacturing Capacity, with four columns: Region, Product, Capacity, Status. Header row in grey with white text. Group rows span the full table width: Automotive, Energy Generation and Storage, Robotics. Rows as printed: Automotive group row; California | Model 3 / Model Y | >550,000 | Production; Shanghai | Model 3 / Model Y | >950,000 | Production; Berlin | Model Y | >375,000 | Production; Texas | Model Y | >375,000 | Production; (blank) | Cybertruck | >125,000 | Production; (blank) | Cybercab | >125,000 | Production; Nevada | Tesla Semi | 25,000 | Production; TBD | Roadster | - | Design development; Energy Generation and Storage group row; California | Megapack | 40 GWh | Production; Nevada | Powerwall | >6 GWh | Production; Shanghai | Megapack | 20 GWh | Production; Texas | Megapack | 50 GWh | Production; Robotics group row; California | Optimus | - | Early Ramp; Texas | Optimus | - | Construction. Table cells are unshaded or light grey (#F2F2F2) with thin white vertical dividers. Capacity figures are right-aligned; Region and Product are left-aligned; Status is centred. No charts, photographs or icons. The faint wordmark in the bottom-right corner is the only other non-text mark.
Slide 7
SUPPORTING INFRASTRUCTURE
Installed Capacity
SI Compute
We plan to reach 400 MW of SI training compute by the end of the year, supporting the development of both vehicle and humanoid robot autonomy software. Additionally, we continued construction for the Austin Fab, where we plan to start commissioning equipment in 2027.
Battery
We continue to make progress expanding battery manufacturing capacity and securing future supply, even as battery availability remains a limiting factor on the pace of our global vehicle production ramp. Critical projects include vehicle pack capacity in Berlin, cathode material production and lithium refining in Texas and LFP cells in Nevada for our energy storage products. We shipped the first Megapacks comprised solely of our own LFP cells, an important milestone to localizing this important battery type. We continue to increase production of our 4680 cells to support the ramps of both Cybercab and Tesla Semi along with higher Model Y volumes.
Other Supporting Infrastructure
We added over 2,100 net new Supercharging stalls, growing the network by 14% year-over-year. Our Supercharger for Business program also grew to over 600 stalls. These customer-owned chargers allow us to further scale the charging network while ensuring the same performance standards and service standard as Tesla-owned locations. We deployed our first Accordion Supercharger, which is pre-assembled in the factory and cheaper to install. We also deployed the first pre-assembled Megacharger to support the Tesla Semi ramp.
Region / Asset / Capacity / Status
SI Training Compute1
Texas / Cortex 1 / >105 MW / Production
Cortex 2 / >120 MW / Production
Battery Cell Manufacturing Annual Capacity
Nevada / LFP / 7 GWh / Early Ramp
Texas / 4680 / >40 GWh / Production
Cathode Materials / 10 GWh / Early Ramp
Lithium Refining / 30 GWh / Early Ramp
Berlin / 4680 / - / Construction
Installed capacity ≠ current production rate and there may be limitations discovered as production rates approach capacity. Production rates depend on a variety of factors, including equipment uptime, component supply, downtime related to factory upgrades, regulatory considerations and other factors. Early ramp capacity includes expected capacity. Construction includes factory and infrastructure buildout as well as tool installation.
450 / 400 / 350 / 300 / 250 / 200 / 150 / 100 / 50 / 0
Existing Capacity / Future Planned Capacity
Jun-2021 / Sep-2021 / Dec-2021 / Mar-2022 / Jun-2022 / Sep-2022 / Dec-2022 / Mar-2023 / Jun-2023 / Sep-2023 / Dec-2023 / Mar-2024 / Jun-2024 / Sep-2024 / Dec-2024 / Mar-2025 / Jun-2025 / Sep-2025 / Dec-2025 / Mar-2026 / Jun-2026 / Sep-2026 / Dec-2026
Tesla SI Training Capacity Ramp (MW of Compute)
7
(1) Excludes 40 MW of other compute not part of Cortex 1 or Cortex 2.
Visuals: 1) Table titled 'Installed Capacity', centred above it at about y 15.5 percent. Four columns: Region, Asset, Capacity, Status. Header row filled #7F7F7F with white bold-medium labels. Section rows 'SI Training Compute' (superscript 1) and 'Battery Cell Manufacturing Annual Capacity' are merged across all columns and centred, on #F2F2F2 fill. Data rows alternate #F2F2F2 with white. Rows: Texas / Cortex 1 / >105 MW / Production; (blank) / Cortex 2 / >120 MW / Production; Nevada / LFP / 7 GWh / Early Ramp; Texas / 4680 / >40 GWh / Production; (blank) / Cathode Materials / 10 GWh / Early Ramp; (blank) / Lithium Refining / 30 GWh / Early Ramp; Berlin / 4680 / - / Construction. Capacity values right-aligned, Status centred. Thin white vertical and horizontal gridlines separate cells. 2) Line chart titled 'Tesla SI Training Capacity Ramp (MW of Compute)' below the table. X axis: months Jun-2021 to Dec-2026 in quarterly labels, rotated about 45 degrees. Y axis: MW of compute, 0 to 450 in steps of 50, light grey horizontal gridlines. Series 'Existing Capacity' is a solid blue (about #4472C4) step line: about 0 from Jun-2021 to mid-2023, about 5 near Jun-2023, about 20 near Dec-2023, about 35 near Mar-2024, about 42 from mid-2024, about 90 from Dec-2024, about 110 near Mar-2025, about 125 from Jun-2025 to Mar-2026, about 150 near Apr-2026, about 265 from Jun-2026 to Sep-2026. Series 'Future Planned Capacity' is a dotted blue line continuing from about 270 at Sep-2026 to about 410 at Dec-2026. Legend at top inside plot: solid line 'Existing Capacity' and dotted line 'Future Planned Capacity'. No highlighted points. 3) Faint small marks at the bottom right near x 92 to 97 percent, y 95 percent, not legible.
Slide 8
SI & OTHER SERVICES
FSD (Supervised)1
FSD adoption continued to increase during the quarter, including record net new
subscriptions. We also achieved record FSD attach rates in North America, with over 75% of
new deliveries including FSD subscriptions. To date, we have received four additional FSD approvals since the end of Q2 (Croatia, Slovenia, Czech Republic and Slovakia) with FSD now available in a total of nine EU countries and used by over 100,000 customers logging more than 160 million kilometers since initial approval.
Robotaxi
We began deployment of Cybercab into our Robotaxi fleet in Austin. We reached nearly two million cumulative unsupervised miles for our Robotaxi service as of the end of the quarter. Operating hours in Austin are now 6am to midnight, and we expect to reduce wait times via
increased fleet supply and improvement of Robotaxi orchestration algorithms. Grok is available
in Cybercab with access to Grok Bot and Connectors, which allows users to manage their inbox, calendars, files, chats and tasks – all hands free via voice command –
making Cybercab
a mode of transport, a productivity space and, with our entertainment options, a second living room.
Automotive Services
Services and Other gross profit grew $86M sequentially to a record $734M, achieving a
15.9% gross margin, with growth driven by charging, insurance and part sales. We continue to
prudently manage these supporting business segments to ensure we can improve efficiency without sacrificing customer experience.
Cumulative Miles Driven with FSD (Supervised) (billions)
FSD Miles on V12 and Beyond
FSD Miles on V11 and Before
16.0
14.0
12.0
10.0
8.0
6.0
4.0
2.0
0.0
Sep-2022 Dec-2022 Mar-2023 Jun-2023 Sep-2023 Dec-2023 Mar-2024 Jun-2024 Sep-2024 Dec-2024 Mar-2025 Jun-2025 Sep-2025 Dec-2025 Mar-2026 Jun-2026 Sep-2026
2,000,000
1,500,000
1,000,000
500,000
0
Cumulative Unsupervised Robotaxi Miles
Jan-2026 Feb-2026 Mar-2026 Apr-2026 May-2026 Jun-2026 Jul-2026 Aug-2026 Sep-2026
Cumulative Unsupervised Robotaxi Miles
8
(1) Active driver supervision required; does not make the vehicle autonomous.
Visuals: Chart 1, area chart titled 'Cumulative Miles Driven with FSD (Supervised) (billions)' (axis title printed below the plot, in grey). Y axis: 0.0 to 16.0 in steps of 2.0, units billions (miles, per axis title). X axis: quarterly tick labels from Sep-2022 to Sep-2026 at 3-month intervals, labels rotated about 45 degrees. Series 1, 'FSD Miles on V12 and Beyond', filled red #C00000 stacked above series 2; no values printed, rises from about 0 in Sep-2022 to about 1.0 by Mar-2024, about 2.0 by Sep-2024, about 4.0 by Mar-2025, about 8.0 by Sep-2025, about 12.0 by Mar-2026 and about 15.5 at Sep-2026. Series 2, 'FSD Miles on V11 and Before', filled blue #4472C4, a thin band that rises from about 0 in Sep-2022 to about 1.0 by Mar-2024 and stays flat near 1.0 through Sep-2026. Legend at top inside plot, two entries with small square markers: red square then blue square. No highlighted points. Chart 2, area chart with no chart title above the plot; axis title 'Cumulative Unsupervised Robotaxi Miles' printed below the x axis. Y axis: 0 to 2,000,000 in steps of 500,000, units miles (per axis title). X axis: monthly labels from Jan-2026 to Sep-2026, rotated about 45 degrees. Single series 'Cumulative Unsupervised Robotaxi Miles' filled #4F81BD, values about: Jan-2026 0, Feb-2026 about 0, Mar-2026 about 10,000, Apr-2026 about 50,000, May-2026 about 110,000, Jun-2026 about 240,000, Jul-2026 about 490,000, Aug-2026 about 960,000, Sep-2026 about 1,850,000. Legend at top inside plot: blue square then 'Cumulative Unsupervised Robotaxi Miles'. No highlighted points. Logo: a faint grey Tesla wordmark letters at bottom right, about x 91% to 97%, y 93.5% to 94.5%, very low contrast.
Slide 9
OUTLOOK / Volume / We are focused on maximum capacity utilization at our factories. Deliveries and deployments will be impacted by aggregate demand for our products, supply chain readiness and allocation decisions between sale to customers and use for our owned and operated fleet. / Cash / We will manage the business such that we ensure a strong balance sheet, maintaining sufficient liquidity to fund our product roadmap, long-term capacity expansion plans – including further vertical integration – and other expenses. / Profit / While we continue to execute on innovations to reduce the cost of manufacturing and operations, over time, we expect our hardware-related profits to be accompanied by an acceleration of SI, software and fleet-based profits. / Product / We continue to evolve and augment our product lineup with a focus on cost, scale and future monetization opportunities via services powered by our SI software. We remain focused on growing our sales volumes through a differentiated and efficiently managed product portfolio, which includes leveraging and optimizing our existing production capacity before building new factories and production lines. / Production has begun for Tesla Semi in Nevada and Optimus in Fremont. / Capacity build-out and ramp related to our multi-year infrastructure initiatives, including SI compute, solar, battery material and semiconductor manufacturing are underway. / 9 / TESLA
Slide 10
PHOTOS & CHARTS
TESLA
Slide 11
ROADSTER – THE BEST OF THE LAST HUMAN–DRIVEN CARS
11
Visuals: Photograph, full-bleed within a fixed rectangle (not full slide). Subject: a white Tesla Cybertruck-style vehicle shown in mid-air, nose toward the viewer, headlights on, lifted above the stage with three columns of white vapour/smoke rising beneath its wheels and underbody. Stage lighting: white spotlight beams fanning from the lower left and lower right, red-glowing spot lamps at ground level, two thin vertical red-lit light strips rising at upper right and a bright white light column at right. Setting is a dark night stage with a red haze behind. Lighting is dramatic: high contrast, white highlights on the car, red and white accents on black. Dominant colours: near-black #0A0A0A, deep red #8B1A1A, white #FFFFFF. Composition: centred car in the upper middle third, smoke cloud across the bottom centre, horizontal framing, not cropped on the sides, sharp rectangular edges, no overlay. Also a faint white wordmark logo at bottom right (small letters spaced apart, very low contrast, about #BABABA on white) that is not legible in detail.
Slide 12
ROADSTER – THE BEST OF THE LAST HUMAN–DRIVEN CARS
12
Visuals: One photograph, full-width and boxed inside the margins with sharp corners. Night scene on a dark asphalt pad. Upside-down white sports car (Roadster-style body with black wheels) floats in mid-air in the upper centre, with blue-white exhaust smoke puffs from its underside and wheels, at about x 47-63%, y 19-39% of the slide. Along the bottom centre-left, a line of vehicles faces the camera on a flat, red-LED-lit platform: dark blue Model 3 at left (about x 21-31%), red Model Y (about x 33-41%), white Tesla Semi tractor in the centre (about x 45-55%), grey Cybertruck (about x 58-68%), and gold/yellow Roadster-style car at right (about x 68-78%). Headlights and light strips glow white; the platform and road edges show a continuous red LED strip. A large white and grey smoke cloud drifts behind the right-hand vehicles. Lighting is dark with red and white accent light and no daylight. Dominant colours are near-black, red, white and grey, with blue smoke at the left of the floating car. The photo is not cropped and has no overlay or tint.
Slide 13
ROBOTAXI – CYBERCAB AUSTIN LAUNCH
13
T E S L A
Visuals: Photograph, not cropped beyond the frame, boxed as a rectangle (not full-bleed). Subject: a Cybercab concept vehicle with its gull-wing style doors raised, shown in a dark exhibition hall at night. The car has a copper/rose-gold body with a white glowing light strip across the front and a white ring wheel. White neon graffiti-style 'Cybercab' script is drawn on the raised door panels. On the left edge, a partial second copper car is cut off by the frame, showing its front fender, an amber headlight and a brake disc and caliper in the foreground. Spectators in dark clothing stand in the dimly lit background, and one person stands at the right edge. Lighting: warm amber spotlights overhead and a bright blue light on the roof of the open door, with magenta and violet floor lighting. Dominant colours: deep purple-black, magenta, violet and copper. Composition: low eye-level three-quarter view of the car, placed slightly right of centre, with the foreground car creating depth on the left. No overlay or tint beyond the stage lighting.
Slide 14
ROBOTAXI – CYBERCAB AUSTIN LAUNCH
14
T E S L A
Visuals: Photograph of two gold-coloured Tesla Cybercab prototype robotaxis driving down an Austin street, the nearer car in sharp focus facing the camera at a three-quarter front angle and the second car behind it to the right, both seen from front-left. Pedestrians stand on the left, a mounted police officer on a brown horse stands at the right, and trees and a white-tent canopy fill the background. Lighting is warm, late-afternoon sunlight with soft shadows on the asphalt; dominant colours are gold, dark green foliage, and grey asphalt. The Texas licence plate reads XVF 1525 with 'The Lone Star State'. Illumination strips glow white and purple at the front of both cars. The image is a full rectangular photo, not cropped to a shape, boxed within the white margin with no overlay or tint. A faint Tesla wordmark appears at bottom-right in light grey.
Slide 15
ROBOTAXI – CYBERCAB AUSTIN LAUNCH
15
TESLA
Visuals: One photograph, boxed (not full-bleed, not cropped at the frame edges) at x 4.5%, y 12.1%, w 91.0%, h 80.9%. Subject: three gold-coloured Cybercab robotaxi vehicles driving on an Austin, Texas street at dusk. The nearest car is seen from behind, centre-frame, slightly right of centre, with a long horizontal red tail-light bar and a Texas licence plate reading XVF-3182. A second car behind it to the right reads XVF-2639. A third car on the far left is seen in side profile, facing left, with a 'CYBERCAB' script on its door. Behind them on the right are dark SUVs with lit headlights and red tail lights, and a dark SUV on the far right. Background: a tan brick building with arched windows, a row of white wall lamps, a 'TURNING VEHICLES' sign, a 'STOP FOR PEDESTRIANS' sign, a green '2nd' street sign, a red hand pedestrian signal, a traffic light with a green lamp, pedestrians on the sidewalk, trees lined with warm string lights wrapped around their trunks. Composition: low-angle, slightly off-axis, eye-level framing with the nearest vehicle in the lower-centre and the street receding to the right. Lighting: warm, low dusk light with the cars reflecting pale highlights and red tail lamps glowing. Dominant colours: gold/ochre cars, dark green-black foliage, tan brick, grey asphalt, red tail lights. No overlay or tint.
Slide 16
FSD(SUPERVISED)1 – APPROVED IN NINE EUROPEAN COUNTRIES / 16 (1) Active driver supervision required; does not make the vehicle autonomous.
Visuals: Full-width map of Europe, shown in a rectangular box with no rounding. Base map is near-black: sea and most land in #000000 with land-border lines and country outlines in a slightly lighter dark grey (#1A1A1C). Nine countries are highlighted, each filled with a dark brown-to-black radial gradient (centre near #000000, edges about #4A3B2E) and outlined with a thin pale tan-white stroke (about #D9C8B2, roughly 0.1% of slide width). Highlighted countries: Estonia (upper right, with the islands to its west), Lithuania (centre right, below Latvia), Denmark (centre top, Jutland and islands), Netherlands (left centre), Belgium (left centre, below the Netherlands), Czechia (centre), Slovakia (centre, east of Czechia), Slovenia (lower centre, upper part of the Balkan-Adriatic cluster), and Croatia (lower centre, extending south-east along the Adriatic coast). Unhighlighted surroundings include Scandinavia, the British Isles, France, Germany, Poland, Italy, Spain and the Balkans, all in the same near-black tones. No labels, legend, arrows or markers appear on the map. Lighting is flat; the map is an unshaded vector-style rendering.
Slide 17
TESLA SEMI – DOING HARD WORK
17
TESLA
Visuals: One photograph (Tesla Semi trucks). Subject: two white Tesla Semi electric tractor trucks, each pulling a dark red/maroon shipping container trailer, driving left to right along a multi-lane asphalt road at sunrise or sunset, with motion blur on the palm trees and background. The lead truck is at left-centre, the second truck slightly behind and to the right. Behind them are port gantry cranes with yellow-and-blue striped beams, low buildings, palm trees, and a row of palm trees and light poles along the right side; a bright sun glow sits just above the horizon behind the trucks. Composition: landscape, wide framing, horizon at about 55% of image height, road filling the lower 40%, edge-to-edge image inside margins, not cropped. Lighting: warm low golden-hour sunlight from behind the trucks, soft haze. Dominant colours: pale peach-beige sky, white trucks, maroon-red trailers, grey asphalt, yellow road lines and gold-yellow crane beams. No overlay or tint; the photo is boxed, not full-bleed.
Slide 18
TESLA SEMI – HIGH–VOLUME PRODUCTION LINE / 18 / TESLA
Visuals: One photograph, full-width rectangular, unboxed with no border or shadow, showing a black Tesla Semi cab body-in-white on a factory assembly line. The cab is shown in side three-quarter view from the left, with its sleeper-cab opening facing the viewer and a long receding tunnel of identical black cab shells extending into the background. Red jig supports and a grey-plated line floor sit beneath it. On the left a worker in a grey shirt and dark trousers stands beside a monitor showing a green-and-black interface; several other monitors with green panels are mounted on poles. On the right a large white panelled screen or enclosure stands beside a metal rack with yellow safety bollards. Lighting is bright overhead industrial fluorescent light with a white ceiling and grey steel structure; the cab surface reflects the light glossily. Dominant colours: black, white, light grey, bright green monitor screens, red jig parts and yellow bollards. The photograph is not cropped, full-bleed within its box, and has no overlay or tint. Small grey factory labels read SEMI FACTORY and GA1-CAB1-00040 at top left.
Slide 19
TESLA SEMI – HIGH–VOLUME PRODUCTION LAUNCH EVENT / 19
Visuals: One photograph, boxed with sharp corners, spanning about 91% of slide width below the title. Subject: seven men in a factory, most in black polo shirts with badges and lanyards, gathered around an electric drive unit. In the foreground is a silver and black electric drive assembly with axle housings, brake calipers with QR-code tags, and hoses. On the left a smiling man in a black polo and black lanyard leans in, a man with a grey beard in a blue shirt stands behind him, and a bald man in a black polo with a hand at his chin is centre-left. Centre-right, a man in a black cap and black t-shirt with a green lanyard and green tag marked A raises one hand and gestures with the other. On the far right a smiling man in a black t-shirt with a yellow lanyard and badge stands with arms behind his back. A man in a navy jacket stands behind the gesturing man. Background: red overhead robotic gantry arms and red-and-white machinery, stacked cardboard boxes on wooden pallets, and red-and-yellow hazard-striped carts on the floor. Composition: medium-wide eye-level shot, slightly low, with the drive unit filling the lower third; the photo is not cropped at its edges. Lighting: bright, even overhead fluorescent light from a white ceiling. Dominant colours: black, silver-grey, white walls, with red machinery and yellow accents. No overlay or tint.
Slide 20
MEGAFACTORY TEXAS – START OF PRODUCTION
20
Visuals: Photograph of an industrial battery-cabinet production line. Subject: a worker in a white hard hat, dark navy trousers, dark work boots, black gloves and a yellow-green high-visibility vest with orange reflective stripes stands on a grey floor plate with one arm raised, touching the edge of a white enclosure door. Large white modular enclosure units with open doors occupy the left and centre; the open left cabinet shows grey interior racks with orange-red busbars and a red cone on a shelf. On the right, two yellow FANUC industrial robot arms with red cable covers reach over the enclosures; one arm carries the text 'FANUC' and 'R-2000iC' on its forearm. Composition: wide landscape, eye level, enclosures spanning the frame diagonally from left foreground to right. Lighting: even, bright overhead industrial light with soft shadows. Dominant colours: white, light grey, yellow, with orange-red accents and a green sticker. The photograph is boxed (not cropped to full bleed), with no overlay or tint. Bottom right has a very faint light-grey Tesla-style wordmark, barely visible.
Slide 21
MEGAFACTORY TEXAS – START OF PRODUCTION / 21 / TESLA
Visuals: Photograph of an industrial robot arm in a factory. Subject: a yellow articulated industrial robot (dark grey base and black rectangular housing) with its arm raised, positioned between tall white metal racking frames holding stacked flat silver battery-module trays with orange-red connectors. In the foreground is a white aluminium conveyor rail with a red-painted section along the lower left. Composition: wide landscape framing, camera at low-to-mid height looking across the aisle; the robot is right of centre and the racks recede to the vanishing point in the background. Lighting: diffuse overhead industrial light, with bright highlights on the white racks. Dominant colours: white, silver grey, yellow, black, and orange-red accents. The photo is boxed (not full-bleed), with sharp rectangular edges and no overlay or tint. Small blue and red cable bundles are visible in the background.
Slide 22
AUSTIN FAB – CONSTRUCTION OF OUR SEMICONDUCTOR MANUFACTURING FACILITY
22
Visuals: One photograph, an aerial drone view of a semiconductor fab construction site in Austin. Subject: a large concrete slab foundation under construction, with rebar mats laid out in grids, some areas covered in yellow-tinted rebar or yellow reinforcing grids, and a row of concrete perimeter walls with square columns (piers) standing in a grid. Several tall yellow lattice crawler cranes and a black mobile crane with a long boom are working on the site. Behind the site, rows of white modular containers or enclosures are stacked in long lines across the right half. In the far background are a large grey-white factory building with a long roofline, a smaller multi-storey building, a parking lot full of vehicles, and a treeline on the horizon. Composition: elevated three-quarter aerial view looking down and across the site, with the site filling the frame and the horizon near the top third. Lighting: bright, clear daylight with hard shadows cast to the lower left. Dominant colours: pale blue sky, sandy brown dirt, light grey concrete, white containers, and yellow cranes and rebar. The photograph is not cropped in a special shape; it is a plain rectangle, not full-bleed, with no overlay or tint.
Slide 23
KEY METRICS QUARTERLY
(Unaudited)
0.5
0.4
0.3
0.2
0.1
0.0
4Q-2023 1Q-2024 2Q-2024 3Q-2024 4Q-2024 1Q-2025 2Q-2025 3Q-2025 4Q-2025 1Q-2026 2Q-2026 3Q-2026
Vehicle Deliveries
(millions of units)
7
6
5
4
3
2
1
0
-1
-2
-3
4Q-2023 1Q-2024 2Q-2024 3Q-2024 4Q-2024 1Q-2025 2Q-2025 3Q-2025 4Q-2025 1Q-2026 2Q-2026 3Q-2026
Operating Cash Flow ($B)
Free Cash Flow ($B) (1)
8
7
6
5
4
3
2
1
0
4Q-2023 1Q-2024 2Q-2024 3Q-2024 4Q-2024 1Q-2025 2Q-2025 3Q-2025 4Q-2025 1Q-2026 2Q-2026 3Q-2026
Net Income ($B) (2)
Adjusted EBITDA ($B) (2) (3)
(1) Beginning in Q1'25, Capital expenditures is presented inclusive of purchases of energy generation and storage systems and all prior periods have been adjusted.
(2) As a result of the adoption of the new crypto assets standard, the previously reported quarterly periods in 2024 have been recast.
(3) Beginning in Q1'25, Adjusted EBITDA (non-GAAP) is presented net of digital assets gains and losses and all prior periods have been adjusted.
23
T E S L A
Visuals: Three vertical bar charts, all using the same blue-and-red bar scheme with no data labels printed on any bar. Chart 1 (left): Vehicle Deliveries (millions of units). Single blue series. Y axis 0.0 to 0.5 in steps of 0.1, labels 0.0, 0.1, 0.2, 0.3, 0.4, 0.5. Horizontal light grey gridlines at each step. Categories 4Q-2023 to 3Q-2026, twelve bars, category labels rotated 90 degrees. Estimated values, none printed, so all marked as estimates: 4Q-2023 about 0.48; 1Q-2024 about 0.385; 2Q-2024 about 0.44; 3Q-2024 about 0.46; 4Q-2024 about 0.49; 1Q-2025 about 0.335; 2Q-2025 about 0.38; 3Q-2025 about 0.495; 4Q-2025 about 0.415; 1Q-2026 about 0.355; 2Q-2026 about 0.48; 3Q-2026 about 0.485. No legend; no highlighted points. Chart 2 (centre): Operating Cash Flow ($B) in blue and Free Cash Flow ($B) in red, clustered bars, two per quarter. Y axis -3 to 7 in steps of 1, with 0 line at the zero gridline. Categories 4Q-2023 to 3Q-2026. Estimated values, none printed, all marked as about. Operating cash flow: 4Q-2023 about 4.35; 1Q-2024 about 0.2; 2Q-2024 about 3.6; 3Q-2024 about 6.25; 4Q-2024 about 4.8; 1Q-2025 about 2.1; 2Q-2025 about 2.5; 3Q-2025 about 6.2; 4Q-2025 about 3.8; 1Q-2026 about 3.9; 2Q-2026 about 4.7; 3Q-2026 about 6.25. Free cash flow: 4Q-2023 about 2.0; 1Q-2024 about -2.5; 2Q-2024 about 1.3; 3Q-2024 about 2.7; 4Q-2024 about 2.0; 1Q-2025 about 0.6; 2Q-2025 about 0.1; 3Q-2025 about 3.95; 4Q-2025 about 1.4; 1Q-2026 about 1.4; 2Q-2026 about -1.1; 3Q-2026 about 1.5. Legend below the chart: blue square Operating Cash Flow ($B); red square Free Cash Flow ($B) (1). Chart 3 (right): Net Income ($B) (2) in blue and Adjusted EBITDA ($B) (2) (3) in red, clustered bars, two per quarter. Y axis 0 to 8 in steps of 1. Categories 4Q-2023 to 3Q-2026. Estimated values, none printed, all marked as about. Net income: 4Q-2023 about 7.9; 1Q-2024 about 1.4; 2Q-2024 about 1.4; 3Q-2024 about 2.15; 4Q-2024 about 2.1; 1Q-2025 about 0.4; 2Q-2025 about 1.15; 3Q-2025 about 1.35; 4Q-2025 about 0.8; 1Q-2026 about 0.45; 2Q-2026 about 1.1; 3Q-2026 about 0.75. Adjusted EBITDA: 4Q-2023 about 3.9; 1Q-2024 about 3.35; 2Q-2024 about 3.65; 3Q-2024 about 4.65; 4Q-2024 about 4.3; 1Q-2025 about 2.8; 2Q-2025 about 3.35; 3Q-2025 about 4.2; 4Q-2025 about 4.15; 1Q-2026 about 3.6; 2Q-2026 about 3.25; 3Q-2026 about 3.85. Legend below: blue square Net Income ($B) (2); red square Adjusted EBITDA ($B) (2) (3). No highlighted points. Bars are narrow, about 0.8% of slide width each, with a subtle vertical gradient from darker to lighter tone.
Slide 24
KEY METRICS TRAILING 12 MONTHS (TTM) / (Unaudited) / 2.0 / 1.8 / 1.6 / 1.4 / 1.2 / 1.0 / 0.8 / 0.6 / 0.4 / 0.2 / 0.0 / Vehicle Deliveries (millions of units) / 20 / 18 / 16 / 14 / 12 / 10 / 8 / 6 / 4 / 2 / 0 / 4Q-2023 / 1Q-2024 / 2Q-2024 / 3Q-2024 / 4Q-2024 / 1Q-2025 / 2Q-2025 / 3Q-2025 / 4Q-2025 / 1Q-2026 / 2Q-2026 / 3Q-2026 / Operating Cash Flow ($B) / Free Cash Flow ($B) (1) / 20 / 18 / 16 / 14 / 12 / 10 / 8 / 6 / 4 / 2 / 0 / 4Q-2023 / 1Q-2024 / 2Q-2024 / 3Q-2024 / 4Q-2024 / 1Q-2025 / 2Q-2025 / 3Q-2025 / 4Q-2025 / 1Q-2026 / 2Q-2026 / 3Q-2026 / Net Income ($B) (2) / Adjusted EBITDA ($B) (2) (3) / 4Q-2023 / 1Q-2024 / 2Q-2024 / 3Q-2024 / 4Q-2024 / 1Q-2025 / 2Q-2025 / 3Q-2025 / 4Q-2025 / 1Q-2026 / 2Q-2026 / 3Q-2026 / (1) Beginning in Q1'25, Capital expenditures is presented inclusive of purchases of energy generation and storage systems and all prior periods have been adjusted. / (2) As a result of the adoption of the new crypto assets standard, the previously reported quarterly periods in 2024 have been recast. / (3) Beginning in Q1'25, Adjusted EBITDA (non-GAAP) is presented net of digital assets gains and losses and all prior periods have been adjusted. / 24 / T E S L A
Visuals: Three bar charts, all on a white ground with no border. Chart 1: vertical single-series bar chart with caption 'Vehicle Deliveries (millions of units)', 12 narrow bars in blue #3B6CA3, one per quarter 4Q-2023 to 3Q-2026 left to right; y-axis 0.0 to 2.0 in steps of 0.2 (unit: millions of units), light grey hairline gridlines; no values printed, about values: 4Q-2023 1.81, 1Q-2024 1.77, 2Q-2024 1.75, 3Q-2024 1.78, 4Q-2024 1.79, 1Q-2025 1.74, 2Q-2025 1.68, 3Q-2025 1.71, 4Q-2025 1.63, 1Q-2026 1.66, 2Q-2026 1.75, 3Q-2026 1.74; no legend, no highlighted points. Chart 2: clustered vertical bar chart, two bars per quarter over the same 12 quarters; y-axis $B 0 to 20 in steps of 2, light grey gridlines; series Operating Cash Flow ($B) in blue #3B6CA3, about values: 4Q-2023 13.2, 1Q-2024 10.9, 2Q-2024 11.5, 3Q-2024 14.4, 4Q-2024 14.9, 1Q-2025 16.8, 2Q-2025 15.7, 3Q-2025 15.7, 4Q-2025 14.7, 1Q-2026 16.5, 2Q-2026 18.6, 3Q-2026 18.7; series Free Cash Flow ($B) in red #A33A3A, about values: 4Q-2023 4.3, 1Q-2024 1.3, 2Q-2024 1.7, 3Q-2024 3.6, 4Q-2024 3.5, 1Q-2025 6.8, 2Q-2025 5.5, 3Q-2025 6.8, 4Q-2025 6.2, 1Q-2026 7.0, 2Q-2026 5.7, 3Q-2026 3.2; legend below right with blue and red square swatches; no highlighted points. Chart 3: clustered vertical bar chart, same 12 quarters, y-axis $B 0 to 20 in steps of 2; series Net Income ($B) (2) in blue #3B6CA3, about values: 4Q-2023 15.0, 1Q-2024 13.9, 2Q-2024 12.5, 3Q-2024 12.9, 4Q-2024 7.0, 1Q-2025 6.1, 2Q-2025 5.8, 3Q-2025 5.1, 4Q-2025 3.8, 1Q-2026 3.8, 2Q-2026 3.8, 3Q-2026 3.2; series Adjusted EBITDA ($B) (2) (3) in red #A33A3A, about values: 4Q-2023 16.6, 1Q-2024 15.7, 2Q-2024 14.7, 3Q-2024 15.6, 4Q-2024 16.0, 1Q-2025 15.5, 2Q-2025 15.2, 3Q-2025 14.7, 4Q-2025 14.6, 1Q-2026 15.4, 2Q-2026 15.3, 3Q-2026 15.0; legend below right; no highlighted points. Logo: Tesla wordmark, letter-spaced, light grey, bottom-right.
Slide 25
KEY METRICS YEAR–OVER–YEAR FINANCIAL SUMMARY
Revenue
Total quarterly revenue was roughly flat YoY at $28.0B. YoY, revenue was impacted by the following items(1):
- decrease in Energy Generation and Storage, partially due to tariff-related customer refunds
- lower vehicle average selling price (ASP) (excl. FX impact1), inclusive of mix impact
- lower regulatory credit revenue
- decrease in vehicle deliveries
+ growth in Services and Other
+ positive FX impact of $0.3B1
+ higher automotive ancillary sales, primarily driven by an increase in FSD subscriptions
Profitability
Our quarterly operating income decreased 56% YoY to $0.7B, resulting in a 2.6% operating margin. YoY, operating income was primarily impacted by the following items(1):
- increase in operating expenses driven by SI and other R&D projects, SBC (including 2025 CEO Performance Award) and SG&A
- lower regulatory credit revenue
- lower Energy Generation and Storage gross profit
+ growth in Services and Other gross profit
+ improved vehicle region and product mix, partially offset by lower vehicle average selling price (ASP) (excl. FX impact1)
+ lower restructuring and other expenses
+ higher automotive ancillary sales, primarily driven by an increase in FSD subscriptions
+ positive FX impact of $0.1B1
Cash
Quarter-end cash, cash equivalents and short-term investments was $45.4B. The sequential increase of $1.9B was primarily a result of positive free cash flow of $1.5B.
25 (1) Impact is calculated on a constant currency basis. Actuals are compared against current results converted into USD using average exchange rates from Q3’25.
Visuals: none. The slide contains no charts, tables, photographs or illustrations; the only non-text mark is a faint grey Tesla-style wordmark logo at bottom-right. Superscript footnote markers (1) and 1 appear after the words 'items', 'impact', '$0.3B' and '$0.1B', and in the 'improved vehicle' line.
Slide 26
FINANCIAL STATEMENTS
TESLA
Slide 27
STATEMENT OF OPERATIONS
(Unaudited)
In millions of USD or shares as applicable, except per share data Q3-2025 Q4-2025 Q1-2026 Q2-2026 Q3-2026
REVENUES
Automotive sales 20,359 16,750 15,473 20,006 20,094
Automotive regulatory credits 417 542 380 146 113
Automotive leasing 429 401 381 364 353
Total automotive revenues 21,205 17,693 16,234 20,516 20,560
Energy generation and storage 3,415 3,837 2,408 3,139 2,881
Services and other 3,475 3,371 3,745 4,581 4,605
Total revenues 28,095 24,901 22,387 28,236 28,046
COST OF REVENUES
Automotive sales 17,365 13,874 12,616 16,866 16,570
Automotive leasing 225 206 196 187 184
Total automotive cost of revenues 17,590 14,080 12,812 17,053 16,754
Energy generation and storage 2,342 2,739 1,456 2,499 1,927
Services and other 3,109 3,073 3,399 3,933 3,871
Total cost of revenues 23,041 19,892 17,667 23,485 22,552
Gross profit 5,054 5,009 4,720 4,751 5,494
OPERATING EXPENSES
Research and development 1,630 1,783 1,946 2,371 2,761
Selling, general and administrative 1,562 1,655 1,833 1,982 2,015
Restructuring and other 238 162 — — —
Total operating expenses 3,430 3,600 3,779 4,353 4,776
INCOME FROM OPERATIONS 1,624 1,409 941 398 718
Interest income 439 449 434 422 445
Interest expense (76) (85) (92) (81) (90)
Other (expense) income, net (28) (592) (535) 590 (117)
INCOME BEFORE INCOME TAXES 1,959 1,181 748 1,329 956
Provision for income taxes 570 325 257 201 152
NET INCOME 1,389 856 491 1,128 804
Net income attributable to noncontrolling interests and redeemable noncontrolling interests in subsidiaries 16 16 14 14 17
NET INCOME ATTRIBUTABLE TO COMMON STOCKHOLDERS 1,373 840 477 1,114 787
Less: Buy-out of noncontrolling interest - - - (2) —
NET INCOME USED IN COMPUTING NET INCOME PER SHARE OF COMMON STOCK 1,373 840 477 1,116 787
Net income per share of common stock attributable to common stockholders
Basic $ 0.43 $ 0.26 $ 0.15 $ 0.34 $ 0.24
Diluted $ 0.39 $ 0.24 $ 0.13 $ 0.32 $ 0.22
Weighted average shares used in computing net income per share of common stock
Basic 3,227 3,231 3,234 3,237 3,240
Diluted 3,526 3,539 3,538 3,540 3,541
27
Visuals: Table, no chart or imagery. Columns: row label, Q3-2025, Q4-2025, Q1-2026, Q2-2026, Q3-2026 (values in millions of USD except per-share amounts in dollars and share counts in millions). Rows: REVENUES (header); Automotive sales 20,359 / 16,750 / 15,473 / 20,006 / 20,094; Automotive regulatory credits 417 / 542 / 380 / 146 / 113; Automotive leasing 429 / 401 / 381 / 364 / 353; Total automotive revenues 21,205 / 17,693 / 16,234 / 20,516 / 20,560; Energy generation and storage 3,415 / 3,837 / 2,408 / 3,139 / 2,881; Services and other 3,475 / 3,371 / 3,745 / 4,581 / 4,605; Total revenues 28,095 / 24,901 / 22,387 / 28,236 / 28,046; COST OF REVENUES (header); Automotive sales 17,365 / 13,874 / 12,616 / 16,866 / 16,570; Automotive leasing 225 / 206 / 196 / 187 / 184; Total automotive cost of revenues 17,590 / 14,080 / 12,812 / 17,053 / 16,754; Energy generation and storage 2,342 / 2,739 / 1,456 / 2,499 / 1,927; Services and other 3,109 / 3,073 / 3,399 / 3,933 / 3,871; Total cost of revenues 23,041 / 19,892 / 17,667 / 23,485 / 22,552; Gross profit 5,054 / 5,009 / 4,720 / 4,751 / 5,494; OPERATING EXPENSES (header); Research and development 1,630 / 1,783 / 1,946 / 2,371 / 2,761; Selling, general and administrative 1,562 / 1,655 / 1,833 / 1,982 / 2,015; Restructuring and other 238 / 162 / — / — / —; Total operating expenses 3,430 / 3,600 / 3,779 / 4,353 / 4,776; INCOME FROM OPERATIONS 1,624 / 1,409 / 941 / 398 / 718; Interest income 439 / 449 / 434 / 422 / 445; Interest expense (76) / (85) / (92) / (81) / (90); Other (expense) income, net (28) / (592) / (535) / 590 / (117); INCOME BEFORE INCOME TAXES 1,959 / 1,181 / 748 / 1,329 / 956; Provision for income taxes 570 / 325 / 257 / 201 / 152; NET INCOME 1,389 / 856 / 491 / 1,128 / 804; Net income attributable to noncontrolling interests and redeemable noncontrolling interests in subsidiaries 16 / 16 / 14 / 14 / 17; NET INCOME ATTRIBUTABLE TO COMMON STOCKHOLDERS 1,373 / 840 / 477 / 1,114 / 787; Less: Buy-out of noncontrolling interest - / - / - / (2) / —; NET INCOME USED IN COMPUTING NET INCOME PER SHARE OF COMMON STOCK 1,373 / 840 / 477 / 1,116 / 787; Net income per share attributable to common stockholders (header); Basic $ 0.43 / $ 0.26 / $ 0.15 / $ 0.34 / $ 0.24; Diluted $ 0.39 / $ 0.24 / $ 0.13 / $ 0.32 / $ 0.22; Weighted average shares used in computing net income per share (header); Basic 3,227 / 3,231 / 3,234 / 3,237 / 3,240; Diluted 3,526 / 3,539 / 3,538 / 3,540 / 3,541. The Q3-2026 column is highlighted with a light pink fill, and a faint wordmark appears bottom-right.
Slides 28 to 33 continue in the full text file.
Download this deck
The hosted PDF of every library deck is free for readers of the SlideDeck Co newsletter. Join with your email and the viewer and download appear here.
Preparing a results presentation or business update of your own? The SlideDeck Co Standard Deck is a slide library for business reviews, updates and plans.







