
The deck opens with a summary of Q4 and full-year 2022 results, framed around record revenue, operating income and net income, followed by a note on the macroeconomic outlook and the cost reduction focus. It then moves through a financial summary with quarterly and annual tables, an operational summary covering production, deliveries, storage and charging, and vehicle capacity by factory. Core technology and other highlights cover Full Self-Driving Beta, vehicle software, energy storage and solar. The outlook section gives 2023 volume guidance and the long-term growth target, and the back half holds photos of factories and products, key metrics charts, and full financial statements with GAAP to non-GAAP reconciliations. It closes with webcast details, definitions and forward-looking statement disclaimers. Slides worth studying include the summary highlights page, the quarterly financial table, and the key metrics charts that pair trailing twelve month trends across several measures on one page.
Slides worth studying
Questions about this deck
How many slides are in the Tesla Q4 and FY 2022 update deck?
The Tesla deck has 35 pages. Slide 2 lists its sections, including Highlights, Financial Summary, Operational Summary, Outlook, Key Metrics, Financial Statements and Additional Information.
What does the Tesla deck say about 2022 revenue and net income?
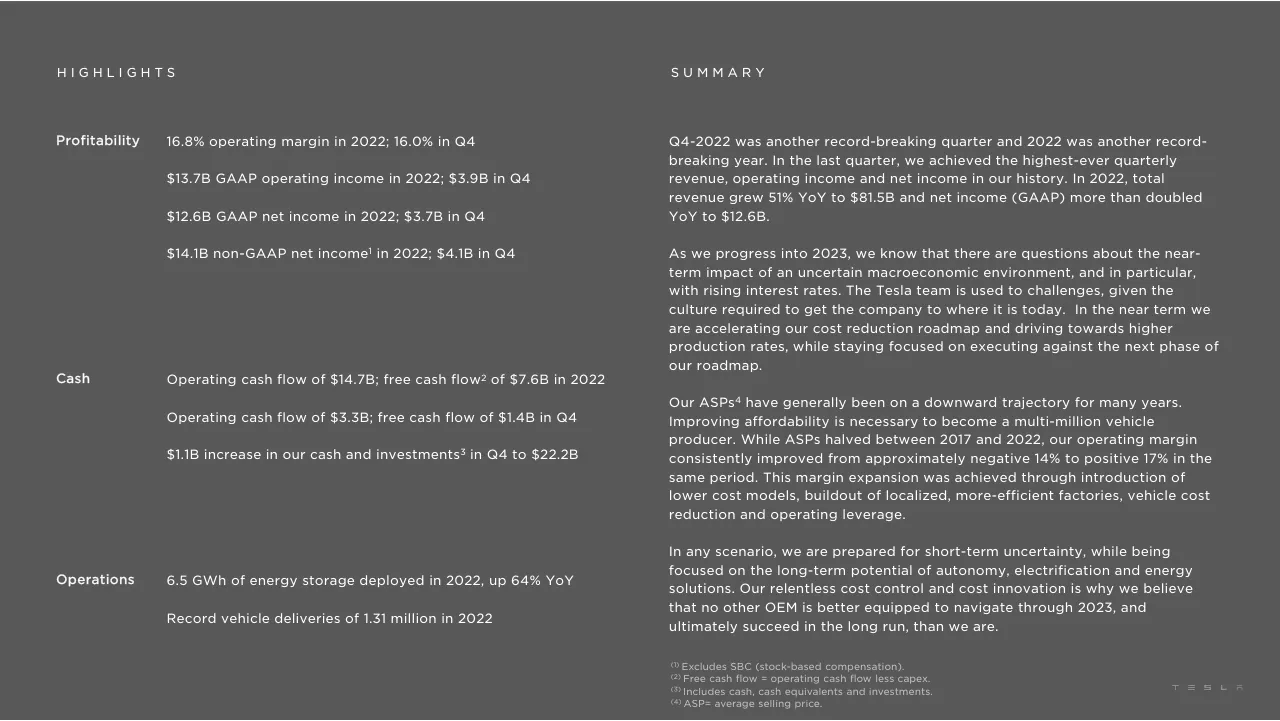
On slide 3, Tesla reports that total revenue grew 51% YoY to $81.5B in 2022. The same slide says net income (GAAP) more than doubled YoY to $12.6B.
What does the Tesla deck say about energy storage deployments in 2022?
Slide 11 says Tesla's energy storage deployments increased by 152% YoY in Q4 to 2.5 GWh, for a total deployment of 6.5 GWh in 2022. Slide 8 lists the 2022 storage deployed figure as 6,541 MWh.
What volume outlook does the Tesla deck give for 2023?
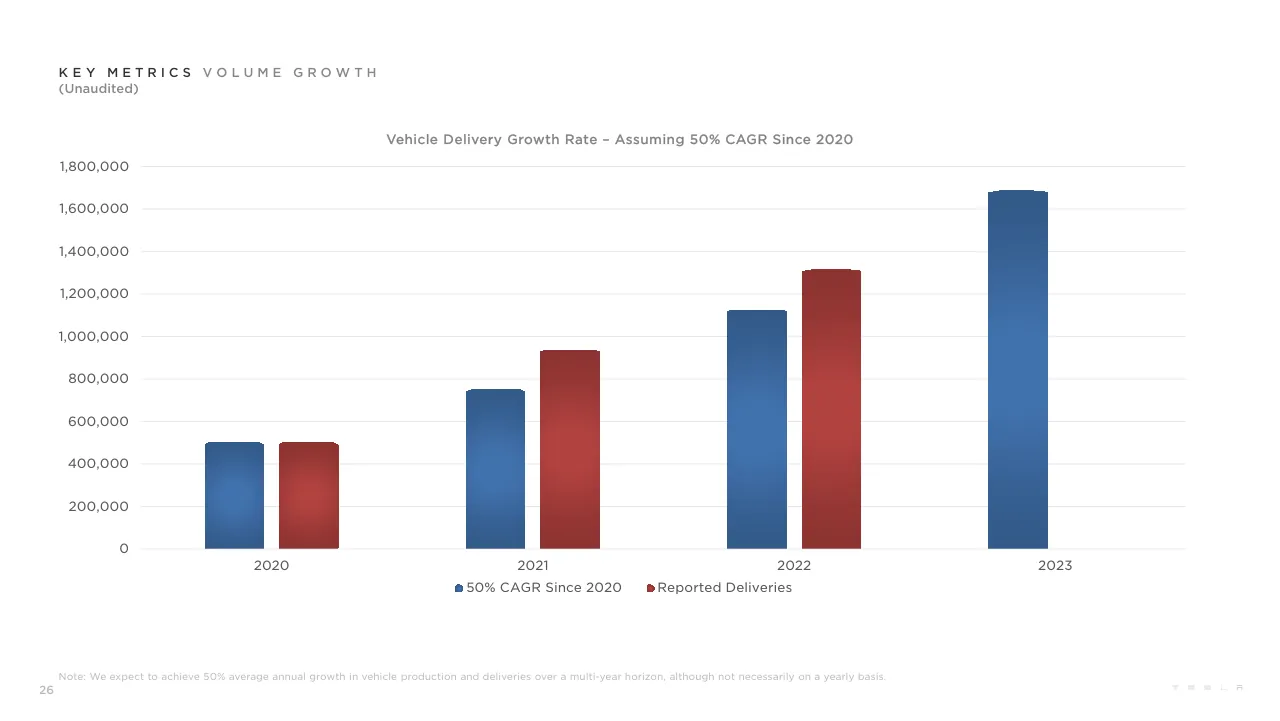
On slide 12, Tesla says it expects to remain ahead of the long-term 50% CAGR with around 1.8M cars for 2023. The same slide notes the company is planning to grow production as quickly as possible in alignment with that 50% CAGR target.
Details
- Company: Tesla
- Year: 2023
- Type: Investor presentation
- Industry: Automotive
- Pages: 35
More from Tesla
- Tesla investor presentation, 2026
- Tesla investor presentation, 2025
- Tesla investor presentation, Q4 2023 update
- Tesla investor presentation, Q4 2024 update
- Tesla investor presentation, 2024 annual shareholder meeting
- Tesla investor presentation, Investor Day 2023
All Tesla decks in the library
Review score: 7 out of 10, Effective
Presentation quality, judged with the SlideDeck Co review heuristic. Ask, evidence and idea merit are not rated here.
This is a competent investor update with a clear route: an agenda on slide 2, a highlights page, financial and operational tables, outlook, then appendices, so a reader can find what they need. Execution is disciplined, with consistent small-caps section labels, a shaded Q4 column that guides the eye in tables, and strong full-bleed factory photos on slides 14 to 21. The weaknesses are consequential: slide 3 is a dense wall of small grey-on-grey text with low contrast, titles are label-only so the takeaway is never stated (for example slides 22 to 26 and 9), and the narrative on slides 6, 10 and 11 is small paragraph text beside charts. The photo section interrupts the numbers without tying images to claims, and the appendix and footnotes are very small and faint, which suits a read-at-desk document but not a presented one.
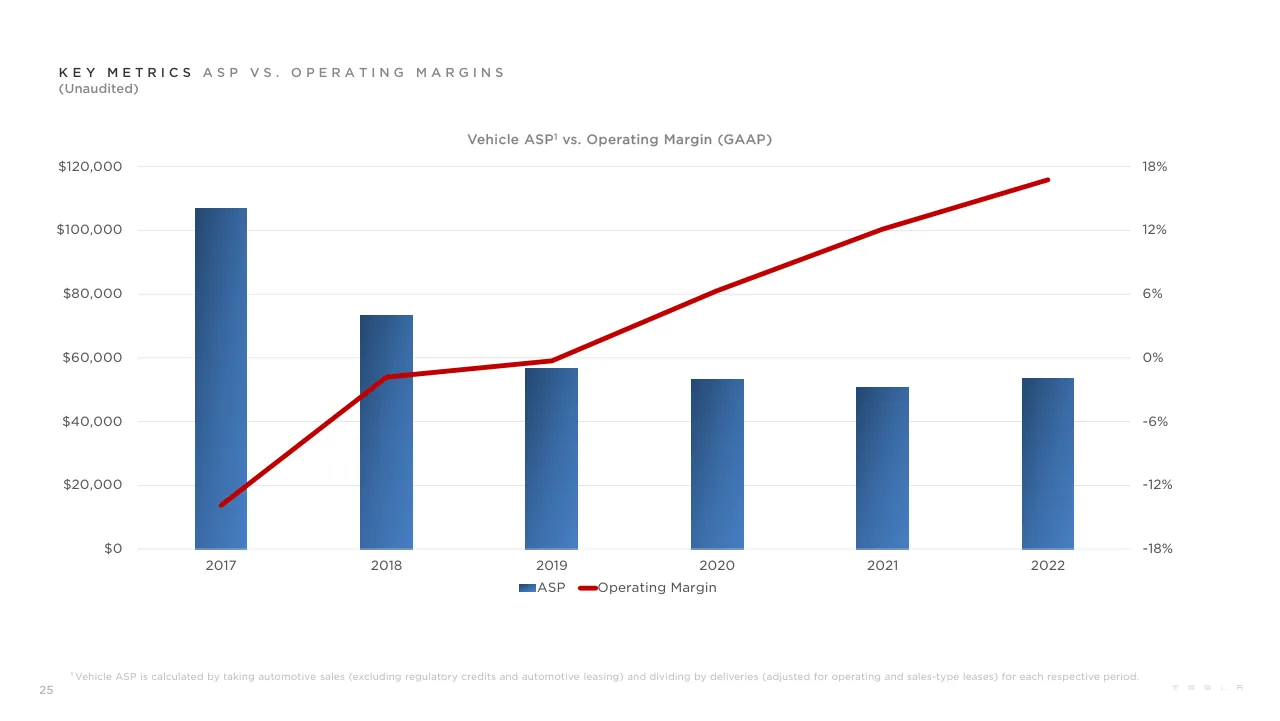
Worth keeping: Keep the shaded current-period column in the tables (slides 4, 5, 7, 8), the dual-axis ASP versus margin chart on slide 25, the large clean photo pages, and the agenda with page numbers.
Most useful repair: Rewrite slide 3 with a few large headline numbers and a short summary, raise the contrast and size of body and footnote text, and replace label-only titles with sentences that state the point of each chart or table.
What would change the score: I would add direct data labels and takeaways to the key metrics charts on slides 22 to 24, which have tiny rotated axis labels and no callouts.
Confidence high. 35 of 35 pages inspected on contact sheets, 4 at readable size. Reviewed 2026-11-08. Model-assisted review (claude-sonnet-5-5).
Full text of the slides (35 slides)
Every slide's words and a description of its charts and images, so the deck can be searched and rebuilt. Also available as Markdown.
Slide 1
Q4 and FY 2022 Update
Visuals: One logo: the Tesla wordmark (stylised spaced capitals T E S L A) in white/light grey at the bottom-right corner, roughly 5.5% of slide width. No photographs, charts, tables or diagrams.
Slide 2
Highlights 03 / Financial Summary 04 / Operational Summary 07 / Vehicle Capacity 09 / Core Technology 10 / Other Highlights 11 / Outlook 12 / Photos & Charts 13 / Key Metrics 22 / Financial Statements 27 / Additional Information 34
Slide 3
HIGHLIGHTS
SUMMARY
Profitability
16.8% operating margin in 2022; 16.0% in Q4
$13.7B GAAP operating income in 2022; $3.9B in Q4
$12.6B GAAP net income in 2022; $3.7B in Q4
$14.1B non-GAAP net income¹ in 2022; $4.1B in Q4
Q4-2022 was another record-breaking quarter and 2022 was another record-breaking year. In the last quarter, we achieved the highest-ever quarterly revenue, operating income and net income in our history. In 2022, total revenue grew 51% YoY to $81.5B and net income (GAAP) more than doubled YoY to $12.6B.
As we progress into 2023, we know that there are questions about the near-term impact of an uncertain macroeconomic environment, and in particular, with rising interest rates. The Tesla team is used to challenges, given the culture required to get the company to where it is today. In the near term we are accelerating our cost reduction roadmap and driving towards higher production rates, while staying focused on executing against the next phase of our roadmap.
Cash
Operating cash flow of $14.7B; free cash flow² of $7.6B in 2022
Operating cash flow of $3.3B; free cash flow of $1.4B in Q4
$1.1B increase in our cash and investments³ in Q4 to $22.2B
Our ASPs⁴ have generally been on a downward trajectory for many years. Improving affordability is necessary to become a multi-million vehicle producer. While ASPs halved between 2017 and 2022, our operating margin consistently improved from approximately negative 14% to positive 17% in the same period. This margin expansion was achieved through introduction of lower cost models, buildout of localized, more-efficient factories, vehicle cost reduction and operating leverage.
Operations
6.5 GWh of energy storage deployed in 2022, up 64% YoY
Record vehicle deliveries of 1.31 million in 2022
In any scenario, we are prepared for short-term uncertainty, while being focused on the long-term potential of autonomy, electrification and energy solutions. Our relentless cost control and cost innovation is why we believe that no other OEM is better equipped to navigate through 2023, and ultimately succeed in the long run, than we are.
(1) Excludes SBC (stock-based compensation).
(2) Free cash flow = operating cash flow less capex.
(3) Includes cash, cash equivalents and investments.
(4) ASP= average selling price.
TESLA
Visuals: None apart from the small grey letter-spaced TESLA wordmark at bottom right (about x 91.6%, y 95.3%, w 5.5%, h 1.0%), which is a logo in light grey #BFBFBF. No charts, photographs, tables or diagrams.
Slide 4
FINANCIAL SUMMARY
(Unaudited)
($ in millions, except percentages and per share data)
Q4-2021
Q1-2022
Q2-2022
Q3-2022
Q4-2022
YoY
Automotive revenues
15,967
16,861
14,602
18,692
21,307
33%
of which regulatory credits
314
679
344
286
467
49%
Automotive gross profit
4,882
5,539
4,081
5,212
5,522
13%
Automotive gross margin
30.6%
32.9%
27.9%
27.9%
25.9%
-466 bp
Total revenues
17,719
18,756
16,934
21,454
24,318
37%
Total gross profit
4,847
5,460
4,234
5,382
5,777
19%
Total GAAP gross margin
27.4%
29.1%
25.0%
25.1%
23.8%
-360 bp
Operating expenses
2,234
1,857
1,770
1,694
1,876
-16%
Income from operations
2,613
3,603
2,464
3,688
3,901
49%
Operating margin
14.7%
19.2%
14.6%
17.2%
16.0%
129 bp
Adjusted EBITDA
4,090
5,023
3,791
4,968
5,404
32%
Adjusted EBITDA margin
23.1%
26.8%
22.4%
23.2%
22.2%
-86 bp
Net income attributable to common stockholders (GAAP)
2,321
3,318
2,259
3,292
3,687
59%
Net income attributable to common stockholders (non-GAAP)
2,879
3,736
2,620
3,654
4,106
43%
EPS attributable to common stockholders, diluted (GAAP)(1)
0.68
0.95
0.65
0.95
1.07
57%
EPS attributable to common stockholders, diluted (non-GAAP)(1)
0.85
1.07
0.76
1.05
1.19
40%
Net cash provided by operating activities
4,585
3,995
2,351
5,100
3,278
-29%
Capital expenditures
(1,810)
(1,767)
(1,730)
(1,803)
(1,858)
3%
Free cash flow
2,775
2,228
621
3,297
1,420
-49%
Cash, cash equivalents and investments
17,707
18,013
18,915
21,107
22,185
25%
(1) EPS = earnings per share. Prior period results have been retroactively adjusted to reflect the three-for-one stock split effected in the form of a stock dividend in August 2022.
4
Visuals: A data table, not a chart. Columns: label column '($ in millions, except percentages and per share data)', then Q4-2021, Q1-2022, Q2-2022, Q3-2022, Q4-2022 and YoY. Rows in order: Automotive revenues 15,967 / 16,861 / 14,602 / 18,692 / 21,307 / 33%; of which regulatory credits 314 / 679 / 344 / 286 / 467 / 49%; Automotive gross profit 4,882 / 5,539 / 4,081 / 5,212 / 5,522 / 13%; Automotive gross margin 30.6% / 32.9% / 27.9% / 27.9% / 25.9% / -466 bp; (blank gap); Total revenues 17,719 / 18,756 / 16,934 / 21,454 / 24,318 / 37%; Total gross profit 4,847 / 5,460 / 4,234 / 5,382 / 5,777 / 19%; Total GAAP gross margin 27.4% / 29.1% / 25.0% / 25.1% / 23.8% / -360 bp; (blank gap); Operating expenses 2,234 / 1,857 / 1,770 / 1,694 / 1,876 / -16%; Income from operations 2,613 / 3,603 / 2,464 / 3,688 / 3,901 / 49%; Operating margin 14.7% / 19.2% / 14.6% / 17.2% / 16.0% / 129 bp; (blank gap); Adjusted EBITDA 4,090 / 5,023 / 3,791 / 4,968 / 5,404 / 32%; Adjusted EBITDA margin 23.1% / 26.8% / 22.4% / 23.2% / 22.2% / -86 bp; (blank gap); Net income attributable to common stockholders (GAAP) 2,321 / 3,318 / 2,259 / 3,292 / 3,687 / 59%; Net income attributable to common stockholders (non-GAAP) 2,879 / 3,736 / 2,620 / 3,654 / 4,106 / 43%; (blank gap); EPS attributable to common stockholders, diluted (GAAP)(1) 0.68 / 0.95 / 0.65 / 0.95 / 1.07 / 57%; EPS attributable to common stockholders, diluted (non-GAAP)(1) 0.85 / 1.07 / 0.76 / 1.05 / 1.19 / 40%; (blank gap); Net cash provided by operating activities 4,585 / 3,995 / 2,351 / 5,100 / 3,278 / -29%; Capital expenditures (1,810) / (1,767) / (1,730) / (1,803) / (1,858) / 3%; Free cash flow 2,775 / 2,228 / 621 / 3,297 / 1,420 / -49%; Cash, cash equivalents and investments 17,707 / 18,013 / 18,915 / 21,107 / 22,185 / 25%. The Q4-2022 column is highlighted with a pale pink fill (about #F2DADB) spanning from header to last row, with the Q4-2022 values in black. Header row is a mid-grey band with white text. Row bands alternate light grey (#F2F2F2) and white. No chart, photo, logo or icon other than the small Tesla wordmark bottom-right.
Slide 5
F I N A N C I A L S U M M A R Y
(Unaudited)
($ in millions, except percentages and per share data)
2018
2019
2020
2021
2022
YoY
Automotive revenues
18,515
20,821
27,236
47,232
71,462
51%
of which regulatory credits
419
594
1,580
1,465
1,776
21%
Automotive gross profit
4,341
4,423
6,977
13,839
20,354
47%
Automotive gross margin
23.4%
21.2%
25.6%
29.3%
28.5%
-82 bp
Total revenues
21,461
24,578
31,536
53,823
81,462
51%
Total gross profit
4,042
4,069
6,630
13,606
20,853
53%
Total GAAP gross margin
18.8%
16.6%
21.0%
25.3%
25.6%
32 bp
Operating expenses
4,430
4,138
4,636
7,083
7,197
2%
(Loss) income from operations
(388)
(69)
1,994
6,523
13,656
109%
Operating margin
-1.8%
-0.3%
6.3%
12.1%
16.8%
464 bp
Adjusted EBITDA
2,395
2,985
5,817
11,621
19,186
65%
Adjusted EBITDA margin
11.2%
12.1%
18.4%
21.6%
23.6%
196 bp
Net (loss) income attributable to common stockholders (GAAP)
(976)
(862)
721
5,519
12,556
128%
Net (loss) income attributable to common stockholders (non-GAAP)
(227)
36
2,455
7,640
14,116
85%
EPS attributable to common stockholders, diluted (GAAP)(1)
(0.38)
(0.33)
0.21
1.63
3.62
122%
EPS attributable to common stockholders, diluted (non-GAAP)(1)
(0.09)
0.01
0.75
2.26
4.07
80%
Net cash provided by operating activities
2,098
2,405
5,943
11,497
14,724
28%
Capital expenditures
(2,101)
(1,327)
(3,157)
(6,482)
(7,158)
10%
Free cash flow
(3)
1,078
2,786
5,015
7,566
51%
Cash, cash equivalents and investments
3,686
6,268
19,384
17,707
22,185
25%
(1)EPS = earnings per share. Prior period results have been retroactively adjusted to reflect the three-for-one stock split effected in the form of a stock dividend in August 2022.
5
TESLA
Visuals: Table, unboxed, with a grey header row. Columns: label column (($ in millions, except percentages and per share data) in header); 2018; 2019; 2020; 2021; 2022 (highlighted pink); YoY. Rows in order: Automotive revenues 18,515 / 20,821 / 27,236 / 47,232 / 71,462 / 51%; of which regulatory credits 419 / 594 / 1,580 / 1,465 / 1,776 / 21%; Automotive gross profit 4,341 / 4,423 / 6,977 / 13,839 / 20,354 / 47%; Automotive gross margin 23.4% / 21.2% / 25.6% / 29.3% / 28.5% / -82 bp; blank spacer; Total revenues 21,461 / 24,578 / 31,536 / 53,823 / 81,462 / 51%; Total gross profit 4,042 / 4,069 / 6,630 / 13,606 / 20,853 / 53%; Total GAAP gross margin 18.8% / 16.6% / 21.0% / 25.3% / 25.6% / 32 bp; blank spacer; Operating expenses 4,430 / 4,138 / 4,636 / 7,083 / 7,197 / 2%; (Loss) income from operations (388) / (69) / 1,994 / 6,523 / 13,656 / 109%; Operating margin -1.8% / -0.3% / 6.3% / 12.1% / 16.8% / 464 bp; blank spacer; Adjusted EBITDA 2,395 / 2,985 / 5,817 / 11,621 / 19,186 / 65%; Adjusted EBITDA margin 11.2% / 12.1% / 18.4% / 21.6% / 23.6% / 196 bp; blank spacer; Net (loss) income attributable to common stockholders (GAAP) (976) / (862) / 721 / 5,519 / 12,556 / 128%; Net (loss) income attributable to common stockholders (non-GAAP) (227) / 36 / 2,455 / 7,640 / 14,116 / 85%; blank spacer; EPS attributable to common stockholders, diluted (GAAP) (0.38) / (0.33) / 0.21 / 1.63 / 3.62 / 122%; EPS attributable to common stockholders, diluted (non-GAAP) (0.09) / 0.01 / 0.75 / 2.26 / 4.07 / 80%; blank spacer; Net cash provided by operating activities 2,098 / 2,405 / 5,943 / 11,497 / 14,724 / 28%; Capital expenditures (2,101) / (1,327) / (3,157) / (6,482) / (7,158) / 10%; Free cash flow (3) / 1,078 / 2,786 / 5,015 / 7,566 / 51%; Cash, cash equivalents and investments 3,686 / 6,268 / 19,384 / 17,707 / 22,185 / 25%. Superscript (1) follows the two EPS labels. No chart, photograph or icon on the slide.
Slide 6
FINANCIAL SUMMARY
Revenue
Total revenue grew 37% YoY in Q4 to $24.3B. YoY, revenue was impacted by the following items:
+ growth in vehicle deliveries
+ growth in other parts of the business
+ increase in ASP YoY (excluding FX impact), including favorable impact of model and regional mix
- negative FX impact of $1.4B¹
Profitability
Our operating income improved YoY to $3.9B in Q4, resulting in a 16.0% operating margin. YoY, operating income was primarily impacted by the following items:
+ growth in ASP (excluding FX) and vehicle deliveries (despite margin headwind from underutilization of new factories)
+ gross profit growth in other parts of the business
+ FSD revenue recognition of $324M in Automotive Sales²
+ lower stock-based compensation and payroll tax expense related to CEO awards
- higher raw material, commodity, logistics and warranty costs
- cost of production ramp of 4680 cells
- negative FX impact of over $300M¹
Cash
Quarter-end cash, cash equivalents and investments increased sequentially by $1.1B to $22.2B in Q4, driven mainly by free cash flow of $1.4B, partially offset by debt repayments of $497M.
(1) Impact is calculated on a constant currency basis. Actuals are compared against current results converted into USD using average exchange rates from Q4’21.
(2) This pertains to wide release of FSD Beta in the US and Canada during the period. Additionally, we expect to recognize nearly $1 billion of deferred revenue that remains for such customers over time as software updates are delivered.
6
TESLA
Visuals: none. The only non-text element is a small faint Tesla wordmark at bottom right, rendered as widely spaced capital letters T E S L A in light grey (#BFBFBF), about 2% of slide width tall-to-wide compact; it is an unboxed logo with no overlay.
Slide 7
OPERATIONAL SUMMARY / (Unaudited) / Q4-2021 Q1-2022 Q2-2022 Q3-2022 Q4-2022 YoY / Model S/X production 13,109 14,218 16,411 19,935 20,613 57% / Model 3/Y production 292,731 291,189 242,169 345,988 419,088 43% / Total production 305,840 305,407 258,580 365,923 439,701 44% / Model S/X deliveries 11,766 14,724 16,162 18,672 17,147 46% / Model 3/Y deliveries 296,884 295,324 238,533 325,158 388,131 31% / Total deliveries 308,650 310,048 254,695 343,830 405,278 31% / of which subject to operating lease accounting 16,160 12,167 9,227 11,004 15,184 -6% / Total end of quarter operating lease vehicle count 120,342 128,402 131,756 135,054 140,667 17% / Global vehicle inventory (days of supply)(1) 4 3 4 8 13 225% / Solar deployed (MW) 85 48 106 94 100 18% / Storage deployed (MWh) 978 846 1,133 2,100 2,462 152% / Store and service locations 644 663 682 728 764 19% / Mobile service fleet 1,281 1,372 1,453 1,532 1,584 24% / Supercharger stations 3,476 3,724 3,971 4,283 4,678 35% / Supercharger connectors 31,498 33,657 36,165 38,883 42,419 35% / 7 / (1)Days of supply is calculated by dividing new car ending inventory by the relevant quarter’s deliveries and using 75 trading days (aligned with Automotive News definition).
Visuals: One data table, no chart or photograph. Columns: row label (x 4.6 to 43.3%), Q4-2021, Q1-2022, Q2-2022, Q3-2022, Q4-2022 (highlighted), YoY. Header row is grey #7F7F7F with white Book text. Body rows have #F2F2F2 bands. Values are right-aligned in each column. Bold rows: Total production, Total deliveries. Highlighted Q4-2022 column cells use a pale pink fill (about #F2D9D9) on data rows from Model S/X production through Supercharger connectors except the blank gap rows. Rows and values: Model S/X production 13,109 / 14,218 / 16,411 / 19,935 / 20,613 / 57%. Model 3/Y production 292,731 / 291,189 / 242,169 / 345,988 / 419,088 / 43%. Total production 305,840 / 305,407 / 258,580 / 365,923 / 439,701 / 44%. Model S/X deliveries 11,766 / 14,724 / 16,162 / 18,672 / 17,147 / 46%. Model 3/Y deliveries 296,884 / 295,324 / 238,533 / 325,158 / 388,131 / 31%. Total deliveries 308,650 / 310,048 / 254,695 / 343,830 / 405,278 / 31%. Of which subject to operating lease accounting (indented) 16,160 / 12,167 / 9,227 / 11,004 / 15,184 / -6%. Total end of quarter operating lease vehicle count 120,342 / 128,402 / 131,756 / 135,054 / 140,667 / 17%. Global vehicle inventory (days of supply) with superscript (1) 4 / 3 / 4 / 8 / 13 / 225%. Solar deployed (MW) 85 / 48 / 106 / 94 / 100 / 18%. Storage deployed (MWh) 978 / 846 / 1,133 / 2,100 / 2,462 / 152%. Store and service locations 644 / 663 / 682 / 728 / 764 / 19%. Mobile service fleet 1,281 / 1,372 / 1,453 / 1,532 / 1,584 / 24%. Supercharger stations 3,476 / 3,724 / 3,971 / 4,283 / 4,678 / 35%. Supercharger connectors 31,498 / 33,657 / 36,165 / 38,883 / 42,419 / 35%. No chart, legend or photograph is present.
Slide 8
OPERATIONAL SUMMARY
(Unaudited)
2018 2019 2020 2021 2022 YoY
Model S/X production 101,553 62,931 54,805 24,390 71,177 192%
Model 3/Y production 152,977 302,301 454,932 906,032 1,298,434 43%
Total production 254,530 365,232 509,737 930,422 1,369,611 47%
Model S/X deliveries 99,451 66,771 57,085 24,980 66,705 167%
Model 3/Y deliveries 146,055 300,885 442,562 911,242 1,247,146 37%
Total deliveries 245,506 367,656 499,647 936,222 1,313,851 40%
of which subject to operating lease accounting 11,034 25,439 34,470 60,912 47,582 -22%
Total end of year operating lease vehicle count 37,134 49,901 72,089 120,342 140,667 17%
Global vehicle inventory (days of supply)(1) 22 13 15 6 16 167%
Solar deployed (MW) 326 173 205 345 348 1%
Storage deployed (MWh) 1,041 1,651 3,022 3,992 6,541 64%
Store and service locations 378 433 523 644 764 19%
Mobile service fleet(2) 411 758 894 1,281 1,584 24%
Supercharger stations 1,421 1,821 2,564 3,476 4,678 35%
Supercharger connectors 12,002 16,104 23,277 31,498 42,419 35%
(1)Days of supply is calculated by dividing new car ending inventory by the relevant year’s deliveries and using 300 trading days (aligned with Automotive News definition).
(2)In 2021, we began including mobile service vehicles dedicated to tire repair in our mobile service fleet total. Prior period totals have been adjusted to reflect this change.
8
TESLA
Visuals: One table, not a chart. Columns: row label column (no header text), 2018, 2019, 2020, 2021, 2022, YoY. Header row is dark grey (#7F7F7F) with white year labels. Rows, in order with values as printed: Model S/X production 101,553 / 62,931 / 54,805 / 24,390 / 71,177 / 192%. Model 3/Y production 152,977 / 302,301 / 454,932 / 906,032 / 1,298,434 / 43%. Total production (bold) 254,530 / 365,232 / 509,737 / 930,422 / 1,369,611 / 47%. Model S/X deliveries 99,451 / 66,771 / 57,085 / 24,980 / 66,705 / 167%. Model 3/Y deliveries 146,055 / 300,885 / 442,562 / 911,242 / 1,247,146 / 37%. Total deliveries (bold) 245,506 / 367,656 / 499,647 / 936,222 / 1,313,851 / 40%. Indented 'of which subject to operating lease accounting' 11,034 / 25,439 / 34,470 / 60,912 / 47,582 / -22%. Total end of year operating lease vehicle count 37,134 / 49,901 / 72,089 / 120,342 / 140,667 / 17%. Global vehicle inventory (days of supply)(1) 22 / 13 / 15 / 6 / 16 / 167%. Solar deployed (MW) 326 / 173 / 205 / 345 / 348 / 1%. Storage deployed (MWh) 1,041 / 1,651 / 3,022 / 3,992 / 6,541 / 64%. Store and service locations 378 / 433 / 523 / 644 / 764 / 19%. Mobile service fleet(2) 411 / 758 / 894 / 1,281 / 1,584 / 24%. Supercharger stations 1,421 / 1,821 / 2,564 / 3,476 / 4,678 / 35%. Supercharger connectors 12,002 / 16,104 / 23,277 / 31,498 / 42,419 / 35%. Highlight: the 2022 column cells are filled with a pale pink (about #F2D7D7) against the grey-and-white row bands. Row bands alternate light grey (#F2F2F2) with white gaps. Thin white horizontal separators between rows. Logo: a faint TESLA wordmark in light grey (about #D9D9D9), bottom right, letters widely spaced. No photographs, icons or charts.
Slide 9
VEHICLE CAPACITY
In Q4, each of our vehicle factories produced a record number of vehicles. We
continued a gradual shift towards a more even regional mix of both production and
deliveries. While in Q2-2022 the 3rd month of the quarter accounted for 74% of
vehicle deliveries, that number fell to 64% in Q3, and to 51% in Q4. We are working
to reduce the percentage of vehicles delivered in the 3rd month and smooth
deliveries throughout the quarter, which will help to reduce cost per vehicle.
US: California, Nevada and Texas
The Model Y production line in Austin produced over 3,000 vehicles in a week
towards the end of Q4. In Q4, we produced enough in-house 4680 cells in a single
week to make over 1,000 battery packs. Pilot production of Tesla Semi commenced
in Q4 with first deliveries occurring in December 2022.
China: Shanghai
Production and delivery challenges in 2022 were largely concentrated in China.
Since our Shanghai factory has been successfully running near full capacity for
several months, we do not expect meaningful sequential volume increases in the
near term. Gigafactory Shanghai remains our main export hub, supplying vehicles to
most markets outside of North America.
Europe: Berlin-Brandenburg
The Model Y production line in Germany produced over 3,000 vehicles in a week
towards the end of Q4. We also introduced two new multi-layer paint colors from
our advanced paint shop at our Berlin factory – Quicksilver and Midnight Cherry Red.
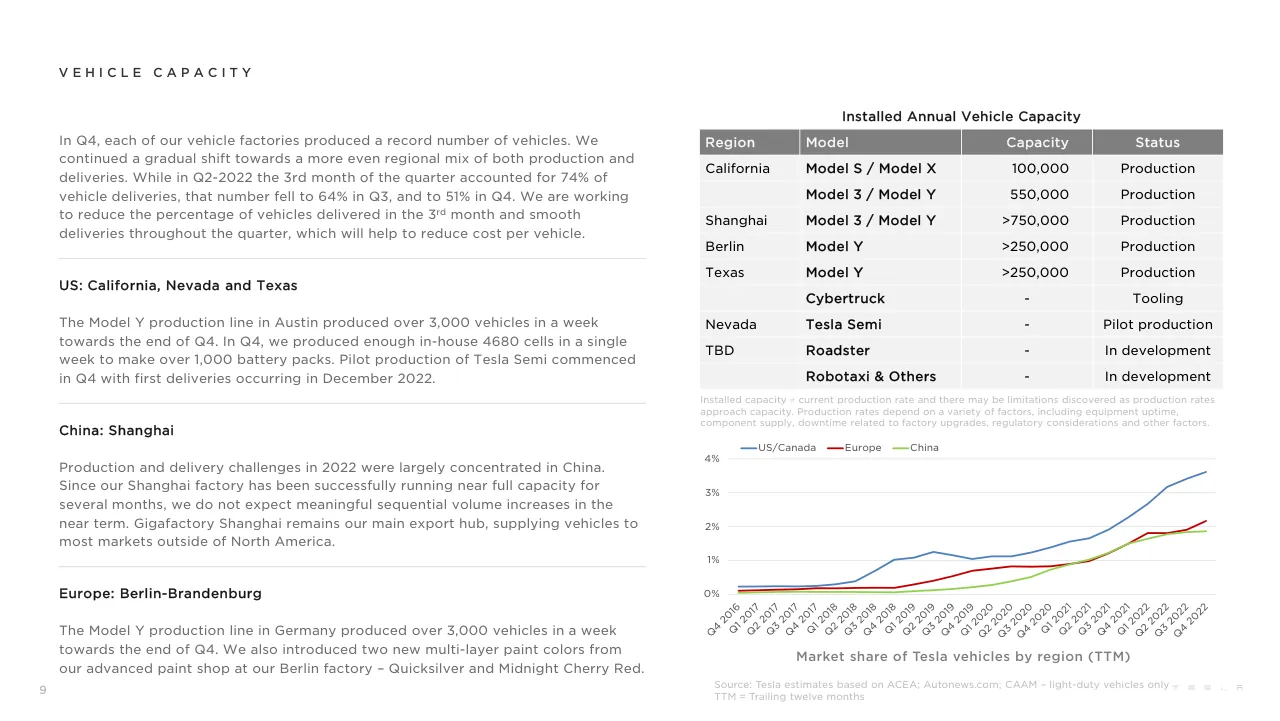
Installed Annual Vehicle Capacity
Region Model Capacity Status
California Model S / Model X 100,000 Production
Model 3 / Model Y 550,000 Production
Shanghai Model 3 / Model Y >750,000 Production
Berlin Model Y >250,000 Production
Texas Model Y >250,000 Production
Cybertruck - Tooling
Nevada Tesla Semi - Pilot production
TBD Roadster - In development
Robotaxi & Others - In development
Installed capacity ≠ current production rate and there may be limitations discovered as production rates approach capacity. Production rates depend on a variety of factors, including equipment uptime, component supply, downtime related to factory upgrades, regulatory considerations and other factors.
US/Canada
Europe
China
4%
3%
2%
1%
0%
Q4 2016 Q1 2017 Q2 2017 Q3 2017 Q4 2017 Q1 2018 Q2 2018 Q3 2018 Q4 2018 Q1 2019 Q2 2019 Q3 2019 Q4 2019 Q1 2020 Q2 2020 Q3 2020 Q4 2020 Q1 2021 Q2 2021 Q3 2021 Q4 2021 Q1 2022 Q2 2022 Q3 2022 Q4 2022
Market share of Tesla vehicles by region (TTM)
Source: Tesla estimates based on ACEA; Autonews.com; CAAM – light-duty vehicles only
TTM = Trailing twelve months
9
Visuals: Table: titled Installed Annual Vehicle Capacity, four columns (Region, Model, Capacity, Status) and nine body rows on a grey header. Rows: California | Model S / Model X | 100,000 | Production; (blank region) | Model 3 / Model Y | 550,000 | Production; Shanghai | Model 3 / Model Y | >750,000 | Production; Berlin | Model Y | >250,000 | Production; Texas | Model Y | >250,000 | Production; (blank) | Cybertruck | - | Tooling; Nevada | Tesla Semi | - | Pilot production; TBD | Roadster | - | In development; (blank) | Robotaxi & Others | - | In development. Header fill #7F7F7F with white text; body rows #F2F2F2 with thin white column dividers. Line chart: type line chart, title Market share of Tesla vehicles by region (TTM). Y axis 0% to 4% in 1% steps, unit %, light grey gridlines #D9D9D9. X axis quarterly from Q4 2016 to Q4 2022, 25 labels rotated about 45 degrees. Three series, no data labels printed, so values are about: US/Canada (blue) about 0.2, 0.2, 0.22, 0.2, 0.25, 0.3, 0.4, 0.7, 1.0, 1.1, 1.25, 1.15, 1.05, 1.1, 1.1, 1.2, 1.4, 1.55, 1.65, 1.9, 2.3, 2.65, 3.15, 3.4, 3.6 percent; Europe (red) about 0.1, 0.15, 0.15, 0.17, 0.18, 0.19, 0.2, 0.2, 0.2, 0.3, 0.4, 0.5, 0.7, 0.75, 0.8, 0.8, 0.85, 0.9, 1.0, 1.2, 1.5, 1.8, 1.8, 1.9, 2.2 percent; China (green) about 0.08 to 0.1 through 2017 and 2018, rising to about 1.85 by Q3 and Q4 2022. Legend top-left of plot: US/Canada, Europe, China with coloured line samples. No points highlighted. Table fill and chart colours: blue #4F81BD, red #C00000, green #92D050. Logo: Tesla wordmark in widely spaced light grey capitals at bottom right.
Slide 10
CORE TECHNOLOGY
Autopilot and Full Self-Driving (FSD)
We have now released FSD Beta to nearly all customers in the US and Canada who bought FSD (approximately 400,000). This is an important milestone for our company. Every customer in the US and Canada can now access FSD Beta functionality upon purchase/subscription and start experiencing the evolution of AI-powered autonomy.
Vehicle Software
This year, our annual holiday release was the biggest ever. Our customers can now videoconference directly on their touchscreen via Zoom, streaming video from the car’s interior camera – an industry first. We integrated Apple Music into the media player, and added a live view of the interior camera to the mobile app when Dog Mode or Sentry Mode is active. In the latest Model S and X, you can now play all the games in your Steam library using the powerful built-in gaming computer, picking up where you left off on other devices, using wireless Bluetooth or wired USB game controllers.
Battery, Powertrain & Manufacturing
We are particularly focused on vehicle cost during this period of macroeconomic uncertainty, high interest rates (thus higher cost of vehicle financing) and vehicle price deflation. We continue to focus on cost efficiencies while improving functionality and reliability. While cost efficient manufacturing of EVs is still rare across most of the industry, it is critical for profitability at scale and will ultimately determine long-term success of OEMs.
Cumulative miles driven with FSD Beta (millions)
Miles driven per accident (millions)
Source: https://www.tesla.com/vehiclesafetyreport
10
Visuals: Two charts. (1) Line chart titled Cumulative miles driven with FSD Beta (millions). Y axis: Cumulative miles, millions, range 0 to 100, gridlines every 10, labels 0 to 100. X axis: monthly categories from Mar-21 to Dec-22 (22 labels, rotated about 35 degrees). One series drawn as a thick red line (#C0504D, about 4 px stroke, rounded joins). Approximate values, none printed on the slide: Mar-21 about 0; flat near 0 to about 1 through Sep-21; Oct-21 about 2; Nov-21 about 4; Dec-21 about 7; Jan-22 about 12; Feb-22 about 15; Mar-22 about 19; Apr-22 about 23; May-22 about 27; Jun-22 about 35; Jul-22 about 42; Aug-22 about 48; Sep-22 about 57; Oct-22 about 69; Nov-22 about 80; Dec-22 about 90 (line ends near the 90 gridline). No legend, no highlighted points. (2) Clustered vertical bar chart titled Miles driven per accident (millions), with a legend at top-left inside the plot: dark blue square #1F497D Tesla vehicles using Autopilot technology; mid blue square #4F81BD Tesla vehicles not using Autopilot technology; light grey square #BFBFBF United States average. Y axis: 0 to 7, integer gridlines, no unit label beyond the axis title. X axis: quarters grouped by year, Q3 Q4 Q1 Q2 Q3 Q4 for 2018 and 2019 (Q3 and Q4 2018 only, then Q1 to Q4 2019), Q1 to Q4 2020, Q1 to Q4 2021, Q1 to Q3 2022, with year labels 2018, 2019, 2020, 2021, 2022 beneath in a bracket with vertical separators. Estimated values, not printed on the slide (about): Q3 2018 Autopilot about 3.4, not-Autopilot about 1.9, US average about 0.5; Q4 2018 about 2.9, 1.2, 0.5; Q1 2019 about 2.9, 1.2, 0.5; Q2 2019 about 3.3, 1.4, 0.5; Q3 2019 about 3.9, 1.6, 0.5; Q4 2019 about 3.1, 1.5, 0.5; Q1 2020 about 4.9, 1.5, 0.6; Q2 2020 about 5.1, 1.6, 0.6; Q3 2020 about 5.1, 1.8, 0.6; Q4 2020 about 3.8, 1.3, 0.6; Q1 2021 about 4.7, 1.0, 0.7; Q2 2021 about 5.0, 1.4, 0.7; Q3 2021 about 5.6, 1.6, 0.7; Q4 2021 about 4.4, 1.5, 0.7; Q1 2022 about 6.6, 1.2, 0.7; Q2 2022 about 5.1, 1.5, 0.7; Q3 2022 about 6.3, 1.7, 0.7. No highlighted points. Flat graphic style, no photographs, no icons apart from the faint wordmark.
Slide 11
OTHER HIGHLIGHTS
Energy Storage
Energy storage deployments increased by 152% YoY in Q4 to 2.5 GWh, for a total deployment of 6.5 GWh in 2022, by far the highest level of deployments we have achieved. Demand for our storage products remains in excess of our ability to supply. We are in the process of ramping production at our dedicated 40 GWh Megapack factory in Lathrop, California to address the growing demand. This factory should help to further accelerate growth of energy storage deployments.
Solar
Solar deployments increased by 18% YoY in Q4 to 100 MW, one of the strongest quarters in recent years. Despite supply chain challenges, we deployed 348 MW of solar in 2022, the highest deployment since 2017. Our solar installation team continues to improve installation efficiency, enabling higher volumes and stronger economics.
Services and Other
Both revenue and gross profit from Services and Other reached an all-time high in 2022. Much of the profit in 2022 was driven by used cars and transactions in support of a growing Tesla fleet, such as part sales, paid supercharging and others. While our used car ASPs declined sequentially in Q4 (which was reflective of the industry), our used car margins remained healthy.
7
6
5
4
3
2
1
0
2015
2016
2017
2018
2019
2020
2021
2022
Energy Storage deployments (GWh)
5,000
4,500
4,000
3,500
3,000
2,500
2,000
1,500
1,000
500
0
2015
2016
2017
2018
2019
2020
2021
2022
Number of Supercharging locations
11
Visuals: Chart 1: vertical bar chart titled Energy Storage deployments (GWh) placed below the top-right area. Y-axis 0 to 7 in steps of 1 with light grey horizontal gridlines, no unit label beyond the title (GWh). X-axis years 2015 to 2022. Bars in navy #1F497D for 2015 to 2021 and red #C0504D for 2022 (highlighted). Values not printed on the chart; about 0 for 2015 (barely visible), about 0.2 for 2016, about 0.4 for 2017, about 1.05 for 2018, about 1.65 for 2019, about 3.0 for 2020, about 4.0 for 2021, about 6.5 for 2022 (the text states 6.5 GWh in 2022). No legend. Chart 2: vertical bar chart titled Number of Supercharging locations placed below chart 1. Y-axis 0 to 5,000 in steps of 500 with light grey gridlines; X-axis years 2015 to 2022. Bars navy #1F497D for 2015 to 2021 and red #C0504D for 2022 (highlighted). Values not printed; about 590 for 2015, about 800 for 2016, about 1,130 for 2017, about 1,420 for 2018, about 1,830 for 2019, about 2,570 for 2020, about 3,480 for 2021, about 4,670 for 2022. No legend. Both charts are flat, with no borders, no shadows and no 3D effects. The TESLA wordmark is a small, widely letter-spaced light grey logo at bottom right.
Slide 12
OUTLOOK
Volume
We are planning to grow production as quickly as possible in alignment with the 50% CAGR target we began guiding / to in early 2021. In some years we may grow faster and some we may grow slower, depending on a number of factors. / For 2023, we expect to remain ahead of the long-term 50% CAGR with around 1.8M cars for the year.
Cash
We have sufficient liquidity to fund our product roadmap, long-term capacity expansion plans and other expenses. / Furthermore, we will manage the business such that we maintain a strong balance sheet during this uncertain period.
Profit
While we continue to execute on innovations to reduce the cost of manufacturing and operations, over time, we / expect our hardware-related profits to be accompanied with an acceleration of software-related profits. We continue / to believe that our operating margin will remain the highest among volume OEMs.
Product
Cybertruck remains on track to begin production later this year at Gigafactory Texas. Our next generation vehicle / platform is under development, with additional details to be shared at Investor Day (March 1st 2023).
12
T E S L A
Slide 13
PHOTOS & CHARTS
TESLA
Visuals: none apart from the small grey Tesla wordmark in the bottom-right corner, a flat logo rendered as five stylised letterforms (T, a three-bar E-like glyph, S, L, A-like glyph) in mid-grey, roughly 1.5% of slide width per glyph group, unfilled and without shadow.
Slide 14
GIGAFACTORY BERLIN IS A PIECE OF ART
14
forch.load
(factoryintheforest.pt)
088 089 090 097 098 099
T E S L A
Visuals: One photograph, boxed with hard rectangular edges and not cropped to a shape, full-bleed or overlaid. It shows the loading-dock side of the Gigafactory Berlin at dusk. On the left, a tall dark wall about one-third of the image width carries a large printed mural of a green and magenta pixelated forest, with a pale pink rectangular cutout panel and small white monospaced text reading forch.load and (factoryintheforest.pt). In the centre and right, a row of semi-trailers is parked nose-to-tail at loading bays, with side panels in blue, dark green, orange-brown, white and grey; a green-and-orange trailer and a white trailer are prominent in the foreground. Concrete bay walls carry black dock numbers 088, 089, 090, 097, 098 and 099 on white plates. Several concrete towers behind the docks are painted with abstract, glossy, multicoloured geometric murals in blue, magenta, violet, green and white. A grey clad building with a horizontal band of windows runs behind. On the right, a wide empty tarmac apron with a yellow-and-white dashed crossing, two white Mercedes-style vans, a small red vehicle, a pedestrian in dark clothing, and a road with cars and white lorries; a row of light poles and a tree line sit on the horizon. A small white moon is visible in the pale sky. Lighting is soft, even dusk daylight with a pale lavender-to-pink gradient sky. Dominant colours are dark teal, emerald green, magenta, violet, slate grey, concrete grey and off-white. Composition is a wide landscape frame with the mural wall as a vertical anchor at left and the receding dock line leading the eye to the right.
Slide 15
GIGAFACTORY BERLIN — MODEL Y PAINT SHOP / 15
Visuals: One photograph, a horizontal framed image of a paint booth at the Gigafactory Berlin Model Y paint shop. Subject: an unpainted, light grey primed body shell of a Model Y, seen head-on from the front and centred on a carrier with a dark charcoal underframe. Three to four painting robots covered in white protective plastic sheeting reach toward the body from the left and right, with spray nozzles at the ends of their arms; a fine white paint mist hangs in the air around the body. Composition: symmetrical one-point view down the booth, the car centred, the robots framing both sides, the back wall of the booth blurred. Lighting: even, soft, high-key diffuse light with no hard shadows. Dominant colours: white, pale grey, light silver and charcoal black on the car underframe and grated dark grey floor. Floor shows a dark metal grating and yellow-and-black hazard stripe marking at the left; grey concrete blocks sit on the floor beside the robots. The photo is not cropped to a shape, is boxed inside the margins (not full-bleed), and has no overlay or tint.
Slide 16
MEGAFACTORY LATHROP, CA — / MEGAPACK FINAL ASSEMBLY / 16 / TESLA
Visuals: One photograph in a rectangular box, not cropped to a shape and not full-bleed, with a white margin around it. Subject: a row of white Tesla Megapack battery enclosures seen from an elevated three-quarter aerial angle, lined up left to right. Each enclosure has a white roof with five-plus circular fan grilles and a ventilated louvre band, and a red TESLA wordmark on the right end of the roof. The front face shows about ten vertical battery racks, each holding stacked orange battery modules in three tiers, with one central cabinet containing an inverter and a black breaker box and an open service bay. Behind is a busy factory floor with workers in hi-vis vests, shelving, red tool carts, white racks of cabinets, cardboard boxes, a grey IBC tote at upper right, a yellow forklift at right edge, and chain-link fencing with a small monitor on a post at right. Small white serial-number labels lie on the grey concrete floor in front. Composition: elevated, centred, the battery unit fills the lower two-thirds of the photo. Lighting: even bright overhead factory light, no strong shadows. Dominant colours: white, orange, mid grey concrete, with grey steel columns. No overlay or tint.
Slide 17
GIGAFACTORY SHANGHAI — STAMPING PRESS
17
Visuals: One photograph of a Tesla Gigafactory Shanghai stamping press hall. Subject: a long white press housing with the large grey TESLA wordmark (letters T, E, S, L, A) across its upper face and a red horizontal stripe running diagonally along its top edge. In front, a row of white wheeled base carriages with blue steel die/tooling frames stacked on them; the nearest blue frame is labelled '1/5', '312C', 'MYC' and Chinese characters, another is labelled '1/5' and '312C' with a small yellow arrow. Several small warning labels are on the white carriages. A yellow robotic arm is partly visible at the right beside the press. Action: the tooling sets are staged on the floor in a line receding into the distance, not in motion. Framing: wide, low-angle, eye-level to slightly below, straight-on horizontal composition, full subject visible from left to right with the press running diagonally. Lighting: bright, even overhead industrial lighting from ceiling fixtures and skylights, soft shadows on the press face. Dominant colours: white and light grey (press and ceiling), mid grey (TESLA letters, floor), saturated blue (tooling frames), red (stripe), small yellow accents. Not cropped; boxed within the margins, not full-bleed; no overlay or tint. Also a faint grey Tesla wordmark logo at bottom right.
Slide 18
GIGAFACTORY SHANGHAI — BODY SHOP
18
TESLA
Visuals: One photograph, a full-width rectangular image (not cropped to a shape, not full-bleed, no border or shadow) occupying about x 4.5%, y 12.1%, w 91.0%, h 80.8% of the slide, as a 4396 by 2198 pixel image. Subject: a car body-in-white on a production line at the Tesla Gigafactory Shanghai body shop, photographed from an elevated viewpoint looking down the line in a symmetrical, centred composition. Eight to ten orange KUKA industrial robot arms with black hoses and black tool heads reach in from the left and right and from the back, several holding metal clamping fixtures and welding tools over the silver-white car body in the centre. The body is bare white/silver steel with a red-orange fixture frame beneath it and a red jig platform in the foreground centre. Black cylindrical robot pedestals stand around the cell, and grey-glass safety cages with metal mesh line the walls and catwalks. A yellow label with black print reads approximately FRM2 C40 P271 on a robot base at left, and a red-and-white prohibition sign is on the floor at lower left. Lighting is bright, even, cool overhead factory light with soft reflections on the steel. Dominant colours: vivid orange-red #E0401E on the robots, silver-white #D9DDE0 on the body, black #1A1A1A on pedestals and hoses, pale teal-grey #8FB3B8 in the background cages and walls. Overlay or tint: none; the photo is unaltered. Right-side and foreground areas are slightly soft in focus.
Slide 19
GIGAFACTORY NEVADA — EXPANSION PLANS
19
T E S L A
Visuals: One photograph, a photorealistic aerial rendering of the Tesla Gigafactory Nevada. A very long, low, white-framed factory building runs diagonally across the centre-left of the frame, its roof covered in dark rectangular solar panels with large white TESLA letters set across the roof. The lower front façade is dark glass with a small 'TESLA' sign at its centre. A paved plaza with trees and a dark reflecting pool sits in front of the entrance. Along the right side, a loading dock has a row of white semi-trailers parked end to end, and beyond it large car parks are filled with rows of cars, many with red bodies. Trucks and small vehicles move on the access roads in the foreground and at left. Behind the building are tan and beige desert hills with sparse scrub, under a pale blue sky with white cumulus clouds near the horizon. Lighting is soft daylight from the upper left, with the building's roof lit warm and shadows falling to the right. Dominant colours are beige and tan desert, dark grey asphalt and solar panels, white building trim, and pale blue sky. The photograph is a full-colour rectangle, not cropped, not full-bleed, sitting inside the page margins with square corners and no overlay or tint. Wide framing taken from an elevated three-quarter aerial viewpoint.
Slide 20
TESLA SEMI
43 / 42 / 41 / 40
Cheetos
DRIVING TOWARDS A SUSTAINABLE FUTURE
POWERED BY 100% RENEWABLE ENERGY
FritoLay
20
TESLA
Visuals: Photograph of a Tesla Semi electric truck (yellow and red cab, FritoLay livery) parked at a warehouse loading dock, hitched to an orange Cheetos-branded trailer. The trailer shows the Cheetos logo, a leaping Chester Cheetah character holding a bag of Cheetos, small text reading DRIVING TOWARDS A SUSTAINABLE FUTURE and POWERED BY 100% RENEWABLE ENERGY. Dock doors are numbered 43, 42, 41 and 40 on a grey concrete wall; to the right, two more trailers (white and yellow with a cartoon hand graphic) are backed into docks. Composition is a wide landscape view from the side at slight angle, subject in the centre-right, cropped at the top by the wall edge and at the bottom by the asphalt. Lighting is soft overcast daylight with pale grey-blue sky. Dominant colours are grey concrete, orange, yellow, red and black asphalt. The photo is boxed, not full-bleed, with a sharp rectangular edge and no overlay or tint.
Slide 21
GIGAFACTORY TEXAS — 4680 CELL PRODUCTION
21
R-AXIS
+VIS21 / -VL22.3
+AXH26
TESLA
Visuals: One photograph of a 4680 battery cell production station. Subject: three or four cylindrical white battery cells, each with a blue band near one end, held upright in dark green-black clamp cradles on a silver-grey conveyor or fixture. In the foreground at left is a large grey and black machine housing with cables and a mounted label; a green-lit coil spring sits centre-left below the cells, and a red-brown curved panel forms the backdrop at upper centre. Printed labels in the image read R-AXIS on a slanted plate at top centre, +VIS21 / -VL22.3 on a white tag at left, and +AXH26 on a white plate at lower centre-right. Composition: landscape, shot from a slightly elevated angle, cells running diagonally from lower-left toward upper-right, shallow depth of field with foreground blurred. Lighting: strong green LED or laser illumination from the left and centre, with cool white highlights on metal. Dominant colours: bright green #2FD67A, white #F2F2F2, silver grey #8A9096, dark charcoal #1E2224, brick red-brown #5A2A22. The photo is a rectangle, not cropped at its edges, boxed and not full-bleed, with no overlay or tint beyond the lighting in the scene. A small faint TESLA wordmark of spaced capital letters in light grey sits at bottom right.
Slide 22
KEY METRICS QUARTERLY
(Unaudited)
0.5
0.4
0.3
0.2
0.1
0.0
1Q-2020 2Q-2020 3Q-2020 4Q-2020 1Q-2021 2Q-2021 3Q-2021 4Q-2021 1Q-2022 2Q-2022 3Q-2022 4Q-2022
Vehicle Deliveries
(millions of units)
6
5
4
3
2
1
0
-1
1Q-2020 2Q-2020 3Q-2020 4Q-2020 1Q-2021 2Q-2021 3Q-2021 4Q-2021 1Q-2022 2Q-2022 3Q-2022 4Q-2022
■ Operating Cash Flow ($B)
■ Free Cash Flow ($B)
6
5
4
3
2
1
0
1Q-2020 2Q-2020 3Q-2020 4Q-2020 1Q-2021 2Q-2021 3Q-2021 4Q-2021 1Q-2022 2Q-2022 3Q-2022 4Q-2022
■ Net Income ($B)
■ Adjusted EBITDA ($B)
T E S L A
22
Visuals: Three vertical clustered bar charts with thin light-grey horizontal gridlines and no chart borders. Chart 1 (left): Vehicle Deliveries (millions of units), single blue series, y-axis 0.0 to 0.5 in steps of 0.1, 12 categories 1Q-2020 to 4Q-2022 with values about 0.088, 0.090, 0.139, 0.180, 0.184, 0.201, 0.241, 0.308, 0.310, 0.255, 0.343, 0.405 (no printed values; estimates). No legend; axis title is the caption below. Chart 2 (middle): clustered columns, y-axis -1 to 6 in steps of 1, 12 categories 1Q-2020 to 4Q-2022. Series Operating Cash Flow ($B) in blue, about: -0.4, 0.9, 2.4, 3.0, 1.6, 2.1, 3.1, 4.6, 4.0, 2.3, 5.1, 3.3. Series Free Cash Flow ($B) in red, about: -0.9, 0.4, 1.4, 1.8, 0.3, 0.6, 1.3, 2.8, 2.2, 0.6, 3.3, 1.4. Legend below the chart with blue and red square keys. No highlighted points. Chart 3 (right): clustered columns, y-axis 0 to 6 in steps of 1, same 12 categories. Series Net Income ($B) in blue, about: 0.0, 0.1, 0.3, 0.3, 0.4, 1.1, 1.6, 2.3, 3.3, 2.2, 3.3, 3.7. Series Adjusted EBITDA ($B) in red, about: 0.9, 1.2, 1.8, 1.8, 1.8, 2.5, 3.2, 4.1, 5.0, 3.8, 4.9, 5.4. Legend below with blue and red square keys. No highlighted points. Bars are thin rectangles with a slight vertical gradient from lighter to darker blue (blue bars) and darker red (red bars); the bars have no outlines.
Slide 23
KEY METRICS TRAILING 12 MONTHS (TTM) / (Unaudited) / 1.4 / 1.2 / 1.0 / 0.8 / 0.6 / 0.4 / 0.2 / 0.0 / 1Q-2020 2Q-2020 3Q-2020 4Q-2020 1Q-2021 2Q-2021 3Q-2021 4Q-2021 1Q-2022 2Q-2022 3Q-2022 4Q-2022 / Vehicle Deliveries (millions of units) / 18 / 15 / 12 / 9 / 6 / 3 / 0 / 1Q-2020 2Q-2020 3Q-2020 4Q-2020 1Q-2021 2Q-2021 3Q-2021 4Q-2021 1Q-2022 2Q-2022 3Q-2022 4Q-2022 / Operating Cash Flow ($B) / Free Cash Flow ($B) / 21 / 18 / 15 / 12 / 9 / 6 / 3 / 0 / -3 / 1Q-2020 2Q-2020 3Q-2020 4Q-2020 1Q-2021 2Q-2021 3Q-2021 4Q-2021 1Q-2022 2Q-2022 3Q-2022 4Q-2022 / Net Income ($B) / Adjusted EBITDA ($B) / 23
Visuals: Three clustered column charts on a white background, all with 12 quarters from 1Q-2020 to 4Q-2022 on the horizontal axis, labels rotated 90 degrees. Chart 1, Vehicle Deliveries (millions of units): single series in blue bars, y-axis 0.0 to 1.4 with gridlines at 0.2 intervals; about values 0.39, 0.38, 0.42, 0.50, 0.59, 0.71, 0.81, 0.93, 1.06, 1.11, 1.21, 1.31 for 1Q-2020 through 4Q-2022 respectively. No legend; the caption below gives the unit. No highlighted points. Chart 2, Operating Cash Flow ($B) and Free Cash Flow ($B): y-axis 0 to 18 with gridlines at 3 intervals. Operating Cash Flow series in blue, about values 2.6, 2.7, 4.3, 5.9, 8.0, 9.1, 9.9, 11.5, 13.8, 14.0, 16.0, 14.7. Free Cash Flow series in red, about values 1.1, 0.9, 1.9, 2.7, 3.9, 4.1, 4.0, 4.9, 6.9, 6.9, 8.9, 7.5. Legend below the chart: blue square Operating Cash Flow ($B), red square Free Cash Flow ($B). Chart 3, Net Income ($B) and Adjusted EBITDA ($B): y-axis -3 to 21 with gridlines at 3 intervals and the zero line visible; Net Income in blue, about values -0.1, 0.3, 0.5, 0.7, 1.1, 2.1, 3.4, 5.5, 8.4, 9.5, 11.1, 12.5; Adjusted EBITDA in red, about values 3.7, 4.4, 5.0, 5.7, 6.6, 8.0, 9.3, 11.6, 14.7, 16.1, 17.8, 19.2. Legend below: blue square Net Income ($B), red square Adjusted EBITDA ($B). No highlighted points. Bars are narrow, paired within each quarter for charts 2 and 3, and single for chart 1.
Slide 24
KEY METRICS
TRAILING 12 MONTHS (TTM)
(Unaudited)
YoY Revenue Growth
90%
80%
70%
60%
50%
40%
30%
20%
10%
0%
-10%
-20%
Q1-2019 Q2-2019 Q3-2019 Q4-2019 Q1-2020 Q2-2020 Q3-2020 Q4-2020 Q1-2021 Q2-2021 Q3-2021 Q4-2021 Q1-2022 Q2-2022 Q3-2022 Q4-2022
Tesla Autos Industry S&P 500
Operating Margin
18%
16%
14%
12%
10%
8%
6%
4%
2%
0%
-2%
-4%
Q1-2019 Q2-2019 Q3-2019 Q4-2019 Q1-2020 Q2-2020 Q3-2020 Q4-2020 Q1-2021 Q2-2021 Q3-2021 Q4-2021 Q1-2022 Q2-2022 Q3-2022 Q4-2022
Tesla Autos Industry S&P 500
24
Source: OEM financial disclosures, Bloomberg
Autos Industry includes: Tesla, BMW, Mercedes-Benz, Ford, GM, Honda, Hyundai, Nissan, Toyota and VW. Stellantis is excluded given limited historical disclosures due to the recent merger between FCA and PSA.
Autos Industry operating margin is calculated by dividing the sum of USD equivalent operating profits for the entire industry by the USD equivalent revenues for respective periods.
Visuals: Two line charts with no markers, no data labels, and a solid black horizontal zero line in each. Left chart: title 'YoY Revenue Growth'; y-axis from -20% to 90% in 10% steps with light grey horizontal gridlines; x-axis categories Q1-2019 to Q4-2022 (16 quarters) rotated vertical; no axis titles. Series: Tesla red line, about 81%, 82%, 39%, 14%, 15%, 3%, 16%, 28%, 38%, 63%, 66%, 71%, 73%, 60%, 60%, 51% (ends at Q4-2022); Autos Industry grey line, about 1%, 0%, 0%, -1%, -2%, -12%, -14%, -12%, -7%, 15%, 17%, 13%, 9%, -3%, -1% (ends at Q3-2022); S&P 500 blue line, about 8%, 6%, 5%, 6%, 4%, 0%, -2%, -4%, -1%, 6%, 10%, 13%, 15%, 15%, 14% (ends at Q3-2022). Legend below the x-axis: red Tesla, grey Autos Industry, blue S&P 500. Right chart: title 'Operating Margin'; y-axis from -4% to 18% in 2% steps; same 16 quarter categories rotated vertical. Series: Tesla red line, about -1.4%, 0.6%, -0.1%, -0.3%, 2.8%, 4.8%, 6.3%, 6.3%, 6.4%, 7.7%, 9.6%, 12.2%, 15.3%, 16.0%, 16.6%, 16.8% (ends at Q4-2022); Autos Industry grey line, about 5.1%, 4.8%, 4.9%, 4.7%, 4.1%, 2.4%, 2.6%, 3.7%, 5.5%, 8.1%, 8.2%, 8.2%, 8.4%, 8.0%, 8.0% (ends at Q3-2022); S&P 500 blue line, about 13.0%, 12.9%, 12.8%, 13.2%, 11.4%, 10.3%, 10.0%, 9.4%, 11.5%, 13.2%, 14.0%, 15.2%, 15.2%, 14.7%, 14.3% (ends at Q3-2022). Legend below: red Tesla, grey Autos Industry, blue S&P 500. No highlighted points. Lines are thick, about 3 pt equivalent, with round joins.
Slide 25
KEY METRICS ASP VS. OPERATING MARGINS
(Unaudited)
Vehicle ASP¹ vs. Operating Margin (GAAP)
$120,000
$100,000
$80,000
$60,000
$40,000
$20,000
$0
18%
12%
6%
0%
-6%
-12%
-18%
2017
2018
2019
2020
2021
2022
ASP
Operating Margin
25
¹ Vehicle ASP is calculated by taking automotive sales (excluding regulatory credits and automotive leasing) and dividing by deliveries (adjusted for operating and sales-type leases) for each respective period.
T E S L A
Visuals: Combined bar and line chart. Chart title: 'Vehicle ASP¹ vs. Operating Margin (GAAP)'. Left axis: Vehicle ASP in US dollars, $0 to $120,000 in steps of $20,000, gridlines between. Right axis: Operating Margin in percent, -18% to 18% in steps of 6%, aligned to the same gridlines. Years 2017 to 2022 on the category axis, no axis title. Bar series 'ASP' (blue gradient bars, six bars): about $106,700 (2017), about $73,400 (2018), about $56,500 (2019), about $53,100 (2020), about $50,900 (2021), about $53,700 (2022). Line series 'Operating Margin' (red line with a marker-like round end at each year, no printed values): about -14% (2017), about -2% (2018), about 0% (2019), about 6% (2020), about 12% (2021), about 17% (2022). Estimates are read from the plot against the axes. Legend centred below the years: blue square labelled ASP, red line labelled Operating Margin. No highlighted points and no data labels printed.
Slide 26
KEY METRICS VOLUME GROWTH / (Unaudited) / Vehicle Delivery Growth Rate – Assuming 50% CAGR Since 2020 / 1,800,000 / 1,600,000 / 1,400,000 / 1,200,000 / 1,000,000 / 800,000 / 600,000 / 400,000 / 200,000 / 0 / 2020 / 2021 / 2022 / 2023 / 50% CAGR Since 2020 / Reported Deliveries / Note: We expect to achieve 50% average annual growth in vehicle production and deliveries over a multi-year horizon, although not necessarily on a yearly basis. / 26
Visuals: Chart: clustered vertical bar chart. Chart title: 'Vehicle Delivery Growth Rate – Assuming 50% CAGR Since 2020' (no unit stated). Y-axis: 0 to 1,800,000 (vehicles), gridlines every 200,000, labels printed as full numbers with thousands commas. X-axis: years 2020, 2021, 2022, 2023. Series 1, '50% CAGR Since 2020' (blue bars, left of each pair): slide prints no values, so about 500,000 (2020), about 750,000 (2021), about 1,125,000 (2022), about 1,685,000 (2023). Series 2, 'Reported Deliveries' (red bars, right of each pair): no values printed, so about 500,000 (2020), about 935,000 (2021), about 1,315,000 (2022); no 2023 red bar is shown. Legend: centred below the x-axis, blue square followed by '50% CAGR Since 2020', red square followed by 'Reported Deliveries'. No highlighted points. Bars have a soft radial/vertical gradient: blue bars shade from dark steel blue at the edges to lighter blue at the centre, red bars shade from dark maroon at the edges to lighter red at the centre. Bar tops are flat with very small rounded corners.
Slide 27
FINANCIAL STATEMENTS
Visuals: The only non-text element is a small grey TESLA wordmark in the bottom-right corner, set in widely spaced capitals with a stylised letterform design (the T, E, S, L, A drawn in a geometric, squared style). No photographs, charts or diagrams.
Slides 28 to 35 continue in the full text file.
Download this deck
The hosted PDF of every library deck is free for readers of the SlideDeck Co newsletter. Join with your email and the viewer and download appear here.
Preparing a results presentation or business update of your own? The SlideDeck Co Standard Deck is a slide library for business reviews, updates and plans.







