
The deck opens with a Summary page of highlights covering profitability, cash and operations, followed by a short letter-style narrative on the year. It then moves through financial and operational summaries, manufacturing and hardware capacity, supporting infrastructure, AI and software, services, other updates and an outlook. Photo and chart pages sit in the middle, followed by key metrics charts, detailed financial statements, reconciliations of GAAP to non-GAAP measures, and additional information with a webcast notice and forward-looking statement disclaimers. The deck is data-dense and table-heavy, with quarterly and annual comparisons side by side. Slides worth studying include the Summary highlights page, which pairs bolded headline figures with short labels, the Financial Summary tables with year-over-year columns, and the Outlook page, which organises forward commentary under short headings such as Volume, Cash and Profit. Several slides use a single large image or chart to carry the point. The closing sections keep reconciliations in a consistent layout so readers can trace each non-GAAP figure back to its GAAP source.
Slides worth studying
Questions about this deck
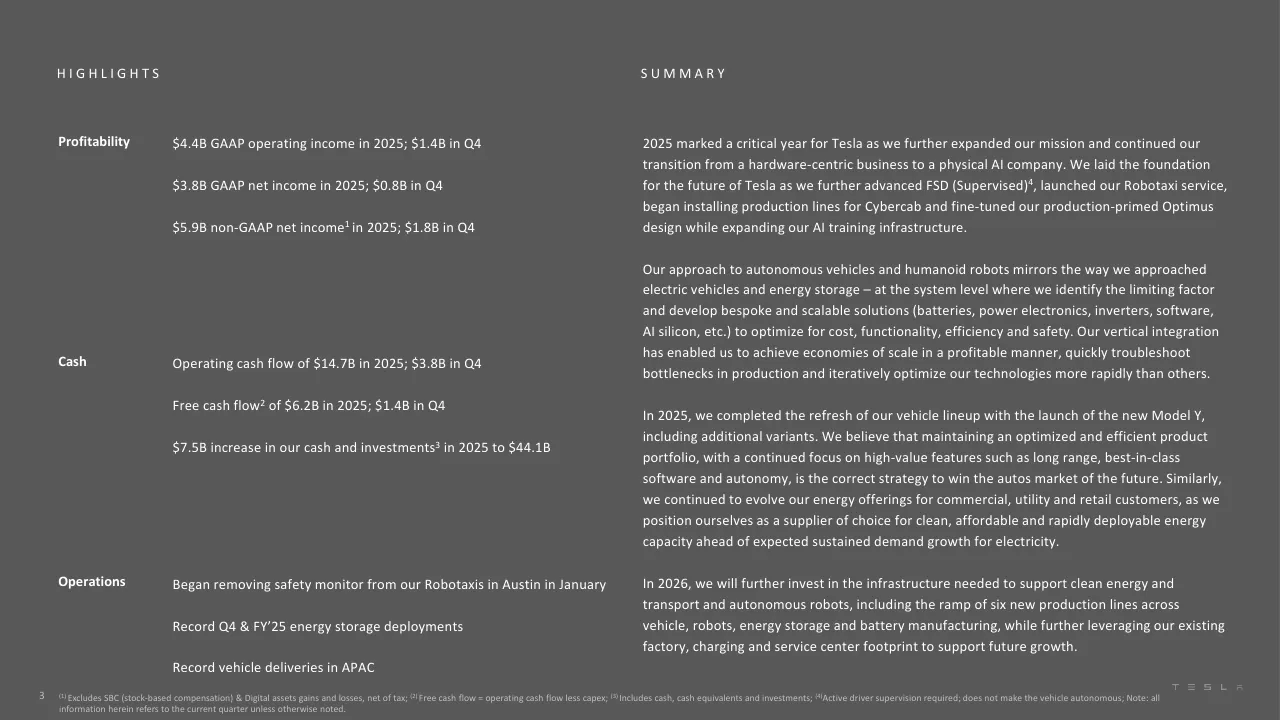
What does the Tesla deck say about its 2025 profitability?
Slide 3 reports $4.4B in GAAP operating income in 2025, $3.8B in GAAP net income, and $5.9B in non-GAAP net income. The same slide gives Q4 figures of $1.4B, $0.8B, and $1.8B for those measures.
How many slides are in the Tesla Q4 and FY 2025 update deck?
The Tesla deck has 35 pages in total. Slide 2 lists its contents, from the Highlights on slide 3 through to Additional Information on slide 34.
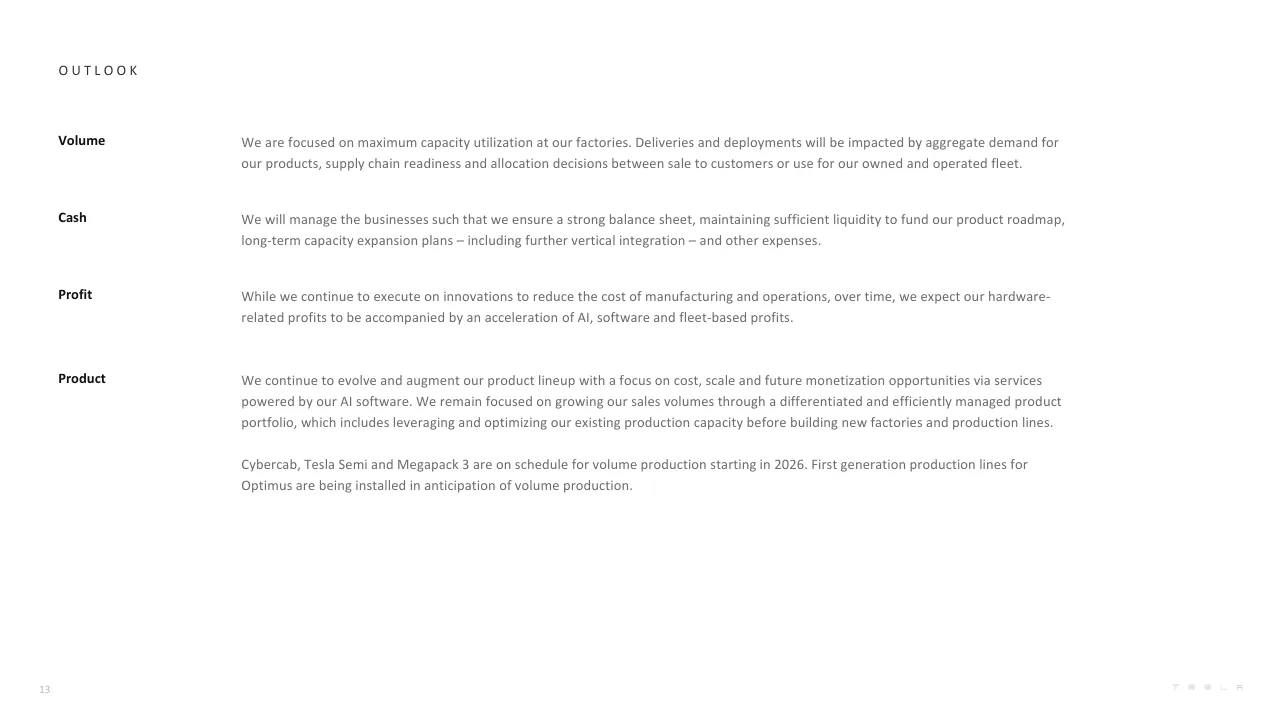
What is Tesla's outlook on volume production for Cybercab, Tesla Semi and Megapack 3?
Slide 13 says Cybercab, Tesla Semi and Megapack 3 are on schedule for volume production starting in 2026. The same slide says the company is focused on maximum capacity utilization at its factories.
How is the Tesla deck structured, and where do the financial statements start?
Slide 2 gives the structure: Highlights, Financial Summary, Operational Summary, Manufacturing & Hardware, Supporting Infrastructure, AI & Software, Services, Other Updates, Outlook, Photos & Charts, Key Metrics, Financial Statements, and Additional Information. Financial Statements begin on slide 27.
Details
- Company: Tesla
- Year: 2025
- Type: Investor presentation
- Industry: Automotive
- Pages: 35
More from Tesla
- Tesla investor presentation, 2026
- Tesla investor presentation, Q4 2023 update
- Tesla investor presentation, Q4 2024 update
- Tesla investor presentation, 2024 annual shareholder meeting
- Tesla investor presentation, Q4 2022 update
- Tesla investor presentation, Investor Day 2023
All Tesla decks in the library
Review score: 7 out of 10, Effective
Presentation quality, judged with the SlideDeck Co review heuristic. Ask, evidence and idea merit are not rated here.
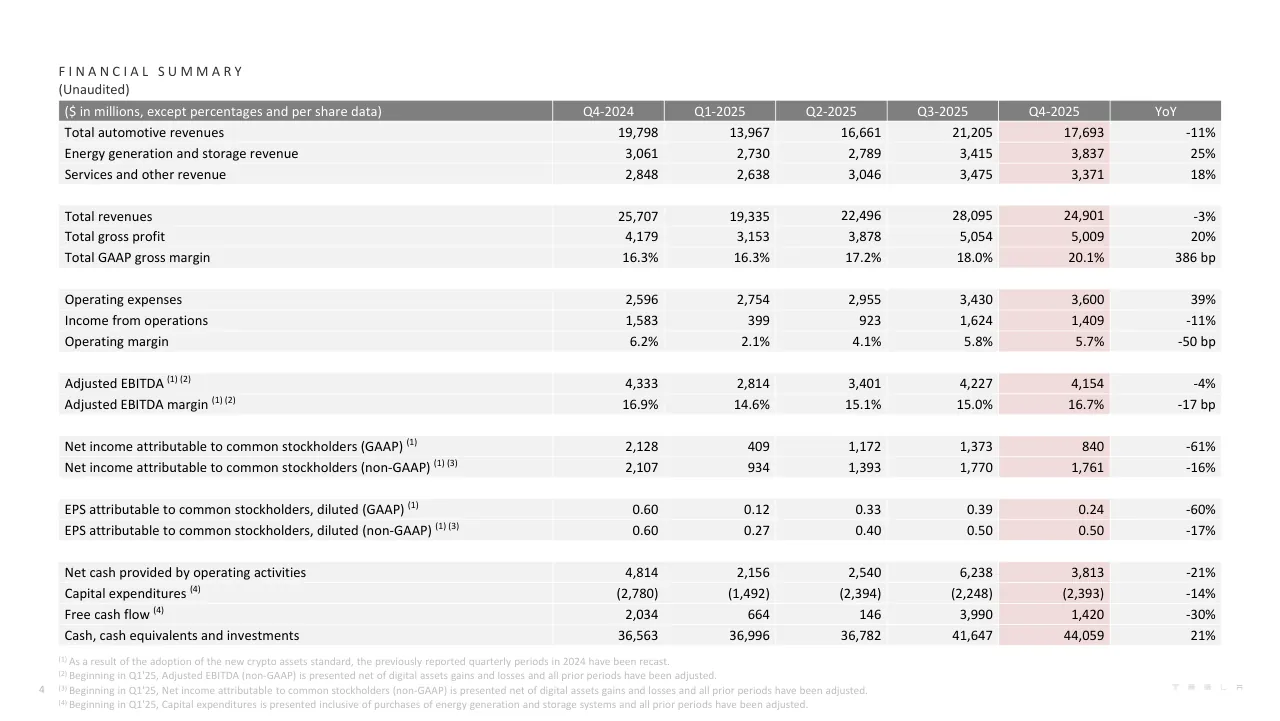
This is a reading document for investors, and it works as one: the contents page (2) gives a route, the highlights page (3) groups figures under Profitability, Cash and Operations, and the financial and operational tables (4 to 7) share one consistent layout with the latest quarter shaded. Photo pages (15 to 23) each carry one image with a short caption, and the statements and reconciliations (28 to 33) keep a repeatable structure. The weaknesses are real, though: no page states a takeaway as a headline, footnotes and small table text are very faint and tiny, and slides 8, 10, 11 and 12 are dense paragraphs. Slide 3 puts grey text on a mid-grey ground, and the shaded Q4 column on the tables is the only emphasis, so the reader must find the story themselves.
Worth keeping: Keep the grouped highlights structure on slide 3, the shaded current-period column and consistent table grid on slides 4 to 7, and the one-image-per-page photo section with short captions.
Most useful repair: Raise the contrast on slide 3 and on the pale footnotes, and add a plain-language headline to the text-heavy narrative pages (8, 10, 11, 12) so the main point comes first.
What would change the score: I would add short takeaway titles to the financial summary and key metrics pages (4, 5, 24, 25) and break the long paragraphs into scannable bullets or paired text and visual.
Confidence medium. 35 of 35 pages inspected on contact sheets, 4 at readable size. Reviewed 2026-11-08. Model-assisted review (claude-sonnet-5-5).
Full text of the slides (35 slides)
Every slide's words and a description of its charts and images, so the deck can be searched and rebuilt. Also available as Markdown.
Slide 1
Q4 and FY 2025 Update
Visuals: One Tesla wordmark logo at the bottom right, drawn as a thin, widely letter-spaced, light-grey sans-serif set of glyphs. It is about 2.5% of slide width. No photographs, charts or diagrams.
Slide 2
Highlights / 03 / Financial Summary / 04 / Operational Summary / 06 / Manufacturing & Hardware / 08 / Supporting Infrastructure / 09 / AI & Software / 10 / Services / 11 / Other Updates / 12 / Outlook / 13 / Photos & Charts / 14 / Key Metrics / 24 / Financial Statements / 27 / Additional Information / 34 / 2
Visuals: A small white Tesla wordmark logo (stylised spaced letters T, E, S, L, A) in the bottom-right corner, at about x 91.5%, y 94.5%, width about 6%, height about 1%. No photographs, charts, or other graphics.
Slide 3
HIGHLIGHTS
SUMMARY
Profitability
$4.4B GAAP operating income in 2025; $1.4B in Q4
$3.8B GAAP net income in 2025; $0.8B in Q4
$5.9B non-GAAP net income¹ in 2025; $1.8B in Q4
2025 marked a critical year for Tesla as we further expanded our mission and continued our transition from a hardware-centric business to a physical AI company. We laid the foundation for the future of Tesla as we further advanced FSD (Supervised)⁴, launched our Robotaxi service, began installing production lines for Cybercab and fine-tuned our production-primed Optimus design while expanding our AI training infrastructure.
Our approach to autonomous vehicles and humanoid robots mirrors the way we approached electric vehicles and energy storage – at the system level where we identify the limiting factor and develop bespoke and scalable solutions (batteries, power electronics, inverters, software, AI silicon, etc.) to optimize for cost, functionality, efficiency and safety. Our vertical integration has enabled us to achieve economies of scale in a profitable manner, quickly troubleshoot bottlenecks in production and iteratively optimize our technologies more rapidly than others.
Cash
Operating cash flow of $14.7B in 2025; $3.8B in Q4
Free cash flow² of $6.2B in 2025; $1.4B in Q4
$7.5B increase in our cash and investments³ in 2025 to $44.1B
In 2025, we completed the refresh of our vehicle lineup with the launch of the new Model Y, including additional variants. We believe that maintaining an optimized and efficient product portfolio, with a continued focus on high-value features such as long range, best-in-class software and autonomy, is the correct strategy to win the autos market of the future. Similarly, we continued to evolve our energy offerings for commercial, utility and retail customers, as we position ourselves as a supplier of choice for clean, affordable and rapidly deployable energy capacity ahead of expected sustained demand growth for electricity.
Operations
Began removing safety monitor from our Robotaxis in Austin in January
Record Q4 & FY’25 energy storage deployments
Record vehicle deliveries in APAC
In 2026, we will further invest in the infrastructure needed to support clean energy and transport and autonomous robots, including the ramp of six new production lines across vehicle, robots, energy storage and battery manufacturing, while further leveraging our existing factory, charging and service center footprint to support future growth.
3
(1) Excludes SBC (stock-based compensation) & Digital assets gains and losses, net of tax; (2) Free cash flow = operating cash flow less capex; (3) Includes cash, cash equivalents and investments; (4) Active driver supervision required; does not make the vehicle autonomous; Note: all information herein refers to the current quarter unless otherwise noted.
TESLA
Visuals: none apart from a small grey TESLA wordmark at the lower right corner of the slide, rendered as widely letter-spaced capitals in light grey.
Slide 4
F I N A N C I A L S U M M A R Y
(Unaudited)
($ in millions, except percentages and per share data) Q4-2024 Q1-2025 Q2-2025 Q3-2025 Q4-2025 YoY
Total automotive revenues 19,798 13,967 16,661 21,205 17,693 -11%
Energy generation and storage revenue 3,061 2,730 2,789 3,415 3,837 25%
Services and other revenue 2,848 2,638 3,046 3,475 3,371 18%
Total revenues 25,707 19,335 22,496 28,095 24,901 -3%
Total gross profit 4,179 3,153 3,878 5,054 5,009 20%
Total GAAP gross margin 16.3% 16.3% 17.2% 18.0% 20.1% 386 bp
Operating expenses 2,596 2,754 2,955 3,430 3,600 39%
Income from operations 1,583 399 923 1,624 1,409 -11%
Operating margin 6.2% 2.1% 4.1% 5.8% 5.7% -50 bp
Adjusted EBITDA (1) (2) 4,333 2,814 3,401 4,227 4,154 -4%
Adjusted EBITDA margin (1) (2) 16.9% 14.6% 15.1% 15.0% 16.7% -17 bp
Net income attributable to common stockholders (GAAP) (1) 2,128 409 1,172 1,373 840 -61%
Net income attributable to common stockholders (non-GAAP) (1) (3) 2,107 934 1,393 1,770 1,761 -16%
EPS attributable to common stockholders, diluted (GAAP) (1) 0.60 0.12 0.33 0.39 0.24 -60%
EPS attributable to common stockholders, diluted (non-GAAP) (1) (3) 0.60 0.27 0.40 0.50 0.50 -17%
Net cash provided by operating activities 4,814 2,156 2,540 6,238 3,813 -21%
Capital expenditures (4) (2,780) (1,492) (2,394) (2,248) (2,393) -14%
Free cash flow (4) 2,034 664 146 3,990 1,420 -30%
Cash, cash equivalents and investments 36,563 36,996 36,782 41,647 44,059 21%
(1) As a result of the adoption of the new crypto assets standard, the previously reported quarterly periods in 2024 have been recast.
(2) Beginning in Q1'25, Adjusted EBITDA (non-GAAP) is presented net of digital assets gains and losses and all prior periods have been adjusted.
(3) Beginning in Q1'25, Net income attributable to common stockholders (non-GAAP) is presented net of digital assets gains and losses and all prior periods have been adjusted.
(4) Beginning in Q1'25, Capital expenditures is presented inclusive of purchases of energy generation and storage systems and all prior periods have been adjusted.
4
Visuals: Table with 7 columns and 21 rows. Columns: row label, Q4-2024, Q1-2025, Q2-2025, Q3-2025, Q4-2025, YoY. Header row: ($ in millions, except percentages and per share data) | Q4-2024 | Q1-2025 | Q2-2025 | Q3-2025 | Q4-2025 | YoY. Rows: Total automotive revenues 19,798 | 13,967 | 16,661 | 21,205 | 17,693 | -11%. Energy generation and storage revenue 3,061 | 2,730 | 2,789 | 3,415 | 3,837 | 25%. Services and other revenue 2,848 | 2,638 | 3,046 | 3,475 | 3,371 | 18%. (blank spacer). Total revenues 25,707 | 19,335 | 22,496 | 28,095 | 24,901 | -3%. Total gross profit 4,179 | 3,153 | 3,878 | 5,054 | 5,009 | 20%. Total GAAP gross margin 16.3% | 16.3% | 17.2% | 18.0% | 20.1% | 386 bp. (blank). Operating expenses 2,596 | 2,754 | 2,955 | 3,430 | 3,600 | 39%. Income from operations 1,583 | 399 | 923 | 1,624 | 1,409 | -11%. Operating margin 6.2% | 2.1% | 4.1% | 5.8% | 5.7% | -50 bp. (blank). Adjusted EBITDA (1)(2) 4,333 | 2,814 | 3,401 | 4,227 | 4,154 | -4%. Adjusted EBITDA margin (1)(2) 16.9% | 14.6% | 15.1% | 15.0% | 16.7% | -17 bp. (blank). Net income attributable to common stockholders (GAAP) (1) 2,128 | 409 | 1,172 | 1,373 | 840 | -61%. Net income attributable to common stockholders (non-GAAP) (1)(3) 2,107 | 934 | 1,393 | 1,770 | 1,761 | -16%. (blank). EPS attributable to common stockholders, diluted (GAAP) (1) 0.60 | 0.12 | 0.33 | 0.39 | 0.24 | -60%. EPS attributable to common stockholders, diluted (non-GAAP) (1)(3) 0.60 | 0.27 | 0.40 | 0.50 | 0.50 | -17%. (blank). Net cash provided by operating activities 4,814 | 2,156 | 2,540 | 6,238 | 3,813 | -21%. Capital expenditures (4) (2,780) | (1,492) | (2,394) | (2,248) | (2,393) | -14%. Free cash flow (4) 2,034 | 664 | 146 | 3,990 | 1,420 | -30%. Cash, cash equivalents and investments 36,563 | 36,996 | 36,782 | 41,647 | 44,059 | 21%. No highlighted points beyond the Q4-2025 column, which is shaded pale pink across all data rows. No chart, photo or illustration.
Slide 5
FINANCIAL SUMMARY
(Unaudited)
($ in millions, except percentages and per share data) 2021 2022 2023 2024 2025 YoY
Total automotive revenues 47,232 71,462 82,419 77,070 69,526 -10%
Energy generation and storage revenue 2,789 3,909 6,035 10,086 12,771 27%
Services and other revenue 3,802 6,091 8,319 10,534 12,530 19%
Total revenues 53,823 81,462 96,773 97,690 94,827 -3%
Total gross profit 13,606 20,853 17,660 17,450 17,094 -2%
Total GAAP gross margin 25.3% 25.6% 18.2% 17.9% 18.0% 16 bp
Operating expenses 7,083 7,197 8,769 10,374 12,739 23%
Income from operations 6,523 13,656 8,891 7,076 4,355 -38%
Operating margin 12.1% 16.8% 9.2% 7.2% 4.6% -265 bp
Adjusted EBITDA (1) 11,722 19,390 16,631 16,056 14,596 -9%
Adjusted EBITDA margin (1) 21.8% 23.8% 17.2% 16.4% 15.4% -104 bp
Net income attributable to common stockholders (GAAP) 5,519 12,556 14,997 7,091 3,794 -46%
Net income attributable to common stockholders (non-GAAP) (2) 7,719 14,276 10,882 7,960 5,858 -26%
EPS attributable to common stockholders, diluted (GAAP) 1.63 3.62 4.30 2.04 1.08 -47%
EPS attributable to common stockholders, diluted (non-GAAP) (2) 2.28 4.12 3.12 2.29 1.66 -28%
Net cash provided by operating activities 11,497 14,724 13,256 14,923 14,747 -1%
Capital expenditures (3) (6,514) (7,163) (8,899) (11,342) (8,527) -25%
Free cash flow (3) 4,983 7,561 4,357 3,581 6,220 74%
Cash, cash equivalents and investments 17,707 22,185 29,094 36,563 44,059 21%
(1) Beginning in Q1'25, Adjusted EBITDA (non-GAAP) is presented net of digital assets gains and losses and all prior periods have been adjusted.
(2) Beginning in Q1'25, Net income attributable to common stockholders (non-GAAP) is presented net of digital assets gains and losses and all prior periods have been adjusted.
(3) Beginning in Q1'25, Capital expenditures is presented inclusive of purchases of energy generation and storage systems and all prior periods have been adjusted.
5
Visuals: Table. Columns: row label, 2021, 2022, 2023, 2024, 2025, YoY. Header row: '($ in millions, except percentages and per share data)' with year labels and 'YoY'. Rows, values in order 2021 / 2022 / 2023 / 2024 / 2025 / YoY: Total automotive revenues 47,232 / 71,462 / 82,419 / 77,070 / 69,526 / -10%. Energy generation and storage revenue 2,789 / 3,909 / 6,035 / 10,086 / 12,771 / 27%. Services and other revenue 3,802 / 6,091 / 8,319 / 10,534 / 12,530 / 19%. (blank spacer row). Total revenues 53,823 / 81,462 / 96,773 / 97,690 / 94,827 / -3%. Total gross profit 13,606 / 20,853 / 17,660 / 17,450 / 17,094 / -2%. Total GAAP gross margin 25.3% / 25.6% / 18.2% / 17.9% / 18.0% / 16 bp. (blank). Operating expenses 7,083 / 7,197 / 8,769 / 10,374 / 12,739 / 23%. Income from operations 6,523 / 13,656 / 8,891 / 7,076 / 4,355 / -38%. Operating margin 12.1% / 16.8% / 9.2% / 7.2% / 4.6% / -265 bp. (blank). Adjusted EBITDA (1) 11,722 / 19,390 / 16,631 / 16,056 / 14,596 / -9%. Adjusted EBITDA margin (1) 21.8% / 23.8% / 17.2% / 16.4% / 15.4% / -104 bp. (blank). Net income attributable to common stockholders (GAAP) 5,519 / 12,556 / 14,997 / 7,091 / 3,794 / -46%. Net income attributable to common stockholders (non-GAAP) (2) 7,719 / 14,276 / 10,882 / 7,960 / 5,858 / -26%. (blank). EPS attributable to common stockholders, diluted (GAAP) 1.63 / 3.62 / 4.30 / 2.04 / 1.08 / -47%. EPS attributable to common stockholders, diluted (non-GAAP) (2) 2.28 / 4.12 / 3.12 / 2.29 / 1.66 / -28%. (blank). Net cash provided by operating activities 11,497 / 14,724 / 13,256 / 14,923 / 14,747 / -1%. Capital expenditures (3) (6,514) / (7,163) / (8,899) / (11,342) / (8,527) / -25%. Free cash flow (3) 4,983 / 7,561 / 4,357 / 3,581 / 6,220 / 74%. Cash, cash equivalents and investments 17,707 / 22,185 / 29,094 / 36,563 / 44,059 / 21%. Negative values are shown in parentheses except the YoY column. The 2025 column is highlighted with a pale rose fill behind each of its cells, and the 2025 values are the emphasised column. No charts, photographs or icons appear other than the small Tesla wordmark at bottom right.
Slide 6
OPERATIONAL SUMMARY
(Unaudited)
[table] Q4-2024 / Q1-2025 / Q2-2025 / Q3-2025 / Q4-2025 / YoY
Model 3/Y production / 436,718 / 345,454 / 396,835 / 435,826 / 422,652 / -3%
Other models production / 22,727 / 17,161 / 13,409 / 11,624 / 11,706 / -48%
Total production / 459,445 / 362,615 / 410,244 / 447,450 / 434,358 / -5%
Model 3/Y deliveries / 471,930 / 323,800 / 373,728 / 481,166 / 406,585 / -14%
Other models deliveries / 23,640 / 12,881 / 10,394 / 15,933 / 11,642 / -51%
Total deliveries / 495,570 / 336,681 / 384,122 / 497,099 / 418,227 / -16%
of which subject to operating lease accounting / 26,962 / 13,721 / 6,670 / 10,230 / 10,996 / -59%
Cumulative deliveries (1) (all-time; mil) / 7.3 / 7.6 / 8.0 / 8.5 / 8.9 / 22%
Active FSD Subscriptions (2) (mil) / 0.8 / 0.8 / 0.9 / 1.0 / 1.1 / 38%
Total end of quarter operating lease (new vehicle) count (3) / 180,523 / 179,930 / 172,882 / 167,163 / 163,075 / -10%
Global vehicle inventory (days of supply) (4) / 12 / 22 / 24 / 10 / 15 / 25%
Storage deployed (GWh) / 11.0 / 10.4 / 9.6 / 12.5 / 14.2 / 29%
Tesla locations / 1,359 / 1,390 / 1,454 / 1,498 / 1,553 / 14%
Supercharger stations / 6,975 / 7,131 / 7,377 / 7,753 / 8,182 / 17%
Supercharger connectors / 65,495 / 67,316 / 70,228 / 73,817 / 77,682 / 19%
(1) In accordance with our 2025 CEO Performance Award, metric includes all new Tesla vehicles delivered to customers plus any unsupervised Robotaxis placed into commercial operation. For further detail see our 2025 Proxy Statement.
(2) In accordance with our 2025 CEO Performance Award, metric includes both up-front payment and monthly subscriptions and excludes free trials. For further detail see our 2025 Proxy Statement.
(3) Beginning in Q4’25, end of quarter operating lease count pertains only to new vehicles. Q3’25 has been adjusted to exclude used vehicles.
6
(4) Days of supply is calculated by dividing new vehicle ending inventory by the relevant quarter’s deliveries and using 75 trading days (aligned with Automotive News definition).
Visuals: Table. Columns: row label (unnamed, wide, about 4.6% to 43.5% of width), Q4-2024, Q1-2025, Q2-2025, Q3-2025, Q4-2025 (highlighted column), YoY. Rows: Model 3/Y production 436,718 / 345,454 / 396,835 / 435,826 / 422,652 / -3%; Other models production 22,727 / 17,161 / 13,409 / 11,624 / 11,706 / -48%; Total production (bold) 459,445 / 362,615 / 410,244 / 447,450 / 434,358 / -5%; blank spacer row; Model 3/Y deliveries 471,930 / 323,800 / 373,728 / 481,166 / 406,585 / -14%; Other models deliveries 23,640 / 12,881 / 10,394 / 15,933 / 11,642 / -51%; Total deliveries (bold) 495,570 / 336,681 / 384,122 / 497,099 / 418,227 / -16%; of which subject to operating lease accounting 26,962 / 13,721 / 6,670 / 10,230 / 10,996 / -59%; blank spacer; Cumulative deliveries (all-time; mil) 7.3 / 7.6 / 8.0 / 8.5 / 8.9 / 22%; Active FSD Subscriptions (mil) 0.8 / 0.8 / 0.9 / 1.0 / 1.1 / 38%; blank spacer; Total end of quarter operating lease (new vehicle) count 180,523 / 179,930 / 172,882 / 167,163 / 163,075 / -10%; Global vehicle inventory (days of supply) 12 / 22 / 24 / 10 / 15 / 25%; blank spacer; Storage deployed (GWh) 11.0 / 10.4 / 9.6 / 12.5 / 14.2 / 29%; blank spacer; Tesla locations 1,359 / 1,390 / 1,454 / 1,498 / 1,553 / 14%; blank spacer; Supercharger stations 6,975 / 7,131 / 7,377 / 7,753 / 8,182 / 17%; Supercharger connectors 65,495 / 67,316 / 70,228 / 73,817 / 77,682 / 19%. The Q4-2025 column cells carry a pale rose tint. No chart, photograph or icon.
Slide 7
OPERATIONAL SUMMARY
(Unaudited)
2021
2022
2023
2024
2025
YoY
Model 3/Y production
906,032
1,298,434
1,775,159
1,679,338
1,600,767
-5%
Other models production
24,390
71,177
70,826
94,105
53,900
-43%
Total production
930,422
1,369,611
1,845,985
1,773,443
1,654,667
-7%
Model 3/Y deliveries
911,242
1,247,146
1,739,707
1,704,093
1,585,279
-7%
Other models deliveries
24,980
66,705
68,874
85,133
50,850
-40%
Total deliveries
936,222
1,313,851
1,808,581
1,789,226
1,636,129
-9%
of which subject to operating lease accounting
60,912
47,582
72,226
60,003
41,617
-31%
Cumulative deliveries (1) (all-time; mil)
2.3
3.7
5.5
7.3
8.9
22%
Active FSD Subscriptions (2) (mil)
0.4
0.5
0.6
0.8
1.1
38%
Total end of year operating lease (new vehicle) count
120,342
140,667
176,564
180,523
163,075
-10%
Global vehicle inventory (days of supply) (3)
6
16
16
13
15
15%
Storage deployed (GWh)
4.0
6.5
14.7
31.4
46.7
49%
Tesla locations
644
963
1,208
1,359
1,553
14%
Supercharger stations
3,476
4,678
5,952
6,975
8,182
17%
Supercharger connectors
31,498
42,419
54,892
65,495
77,682
19%
(1) In accordance with our 2025 CEO Performance Award, metric includes all new Tesla vehicles delivered to customers plus any unsupervised Robotaxis placed into commercial operation. For further detail see our 2025 Proxy Statement.
(2) In accordance with our 2025 CEO Performance Award, metric includes both up-front payment and monthly subscriptions and excludes free trials. For further detail see our 2025 Proxy Statement.
(3) Days of supply is calculated by dividing new vehicle ending inventory by the relevant year’s deliveries and using 300 trading days (aligned with Automotive News definition).
7
TESLA
Visuals: Table with 7 columns: an unlabelled row-label column (about 38.7% of slide width), then 2021, 2022, 2023, 2024, 2025 and YoY columns. Header row is a dark grey band (#7F7F7F) with white centred year labels. Rows, in order, with values as printed: (1) Model 3/Y production: 906,032 | 1,298,434 | 1,775,159 | 1,679,338 | 1,600,767 | -5%. (2) Other models production: 24,390 | 71,177 | 70,826 | 94,105 | 53,900 | -43%. (3) Total production (bold): 930,422 | 1,369,611 | 1,845,985 | 1,773,443 | 1,654,667 | -7%. (blank spacer row). (4) Model 3/Y deliveries: 911,242 | 1,247,146 | 1,739,707 | 1,704,093 | 1,585,279 | -7%. (5) Other models deliveries: 24,980 | 66,705 | 68,874 | 85,133 | 50,850 | -40%. (6) Total deliveries (bold): 936,222 | 1,313,851 | 1,808,581 | 1,789,226 | 1,636,129 | -9%. (7) of which subject to operating lease accounting (indented): 60,912 | 47,582 | 72,226 | 60,003 | 41,617 | -31%. (blank spacer). (8) Cumulative deliveries (1) (all-time; mil): 2.3 | 3.7 | 5.5 | 7.3 | 8.9 | 22%. (9) Active FSD Subscriptions (2) (mil): 0.4 | 0.5 | 0.6 | 0.8 | 1.1 | 38%. (blank spacer). (10) Total end of year operating lease (new vehicle) count: 120,342 | 140,667 | 176,564 | 180,523 | 163,075 | -10%. (11) Global vehicle inventory (days of supply) (3): 6 | 16 | 16 | 13 | 15 | 15%. (blank spacer). (12) Storage deployed (GWh): 4.0 | 6.5 | 14.7 | 31.4 | 46.7 | 49%. (blank spacer). (13) Tesla locations: 644 | 963 | 1,208 | 1,359 | 1,553 | 14%. (blank spacer). (14) Supercharger stations: 3,476 | 4,678 | 5,952 | 6,975 | 8,182 | 17%. (15) Supercharger connectors: 31,498 | 42,419 | 54,892 | 65,495 | 77,682 | 19%. The 2025 column cells carry a pale pink tint (about #F2DCDB) to highlight them. No chart, photograph or icon is present. Superscript markers (1), (2) and (3) appear after the row labels. The faint wordmark bottom-right is the Tesla logo in letterspaced capitals, rendered in light grey.
Slide 8
MANUFACTURING & HARDWARE
Installed Annual Manufacturing Capacity
Automotive
Region
Product
Capacity
Status
Automotive
California
Model 3 / Model Y
>550,000
Production
Model S / Model X
100,000
Production
Shanghai
Model 3 / Model Y
>950,000
Production
Berlin
Model Y
>375,000
Production
Texas
Model Y
>250,000
Production
Cybertruck
>125,000
Production
Cybercab
-
Tooling
Nevada
Tesla Semi
-
Tooling
TBD
Roadster
-
Design development
Energy Generation and Storage
California
Megapack
40 GWh
Production
Nevada
Powerwall
>6 GWh
Production
Shanghai
Megapack
40 GWh
Production
Texas
Megapack
-
Construction
Robotics
California
Optimus
-
Construction
Automotive
While automotive sales declined sequentially, gross margin (even when excluding the impact of regulatory credits) improved. The APAC region continued to show strength across multiple markets and set a record for deliveries in the quarter. We continued the rollout of Model Y variants across markets in Q4, including the standard and performance versions.
Preparations continue in North America for the production ramps of Tesla Semi and Cybercab, both commencing 1H26, and production of the next-generation Roadster.
Energy generation and storage
We achieved our highest quarterly energy storage deployments, driven by record Megapack deployments. Total gross profit rose, both sequentially and year-over-year, to a record $1.1 billion, marking the fifth consecutive record quarter. We plan to begin Megapack 3 and Megablock production at Megafactory Houston in 2026. In 2025, our global Powerwall network supported more than 89,000 Virtual Power Plant events across over 1 million installed units, allowing homeowners to save over $1 billion in electricity bills as Virtual Power Plant participation continues to scale rapidly.
Robotics
We made further progress on the Optimus program in 2025. In Q1 of this year, we plan to unveil the Gen 3 version of Optimus, which will include major upgrades from version 2.5, including our latest hand design. The Gen 3 is our first design meant for mass production. Preparations are underway for the first production line, including supply chain readiness, with start of production planned before the end of 2026 and eventual planned capacity of 1 million robots per year.
Installed capacity ≠ current production rate and there may be limitations discovered as production rates approach capacity. Production rates depend on a variety of factors, including equipment uptime, component supply, downtime related to factory upgrades, regulatory considerations and other factors. Construction includes factory and infrastructure buildout as well as tool installation.
8
Visuals: Table titled Installed Annual Manufacturing Capacity with four columns (Region, Product, Capacity, Status) and four section rows (Automotive, Energy Generation and Storage, Robotics; Automotive appears as the first section row). Automotive rows: California / Model 3 / Model Y / >550,000 / Production; blank region / Model S / Model X / 100,000 / Production; Shanghai / Model 3 / Model Y / >950,000 / Production; Berlin / Model Y / >375,000 / Production; Texas / Model Y / >250,000 / Production; blank / Cybertruck / >125,000 / Production; blank / Cybercab / - / Tooling; Nevada / Tesla Semi / - / Tooling; TBD / Roadster / - / Design development. Energy Generation and Storage rows: California / Megapack / 40 GWh / Production; Nevada / Powerwall / >6 GWh / Production; Shanghai / Megapack / 40 GWh / Production; Texas / Megapack / - / Construction. Robotics row: California / Optimus / - / Construction. Product names are bold; capacity values are right-aligned; status values are centred. No chart, photograph or illustration. Two thin light-grey horizontal rules separate the left-column sections. A faint wordmark is the only logo.
Slide 9
SUPPORTING INFRASTRUCTURE / AI Training Compute / We are currently building Cortex 2 at Gigafactory Texas to further increase our AI training compute capacity. In the first half of 2026, we plan to more than double the size of onsite compute in Texas (in terms of H100 equivalents). We aim to maximize capital efficiency by scaling training compute judiciously, including when the training backlog gets too long or in anticipation of greater demand from our engineers to support our AI-related offerings. / Battery / Our lithium refinery commenced pilot production and is the first spodumene to lithium hydroxide refinery in North America, leveraging a simpler, cheaper and more environmentally friendly process. This refinery enables us to domestically produce critical minerals in support of energy storage, battery manufacturing and ultimately for EV growth. / We have begun to produce battery packs for certain Model Ys with our 4680 cells, unlocking an additional vector of supply to help navigate increasingly complex supply chain challenges caused by trade barriers and tariff risks. We now produce dry-electrode for 4680 cells with both anode and cathode made in Austin. We expect both domestic cathode material in Texas and LFP lines in Nevada to begin production in 2026. / Other Supporting Infrastructure / We continue to efficiently utilize our existing physical footprint in North America, with targeted augmentation to support the rollout of Robotaxi. While in the short-term, operational workstreams such as charging, cleaning and maintenance can be managed through our existing charging network, service centers and sales and delivery locations, we will have to add more capacity as the service expands. We added over 3,800 net new Supercharging stalls, growing the network 19% year-over-year. / Installed Annual Capacity / Region / Product / Capacity / Status / AI Training Compute / Texas / Cortex 1 / >100k H100e / Production / Cortex 2 / - / Construction / Battery Manufacturing / Nevada / LFP / 7 GWh / Early Ramp / Texas / 4680 / 40 GWh / Production / Cathode Materials / 10 GWh / Early Ramp / Lithium Refining / 30 GWh / Early Ramp / Installed capacity ≠ current production rate and there may be limitations discovered as production rates approach capacity. Production rates depend on a variety of factors, including equipment uptime, component supply, downtime related to factory upgrades, regulatory considerations and other factors. Construction includes factory and infrastructure buildout as well as tool installation. / Existing Capacity / Future Planned Capacity / 300,000 / 250,000 / 200,000 / 150,000 / 100,000 / 50,000 / 0 / Jun-2021 / Sep-2021 / Dec-2021 / Mar-2022 / Jun-2022 / Sep-2022 / Dec-2022 / Mar-2023 / Jun-2023 / Sep-2023 / Dec-2023 / Mar-2024 / Jun-2024 / Sep-2024 / Dec-2024 / Mar-2025 / Jun-2025 / Sep-2025 / Dec-2025 / Mar-2026 / Jun-2026 / Tesla AI Training Capacity Ramp (H100 equivalent GPUs) / 9
Visuals: Table: titled Installed Annual Capacity (bold, centred above the table). Four columns: Region, Product, Capacity, Status. Header row in grey with white text. Group rows AI Training Compute (row 1) and Battery Manufacturing (row 4) are merged across all columns in bold. AI Training Compute rows: Texas / Cortex 1 / >100k H100e / Production; blank region / Cortex 2 / - / Construction. Battery Manufacturing rows: Nevada / LFP / 7 GWh / Early Ramp; Texas / 4680 / 40 GWh / Production; blank region / Cathode Materials / 10 GWh / Early Ramp; blank region / Lithium Refining / 30 GWh / Early Ramp. Product names bold; capacity values right aligned in Battery rows. Chart: line chart titled Tesla AI Training Capacity Ramp (H100 equivalent GPUs). X axis: time from Jun-2021 to Jun-2026, labels every three months, rotated about 45 degrees. Y axis: H100 equivalent GPUs, 0 to 300,000, gridlines every 50,000. Series 1 Existing Capacity: solid blue line, about 2,000 in Jun-2021 rising slowly to about 5,000 by Sep-2023, about 17,000 in Dec-2023, about 28,000 in Feb-2024, about 38,000 by Mar-2024 and flat to Sep-2024, about 88,000 by Dec-2024, about 107,000 by Apr-2025, about 120,000 by Jul-2025 and flat to about Nov-2025. Series 2 Future Planned Capacity: dotted blue line, about 140,000 from Jul-2025 to Jan-2026, then rising steeply to about 280,000 by Mar-2026 and flat to Jun-2026. Legend at top inside plot area: solid line Existing Capacity, dotted line Future Planned Capacity. No highlighted points. Values are estimates, none printed.
Slide 10
A I & S O F T W A R E / AI Software / We continue to enhance FSD (Supervised)1 via our end-to-end foundation model trained on both customer and Robotaxi real-world data with our latest version, v14. FSD (Supervised)1 increasingly provides safety and convenience functionality that can relieve drivers of many tedious and potentially dangerous aspects of road travel, including giving access to personal transport for those who otherwise have difficulty driving. V14 offers unparalleled driver assistance to safely drive to the customer’s destination, find a free parking spot and park at that location. Our global fleet can collect the equivalent of over 500 years of continuous driving data per day2, allowing us to safely deploy and scale capabilities that can handle the long and fat tail of corner cases across diverse geographies and driving environments. / AI Inference Compute / Development of our in-house, custom designed AI5 and AI6 inference chips for autonomy progressed during the quarter, with production planned for 2027 and 2028, respectively. We are targeting a 50x improvement in performance for AI5 relative to AI4 thanks to 10x raw compute, 9x memory capacity and 5x hardened block quantization and softmax function (the latter enabling efficient low-precision computing without sacrificing model accuracy). / Automotive and Other Software / The Robotaxi iOS app no longer has a waitlist in the areas we serve. Our vehicles keep getting better with our over-the-air updates, including: Grok (an AI companion) which now supports navigation commands (allowing users to find, add and edit navigation destinations hands-free); Tesla Photobooth which enables users to take photos in their car and download or share via the Tesla mobile app; Supercharger Site Maps which displays Supercharger layouts, nearby businesses and live availability details; Automatic HOV Lane Routing based on interior camera occupancy detection; Phone Left Behind Chime and SpaceX ISS Docking Simulator Game. / 8.0 / 7.0 / 6.0 / 5.0 / 4.0 / 3.0 / 2.0 / 1.0 / 0.0 / FSD Miles on V12 and Beyond / FSD Miles on V11 and Before / Sep-2021 / Dec-2021 / Mar-2022 / Jun-2022 / Sep-2022 / Dec-2022 / Mar-2023 / Jun-2023 / Sep-2023 / Dec-2023 / Mar-2024 / Jun-2024 / Sep-2024 / Dec-2024 / Mar-2025 / Jun-2025 / Sep-2025 / Dec-2025 / Cumulative Miles Driven with FSD (Supervised)1 (billions) / Optimizing Tesla silicon / 5x / Hardened block quantization and softmax / 9x / Memory capacity / 10x / Raw compute increase / 50x / Total improvement over AI4 / Targeting Step-Function Improvement for our Next-Generation Inference Chip, AI5 / (1) Active driver supervision required; does not make the vehicle autonomous / (2) Calculated based on continuous hours of driving at an average of 30 miles per hour / 10
Visuals: Chart (top right): stacked-look cumulative area chart, two series, no chart title on the chart itself. X-axis: quarterly dates Sep-2021 to Dec-2025 (labels rotated about 45 degrees, every third quarter labelled, 18 labels). Y-axis: 0.0 to 8.0 in steps of 1.0, unit billions (caption says billions). Series 1 'FSD Miles on V12 and Beyond' in red #C00000, plotted as the upper area, rising from about 1.0 at Mar-2024 to about 2.0 at Dec-2024 to about 3.0 at Mar-2025 and about 7.3 at Dec-2025 (estimates; no values printed). Series 2 'FSD Miles on V11 and Before' in blue #4472C4, lower area, rising from about 0.0 at Sep-2021 to about 0.9 at Mar-2024 then flat at about 0.9 through Dec-2025 (estimates; no values printed). Legend centred at top of plot inside the chart area with red square then blue square markers. Gridlines light grey horizontal at each 1.0 step. No highlighted points. Image (bottom right, boxed, not cropped, not full-bleed): a flat black rectangle 800 by 450 pixels with a title 'Optimizing Tesla silicon' in white sans-serif at top left; a two-by-two grid of dark charcoal rounded-corner tiles (about #1C1C1C) on the left: top-left '5x' with 'Hardened block quantization and softmax', top-right '9x' with 'Memory capacity', bottom-left '10x' with 'Raw compute increase', bottom-right '50x' with 'Total improvement over AI4'; each big number in white with thin white divider line under it. Right of the tiles is a rendered three-quarter view of a dark AI processor package on a black background: a flat rectangular board with gold-edged border, several black heat-sink blocks on the right and a central green-gold die area with fine circuit texture; lit from upper left with soft highlights on the metal edges. Footnote markers and small faint grey glyph icons sit at bottom right corner (four tiny indistinct grey icons, about 91% to 97% x, 94% y), lightly faded.
Slide 11
SERVICES
Robotaxi
We began testing driverless Robotaxis in Austin in December and began removing the safety monitor from customer rides in January on a limited basis, which will unlock further expansion of our Robotaxi fleet and coverage area in the Austin-metro. Our Bay Area ride-hailing service began serving the San Jose Airport in October, with plans to expand to other major airports in the Bay Area upon receiving required permitting.
FSD (Supervised)1
We launched FSD (Supervised)1 in South Korea, where customers drove over 1 million kilometers using the software in just one month. While we continue to pursue regulatory approval in China and Europe, we began offering ride-along experiences to consumers in Italy, Germany, France and Switzerland.
Monthly subscriptions to FSD (Supervised)1 continued to grow sequentially and more than doubled in 2025. Starting this quarter, we are transitioning access to FSD (Supervised)1 to monthly subscriptions only as we begin to sunset the up-front payment option.
Automotive Services
Services and Other gross profit of approximately $300 million was partly driven by Part Sales and Supercharging. We now offer Tesla Insurance in Florida, as we continue to expand our insurance product to new states. In certain states, customers receive a discount on their insurance premiums when using FSD (Supervised)1. The more you drive with FSD (Supervised)1 enabled, the bigger the discount is on your insurance premium – helping, in certain cases, to completely offset the monthly subscription cost for FSD (Supervised)1.
Cumulative Paid Robotaxi Miles
State / Metro / Status
California / SF Bay Area / Safety Driver
Texas / Austin / Ramping Unsupervised
Dallas / 1H 2026
Houston / 1H 2026
Arizona / Phoenix / 1H 2026
Florida / Miami / 1H 2026
Orlando / 1H 2026
Tampa / 1H 2026
Nevada / Las Vegas / 1H 2026
Planned Robotaxi Coverage
(1) Active driver supervision required; does not make the vehicle autonomous.
11
Visuals: Chart: area chart titled Cumulative Paid Robotaxi Miles (caption printed below the chart's x-axis region, bold grey). Y-axis 0 to 700,000 in steps of 100,000, with light grey horizontal gridlines at each step and labels 0, 100,000, 200,000, 300,000, 400,000, 500,000, 600,000, 700,000 printed right-aligned. X-axis categories Jun-2025, Jul-2025, Aug-2025, Sep-2025, Oct-2025, Nov-2025, Dec-2025, labels rotated about 45 degrees. Single series filled solid blue #4F81BD with no outline; no legend; no highlighted points. Values are not printed; estimated values: Jun-2025 about 0, Jul-2025 about 3,000, Aug-2025 about 20,000, Sep-2025 about 120,000, Oct-2025 about 265,000, Nov-2025 about 460,000, Dec-2025 about 655,000. Table: three columns State, Metro, Status with a grey header row (#7F7F7F, white text). Rows: California, SF Bay Area, Safety Driver; Texas, Austin, Ramping Unsupervised; blank state, Dallas, 1H 2026; blank state, Houston, 1H 2026; Arizona, Phoenix, 1H 2026; Florida, Miami, 1H 2026; blank state, Orlando, 1H 2026; blank state, Tampa, 1H 2026; Nevada, Las Vegas, 1H 2026. Body rows filled alternately with light grey #F2F2F2 cells and thin white separators; Metro names in bold, State and Status in regular. Logo: a faint letterspaced Tesla wordmark (T E S L A) in light grey #BFBFBF at the bottom right, about 91.5% to 97% of width and about 93% to 94% of height. No photographs or illustrations.
Slide 12
OTHER UPDATES
On January 16, 2026, Tesla entered into an agreement to invest approximately $2 billion to acquire shares of Series E Preferred Stock of xAI as part of their recent
publicly-disclosed financing round. Tesla’s investment was made on market terms consistent with those previously agreed to by other investors in the financing round. As
set forth in Master Plan Part IV, Tesla is building products and services that bring AI into the physical world. Meanwhile, xAI is developing leading digital AI products and
services, such as its large language model (Grok).
In that context, and as part of Tesla’s broader strategy under Master Plan Part IV, Tesla and xAI also entered into a framework agreement in connection with the
investment. Among other things, the framework agreement builds upon the existing relationship between Tesla and xAI by providing a framework for evaluating
potential AI collaborations between the companies. Together, the investment and the related framework agreement are intended to enhance Tesla’s ability to develop
and deploy AI products and services into the physical world at scale. This investment is subject to customary regulatory conditions with the expectation to close in
Q1'2026.
12
Slide 13
OUTLOOK
Volume
We are focused on maximum capacity utilization at our factories. Deliveries and deployments will be impacted by aggregate demand for
our products, supply chain readiness and allocation decisions between sale to customers or use for our owned and operated fleet.
Cash
We will manage the businesses such that we ensure a strong balance sheet, maintaining sufficient liquidity to fund our product roadmap,
long-term capacity expansion plans – including further vertical integration – and other expenses.
Profit
While we continue to execute on innovations to reduce the cost of manufacturing and operations, over time, we expect our hardware-
related profits to be accompanied by an acceleration of AI, software and fleet-based profits.
Product
We continue to evolve and augment our product lineup with a focus on cost, scale and future monetization opportunities via services
powered by our AI software. We remain focused on growing our sales volumes through a differentiated and efficiently managed product
portfolio, which includes leveraging and optimizing our existing production capacity before building new factories and production lines.
Cybercab, Tesla Semi and Megapack 3 are on schedule for volume production starting in 2026. First generation production lines for
Optimus are being installed in anticipation of volume production.
13
Slide 14
PHOTOS & CHARTS
T E S L A
Visuals: Only the small Tesla wordmark in the bottom-right corner: a widely letter-spaced, thin, geometric sans-serif capital wordmark in mid-grey, roughly 8% of slide width. No photographs, charts or other graphics.
Slide 15
MODEL Y – 2025 BEST IN CLASS EURO NCAP(1) SMALL SUV / (1) EURO NCAP: European New Car Assessment Programme / 15
Visuals: Photograph, boxed, not cropped at the frame edges, sitting inside the margins with square corners. Subject: a silver-grey SUV, shown from the rear three-quarter view, driving left to right along a curving two-lane asphalt road with white edge and centre lines. The car is in the centre-right of the frame, slightly below middle height. Its rear light bar glows red across the tailgate. The left side of the frame has a steep, tree-covered hillside with rocky cut face; the right side has rounded wooded hills and a calm lake. The background road and scenery show motion blur, implying speed. Sky is pale blue with thin white clouds. Lighting is soft natural daylight with a long shadow of the car falling on the road to the right. Dominant colours: silver-grey car, dark asphalt grey, muted olive and dark green foliage, pale blue sky, white lane markings, beige roadside verge. No overlay or tint. Also a faint light-grey wordmark at bottom right, about x 91 to 97%, y 92.5 to 93.5%, too small to read clearly.
Slide 16
MODEL 3 – 2025 BEST IN CLASS EURO NCAP(1) LARGE FAMILY CAR
(1) EURO NCAP: European New Car Assessment Programme
16
Visuals: One photograph, boxed (not full-bleed), with no crop beyond the rectangle and no overlay or tint. Subject: a red four-door sedan, a Tesla Model 3, driving fast on a curving two-lane asphalt mountain road, seen three-quarter from the front-left with the car in the lower-centre of the frame. The background is heavily motion-blurred: a tan rocky cliff with green shrubs on the left, a steep hillside of dense green pine forest on the right, and a calm blue sea or lake with a pale shoreline at far right. Clear pale blue sky at top right. The road has white edge lines and a white dashed centre line curving toward the viewer. Lighting is bright natural daylight with soft shadows under the car. Dominant colours: red #C8102E-like car, tan #C2A185 rock, green #4E6B3A forest, grey #4A4A4A asphalt, blue #6FB3D2 water and sky. Composition is landscape, with the car placed left of centre and the road leading the eye toward the lower right.
Slide 17
FSD (SUPERVISED)1 – V14 OFFERS UNPARALLELED DRIVER ASSISTANCE / [photograph: no text on slide other than the screen display] / 17 / (1) Active driver supervision required; does not make the vehicle autonomous. / TESLA
Visuals: One photograph, full colour, in a sharp-cornered rectangle (no crop beyond the frame edges, no overlay or tint). Subject: the interior of a Tesla car seen from the driver's seat. A black three-spoke-style steering wheel with a Tesla emblem on the hub is at left. Centre console touchscreen is tilted toward the viewer, showing a dark navigation map with a blue route line curving down the centre, small grey building footprints and a yellow warning triangle on the route. The screen shows on its left panel a blue button labelled 'Start Self-Driving' and partial 'Open Frunk' and 'Open Trunk' buttons; a white card reads '0.3 mi' with 'Ben Joaquin Rd', and a second card reads 'Mountain Village' with '0.8 mi'; a bottom bar reads '6:10 pm', '25 min', '9.8 mi', 'Work', 'End Trip'. A person's arm in a dark sleeve reaches from the bottom centre and the index finger points at the screen. Through the windshield is a stone-and-wood building: a warm lit wooden front door at left, a stone wall, a wide wooden-plank staircase in the centre and a dark wall light at right. A rear-view mirror is at the top centre. A thin red ambient light strip runs along the dashboard edge. Lighting is soft and natural with warm amber light from the building and cool daylight through the glass. Dominant colours: near-black #1A1A1A for the dash and cabin, warm beige stone #C8B89A, tan wood #8A6A45, and red #D0103A for the ambient strip. Composition: eye-level, slightly off-centre, shallow depth of field with the screen and hand in focus.
Slide 18
DRIVERLESS ROBOTAXI– TESTING IN AUSTIN
18
Visuals: Photograph of the interior of a Tesla robotaxi seen from the driver's seat, looking through the windshield at a city street in Austin. The steering wheel with a centre Tesla horn pad and a black dashboard occupy the lower half; a central touchscreen shows a navigation view with a blue route line, a speed of 23 and a small status panel. Through the windshield a wide street with blurred motion trees, a parked car, a red Motel neon sign, traffic lights and a red SUV ahead is visible; the image has motion blur on the side windows. A rear-view camera module is mounted at top centre of the windshield. Lighting is soft daylight with bright sky; dominant colours are charcoal black, cool blue-grey and muted green. The photo is boxed (not full-bleed), sharp-cornered, with no overlay or tint.
Slide 19
CYBERCAB – COLD WEATHER TESTING IN ALASKA / 19
Visuals: Photograph of a gold-coloured Cybercab prototype driven away from the camera on a snow-covered flat plain at sunset, seen from the rear three-quarter view. The car's rear light bar glows red across the rear, its rear plate reads 'FH-048' with ice and frost on the bumper and rear panel, Michelin tyres on bare wheels. Behind it are snowy mountains on the left, a line of leafless trees and a distant mountain range on the right, and a pale blue-to-peach sky with streaked clouds. Lighting is low warm sunlight from the right side on the car body, cool blue shade on the snow. Dominant colours: gold, slate blue, white snow, peach sky. The photo is a full rectangle, not cropped, not boxed with a frame, with no overlay or tint. A small black text decal on the car side reads 'Tesla Engineering Prototype' with a stylised signature.
Slide 20
TESLA SEMI – PRODUCTION BEGINNING IN 2026
20
TESLA
Visuals: Photograph of two white Tesla Semi electric tractor trucks parked side by side, viewed head-on from the front, slightly off-centre. The left truck is nearer to camera and angled slightly; the right truck is set further back and to the right, both with headlight light bars lit. Behind them: a white box trailer with the number '0148' on its rear edge at left-centre, a dark grey trailer at far left, a white trailer on the far right, a low industrial building with green-tinted windows and dark mountains and a sunset-lit sky behind. Ground is dark grey asphalt with white parking lines. Composition is full-width, eye-level, centred between the trucks. Lighting is overcast dusk with cool blue-grey clouds and warm light on the horizon at left; the trucks are lit by their own front light bars and soft ambient light. Dominant colours: white #F2F2F2 trucks, slate blue-grey sky #5B6170, dark asphalt #2B2B2B, brown-grey hills #6E6258. The photo is not cropped, sits as a boxed rectangle with square corners, no overlay or tint. The faint wordmark bottom-right is light grey #BABABA.
Slide 21
TESLA SEMI – MEGACHARGER NETWORK PLANNED SITES FOR 2026
VANCOUVER
Victoria
Se
Portland
Helena
Bismarck
Thunder Bay
Quebec
Ottawa
Montreal
Minneapolis
Pierre
Boise
Milwaukee
CHICAGO
TORONTO
Buffalo
Detroit
Boston
Cleveland
Des Moines
Pittsburgh
NEW YORK
Philadelphia
WASHINGTON
Norfolk
Raleigh
Cheyenne
DENVER
UNITED STATES
Salt Lake City
Cincinnati
Sacram
SAN FRANCISCO
San Jose
Las Vegas
St. Louis
Nashville
Memphis
Santa Fe
Oklahoma City
LOS ANGELES
ATLANTA
Phoenix
Jackson
San Diego
Da
HOUSTON
San Ar
New Orleans
Tampa
Chihuahua City
Gulf of California
Ha
21
Visuals: A full-bleed-to-margin wide map image (2732 by 1364 pixels) of the contiguous United States and parts of southern Canada and northern Mexico, drawn in a pale flat style: land in very light grey-white, water in grey-blue, thin pinkish-grey state borders and light grey city labels. Overlaid are about 45 red map pins, each a teardrop marker in red #D93A2B with a white lightning-bolt icon and a soft dark drop shadow falling to the lower right. Pins cluster at Pacific Northwest (about 4 near Seattle and 1 near Portland), Northern California and the Bay Area (about 8 pins), Southern California near Los Angeles (about 5 pins), Las Vegas (1), Denver (1), Phoenix (1), West Texas and the Texas border (about 4), Dallas-Fort Worth area (about 3), Houston area (about 3), San Antonio area (about 3), Chicago (2 overlapping), New York (1), Atlanta (1), and the Carolinas/Georgia coast (2). Pins are exact to the map and no values, axes or legend are printed. The map is not cropped at its edges except the right side shows the edge of the Atlantic.
Slide 22
GIGAFACTORY SHANGHAI – 9 MILLIONTH VEHICLE PRODUCED (GLOBALLY) / 22
Visuals: Photograph of a group of about two hundred Tesla factory workers posing in the Gigafactory Shanghai production hall to mark the 9 millionth vehicle. Workers in black jackets, navy and yellow hi-vis vests, and caps (some red, light blue and white) crowd around a white Tesla Model Y parked at centre-right, with silver foil balloons spelling '9', '0', '0' (shown as 900 in the photo) in front of the car. Many workers are raising their hands and waving. Behind them is the automated production line with robotic arms, machinery, and several black vehicles on the line; a long conveyor rack runs along the right. The composition is a wide aerial/elevated view, full-bleed within a rectangular box with no border, no crop of the subject, lit by even overhead factory light; dominant colours are grey concrete floor, white, black and silver. No overlay or tint.
Slide 23
GIGAFACTORY NEVADA – 6 MILLIONTH DRIVE UNIT PRODUCED / 23
Visuals: Photograph, not cropped, full frame within a rectangular box (2786 by 1472 px). Subject: about 150 to 200 employees in dark work clothing (black t-shirts, black hoodies, caps, jeans, work boots) stand shoulder to shoulder in a factory aisle, facing the camera from an elevated viewpoint. In the foreground, a line of people holds up large gold foil balloon numerals that together read 6000000, spanning roughly 28% to 80% of the image width, with the first numeral 6 at left and the last 0 at right; the balloons are glossy metallic gold. Centred in the lower foreground on a wooden pallet is a silver drive unit (gearbox assembly). On the left, stacked brown cardboard boxes, a red plastic bin and a grey-lidded container; on the right, boxes printed IMC 100 in black and yellow, and a small glass jar on a grey surface. In the background are large white Tesla machine enclosures with red accents and Tesla wordmarks, labels such as DLI2-1C400-Q1 and 36G and 36H on white panels, red safety railings, and a conveyor on the right. Lighting is bright, even overhead factory light with no strong shadows; dominant colours are white and light grey machinery, gold balloons, black clothing and red accents. No overlay or tint.
Slide 24
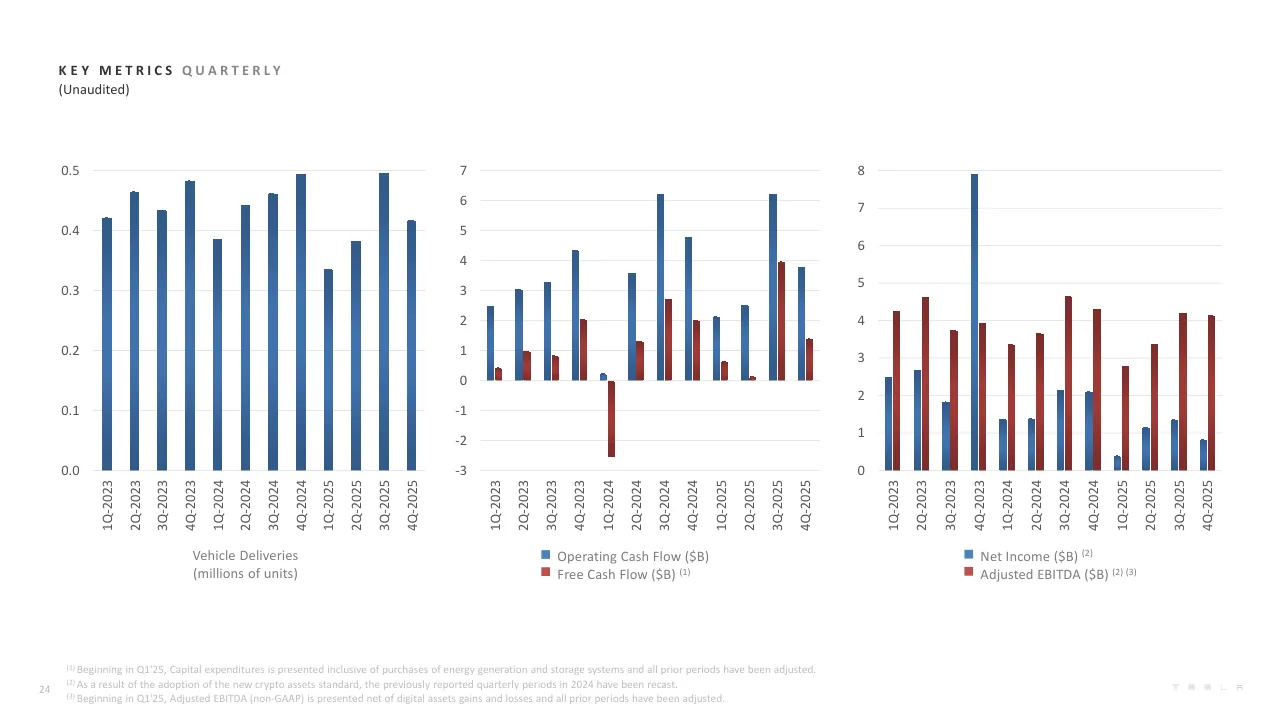
KEY METRICS QUARTERLY
(Unaudited)
0.5
0.4
0.3
0.2
0.1
0.0
1Q-2023 2Q-2023 3Q-2023 4Q-2023 1Q-2024 2Q-2024 3Q-2024 4Q-2024 1Q-2025 2Q-2025 3Q-2025 4Q-2025
Vehicle Deliveries
(millions of units)
7
6
5
4
3
2
1
0
-1
-2
-3
1Q-2023 2Q-2023 3Q-2023 4Q-2023 1Q-2024 2Q-2024 3Q-2024 4Q-2024 1Q-2025 2Q-2025 3Q-2025 4Q-2025
Operating Cash Flow ($B)
Free Cash Flow ($B) (1)
8
7
6
5
4
3
2
1
0
1Q-2023 2Q-2023 3Q-2023 4Q-2023 1Q-2024 2Q-2024 3Q-2024 4Q-2024 1Q-2025 2Q-2025 3Q-2025 4Q-2025
Net Income ($B) (2)
Adjusted EBITDA ($B) (2) (3)
(1) Beginning in Q1'25, Capital expenditures is presented inclusive of purchases of energy generation and storage systems and all prior periods have been adjusted.
(2) As a result of the adoption of the new crypto assets standard, the previously reported quarterly periods in 2024 have been recast.
24
(3) Beginning in Q1'25, Adjusted EBITDA (non-GAAP) is presented net of digital assets gains and losses and all prior periods have been adjusted.
Visuals: Three clustered/single-series column charts, unlabelled data points (no printed values), with values estimated as 'about'. Chart 1, Vehicle Deliveries (millions of units): single blue series, y-axis 0.0 to 0.5 in steps of 0.1, gridlines absent. Estimated values, about: 1Q-2023 0.42; 2Q-2023 0.465; 3Q-2023 0.435; 4Q-2023 0.483; 1Q-2024 0.385; 2Q-2024 0.443; 3Q-2024 0.462; 4Q-2024 0.494; 1Q-2025 0.336; 2Q-2025 0.382; 3Q-2025 0.496; 4Q-2025 0.418. No legend. No highlighted points. Chart 2, Operating Cash Flow ($B) and Free Cash Flow ($B) (1): y-axis -3 to 7 in steps of 1, light grey horizontal gridlines at each integer, zero line at 0. Blue series = Operating Cash Flow, red series = Free Cash Flow, paired columns per quarter. Estimated values, about: Operating 1Q-2023 2.5; 2Q-2023 3.05; 3Q-2023 3.3; 4Q-2023 4.35; 1Q-2024 0.22; 2Q-2024 3.6; 3Q-2024 6.25; 4Q-2024 4.8; 1Q-2025 2.12; 2Q-2025 2.52; 3Q-2025 6.22; 4Q-2025 3.78. Free: 1Q-2023 0.42; 2Q-2023 0.98; 3Q-2023 0.82; 4Q-2023 2.03; 1Q-2024 -2.53; 2Q-2024 1.32; 3Q-2024 2.72; 4Q-2024 2.0; 1Q-2025 0.63; 2Q-2025 0.13; 3Q-2025 3.97; 4Q-2025 1.4. Legend below the chart: blue square then 'Operating Cash Flow ($B)'; red square then 'Free Cash Flow ($B) (1)'. No highlighted points. Chart 3, Net Income ($B) (2) and Adjusted EBITDA ($B) (2) (3): y-axis 0 to 8 in steps of 1, light grey gridlines. Blue series = Net Income, red series = Adjusted EBITDA. Estimated values, about: Net Income 1Q-2023 2.5; 2Q-2023 2.68; 3Q-2023 1.83; 4Q-2023 7.9; 1Q-2024 1.38; 2Q-2024 1.38; 3Q-2024 2.15; 4Q-2024 2.1; 1Q-2025 0.4; 2Q-2025 1.15; 3Q-2025 1.35; 4Q-2025 0.82. Adjusted EBITDA: 1Q-2023 4.25; 2Q-2023 4.63; 3Q-2023 3.72; 4Q-2023 3.93; 1Q-2024 3.33; 2Q-2024 3.64; 3Q-2024 4.65; 4Q-2024 4.32; 1Q-2025 2.8; 2Q-2025 3.36; 3Q-2025 4.21; 4Q-2025 4.14. Legend below: blue square 'Net Income ($B) (2)'; red square 'Adjusted EBITDA ($B) (2) (3)'. No highlighted points. No photographs, logos other than the faint wordmark at bottom right, or icons.
Slide 25
KEY METRICS TRAILING 12 MONTHS (TTM)
(Unaudited)
2.0 / 1.8 / 1.6 / 1.4 / 1.2 / 1.0 / 0.8 / 0.6 / 0.4 / 0.2 / 0.0
1Q-2023 2Q-2023 3Q-2023 4Q-2023 1Q-2024 2Q-2024 3Q-2024 4Q-2024 1Q-2025 2Q-2025 3Q-2025 4Q-2025
Vehicle Deliveries
(millions of units)
18 / 16 / 14 / 12 / 10 / 8 / 6 / 4 / 2 / 0
1Q-2023 2Q-2023 3Q-2023 4Q-2023 1Q-2024 2Q-2024 3Q-2024 4Q-2024 1Q-2025 2Q-2025 3Q-2025 4Q-2025
Operating Cash Flow ($B)
Free Cash Flow ($B) (1)
20 / 18 / 16 / 14 / 12 / 10 / 8 / 6 / 4 / 2 / 0
1Q-2023 2Q-2023 3Q-2023 4Q-2023 1Q-2024 2Q-2024 3Q-2024 4Q-2024 1Q-2025 2Q-2025 3Q-2025 4Q-2025
Net Income ($B) (2)
Adjusted EBITDA ($B) (2) (3)
(1) Beginning in Q1'25, Capital expenditures is presented inclusive of purchases of energy generation and storage systems and all prior periods have been adjusted.
(2) As a result of the adoption of the new crypto assets standard, the previously reported quarterly periods in 2024 have been recast.
(3) Beginning in Q1'25, Adjusted EBITDA (non-GAAP) is presented net of digital assets gains and losses and all prior periods have been adjusted.
25
Visuals: Three clustered column charts with no chart titles beyond their axis or legend labels. Chart 1: Vehicle Deliveries (millions of units), single blue series, y-axis 0.0 to 2.0 in steps of 0.2, x-axis 1Q-2023 to 4Q-2025; values are not printed, so about 1Q-2023 1.42, 2Q-2023 1.63, 3Q-2023 1.72, 4Q-2023 1.80, 1Q-2024 1.77, 2Q-2024 1.74, 3Q-2024 1.77, 4Q-2024 1.79, 1Q-2025 1.73, 2Q-2025 1.68, 3Q-2025 1.71, 4Q-2025 1.63. Chart 2: y-axis 0 to 18 in steps of 2, no unit label on axis; blue series Operating Cash Flow ($B) with about values 13.2, 13.9, 12.1, 13.2, 11.0, 11.5, 14.4, 14.9, 16.8, 15.7, 15.6, 14.7; red series Free Cash Flow ($B) with about values 5.8, 6.1, 3.7, 4.3, 1.4, 1.7, 3.6, 3.6, 6.7, 5.5, 6.8, 6.2; legend below the chart with blue and red squares. Chart 3: y-axis 0 to 20 in steps of 2; blue series Net Income ($B) with about values 11.7, 12.1, 10.7, 14.9, 13.8, 12.5, 12.9, 7.1, 6.1, 5.9, 5.0, 3.7; red series Adjusted EBITDA ($B) with about values 18.6, 19.3, 18.1, 16.6, 15.8, 14.8, 15.7, 16.0, 15.5, 15.2, 14.7, 14.6; legend below with blue and red squares. No highlighted points. Bars are vertical, grouped in pairs per quarter in charts 2 and 3, single bar per quarter in chart 1; bars show a slight vertical shading gradient, darker at their edges. Horizontal light grey gridlines at each y-axis tick.
Slides 26 to 35 continue in the full text file.
Download this deck
The hosted PDF of every library deck is free for readers of the SlideDeck Co newsletter. Join with your email and the viewer and download appear here.
Preparing a results presentation or business update of your own? The SlideDeck Co Standard Deck is a slide library for business reviews, updates and plans.







