

The deck opens with a summary of Q4 and full-year 2024 highlights covering profitability, cash and operations, followed by a single-page-per-topic financial summary of revenue, margins, EBITDA and cash flow. It then moves through operational data on production, deliveries, storage and Supercharger growth, vehicle capacity by region, and core technology updates on FSD, AI compute and battery work. Other highlights cover Energy and Services, followed by a forward-looking outlook on volume, cash, profit and products. Photo and product pages on Cybertruck, the new Model Y, Semi, Megafactory Shanghai and the lithium refinery come next, then detailed key metrics charts and full financial statements, reconciliations and a closing page of definitions and forward-looking statement disclaimers. Several slides are worth studying: the highlights summary uses short bold-labelled blocks of text, the financial summary tables use a consistent layout across quarterly and annual views, and the vehicle capacity slide pairs a plain table with a regional market share chart.
Slides worth studying
Questions about this deck
What does the Tesla deck say about installed annual vehicle capacity at the Shanghai factory?
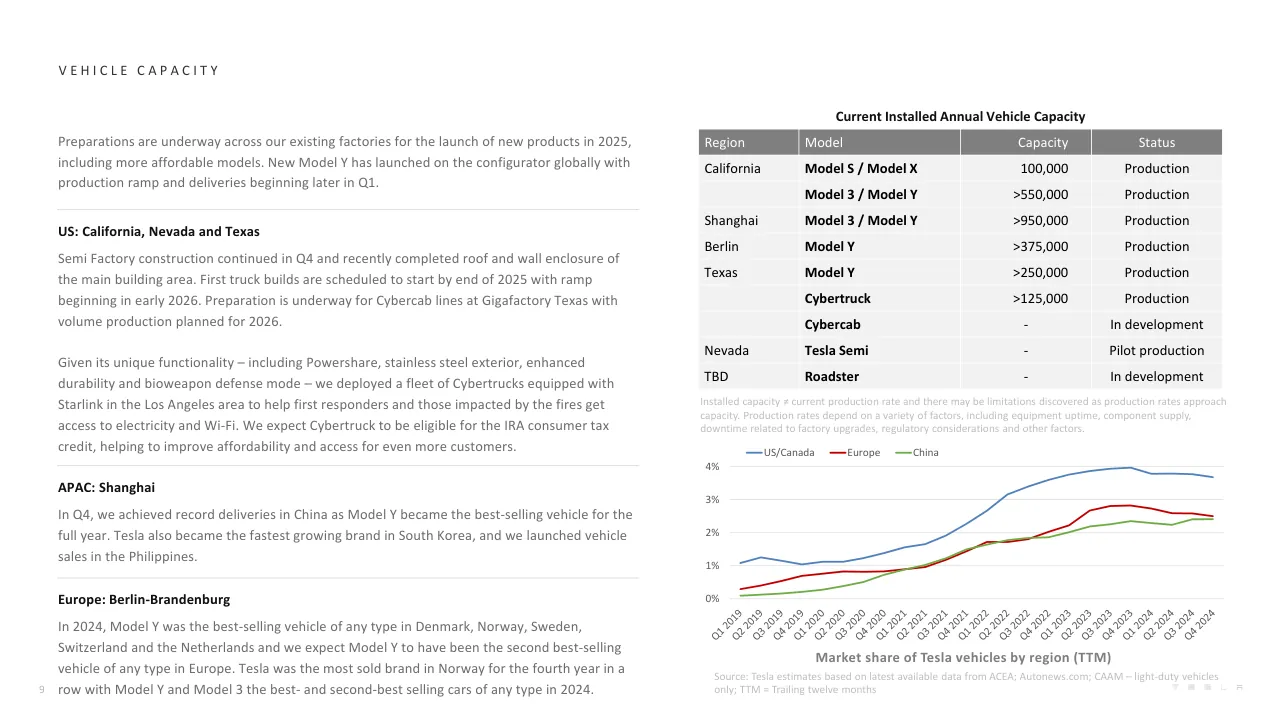
Slide 9 lists Shanghai capacity for Model 3 and Model Y as >950,000 vehicles per year, with status Production. The slide adds that installed capacity is not the same as the current production rate.
What was Tesla's total revenue in Q4 2024 according to the deck?
Slide 4 reports total revenues of 25,707 ($ in millions) for Q4-2024. Slide 6 states that total revenue increased 2% YoY in Q4 to $25.7B.
How many slides does the Tesla Q4 and FY 2024 deck have and how is it structured?
The deck has 36 slides. Slide 2 is the agenda, listing Highlights (slide 3), Financial Summary (slide 4), Operational Summary (slide 7), Vehicle Capacity (slide 9), Outlook (slide 12), Key Metrics (slide 26) and Financial Statements (slide 28).
What does Tesla's outlook in the deck say about energy storage deployments in 2025?
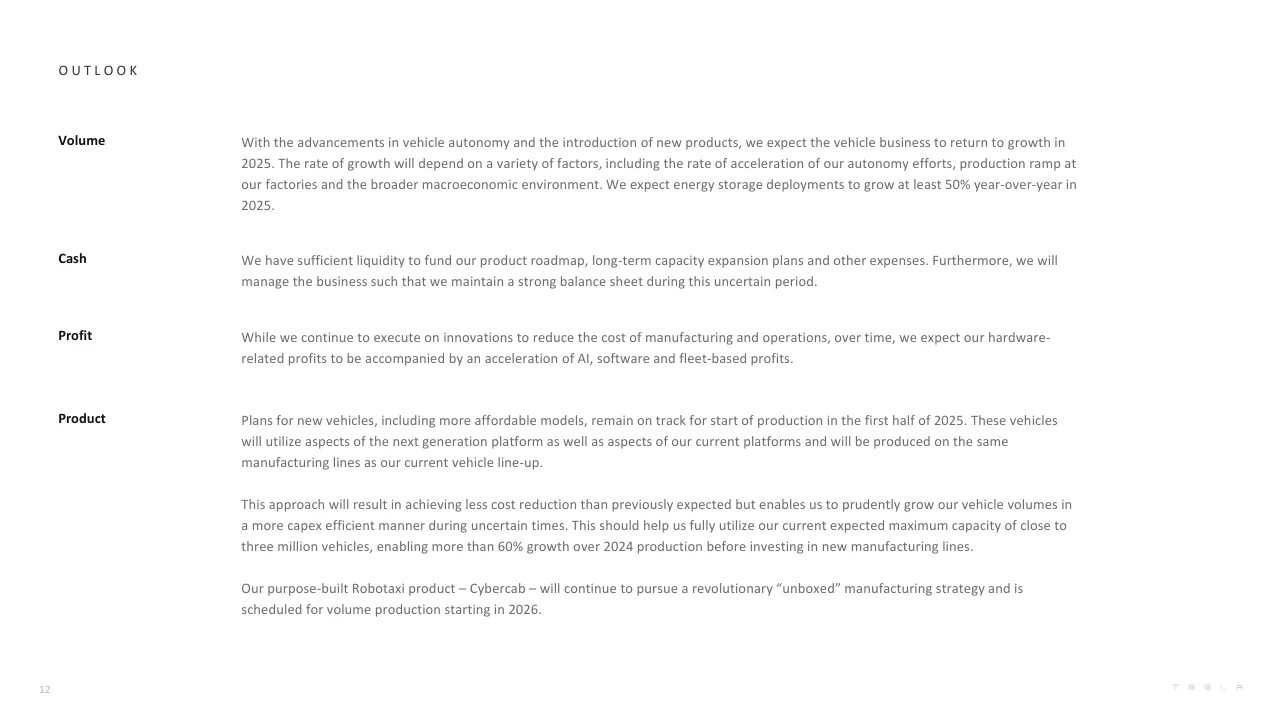
Slide 12 says Tesla expects energy storage deployments to grow at least 50% year-over-year in 2025.
Details
- Company: Tesla
- Year: 2024
- Type: Investor presentation
- Industry: Automotive
- Pages: 36
More from Tesla
- Tesla investor presentation, 2026
- Tesla investor presentation, 2025
- Tesla investor presentation, Q4 2023 update
- Tesla investor presentation, 2024 annual shareholder meeting
- Tesla investor presentation, Q4 2022 update
- Tesla investor presentation, Investor Day 2023
All Tesla decks in the library
Review score: 6 out of 10, Needs substantial work
Presentation quality, judged with the SlideDeck Co review heuristic. Ask, evidence and idea merit are not rated here.
This is an investor reference document that reads as a disclosure pack more than a presentation. Its routing is clear: slide 2 lists the sections with page numbers, and the financial tables on slides 4 to 8 are consistently laid out with the latest column shaded. But most slides carry no message headline, only a topic label. Slides 3, 6, 9, 10, 11 and 12 are dense paragraph pages in small grey type, and slides 4, 5, 7 and 8 are small-type tables with no takeaway marked beyond the shaded column. Slide 14 is the one chart with a real claim title and an emphasized final bar, and the photo pages 16 to 25 are strong but make no argument. The truncated y-axis on slide 14 exaggerates the drop, and the core story is recoverable only with effort.
Worth keeping: Keep the consistent shaded latest-period column across the financial tables, the clear agenda on slide 2, the claim-led title and red highlight bar on slide 14, and the large, well-composed photo pages.
Most useful repair: Rewrite slide titles as takeaways, break the paragraph-heavy slides 3, 9, 10, 11 and 12 into fewer, larger points with the key numbers pulled out, and raise the table and chart text size on slides 4 to 8 and 26 to 27.
What would change the score: Trim the text and chart density on slides 9 to 11, add labels or takeaways to the unlabelled multi-chart slides 26 and 27, and give each photo page a one-line caption that states why it matters.
Confidence medium. 36 of 36 pages inspected on contact sheets, 4 at readable size. Reviewed 2026-11-08. Model-assisted review (claude-sonnet-5-5).
Full text of the slides (36 slides)
Every slide's words and a description of its charts and images, so the deck can be searched and rebuilt. Also available as Markdown.
Slide 1
Q4 and FY 2024 Update
Visuals: One logo: the Tesla wordmark in widely letter-spaced, thin, custom-drawn capitals, placed in the bottom-right corner in about #F2F2F2. No photographs, charts, tables or other illustrations.
Slide 2
Highlights
03
Financial Summary
04
Operational Summary
07
Vehicle Capacity
09
Core Technology
10
Other Highlights
11
Outlook
12
Photos & Charts
13
Key Metrics
26
Financial Statements
28
Additional Information
35
2
Visuals: Tesla wordmark logo at bottom right: the stylised letters T, E, S, L, A widely letterspaced in thin light-grey strokes, small and flat. No photographs, charts, diagrams or other graphics.
Slide 3
HIGHLIGHTS
SUMMARY
Profitability
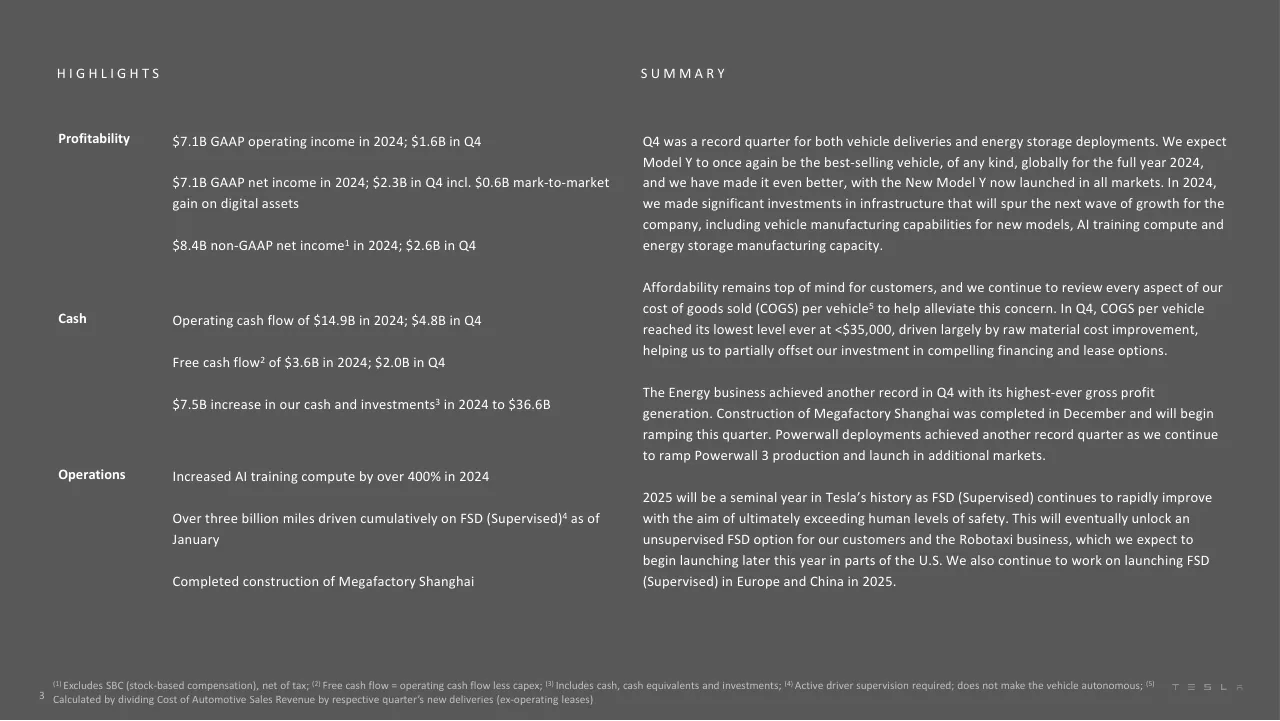
$7.1B GAAP operating income in 2024; $1.6B in Q4
Q4 was a record quarter for both vehicle deliveries and energy storage deployments. We expect
Model Y to once again be the best-selling vehicle, of any kind, globally for the full year 2024,
and we have made it even better, with the New Model Y now launched in all markets. In 2024,
we made significant investments in infrastructure that will spur the next wave of growth for the
company, including vehicle manufacturing capabilities for new models, AI training compute and
$7.1B GAAP net income in 2024; $2.3B in Q4 incl. $0.6B mark-to-market
gain on digital assets
energy storage manufacturing capacity.
$8.4B non-GAAP net income¹ in 2024; $2.6B in Q4
Affordability remains top of mind for customers, and we continue to review every aspect of our
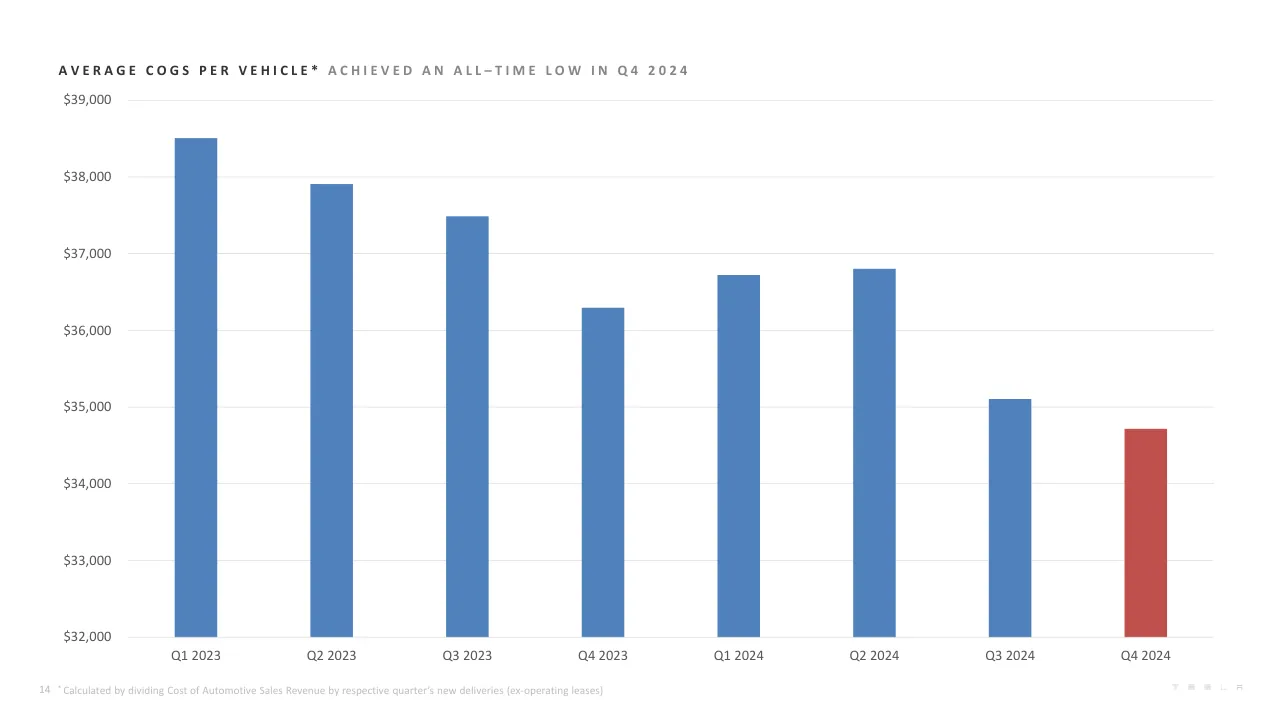
cost of goods sold (COGS) per vehicle⁵ to help alleviate this concern. In Q4, COGS per vehicle
reached its lowest level ever at <$35,000, driven largely by raw material cost improvement,
helping us to partially offset our investment in compelling financing and lease options.
Cash
Operating cash flow of $14.9B in 2024; $4.8B in Q4
Free cash flow² of $3.6B in 2024; $2.0B in Q4
$7.5B increase in our cash and investments³ in 2024 to $36.6B
The Energy business achieved another record in Q4 with its highest-ever gross profit
generation. Construction of Megafactory Shanghai was completed in December and will begin
ramping this quarter. Powerwall deployments achieved another record quarter as we continue
to ramp Powerwall 3 production and launch in additional markets.
Operations
Increased AI training compute by over 400% in 2024
2025 will be a seminal year in Tesla’s history as FSD (Supervised) continues to rapidly improve
with the aim of ultimately exceeding human levels of safety. This will eventually unlock an
Over three billion miles driven cumulatively on FSD (Supervised)⁴ as of
January
unsupervised FSD option for our customers and the Robotaxi business, which we expect to
begin launching later this year in parts of the U.S. We also continue to work on launching FSD
Completed construction of Megafactory Shanghai
(Supervised) in Europe and China in 2025.
3
(1) Excludes SBC (stock-based compensation), net of tax; (2) Free cash flow = operating cash flow less capex; (3) Includes cash, cash equivalents and investments; (4) Active driver supervision required; does not make the vehicle autonomous; (5)
Calculated by dividing Cost of Automotive Sales Revenue by respective quarter’s new deliveries (ex-operating leases)
Visuals: none. The only non-text mark is a small grey TESLA wordmark in the footer at bottom-right, drawn as widely letter-spaced grey capitals (about #8C8C8C) with no box or fill.
Slide 4
FINANCIAL SUMMARY
(Unaudited)
($ in millions, except percentages and per share data) Q4-2023 Q1-2024 Q2-2024 Q3-2024 Q4-2024 YoY
Total automotive revenues 21,563 17,378 19,878 20,016 19,798 -8%
Energy generation and storage revenue 1,438 1,635 3,014 2,376 3,061 113%
Services and other revenue 2,166 2,288 2,608 2,790 2,848 31%
Total revenues 25,167 21,301 25,500 25,182 25,707 2%
Total gross profit 4,438 3,696 4,578 4,997 4,179 -6%
Total GAAP gross margin 17.6% 17.4% 18.0% 19.8% 16.3% -138 bp
Operating expenses 2,374 2,525 2,973 2,280 2,596 9%
Income from operations 2,064 1,171 1,605 2,717 1,583 -23%
Operating margin 8.2% 5.5% 6.3% 10.8% 6.2% -204 bp
Adjusted EBITDA 3,953 3,384 3,674 4,665 4,922 25%
Adjusted EBITDA margin 15.7% 15.9% 14.4% 18.5% 19.1% 344 bp
Net income attributable to common stockholders (GAAP) 7,928 1,129 1,478 2,167 2,317 -71%
Net income attributable to common stockholders (non-GAAP) 2,485 1,536 1,812 2,505 2,566 3%
EPS attributable to common stockholders, diluted (GAAP) 2.27 0.34 0.42 0.62 0.66 -71%
EPS attributable to common stockholders, diluted (non-GAAP) 0.71 0.45 0.52 0.72 0.73 3%
Net cash provided by operating activities 4,370 242 3,612 6,255 4,814 10%
Capital expenditures (2,306) (2,773) (2,270) (3,513) (2,783) 21%
Free cash flow 2,064 (2,531) 1,342 2,742 2,031 -2%
Cash, cash equivalents and investments 29,094 26,863 30,720 33,648 36,563 26%
4
TESLA
Visuals: Table with 7 columns and 20 data rows. Columns: row label (left, text column x 4.6% to 43.2%), Q4-2023, Q1-2024, Q2-2024, Q3-2024, Q4-2024 (values right-aligned), YoY (right-aligned). Header row: ($ in millions, except percentages and per share data) | Q4-2023 | Q1-2024 | Q2-2024 | Q3-2024 | Q4-2024 | YoY. Rows: Total automotive revenues 21,563 | 17,378 | 19,878 | 20,016 | 19,798 | -8%. Energy generation and storage revenue 1,438 | 1,635 | 3,014 | 2,376 | 3,061 | 113%. Services and other revenue 2,166 | 2,288 | 2,608 | 2,790 | 2,848 | 31%. (blank spacer row). Total revenues 25,167 | 21,301 | 25,500 | 25,182 | 25,707 | 2%. Total gross profit 4,438 | 3,696 | 4,578 | 4,997 | 4,179 | -6%. Total GAAP gross margin 17.6% | 17.4% | 18.0% | 19.8% | 16.3% | -138 bp. (blank). Operating expenses 2,374 | 2,525 | 2,973 | 2,280 | 2,596 | 9%. Income from operations 2,064 | 1,171 | 1,605 | 2,717 | 1,583 | -23%. Operating margin 8.2% | 5.5% | 6.3% | 10.8% | 6.2% | -204 bp. (blank). Adjusted EBITDA 3,953 | 3,384 | 3,674 | 4,665 | 4,922 | 25%. Adjusted EBITDA margin 15.7% | 15.9% | 14.4% | 18.5% | 19.1% | 344 bp. (blank). Net income attributable to common stockholders (GAAP) 7,928 | 1,129 | 1,478 | 2,167 | 2,317 | -71%. Net income attributable to common stockholders (non-GAAP) 2,485 | 1,536 | 1,812 | 2,505 | 2,566 | 3%. (blank). EPS attributable to common stockholders, diluted (GAAP) 2.27 | 0.34 | 0.42 | 0.62 | 0.66 | -71%. EPS attributable to common stockholders, diluted (non-GAAP) 0.71 | 0.45 | 0.52 | 0.72 | 0.73 | 3%. (blank). Net cash provided by operating activities 4,370 | 242 | 3,612 | 6,255 | 4,814 | 10%. Capital expenditures (2,306) | (2,773) | (2,270) | (3,513) | (2,783) | 21%. Free cash flow 2,064 | (2,531) | 1,342 | 2,742 | 2,031 | -2%. Cash, cash equivalents and investments 29,094 | 26,863 | 30,720 | 33,648 | 36,563 | 26%. Negative values are shown in parentheses. No chart or photograph is present.
Slide 5
F I N A N C I A L S U M M A R Y
(Unaudited)
($ in millions, except percentages and per share data) 2020 2021 2022 2023 2024 YoY
Total automotive revenues 27,236 47,232 71,462 82,419 77,070 -6%
Energy generation and storage revenue 1,994 2,789 3,909 6,035 10,086 67%
Services and other revenue 2,306 3,802 6,091 8,319 10,534 27%
Total revenues 31,536 53,823 81,462 96,773 97,690 1%
Total gross profit 6,630 13,606 20,853 17,660 17,450 -1%
Total GAAP gross margin 21.0% 25.3% 25.6% 18.2% 17.9% -39 bp
Operating expenses 4,636 7,083 7,197 8,769 10,374 18%
Income from operations 1,994 6,523 13,656 8,891 7,076 -20%
Operating margin 6.3% 12.1% 16.8% 9.2% 7.2% -194 bp
Adjusted EBITDA 5,817 11,621 19,186 16,631 16,645 0%
Adjusted EBITDA margin 18.4% 21.6% 23.6% 17.2% 17.0% -15 bp
Net income attributable to common stockholders (GAAP) 721 5,519 12,556 14,997 7,091 -53%
Net income attributable to common stockholders (non-GAAP) 2,455 7,640 14,116 10,882 8,419 -23%
EPS attributable to common stockholders, diluted (GAAP) 0.21 1.63 3.62 4.30 2.04 -53%
EPS attributable to common stockholders, diluted (non-GAAP) 0.75 2.26 4.07 3.12 2.42 -22%
Net cash provided by operating activities 5,943 11,497 14,724 13,256 14,923 13%
Capital expenditures (3,157) (6,482) (7,158) (8,898) (11,339) 27%
Free cash flow 2,786 5,015 7,566 4,358 3,584 -18%
Cash, cash equivalents and investments 19,384 17,707 22,185 29,094 36,563 26%
5
Visuals: One table, no chart or photograph. Columns: row label (about 4.6% to 43.2% of width, left-aligned), 2020, 2021, 2022, 2023, 2024 (each right-aligned numbers), YoY (right-aligned). Header row: grey #7F7F7F fill with white text reading ($ in millions, except percentages and per share data) and the year labels. Rows (label then values 2020, 2021, 2022, 2023, 2024, YoY): Total automotive revenues 27,236 / 47,232 / 71,462 / 82,419 / 77,070 / -6%. Energy generation and storage revenue 1,994 / 2,789 / 3,909 / 6,035 / 10,086 / 67%. Services and other revenue 2,306 / 3,802 / 6,091 / 8,319 / 10,534 / 27%. (blank spacer row). Total revenues 31,536 / 53,823 / 81,462 / 96,773 / 97,690 / 1%. Total gross profit 6,630 / 13,606 / 20,853 / 17,660 / 17,450 / -1%. Total GAAP gross margin 21.0% / 25.3% / 25.6% / 18.2% / 17.9% / -39 bp. (blank spacer). Operating expenses 4,636 / 7,083 / 7,197 / 8,769 / 10,374 / 18%. Income from operations 1,994 / 6,523 / 13,656 / 8,891 / 7,076 / -20%. Operating margin 6.3% / 12.1% / 16.8% / 9.2% / 7.2% / -194 bp. (blank spacer). Adjusted EBITDA 5,817 / 11,621 / 19,186 / 16,631 / 16,645 / 0%. Adjusted EBITDA margin 18.4% / 21.6% / 23.6% / 17.2% / 17.0% / -15 bp. (blank spacer). Net income attributable to common stockholders (GAAP) 721 / 5,519 / 12,556 / 14,997 / 7,091 / -53%. Net income attributable to common stockholders (non-GAAP) 2,455 / 7,640 / 14,116 / 10,882 / 8,419 / -23%. (blank spacer). EPS attributable to common stockholders, diluted (GAAP) 0.21 / 1.63 / 3.62 / 4.30 / 2.04 / -53%. EPS attributable to common stockholders, diluted (non-GAAP) 0.75 / 2.26 / 4.07 / 3.12 / 2.42 / -22%. (blank spacer). Net cash provided by operating activities 5,943 / 11,497 / 14,724 / 13,256 / 14,923 / 13%. Capital expenditures (3,157) / (6,482) / (7,158) / (8,898) / (11,339) / 27%. Free cash flow 2,786 / 5,015 / 7,566 / 4,358 / 3,584 / -18%. Cash, cash equivalents and investments 19,384 / 17,707 / 22,185 / 29,094 / 36,563 / 26%. Highlighted column: the 2024 column cells carry a light pink fill (about #F2D7D9) on every data row. Alternating row bands are light grey #F2F2F2 with white rows between them. No chart, photograph, logo or diagram other than the faint wordmark described in elements.
Slide 6
FINANCIAL SUMMARY
Revenue
Total revenue increased 2% YoY in Q4 to $25.7B. YoY, revenue was impacted by the following items:
+ growth in Energy Generation and Storage and Services and Other
+ growth in vehicle deliveries
+ higher regulatory credit revenue
- reduced S3XY vehicle average selling price (ASP) (excl. FX impact1), due to pricing, attractive financing options and mix
Profitability
Our operating income decreased 23% YoY to $1.6B in Q4, resulting in a 6.2% operating margin. YoY, operating income was primarily
impacted by the following items:
- reduced S3XY vehicle ASP
- increase in operating expenses driven by AI and other R&D projects
+ growth in Energy Generation and Storage and Services and Other gross profit
+ lower cost per vehicle, including lower raw material costs partially offset by lower fixed cost absorption from production decrease YoY
+ higher regulatory credit revenue
Cash
Quarter-end cash, cash equivalents and investments in Q4 was $36.6B. The sequential increase of $2.9B was primarily the result of positive
free cash flow of $2.0B.
6
(1) Impact is calculated on a constant currency basis. Actuals are compared against current results converted into USD using average exchange rates from Q4’23.
Slide 7
OPERATIONAL SUMMARY
(Unaudited)
Q4-2023 | Q1-2024 | Q2-2024 | Q3-2024 | Q4-2024 | YoY
Model 3/Y production | 476,777 | 412,376 | 386,576 | 443,668 | 436,718 | -8%
Other models production | 18,212 | 20,995 | 24,255 | 26,128 | 22,727 | 25%
Total production | 494,989 | 433,371 | 410,831 | 469,796 | 459,445 | -7%
Model 3/Y deliveries | 461,538 | 369,783 | 422,405 | 439,975 | 471,930 | 2%
Other models deliveries | 22,969 | 17,027 | 21,551 | 22,915 | 23,640 | 3%
Total deliveries | 484,507 | 386,810 | 443,956 | 462,890 | 495,570 | 2%
of which subject to operating lease accounting | 10,563 | 8,365 | 10,227 | 14,449 | 26,962 | 155%
Total end of quarter operating lease vehicle count | 176,564 | 173,131 | 171,353 | 168,867 | 180,523 | 2%
Global vehicle inventory (days of supply)(1) | 15 | 28 | 18 | 19 | 12 | -20%
Storage deployed (GWh) | 3.2 | 4.1 | 9.4 | 6.9 | 11.0 | 244%
Tesla locations | 1,208 | 1,258 | 1,286 | 1,306 | 1,359 | 13%
Mobile service fleet | 1,909 | 1,897 | 1,896 | 1,933 | 1,895 | -1%
Supercharger stations | 5,952 | 6,249 | 6,473 | 6,706 | 6,975 | 17%
Supercharger connectors | 54,892 | 57,579 | 59,596 | 62,421 | 65,495 | 19%
7
(1) Days of supply is calculated by dividing new vehicle ending inventory by the relevant quarter’s deliveries and using 75 trading days (aligned with Automotive News definition).
TESLA
Visuals: Table. Columns: row label; Q4-2023; Q1-2024; Q2-2024; Q3-2024; Q4-2024 (highlighted in light pink); YoY. Header row: grey #7F7F7F fill with white centred column labels. Rows, in order: (1) Model 3/Y production: 476,777; 412,376; 386,576; 443,668; 436,718; -8%. (2) Other models production: 18,212; 20,995; 24,255; 26,128; 22,727; 25%. (3) Total production (bold): 494,989; 433,371; 410,831; 469,796; 459,445; -7%. Gap row. (4) Model 3/Y deliveries: 461,538; 369,783; 422,405; 439,975; 471,930; 2%. (5) Other models deliveries: 22,969; 17,027; 21,551; 22,915; 23,640; 3%. (6) Total deliveries (bold): 484,507; 386,810; 443,956; 462,890; 495,570; 2%. (7) indented 'of which subject to operating lease accounting': 10,563; 8,365; 10,227; 14,449; 26,962; 155%. Gap row. (8) Total end of quarter operating lease vehicle count: 176,564; 173,131; 171,353; 168,867; 180,523; 2%. (9) Global vehicle inventory (days of supply)(1): 15; 28; 18; 19; 12; -20%. Gap row. (10) Storage deployed (GWh): 3.2; 4.1; 9.4; 6.9; 11.0; 244%. Gap row. (11) Tesla locations: 1,208; 1,258; 1,286; 1,306; 1,359; 13%. (12) Mobile service fleet: 1,909; 1,897; 1,896; 1,933; 1,895; -1%. Gap row. (13) Supercharger stations: 5,952; 6,249; 6,473; 6,706; 6,975; 17%. (14) Supercharger connectors: 54,892; 57,579; 59,596; 62,421; 65,495; 19%. Rows alternate between #F2F2F2 and white bands, except the Q4-2024 column, which is filled light pink on every row. No chart, photograph or icon. Only the faint wordmark at bottom right is a non-text mark.
Slide 8
OPERATIONAL SUMMARY
(Unaudited)
2020 / 2021 / 2022 / 2023 / 2024 / YoY
Model 3/Y production 454,932 906,032 1,298,434 1,775,159 1,679,338 -5%
Other models production 54,805 24,390 71,177 70,826 94,105 33%
Total production 509,737 930,422 1,369,611 1,845,985 1,773,443 -4%
Model 3/Y deliveries 442,562 911,242 1,247,146 1,739,707 1,704,093 -2%
Other models deliveries 57,085 24,980 66,705 68,874 85,133 24%
Total deliveries 499,647 936,222 1,313,851 1,808,581 1,789,226 -1%
of which subject to operating lease accounting 34,470 60,912 47,582 72,226 60,003 -17%
Total end of quarter operating lease vehicle count 72,089 120,342 140,667 176,564 180,523 2%
Global vehicle inventory (days of supply)(1) 15 6 16 16 13 -19%
Storage deployed (GWh) 3.0 4.0 6.5 14.7 31.4 114%
Tesla locations 523 644 963 1,208 1,359 13%
Mobile service fleet 894 1,281 1,584 1,909 1,895 -1%
Supercharger stations 2,564 3,476 4,678 5,952 6,975 17%
Supercharger connectors 23,277 31,498 42,419 54,892 65,495 19%
8
(1) Days of supply is calculated by dividing new vehicle ending inventory by the relevant year’s deliveries and using 300 trading days (aligned with Automotive News definition).
Visuals: A single table with 6 numeric columns (2020, 2021, 2022, 2023, 2024, YoY) and a row-label column. Header row: blank label cell, then 2020 / 2021 / 2022 / 2023 / 2024 / YoY, white text on mid grey #7F7F7F. Body rows, top to bottom: Model 3/Y production (454,932 / 906,032 / 1,298,434 / 1,775,159 / 1,679,338 / -5%); Other models production (54,805 / 24,390 / 71,177 / 70,826 / 94,105 / 33%); Total production in bold (509,737 / 930,422 / 1,369,611 / 1,845,985 / 1,773,443 / -4%); blank gap; Model 3/Y deliveries (442,562 / 911,242 / 1,247,146 / 1,739,707 / 1,704,093 / -2%); Other models deliveries (57,085 / 24,980 / 66,705 / 68,874 / 85,133 / 24%); Total deliveries in bold (499,647 / 936,222 / 1,313,851 / 1,808,581 / 1,789,226 / -1%); of which subject to operating lease accounting, indented (34,470 / 60,912 / 47,582 / 72,226 / 60,003 / -17%); blank gap; Total end of quarter operating lease vehicle count (72,089 / 120,342 / 140,667 / 176,564 / 180,523 / 2%); Global vehicle inventory (days of supply)(1) (15 / 6 / 16 / 16 / 13 / -19%); blank gap; Storage deployed (GWh) (3.0 / 4.0 / 6.5 / 14.7 / 31.4 / 114%); blank gap; Tesla locations (523 / 644 / 963 / 1,208 / 1,359 / 13%); Mobile service fleet (894 / 1,281 / 1,584 / 1,909 / 1,895 / -1%); blank gap; Supercharger stations (2,564 / 3,476 / 4,678 / 5,952 / 6,975 / 17%); Supercharger connectors (23,277 / 31,498 / 42,419 / 54,892 / 65,495 / 19%). The 2024 column cells are highlighted in a pale rose tint. Rows alternate between light grey and white bands. No chart, photograph or logo is present except the faint wordmark in the footer.
Slide 9
VEHICLE CAPACITY
Preparations are underway across our existing factories for the launch of new products in 2025,
including more affordable models. New Model Y has launched on the configurator globally with
production ramp and deliveries beginning later in Q1.
US: California, Nevada and Texas
Semi Factory construction continued in Q4 and recently completed roof and wall enclosure of
the main building area. First truck builds are scheduled to start by end of 2025 with ramp
beginning in early 2026. Preparation is underway for Cybercab lines at Gigafactory Texas with
volume production planned for 2026.
Given its unique functionality – including Powershare, stainless steel exterior, enhanced
durability and bioweapon defense mode – we deployed a fleet of Cybertrucks equipped with
Starlink in the Los Angeles area to help first responders and those impacted by the fires get
access to electricity and Wi-Fi. We expect Cybertruck to be eligible for the IRA consumer tax
credit, helping to improve affordability and access for even more customers.
APAC: Shanghai
In Q4, we achieved record deliveries in China as Model Y became the best-selling vehicle for the
full year. Tesla also became the fastest growing brand in South Korea, and we launched vehicle
sales in the Philippines.
Europe: Berlin-Brandenburg
In 2024, Model Y was the best-selling vehicle of any type in Denmark, Norway, Sweden,
Switzerland and the Netherlands and we expect Model Y to have been the second best-selling
vehicle of any type in Europe. Tesla was the most sold brand in Norway for the fourth year in a
row with Model Y and Model 3 the best- and second-best selling cars of any type in 2024.
Current Installed Annual Vehicle Capacity
Region / Model / Capacity / Status
California / Model S / Model X / 100,000 / Production
/ Model 3 / Model Y / >550,000 / Production
Shanghai / Model 3 / Model Y / >950,000 / Production
Berlin / Model Y / >375,000 / Production
Texas / Model Y / >250,000 / Production
/ Cybertruck / >125,000 / Production
/ Cybercab / - / In development
Nevada / Tesla Semi / - / Pilot production
TBD / Roadster / - / In development
Installed capacity ≠ current production rate and there may be limitations discovered as production rates approach
capacity. Production rates depend on a variety of factors, including equipment uptime, component supply,
downtime related to factory upgrades, regulatory considerations and other factors.
US/Canada Europe China
4%
3%
2%
1%
0%
Market share of Tesla vehicles by region (TTM)
Source: Tesla estimates based on latest available data from ACEA; Autonews.com; CAAM – light-duty vehicles
only; TTM = Trailing twelve months
9
Visuals: Table: titled 'Current Installed Annual Vehicle Capacity' (bold, centred above the table at about y 15.2%). Columns: Region, Model, Capacity, Status. Header row (grey #7F7F7F with white text) and 9 body rows (fill #F2F2F2). Rows in order: California | Model S / Model X | 100,000 | Production; (blank region) | Model 3 / Model Y | >550,000 | Production; Shanghai | Model 3 / Model Y | >950,000 | Production; Berlin | Model Y | >375,000 | Production; Texas | Model Y | >250,000 | Production; (blank) | Cybertruck | >125,000 | Production; (blank) | Cybercab | - | In development; Nevada | Tesla Semi | - | Pilot production; TBD | Roadster | - | In development. Model names bold, capacity right-aligned, status centred, region left-aligned. Chart: line chart titled 'Market share of Tesla vehicles by region (TTM)', placed below the table at about x 54.7% to 95.5%, y 62% to 90%. Legend at top-left of plot: US/Canada (blue line), Europe (red line), China (green line). Y axis: market share in percent, 0% to 4%, gridline and tick every 1% (labels 0%, 1%, 2%, 3%, 4%). X axis: 24 quarterly categories Q1 2019 to Q4 2024, labels rotated about 45 degrees. No values printed on the chart; estimated values (about): US/Canada rises from about 1.1% (Q1 2019) to a peak of about 3.95% (Q4 2023) and ends near 3.7% (Q4 2024); Europe starts about 0.3% (Q1 2019), reaches about 2.8% (Q3 2023) and ends about 2.5% (Q4 2024); China starts about 0.1% (Q1 2019), reaches about 2.4% (Q4 2023 to Q4 2024) and ends about 2.4%. Dips in US/Canada at Q4 2019 (about 1.05%). No highlighted points; lines are about 2 px wide with no markers. Source line below the chart in light grey. Photographs: none. Logos: a faint Tesla wordmark bottom-right.
Slide 10
CORE TECHNOLOGY
Artificial Intelligence Software and Hardware
In Q4, we completed the deployment of Cortex, a ~50k H100 training cluster at Gigafactory
Texas. Cortex helped enable V13 of FSD (Supervised)1, which boasts major improvements in
safety and comfort thanks to 4.2x increase in data, higher resolution video inputs, 2x reduction
in photon-to-control latency and redesigned controller, among other enhancements. FSD
(Supervised) can now start from park and perform unpark, reverse and park capabilities. In Q4,
Tesla vehicles using Autopilot technology drove 5.94 million miles between accidents2 – the best
Q4 ever – compared to the U.S. average of .70 million miles. Progress on Optimus hardware and
software continued in Q4, including the latest generation hand, robust locomotion and training
on additional tasks, ahead of planned pilot production in 2025.
Vehicle and Other Software
The holiday release included Apple Watch support - customers can pair their watch as a key to
unlock and lock their vehicle without ever pressing a button just like the phone key. With a
Premium Connectivity subscription, Dashcam and Sentry Mode clips can be viewed and
downloaded directly from the Tesla mobile app. An animated three-hour precipitation forecast
can be viewed on the map, and SiriusXM is now available to our full lineup with launch as a
native app for Model 3, Model Y and Cybertruck.
Battery, Powertrain and Manufacturing
We processed our first spodumene (lithium-containing concentrate) through the front-end of
the lithium refinery only 18 months after ground-breaking: much faster than any plant we know
of outside of Asia. The intermediate material was on-spec, and we are on track to commission
the plant in 2025. Our in-house 4680 cell hit a production rate exceeding 2.5k Cybertrucks/week.
3.0
2.5
2.0
1.5
1.0
0.5
0.0
Jun-2021
Sep-2021
Dec-2021
Mar-2022
Jun-2022
Sep-2022
Dec-2022
Mar-2023
Jun-2023
Sep-2023
Dec-2023
Mar-2024
Jun-2024
Sep-2024
Dec-2024
FSD Miles on V12 and Beyond
FSD Miles on V11 and Before
Cumulative miles driven with FSD (Supervised) (billions)
6
5
4
3
2
1
0
Q4 2019
Q4 2020
Q4 2021
Q4 2022
Q4 2023
Q4 2024
Tesla vehicles using Autopilot technology
Tesla vehicles not using Autopilot technology
U.S. avg
Million miles driven before an accident occurs
10
(1) Active driver supervision required; does not make the vehicle autonomous
(2) For more information, see our Vehicle Safety Report
Visuals: Two charts. (1) Stacked area chart titled 'Cumulative miles driven with FSD (Supervised) (billions)' (bold grey caption below the chart). X axis: quarterly date labels Jun-2021 to Dec-2024 at 3-month steps, rotated about 45 degrees. Y axis: 0.0 to 3.0 in steps of 0.5, unitless label, units in billions per caption. Series 1 'FSD Miles on V11 and Before' is a blue (#4F81BD) area from the baseline; values are about 0.0 at Jun-2021, about 0.1 at Mar-2023, about 0.5 at Sep-2023, about 0.95 from Mar-2024 to Dec-2024. Series 2 'FSD Miles on V12 and Beyond' is a red (#C00000) area stacked on top; values are about 0.3 at Mar-2024, about 1.3 at Jun-2024, about 2.1 at Sep-2024, about 2.9 at Dec-2024. No printed values. Legend at top inside plot: red square 'FSD Miles on V12 and Beyond' and blue square 'FSD Miles on V11 and Before', horizontal, grey text. No highlighted points. (2) Line chart with markers titled 'Million miles driven before an accident occurs' (bold grey caption below). X axis: Q4 2019, Q4 2020, Q4 2021, Q4 2022, Q4 2023, Q4 2024. Y axis: 0 to 6 in steps of 1, unit million miles. Series 'Tesla vehicles using Autopilot technology' red (#C00000) line with diamond markers: about 3.1, 3.75, 4.35, 4.85, 5.4, 5.94 (5.94 printed in text). Series 'Tesla vehicles not using Autopilot technology' blue (#4F81BD) with diamond markers: about 1.5, 1.25, 1.5, 1.4, 1.0, 1.1. Series 'U.S. avg' dark grey (#595959) with diamond markers: about 0.5, 0.55, 0.65, 0.67, 0.67, 0.7 (.70 printed in text for Q4 2024 comparison). Legend below plot in one row: red diamond line 'Tesla vehicles using Autopilot technology', blue diamond line 'Tesla vehicles not using Autopilot technology', grey diamond line 'U.S. avg'. Light grey horizontal gridlines on both charts. Faint wordmark bottom-right is a Tesla logo, very small, light grey.
Slide 11
OTHER HIGHLIGHTS
Our Energy business continued to grow rapidly in 2024 as we expand capacity for both
Megapack and Powerwall to meet demand. Services and Other – a collection of businesses that
support new vehicle sales – achieved its third year in a row of profitability in 2024.
Energy Generation and Storage
The Energy business achieved record deployments for both Powerwall and Megapack at a
combined 11.0 GWh, resulting in a record gross profit in Q4. Material and other costs continued
to come down in Q4 at the Lathrop Megafactory. Both Powerwall and Megapack continue to be
supply constrained as we open new markets and demand for energy storage products continues
to grow. With construction completed, Shanghai Megafactory will begin ramping in Q1.
Services and Other
In Q4, we added over 3k Supercharger stalls to the network and delivered 1.4 TWh of energy.
We unveiled our V4 cabinet, which supports 400V-1,000V vehicle architectures, charges up to
500kW for passenger vehicles and 1.2MW for Tesla Semi and has cutting-edge power electronics
with 3x the power density. We launched Battery Heating at Superchargers, a feature that gets
vehicles with LFP battery packs back on the road up to 4x faster. We also continued to welcome
more OEMs to the North American Supercharger network, including the first NACS native
vehicles. Overall, in 2024, we launched Superchargers in three new countries, added over 10k
new Supercharger stalls, and grew the network by 19% year-over-year, for a total of 65k+
Superchargers worldwide. We delivered 5.2+ TWh, offsetting over 5.5 billion kg of direct CO2
emissions and 2.4 billion liters of gasoline.
Energy and Services and Other gross profit ($M)
Energy Storage deployments (GWh)
11
Visuals: Two vertical bar charts, both single-series, red bars, no legend, no highlighted points. Chart 1: title 'Energy and Services and Other gross profit ($M)' printed beneath the chart; y-axis labelled in $M with gridlines at 1,000, 800, 600, 400, 200, 0, -200, -400, -600, -800, -1,000 (range -1,000 to 1,000); x-axis categories Q1 2018 through Q4 2024 (28 quarters) rotated about 45 degrees; bars are about: Q1 2018 -70, Q2 2018 -70, Q3 2018 -50, Q4 2018 -90, Q1 2019 -180, Q2 2019 -90, Q3 2019 -30, Q4 2019 -40, Q1 2020 -70, Q2 2020 -40, Q3 2020 -30, Q4 2020 -180, Q1 2021 -170, Q2 2021 -10, Q3 2021 -10, Q4 2021 -40, Q1 2022 -70, Q2 2022 150, Q3 2022 170, Q4 2022 250, Q1 2023 300, Q2 2023 440, Q3 2023 510, Q4 2023 370, Q1 2024 480, Q2 2024 900, Q3 2024 970, Q4 2024 890 (all values estimated, marked about, as the slide prints no bar values). Chart 2: title 'Energy Storage deployments (GWh)' printed beneath; y-axis 0 to 12 GWh, unit labels 0 to 12 at intervals of 1; x-axis categories Q1 2018 through Q4 2024 rotated; bars are about: Q1 2018 0.4, Q2 2018 0.3, Q3 2018 0.3, Q4 2018 0.3, Q1 2019 0.3, Q2 2019 0.5, Q3 2019 0.5, Q4 2019 0.6, Q1 2020 0.3, Q2 2020 0.4, Q3 2020 0.8, Q4 2020 1.6, Q1 2021 0.5, Q2 2021 1.3, Q3 2021 1.3, Q4 2021 1.0, Q1 2022 0.9, Q2 2022 1.1, Q3 2022 2.1, Q4 2022 2.4, Q1 2023 3.9, Q2 2023 3.7, Q3 2023 4.0, Q4 2023 3.2, Q1 2024 4.1, Q2 2024 9.5, Q3 2024 7.0, Q4 2024 about 11.0 (all estimated). No legend. Bars are thin, about one third of category width, with the chart area showing light horizontal gridlines. Photographs and illustrations: none.
Slide 12
OUTLOOK
Volume
With the advancements in vehicle autonomy and the introduction of new products, we expect the vehicle business to return to growth in / 2025. The rate of growth will depend on a variety of factors, including the rate of acceleration of our autonomy efforts, production ramp at / our factories and the broader macroeconomic environment. We expect energy storage deployments to grow at least 50% year-over-year in / 2025.
Cash
We have sufficient liquidity to fund our product roadmap, long-term capacity expansion plans and other expenses. Furthermore, we will / manage the business such that we maintain a strong balance sheet during this uncertain period.
Profit
While we continue to execute on innovations to reduce the cost of manufacturing and operations, over time, we expect our hardware- / related profits to be accompanied by an acceleration of AI, software and fleet-based profits.
Product
Plans for new vehicles, including more affordable models, remain on track for start of production in the first half of 2025. These vehicles / will utilize aspects of the next generation platform as well as aspects of our current platforms and will be produced on the same / manufacturing lines as our current vehicle line-up. / This approach will result in achieving less cost reduction than previously expected but enables us to prudently grow our vehicle volumes in / a more capex efficient manner during uncertain times. This should help us fully utilize our current expected maximum capacity of close to / three million vehicles, enabling more than 60% growth over 2024 production before investing in new manufacturing lines. / Our purpose-built Robotaxi product – Cybercab – will continue to pursue a revolutionary “unboxed” manufacturing strategy and is / scheduled for volume production starting in 2026.
12
Visuals: None apart from a very faint light-grey wordmark in the bottom-right corner, made of widely spaced capitals that appear to read T E S L A, likely a company logo, at about 91% to 97% of the slide width and 93% to 95% of the height. There are no charts, tables, photographs or diagrams.
Slide 13
PHOTOS & CHARTS / T E S L A
Slide 14
AVERAGE COGS PER VEHICLE* ACHIEVED AN ALL–TIME LOW IN Q4 2024 / $39,000 / $38,000 / $37,000 / $36,000 / $35,000 / $34,000 / $33,000 / $32,000 / Q1 2023 / Q2 2023 / Q3 2023 / Q4 2023 / Q1 2024 / Q2 2024 / Q3 2024 / Q4 2024 / 14 / * Calculated by dividing Cost of Automotive Sales Revenue by respective quarter’s new deliveries (ex-operating leases)
Visuals: Vertical bar chart titled 'AVERAGE COGS PER VEHICLE* ACHIEVED AN ALL–TIME LOW IN Q4 2024' (the title is the headline text above the chart). Y-axis: US dollars ($), linear, range $32,000 to $39,000, gridlines every $1,000, labels $39,000, $38,000, $37,000, $36,000, $35,000, $34,000, $33,000, $32,000. X-axis: quarters Q1 2023 through Q4 2024, eight categories, labelled beneath each bar. One series, values printed on the slide: none; estimated values (about): Q1 2023 about $38,500; Q2 2023 about $37,900; Q3 2023 about $37,500; Q4 2023 about $36,300; Q1 2024 about $36,700; Q2 2024 about $36,800; Q3 2024 about $35,100; Q4 2024 about $34,700. Bars are blue #4F81BD for Q1 2023 to Q3 2024 and red #C0504D for Q4 2024, which is highlighted as the all-time low. No legend. Bars are solid rectangles, evenly spaced, with the bottom axis at $32,000 as the baseline. Bar width about 3.3% of slide width.
Slide 15
CYBERTRUCK -
ADVANCEMENTS IN VEHICLE TECHNOLOGY AND ARCHITECTURE
Technology
Description
Use in Future Vehicles
Manufacturing and Design
Stainless Steel Exoskeleton
• Cold-rolled full hard stainless steel exoskeleton carries crash loads and increases torsional stiffness of the body
• Iconic visual design; high dent- and corrosion- resistance reduce concerns over daily wear and tear
Air Bending Manufacturing Process
• First-of-its-kind automated tooling developed by Tesla that can bend full hard stainless steel without touching it
• Enables the use of full hard stainless steel as an A-surface without getting scratched by tooling
Giga-castings
• Our largest castings ever - custom alloy and a 9,000-ton press combine to make front and rear vehicle structures
• Reduces number of parts and manufacturing complexity, and, as a bonus, scrap is fully recyclable
✓
Integrated Audio with Body Structure
• Utilizes the body structure as the reactive volume for dual subwoofers
• Giant sound in extremely dense packaging
✓
Powertrain and Electrical Architecture
48-Volt Electrical Architecture
• 48-volt electrical system reduces current by 4x and heat generated by 16x compared to typical automotive voltage
• Reduction in vehicle harness reduces vehicle weight, increases energy efficiency and simplifies electrical systems
✓
800-Volt Battery System
• Higher voltage powertrain is more energy efficient for high power vehicles such as Cybertruck and Tesla Semi
• Enables smaller cables which reduces cost and mass while also enabling higher power (500kW) charging
✓
Etherloop Communication Architecture
• Gigabit ethernet communication is 1,000x faster than traditional automotive communication standards
• Enables distributed controller architecture which improves redundancy and eliminates 70% of cross-vehicle wires
✓
Bidirectional Charging (Powershare)
• The Cybertruck can provide power to your jobsite, home or other devices (Vehicle-to-Grid or Vehicle-to-Home)
• Turns vehicles into mobile energy storage units with up to 11.5kW of onboard power, enabling hours of work
✓
Ride and Comfort
Custom Laminated Glass
• Novel glass and laminate developed by Tesla for increased comfort and strength
• Improves sound isolation and blocks harmful UV, keeping the cabin cool while maintaining a panoramic view
✓
Adaptive Air Suspension
• Adjusts ride height and damping for different terrains with 12” of adjustment getting up to 16” of ground clearance
• Improves on-road comfort and stability without sacrificing off-road capability
✓
Steer-by-Wire
• Replaces traditional steer shaft with redundant controllers and motors, enabling an adjustable steering ratio for different speeds and driving styles
• Reduces the amount you need to turn the wheel, enabling more agility at low speeds and more stability at high speeds
✓
Rear Wheel Steering
• Leveraging steer-by-wire, enables approximately ten degrees of steering on the rear wheels
• Improves turning radius at low speeds and increases stability at high speeds
15
TESLA
Visuals: A text-and-check table, no photographs or charts. Columns: Section (Manufacturing and Design; Powertrain and Electrical Architecture; Ride and Comfort), Technology (name of each technology), Description (two bullet points per technology, 3 to 4 bullets in one row only where wrapped), Use in Future Vehicles (grey check mark ✓ or blank). Rows in order: Stainless Steel Exoskeleton (blank); Air Bending Manufacturing Process (blank); Giga-castings (check); Integrated Audio with Body Structure (check); 48-Volt Electrical Architecture (check); 800-Volt Battery System (check); Etherloop Communication Architecture (check); Bidirectional Charging (Powershare) (check); Custom Laminated Glass (check); Adaptive Air Suspension (check); Steer-by-Wire (check); Rear Wheel Steering (check). Check marks are all present except the first two rows. Thin dark grey horizontal rules separate rows, a heavier rule separates sections, and thin vertical rules separate the four columns. No highlights.
Slide 16
NEW MODEL Y - THE WORLD’S BEST SELLING VEHICLE IS NOW EVEN BETTER / 16
Visuals: Two photographs of the new Tesla Model Y side by side, each boxed as a sharp-cornered square image. Left image: the car seen from the rear three-quarter view on the right, showing the full-width illuminated red light bar across the tail, a silver-grey body, black roof panel, five-spoke silver alloy wheels and a dark rear bumper; the car is lit from the rear with a red glow on the floor. Right image: the car seen from the front three-quarter view on the left, showing a glowing white light bar across the front, a silver-grey body, dark glass roof and windows, a silver side mirror, five-spoke silver alloy wheels and a Tesla badge on the front fender; lit from the front with a cool white highlight. Both photographs are studio shots on a dark navy-to-black gradient background with a soft blue light beam rising from the upper right; composition is centred on the car with the car occupying the lower-middle of each frame, not cropped, and the floor fades to near-black. Dominant colours: near-black #0A0F1A, navy #1B2A3F, silver-grey #A9AFB7, red accent #C8102E on the left image.
Slide 17
NEW MODEL Y -
THE WORLD’S BEST SELLING VEHICLE IS NOW EVEN BETTER
17
Visuals: Two photographs of the interior of a Tesla New Model Y, shown as rectangular unrounded boxes with no border or overlay. Left photograph: a front-seat view from the driver's side across the dashboard, showing a three-spoke black steering wheel with a Tesla logo on the hub, a centre touchscreen displaying a grey-silver image of the car with small interface icons, a white-grey dashboard trim with a thin red accent line, a white door panel with a black armrest, an overhead console with two white dome lights and a rearview mirror, and a warning label on the headliner; the composition is angled and the lighting is low-key with cool white highlights. Right photograph: a view from the rear seat looking forward, showing two light grey leather front seat backs, a panoramic glass roof, a rearview mirror, a steering wheel in the distance, a dashboard screen displaying a car image, and a rear-seat touchscreen mounted on the centre console showing seat icons; the framing is centred and symmetrical with dark surroundings and cool lighting. Dominant colours are black, charcoal and light grey, with white highlights and a red accent line on the dashboard. Neither photograph is cropped in an unusual way; both are full rectangles.
Slide 18
NEW MODEL Y - THE WORLD’S BEST SELLING VEHICLE IS NOW EVEN BETTER
New Model Y
Model Y
Model Y
New Model Y
Trim
Long Range All-Wheel Drive
LAUNCH SERIES
Long Range All-Wheel Drive
Delivery Timing
Available Now
Available starting March
Starting Price After Est. Savings
$34,490*
$46,490*
Range**
311 miles (EPA est.)
320 miles (est.)
Seating
First row: power recline and heated
Second row: manual fold and heated
First row: power recline, heated and ventilated
Second row: power two-way folding and heated
Displays
15.4″ front-row touchscreen
15.4″ front-row touchscreen
8″ second-row touchscreen
Ride Comfort
First-generation suspension
First-generation noise reduction hardware
Second-generation suspension
Second-generation noise reduction hardware
Cameras
7 exterior cameras
8 exterior cameras (includes new front-facing camera)
Audio
13 speakers, 1 subwoofer
15 speakers, 1 subwoofer
Connectivity
First-generation hardware
Second-generation hardware
Trunk
Power open
Hands-free power open on approach
Interior
Footwell and door pocket ambient lighting
Wooden detailing with black interior
Footwell and door pocket ambient lighting
Wrap-around ambient lighting
Aluminum detailing and premium textiles
Climate
Tinted and laminated safety glass
Power-actuated first-row air vents
Manual second-row air vents
Laminated safety glass on cabin windows and roof
Tinted safety glass with metallic infrared reflective coating across the roof
Power-actuated first- and second-row air vents
18
* Before estimated savings, Model Y Rear-Wheel Drive starts at $46,630 (U.S) and New Model Y Launch Series Long Range All-Wheel Drive starts at $61,630 (U.S.). Prices include Destination and Order Fees, but exclude taxes and other fees. Subject to change. New Model Y Launch Series has
upgrades that will increase the price. Estimated savings includes $6,000 in gas savings estimated over five years and the $7,500 Federal Tax Credit, available to eligible buyers and subject to MSRP caps. Not all vehicles, customers or finance options will be eligible. Terms apply.
** Actual range dependent on trim and wheel size.
Visuals: Two studio photographs of the Tesla Model Y, both shown in three-quarter front view facing left. Top: New Model Y in a metallic dark grey finish, with a dark glass roof and the light bar visible at the nose. Bottom: Model Y in a white finish with a black roof and black wheels. Both cars are isolated on flat light grey panels with soft contact shadows beneath them, lit by diffuse studio light. Neither car is cropped. Each car sits in a boxed grey panel. The right side is a comparison table with 3 columns (row label, Model Y, New Model Y) and 12 data rows as listed in the text. The LAUNCH SERIES wordmark appears in the New Model Y Trim cell. Small faint grey pictograms sit at the bottom right corner and are too small to identify.
Slide 19
SEMI FACTORY - FIRST TRUCK BUILDS SCHEDULED LATER THIS YEAR / 19
Visuals: One photograph, boxed as a full-width rectangle at x 4.5%, y 12.1%, w 91%, h 80.9% (4395 by 2199 pixels), with square corners, no border, no overlay and no tint. Subject: an aerial, slightly oblique view of a very large single-storey factory building with a flat white roof covered in rows of grey roof vents and skylight domes, with a row of dark rectangular windows along the long side and a loading door at the near corner. In the middle distance behind it is a second, similar large white factory with a dark red-brown band at its base, surrounded by parking lots of cars and rows of white trailers. The foreground is bare dirt, with excavators, small trucks, stacks of pipe and a yellow container. Behind are brown, dusty hills and a pale blue sky. Lighting: bright, low-angle sun from the upper left, casting long soft shadows toward the lower right. Dominant colours: white roofs, dusty tan and brown ground and hills, pale blue sky. Composition: the building runs diagonally from upper left to lower right, with the second building at upper centre. Full-frame, not cropped. Also a small faint grey wordmark logo, reading as spaced capital letters, at about x 91%, y 93.9%, w 4.5%, h 1.2%, in light grey #D0D0D0 with low contrast, in the bottom-right corner.
Slide 20
MEGAFACTORY SHANGHAI - WITH GIGAFACTORY SHANGHAI IN THE BACKGROUND
Visuals: One aerial photograph, 3709 by 1864 pixels, in a rectangular box at x 4.5%, y 12.1%, w 91.0%, h 81.3%. Subject: the Tesla Megafactory Shanghai, a long white-roofed factory building covered with rows of solar panels, its black end block carrying the white TESLA wordmark, running diagonally from lower centre to right. Along its left side runs a dark canal with a service road and a row of trees and parked cars. Behind it, toward the top, is the Gigafactory Shanghai, with several large grey and white halls with solar-covered roofs, a blue-roofed building, and a large outdoor car park full of vehicles at the upper left. Bottom-right shows a construction site with cranes and excavators, and a patch of brown earth. Composition: high aerial view, roughly three-quarter angle, the main building crossing the lower half, with the background factories receding to the top. Lighting: flat, bright daylight with soft shadows. Dominant colours: white and light grey roofs, dark green-grey canal water, tan and brown dry grass and earth, with a small patch of green grass at upper right. The photo is not cropped, not full-bleed, and has no overlay or tint.
Slide 21
MEGAFACTORY SHANGHAI - GENERAL ASSEMBLY / 21 / TESLA
Visuals: One photograph. Subject: a row of nine large white-and-grey battery energy storage cabinets (Tesla Megapack-style units) standing side by side on a factory floor, with their front doors open to show orange busbars, black cabling and blue-grey interior panels. Action: a technician in a white hard hat, white jacket, dark trousers and a harness stands at the fifth cabinet from the left, reaching into the open cabinet beside a blue circuit breaker. Foreground left: a large black plastic transport crate with raised square studs on its face. Centre-left: a silver wheeled metal rack holding grey plastic bins with paper labels. Background: exposed silver ducting, steel platforms with red railings, cylindrical silver ventilation hoods and a green exit sign. Composition: eye-level, straight-on, full-width frontal view with the cabinet row spanning most of the frame; the photograph is not cropped and is shown as a full rectangle with no overlay or tint. Lighting: even, bright overhead industrial light with soft shadows on the grey concrete floor. Dominant colours: white #F2F4F5, slate blue-grey #5B6B7A, orange #E8832A, black #1E1E1E, concrete grey #7A7D80. A thin yellow line runs along the bottom edge of the photograph and a yellow-outlined floor mat lies in front of the cabinets. Faint Tesla wordmark at bottom-right in light grey.
Slide 22
TESLA LITHIUM REFINERY - START OF PRODUCTION IN 2025
22
Visuals: One photograph: an aerial view of the Tesla lithium refinery in Texas during the golden hour. The subject is a large industrial site on flat prairie. Near the centre-left, a cluster of white-and-grey steel process structures and pipe racks stands beside several white storage tanks. Upper centre-right, a long white arched hangar-like building runs horizontally. A yellow construction crane rises near the upper centre-left, and a dust plume drifts near the upper centre-right. Lower centre and right are dense rows of parked pickup trucks and cars on gravel, with white modular offices, containers and a white tent-like structure in the middle. Roads run diagonally across the scene, and a dark rectangular pad sits on the right. Composition is a high oblique aerial, full frame, not cropped, with no border, no overlay and no tint. Lighting is low warm sunlight from the upper centre, creating a golden haze and long shadows. Dominant colours are amber and gold sky, tan and brown earth, white structures, and grey gravel. The image is boxed in a plain rectangle.
Slide 23
TESLA LITHIUM TEAM ON SPODUMENE DAY
23
Visuals: One photograph: a wide group portrait of roughly 300 people standing and kneeling on green artificial turf in front of a dark charcoal arch sign reading 'TESLA | LITHIUM' in white letters. Behind the group are lithium refinery structures, steel towers, scaffolding, cranes, tanks and a white metal-roofed building on the right. On the left edge a gold-beige Tesla car is partly visible; on the right edge a white Tesla vehicle with an open rear hatch is visible. Staff wear black shirts printed 'SPODUMENE DAY', orange high-visibility vests, black work uniforms, white chef jackets and red chef hats; two white wrapped packages with red bows stand behind the crowd. Composition is a wide eye-level frame with the group centred and the sign above the heads; the photo is not cropped at the edges and is boxed, not full-bleed, with no overlay or tint. Lighting is natural daylight under a blue sky with white cumulus clouds. Dominant colours: sky blue, white, green turf, charcoal grey, red and orange.
Slide 24
CORTEX ~50K GPU TRAINING CLUSTER
24
Visuals: Photograph of a data-centre aisle. Two long rows of server racks stand on each side and converge toward a vanishing point at centre. Each rack is stacked with rack-mounted GPU server units with black power cables, silver chassis, orange status LEDs and some blue-lit display panels. The floor is a light grey metal grating with a white border strip. The ceiling is a series of translucent white overhead light panels with metal cross-bars. A small white ceiling-mounted camera or sensor dome sits near top centre. Far at the end of the aisle is a bright white doorway or room. Lighting is cool and even, from the ceiling panels and the bright far end. Dominant colours are black, silver-grey, white and orange LED accents with some blue. The photo is boxed, not cropped visibly, full-width, with no overlay or tint. Faint bottom-right marks at about x 91% to 97%, y 94% to 95% are too small and pale to read, possibly a small wordmark or logo in very light grey.
Slide 25
CORTEX ~50K GPU TRAINING CLUSTER
25
Visuals: One photograph, not cropped and not full-bleed, placed as a rectangle inside the margins. Subject: a long aisle inside a data centre filled with tall black server racks. The racks on the right in the foreground are densely populated with server nodes, with red and blue cables and silver liquid-cooling manifolds with brass fittings at the bottom. The rows recede to the left and right, with glass-fronted cabinets and an empty grey-tiled aisle on the left. Overhead, a grey wire-mesh cable tray runs the length of the room with black cables hanging down onto the racks. Composition: eye-level, wide landscape frame, racks in the right two-thirds, the aisle vanishing point near the centre-left. Lighting: even, neutral overhead lighting, no visible shadows dominating. Dominant colours: black and charcoal racks, light grey ceiling and floor tiles, red and teal cable accents. No overlay or tint. Also a faint grey wordmark logo at the bottom-right, low contrast, not legible as text.
Slide 26
KEY METRICS QUARTERLY
(Unaudited)
0.5
0.4
0.3
0.2
0.1
0.0
1Q-2022 2Q-2022 3Q-2022 4Q-2022 1Q-2023 2Q-2023 3Q-2023 4Q-2023 1Q-2024 2Q-2024 3Q-2024 4Q-2024
Vehicle Deliveries
(millions of units)
7
6
5
4
3
2
1
0
-1
-2
-3
1Q-2022 2Q-2022 3Q-2022 4Q-2022 1Q-2023 2Q-2023 3Q-2023 4Q-2023 1Q-2024 2Q-2024 3Q-2024 4Q-2024
Operating Cash Flow ($B)
Free Cash Flow ($B)
8
7
6
5
4
3
2
1
0
1Q-2022 2Q-2022 3Q-2022 4Q-2022 1Q-2023 2Q-2023 3Q-2023 4Q-2023 1Q-2024 2Q-2024 3Q-2024 4Q-2024
Net Income ($B)
Adjusted EBITDA ($B)
26
TESLA
Visuals: Three vertical bar charts, all showing quarterly data from 1Q-2022 to 4Q-2024 (12 quarters each, x-axis labels rotated 90 degrees). Chart 1: Vehicle Deliveries (millions of units); y-axis 0.0 to 0.5 in steps of 0.1 with light grey gridlines; single series of blue bars with a vertical gradient from about #2F5C8F at the top to about #3D72AD at the middle; no legend; no printed values; about values: 1Q-2022 0.31, 2Q-2022 0.25, 3Q-2022 0.34, 4Q-2022 0.40, 1Q-2023 0.42, 2Q-2023 0.47, 3Q-2023 0.43, 4Q-2023 0.48, 1Q-2024 0.38, 2Q-2024 0.44, 3Q-2024 0.46, 4Q-2024 0.49. Chart 2: y-axis -3 to 7 in steps of 1 with light grey gridlines; two series, Operating Cash Flow ($B) in blue (#4472C4 family) and Free Cash Flow ($B) in dark red (#A33A3A); legend below, blue square before Operating Cash Flow ($B) and red square before Free Cash Flow ($B); no printed values; about values for Operating Cash Flow: 1Q-2022 3.9, 2Q-2022 2.3, 3Q-2022 5.0, 4Q-2022 3.2, 1Q-2023 2.5, 2Q-2023 3.0, 3Q-2023 3.3, 4Q-2023 4.3, 1Q-2024 0.2, 2Q-2024 3.6, 3Q-2024 6.2, 4Q-2024 4.8; about values for Free Cash Flow: 1Q-2022 2.2, 2Q-2022 0.6, 3Q-2022 3.2, 4Q-2022 1.4, 1Q-2023 0.4, 2Q-2023 1.0, 3Q-2023 0.8, 4Q-2023 2.0, 1Q-2024 -2.5, 2Q-2024 1.3, 3Q-2024 2.7, 4Q-2024 2.0. Chart 3: y-axis 0 to 8 in steps of 1 with light grey gridlines; two series, Net Income ($B) in blue and Adjusted EBITDA ($B) in dark red; legend below with blue square before Net Income ($B) and red square before Adjusted EBITDA ($B); no printed values; about values for Net Income: 1Q-2022 3.3, 2Q-2022 2.2, 3Q-2022 3.3, 4Q-2022 3.6, 1Q-2023 2.5, 2Q-2023 2.7, 3Q-2023 1.8, 4Q-2023 7.9, 1Q-2024 1.1, 2Q-2024 1.5, 3Q-2024 2.1, 4Q-2024 2.3; about values for Adjusted EBITDA: 1Q-2022 5.0, 2Q-2022 3.8, 3Q-2022 4.9, 4Q-2022 5.4, 1Q-2023 4.3, 2Q-2023 4.6, 3Q-2023 3.7, 4Q-2023 3.9, 1Q-2024 3.3, 2Q-2024 3.6, 3Q-2024 4.6, 4Q-2024 4.9. Bars in each chart come in pairs per quarter (blue then red) except chart 1 which has one bar per quarter. No highlighted points. Captions: 'Vehicle Deliveries (millions of units)' under chart 1 is centred; the legends in charts 2 and 3 sit left-aligned under their charts. The faint TESLA wordmark in the bottom-right is letterspaced light grey.
Slide 27
KEY METRICS TRAILING 12 MONTHS (TTM)
(Unaudited)
2.0 / 1.8 / 1.6 / 1.4 / 1.2 / 1.0 / 0.8 / 0.6 / 0.4 / 0.2 / 0.0
1Q-2022 2Q-2022 3Q-2022 4Q-2022 1Q-2023 2Q-2023 3Q-2023 4Q-2023 1Q-2024 2Q-2024 3Q-2024 4Q-2024
Vehicle Deliveries
(millions of units)
20 / 18 / 16 / 14 / 12 / 10 / 8 / 6 / 4 / 2 / 0
1Q-2022 2Q-2022 3Q-2022 4Q-2022 1Q-2023 2Q-2023 3Q-2023 4Q-2023 1Q-2024 2Q-2024 3Q-2024 4Q-2024
Operating Cash Flow ($B)
Free Cash Flow ($B)
20 / 18 / 16 / 14 / 12 / 10 / 8 / 6 / 4 / 2 / 0
1Q-2022 2Q-2022 3Q-2022 4Q-2022 1Q-2023 2Q-2023 3Q-2023 4Q-2023 1Q-2024 2Q-2024 3Q-2024 4Q-2024
Net Income ($B)
Adjusted EBITDA ($B)
27
Visuals: Three clustered column charts, each with horizontal gridlines and no chart border. Panel 1: Vehicle Deliveries (millions of units), single series, y-axis 0.0 to 2.0 in steps of 0.2, x-axis 1Q-2022 to 4Q-2024 (12 quarters), values about 1.06, 1.11, 1.21, 1.31, 1.42, 1.63, 1.72, 1.80, 1.77, 1.74, 1.77, 1.78; no legend; bars steel blue. Panel 2: Operating Cash Flow ($B) and Free Cash Flow ($B), y-axis 0 to 20 in steps of 2, values for OCF about 13.8, 14.0, 16.0, 14.7, 13.2, 13.9, 12.1, 13.2, 11.0, 11.5, 14.4, 14.9 and FCF about 6.9, 6.9, 8.9, 7.5, 5.7, 6.1, 3.6, 4.3, 1.3, 1.7, 3.5, 3.5; legend below with blue square Operating Cash Flow ($B) and red square Free Cash Flow ($B); no value labels printed, values are estimates. Panel 3: Net Income ($B) and Adjusted EBITDA ($B), y-axis 0 to 20 in steps of 2, Net Income about 8.4, 9.5, 11.1, 12.5, 11.7, 12.1, 10.7, 14.9, 13.6, 12.3, 12.7, 7.1 and Adjusted EBITDA about 14.8, 16.1, 17.9, 19.2, 18.4, 19.3, 18.1, 16.6, 15.7, 14.8, 15.6, 16.6; legend below with blue square Net Income ($B) and red square Adjusted EBITDA ($B); values are estimates. No highlighted points. Bars are thin paired columns with a narrow gap.
Slide 28
FINANCIAL STATEMENTS
TESLA
Visuals: A small grey Tesla wordmark logo in the bottom-right corner, letters T, E, S, L, A rendered in a wide geometric stencil-like style, roughly 1.0% of slide height tall. No photographs, charts, or other graphics.
Slides 29 to 36 continue in the full text file.
Download this deck
The hosted PDF of every library deck is free for readers of the SlideDeck Co newsletter. Join with your email and the viewer and download appear here.
Preparing a results presentation or business update of your own? The SlideDeck Co Standard Deck is a slide library for business reviews, updates and plans.







