
The deck opens with a Highlights slide that lists profitability, cash and operations results for Q4 and full-year 2023 in short bullet points. It then moves through a Financial Summary and an Operational Summary, with quarterly and annual tables for revenue, margins, cash flow, deliveries, production and deployments. Next comes Vehicle Capacity, a table of installed capacity by factory, followed by Core Technology and Other Highlights, which cover FSD Beta, cost of goods sold per vehicle, energy storage and services. An Outlook slide sets expectations for 2024 volume, cash and product plans. A photo and chart section shows vehicles, factories and product lines. The closing sections hold key metrics charts, full financial statements with income statement, balance sheet and cash flow, reconciliations of GAAP to non-GAAP measures, and a legal page with webcast details, definitions and forward-looking statement risks. Slides 3, 6, 10 and 11 are worth studying for how each slide pairs a single headline message with a supporting chart or table.
Slides worth studying
Questions about this deck
How many pages does the Tesla Q4 and FY 2023 update deck have?
The deck has 32 pages, and the contents slide on slide 2 lists its sections from Highlights on slide 3 through Additional Information on slide 31.
What does the Tesla Q4 and FY 2023 deck say about 2023 operating income and net income?
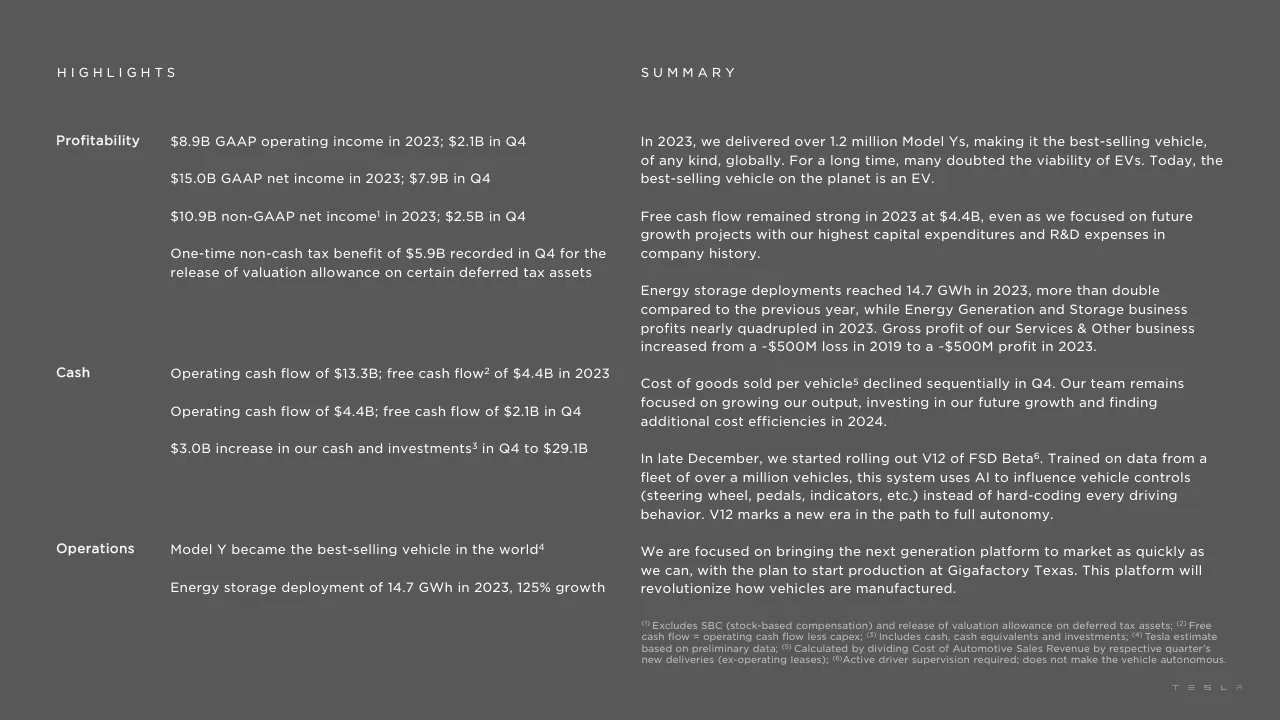
Slide 3 reports $8.9B in GAAP operating income in 2023 and $15.0B in GAAP net income in 2023. Slide 5 shows the same full-year figures in its financial summary table.
What does the Tesla Q4 and FY 2023 deck say about full-year 2023 deliveries?
Slide 8 lists total deliveries of 1,808,581 in 2023, up 38% from 2022. Slide 8 also shows Model 3/Y deliveries of 1,739,707 for the year.
What does the Tesla Q4 and FY 2023 deck say about energy storage deployments in 2023?
Slide 3 states an energy storage deployment of 14.7 GWh in 2023, a 125% growth. Slide 8 lists storage deployed as 14,724 MWh for 2023, with the same 125% YoY change.
Details
- Company: Tesla
- Year: 2024
- Type: Investor presentation
- Industry: Automotive
- Pages: 32
More from Tesla
- Tesla investor presentation, 2026
- Tesla investor presentation, 2025
- Tesla investor presentation, Q4 2024 update
- Tesla investor presentation, 2024 annual shareholder meeting
- Tesla investor presentation, Q4 2022 update
- Tesla investor presentation, Investor Day 2023
All Tesla decks in the library
Review score: 7 out of 10, Effective
Presentation quality, judged with the SlideDeck Co review heuristic. Ask, evidence and idea merit are not rated here.
This is a competent investor update built to be read as a document. The route is clear: the agenda on slide 2 maps to the sections, highlights come first, then the summary tables, then supporting detail and the statements. The main weakness is that most pages carry a generic label (Financial Summary, Core Technology) rather than a message title, so the reader has to find the takeaway in dense prose, as on slides 3, 6 and 10. The tables are tidy and the Q4 2023 column is highlighted, but the tables on slides 4, 5, 7 and 8 have no callouts, and the charts on slides 10 to 11 and 22 to 23 have little emphasis beyond a red bar or a single color change.
Worth keeping: Keep the agenda on slide 2, the pink highlight on the current-period column in the tables, the red final bar on the cost per vehicle chart on slide 10, and the full-bleed photos with short captions on slides 14 to 20.
Most useful repair: Replace the topic labels with one-sentence takeaway titles, cut the prose on slides 3, 6 and 10 to the few points that matter, and raise the footnote and small table text on slides 6, 9 and 25 to 30 to a readable size.
What would change the score: I would add direct takeaways to the key metrics charts on slides 22 and 23, fix the crowded rotated axis labels on slide 10, and drop or compress the photo run of slides 14 to 21 that does not link to the numbers.
Confidence high. 32 of 32 pages inspected on contact sheets, 4 at readable size. Reviewed 2026-11-08. Model-assisted review (claude-sonnet-5-5).
Full text of the slides (32 slides)
Every slide's words and a description of its charts and images, so the deck can be searched and rebuilt. Also available as Markdown.
Slide 1
Q4 and FY 2023 Update
1
Visuals: One logo: the Tesla wordmark in the bottom-right corner, drawn as widely letter-spaced, thin, squared glyphs in light grey (about #F2F2F2), roughly 5.5% of slide width. No photographs, charts, diagrams or other graphics.
Slide 2
Contents / Highlights 03 / Financial Summary 04 / Operational Summary 07 / Vehicle Capacity 09 / Core Technology 10 / Other Highlights 11 / Outlook 12 / Photos & Charts 13 / Key Metrics 22 / Financial Statements 24 / Additional Information 31
Slide 3
HIGHLIGHTS / SUMMARY / Profitability / $8.9B GAAP operating income in 2023; $2.1B in Q4 / $15.0B GAAP net income in 2023; $7.9B in Q4 / $10.9B non-GAAP net income¹ in 2023; $2.5B in Q4 / One-time non-cash tax benefit of $5.9B recorded in Q4 for the / release of valuation allowance on certain deferred tax assets / Cash / Operating cash flow of $13.3B; free cash flow² of $4.4B in 2023 / Operating cash flow of $4.4B; free cash flow of $2.1B in Q4 / $3.0B increase in our cash and investments³ in Q4 to $29.1B / Operations / Model Y became the best-selling vehicle in the world⁴ / Energy storage deployment of 14.7 GWh in 2023, 125% growth / In 2023, we delivered over 1.2 million Model Ys, making it the best-selling vehicle, / of any kind, globally. For a long time, many doubted the viability of EVs. Today, the / best-selling vehicle on the planet is an EV. / Free cash flow remained strong in 2023 at $4.4B, even as we focused on future / growth projects with our highest capital expenditures and R&D expenses in / company history. / Energy storage deployments reached 14.7 GWh in 2023, more than double / compared to the previous year, while Energy Generation and Storage business / profits nearly quadrupled in 2023. Gross profit of our Services & Other business / increased from a ~$500M loss in 2019 to a ~$500M profit in 2023. / Cost of goods sold per vehicle⁵ declined sequentially in Q4. Our team remains / focused on growing our output, investing in our future growth and finding / additional cost efficiencies in 2024. / In late December, we started rolling out V12 of FSD Beta⁶. Trained on data from a / fleet of over a million vehicles, this system uses AI to influence vehicle controls / (steering wheel, pedals, indicators, etc.) instead of hard-coding every driving / behavior. V12 marks a new era in the path to full autonomy. / We are focused on bringing the next generation platform to market as quickly as / we can, with the plan to start production at Gigafactory Texas. This platform will / revolutionize how vehicles are manufactured. / (1) Excludes SBC (stock-based compensation) and release of valuation allowance on deferred tax assets; (2) Free / cash flow = operating cash flow less capex; (3) Includes cash, cash equivalents and investments; (4) Tesla estimate / based on preliminary data; (5) Calculated by dividing Cost of Automotive Sales Revenue by respective quarter’s / new deliveries (ex-operating leases); (6)Active driver supervision required; does not make the vehicle autonomous. / T E S L A
Visuals: None. The only non-text mark is a small faint grey Tesla wordmark at bottom right; no charts, photographs, diagrams or icons.
Slide 4
FINANCIAL SUMMARY
(Unaudited)
($ in millions, except percentages and per share data) | Q4-2022 | Q1-2023 | Q2-2023 | Q3-2023 | Q4-2023 | YoY
Total automotive revenues | 21,307 | 19,963 | 21,268 | 19,625 | 21,563 | 1%
Energy generation and storage revenue | 1,310 | 1,529 | 1,509 | 1,559 | 1,438 | 10%
Services and other revenue | 1,701 | 1,837 | 2,150 | 2,166 | 2,166 | 27%
Total revenues | 24,318 | 23,329 | 24,927 | 23,350 | 25,167 | 3%
Total gross profit | 5,777 | 4,511 | 4,533 | 4,178 | 4,438 | -23%
Total GAAP gross margin | 23.8% | 19.3% | 18.2% | 17.9% | 17.6% | -612 bp
Operating expenses | 1,876 | 1,847 | 2,134 | 2,414 | 2,374 | 27%
Income from operations | 3,901 | 2,664 | 2,399 | 1,764 | 2,064 | -47%
Operating margin | 16.0% | 11.4% | 9.6% | 7.6% | 8.2% | -784 bp
Adjusted EBITDA | 5,404 | 4,267 | 4,653 | 3,758 | 3,953 | -27%
Adjusted EBITDA margin | 22.2% | 18.3% | 18.7% | 16.1% | 15.7% | -652 bp
Net income attributable to common stockholders (GAAP) | 3,687 | 2,513 | 2,703 | 1,853 | 7,928 | 115%
Net income attributable to common stockholders (non-GAAP) | 4,106 | 2,931 | 3,148 | 2,318 | 2,485 | -39%
EPS attributable to common stockholders, diluted (GAAP) | 1.07 | 0.73 | 0.78 | 0.53 | 2.27 | 112%
EPS attributable to common stockholders, diluted (non-GAAP) | 1.19 | 0.85 | 0.91 | 0.66 | 0.71 | -40%
Net cash provided by operating activities | 3,278 | 2,513 | 3,065 | 3,308 | 4,370 | 33%
Capital expenditures | (1,858) | (2,072) | (2,060) | (2,460) | (2,306) | 24%
Free cash flow | 1,420 | 441 | 1,005 | 848 | 2,064 | 45%
Cash, cash equivalents and investments | 22,185 | 22,402 | 23,075 | 26,077 | 29,094 | 31%
4
Visuals: A single table, 7 columns (row label; Q4-2022; Q1-2023; Q2-2023; Q3-2023; Q4-2023; YoY) and a header row reading ($ in millions, except percentages and per share data) | Q4-2022 | Q1-2023 | Q2-2023 | Q3-2023 | Q4-2023 | YoY. Rows in order: Total automotive revenues 21,307 / 19,963 / 21,268 / 19,625 / 21,563 / 1%; Energy generation and storage revenue 1,310 / 1,529 / 1,509 / 1,559 / 1,438 / 10%; Services and other revenue 1,701 / 1,837 / 2,150 / 2,166 / 2,166 / 27%; (blank gap); Total revenues 24,318 / 23,329 / 24,927 / 23,350 / 25,167 / 3%; Total gross profit 5,777 / 4,511 / 4,533 / 4,178 / 4,438 / -23%; Total GAAP gross margin 23.8% / 19.3% / 18.2% / 17.9% / 17.6% / -612 bp; (blank gap); Operating expenses 1,876 / 1,847 / 2,134 / 2,414 / 2,374 / 27%; Income from operations 3,901 / 2,664 / 2,399 / 1,764 / 2,064 / -47%; Operating margin 16.0% / 11.4% / 9.6% / 7.6% / 8.2% / -784 bp; (blank gap); Adjusted EBITDA 5,404 / 4,267 / 4,653 / 3,758 / 3,953 / -27%; Adjusted EBITDA margin 22.2% / 18.3% / 18.7% / 16.1% / 15.7% / -652 bp; (blank gap); Net income attributable to common stockholders (GAAP) 3,687 / 2,513 / 2,703 / 1,853 / 7,928 / 115%; Net income attributable to common stockholders (non-GAAP) 4,106 / 2,931 / 3,148 / 2,318 / 2,485 / -39%; (blank gap); EPS attributable to common stockholders, diluted (GAAP) 1.07 / 0.73 / 0.78 / 0.53 / 2.27 / 112%; EPS attributable to common stockholders, diluted (non-GAAP) 1.19 / 0.85 / 0.91 / 0.66 / 0.71 / -40%; (blank gap); Net cash provided by operating activities 3,278 / 2,513 / 3,065 / 3,308 / 4,370 / 33%; Capital expenditures (1,858) / (2,072) / (2,060) / (2,460) / (2,306) / 24%; Free cash flow 1,420 / 441 / 1,005 / 848 / 2,064 / 45%; Cash, cash equivalents and investments 22,185 / 22,402 / 23,075 / 26,077 / 29,094 / 31%. Highlighting: the entire Q4-2023 column (the cells from Total automotive revenues to Cash, cash equivalents and investments) has a pale rose tint behind the numbers, and the Q4-2023 header cell is also tinted rose-grey rather than the header grey. No charts, photographs or icons. A faint Tesla wordmark logo sits bottom-right.
Slide 5
FINANCIAL SUMMARY
(Unaudited)
($ in millions, except percentages and per share data) 2019 2020 2021 2022 2023 YoY
Total automotive revenues 20,821 27,236 47,232 71,462 82,419 15%
Energy generation and storage revenue 1,531 1,994 2,789 3,909 6,035 54%
Services and other revenue 2,226 2,306 3,802 6,091 8,319 37%
Total revenues 24,578 31,536 53,823 81,462 96,773 19%
Total gross profit 4,069 6,630 13,606 20,853 17,660 -15%
Total GAAP gross margin 16.6% 21.0% 25.3% 25.6% 18.2% -735 bp
Operating expenses 4,138 4,636 7,083 7,197 8,769 22%
(Loss) income from operations (69) 1,994 6,523 13,656 8,891 -35%
Operating margin -0.3% 6.3% 12.1% 16.8% 9.2% -758 bp
Adjusted EBITDA 2,985 5,817 11,621 19,186 16,631 -13%
Adjusted EBITDA margin 12.1% 18.4% 21.6% 23.6% 17.2% -637 bp
Net (loss) income attributable to common stockholders (GAAP) (862) 721 5,519 12,556 14,997 19%
Net income attributable to common stockholders (non-GAAP) 36 2,455 7,640 14,116 10,882 -23%
EPS attributable to common stockholders, diluted (GAAP) (0.33) 0.21 1.63 3.62 4.30 19%
EPS attributable to common stockholders, diluted (non-GAAP) 0.01 0.75 2.26 4.07 3.12 -23%
Net cash provided by operating activities 2,405 5,943 11,497 14,724 13,256 -10%
Capital expenditures (1,327) (3,157) (6,482) (7,158) (8,898) 24%
Free cash flow 1,078 2,786 5,015 7,566 4,358 -42%
Cash, cash equivalents and investments 6,268 19,384 17,707 22,185 29,094 31%
5
T E S L A
Visuals: Table with 7 columns and 21 data rows plus a header row. Columns: row label ($ in millions, except percentages and per share data), 2019, 2020, 2021, 2022, 2023, YoY. Header row is mid-grey #7F7F7F with white text. Data rows alternate light grey #F2F2F2 bands and white rows, and rows are separated by about 0.3% gaps; the label column has grey bands at its left edge. The 2023 column cells are tinted light pink (about #F2D9DB) to highlight it. Rows: Total automotive revenues 20,821 / 27,236 / 47,232 / 71,462 / 82,419 / 15%. Energy generation and storage revenue 1,531 / 1,994 / 2,789 / 3,909 / 6,035 / 54%. Services and other revenue 2,226 / 2,306 / 3,802 / 6,091 / 8,319 / 37%. (blank spacer row). Total revenues 24,578 / 31,536 / 53,823 / 81,462 / 96,773 / 19%. Total gross profit 4,069 / 6,630 / 13,606 / 20,853 / 17,660 / -15%. Total GAAP gross margin 16.6% / 21.0% / 25.3% / 25.6% / 18.2% / -735 bp. (spacer). Operating expenses 4,138 / 4,636 / 7,083 / 7,197 / 8,769 / 22%. (Loss) income from operations (69) / 1,994 / 6,523 / 13,656 / 8,891 / -35%. Operating margin -0.3% / 6.3% / 12.1% / 16.8% / 9.2% / -758 bp. (spacer). Adjusted EBITDA 2,985 / 5,817 / 11,621 / 19,186 / 16,631 / -13%. Adjusted EBITDA margin 12.1% / 18.4% / 21.6% / 23.6% / 17.2% / -637 bp. (spacer). Net (loss) income attributable to common stockholders (GAAP) (862) / 721 / 5,519 / 12,556 / 14,997 / 19%. Net income attributable to common stockholders (non-GAAP) 36 / 2,455 / 7,640 / 14,116 / 10,882 / -23%. (spacer). EPS attributable to common stockholders, diluted (GAAP) (0.33) / 0.21 / 1.63 / 3.62 / 4.30 / 19%. EPS attributable to common stockholders, diluted (non-GAAP) 0.01 / 0.75 / 2.26 / 4.07 / 3.12 / -23%. (spacer). Net cash provided by operating activities 2,405 / 5,943 / 11,497 / 14,724 / 13,256 / -10%. Capital expenditures (1,327) / (3,157) / (6,482) / (7,158) / (8,898) / 24%. Free cash flow 1,078 / 2,786 / 5,015 / 7,566 / 4,358 / -42%. Cash, cash equivalents and investments 6,268 / 19,384 / 17,707 / 22,185 / 29,094 / 31%. No chart, photograph or illustration. Faint Tesla wordmark logo bottom-right, spaced capitals T E S L A in light grey.
Slide 6
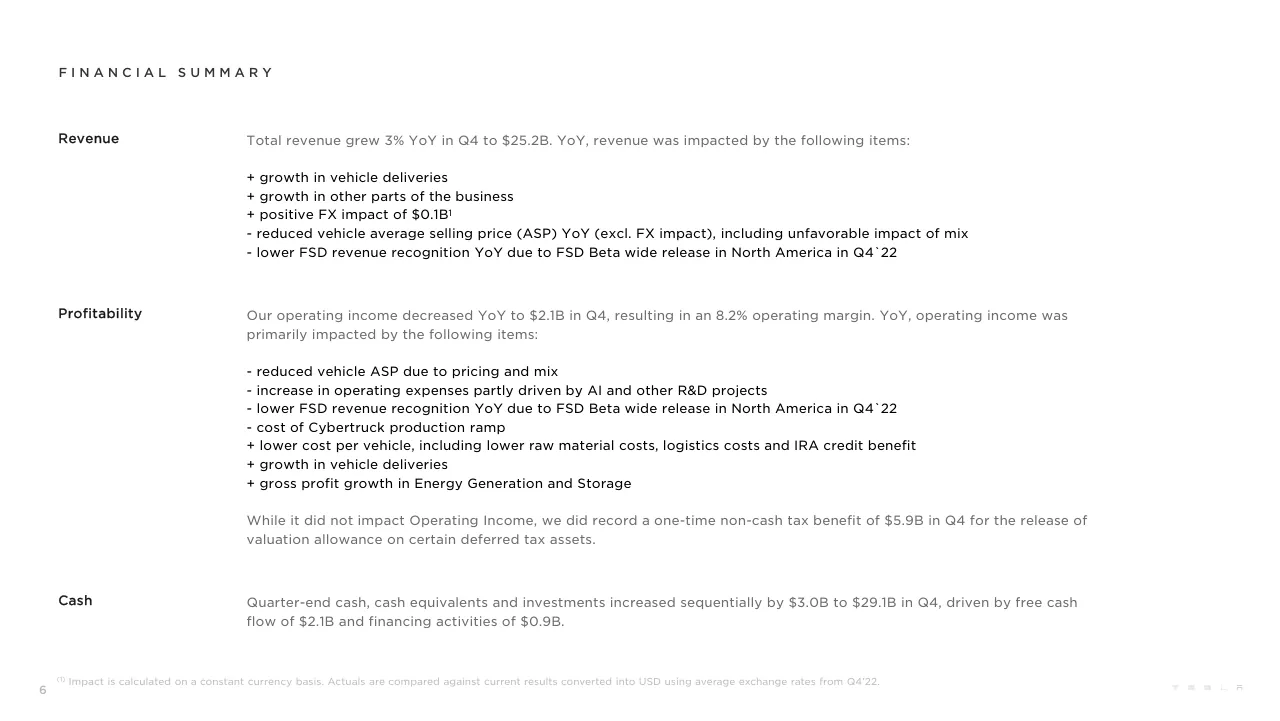
FINANCIAL SUMMARY / Revenue / Total revenue grew 3% YoY in Q4 to $25.2B. YoY, revenue was impacted by the following items: / + growth in vehicle deliveries / + growth in other parts of the business / + positive FX impact of $0.1B1 / - reduced vehicle average selling price (ASP) YoY (excl. FX impact), including unfavorable impact of mix / - lower FSD revenue recognition YoY due to FSD Beta wide release in North America in Q4`22 / Profitability / Our operating income decreased YoY to $2.1B in Q4, resulting in an 8.2% operating margin. YoY, operating income was / primarily impacted by the following items: / - reduced vehicle ASP due to pricing and mix / - increase in operating expenses partly driven by AI and other R&D projects / - lower FSD revenue recognition YoY due to FSD Beta wide release in North America in Q4`22 / - cost of Cybertruck production ramp / + lower cost per vehicle, including lower raw material costs, logistics costs and IRA credit benefit / + growth in vehicle deliveries / + gross profit growth in Energy Generation and Storage / While it did not impact Operating Income, we did record a one-time non-cash tax benefit of $5.9B in Q4 for the release of / valuation allowance on certain deferred tax assets. / Cash / Quarter-end cash, cash equivalents and investments increased sequentially by $3.0B to $29.1B in Q4, driven by free cash / flow of $2.1B and financing activities of $0.9B. / 6 / (1) Impact is calculated on a constant currency basis. Actuals are compared against current results converted into USD using average exchange rates from Q4’22. / TESLA wordmark (no text other than the logo)
Visuals: None apart from the faint Tesla wordmark logo at bottom right, drawn as widely letter-spaced light grey capitals T E S L A in a thin sans-serif, about 5.5% of the width. No charts, photographs, tables or diagrams.
Slide 7
OPERATIONAL SUMMARY
(Unaudited)
Q4-2022 Q1-2023 Q2-2023 Q3-2023 Q4-2023 YoY
Model 3/Y production 419,088 421,371 460,211 416,800 476,777 14%
Other models production 20,613 19,437 19,489 13,688 18,212 -12%
Total production 439,701 440,808 479,700 430,488 494,989 13%
Model 3/Y deliveries 388,131 412,180 446,915 419,074 461,538 19%
Other models deliveries 17,147 10,695 19,225 15,985 22,969 34%
Total deliveries 405,278 422,875 466,140 435,059 484,507 20%
of which subject to operating lease accounting 15,184 22,357 21,883 17,423 10,563 -30%
Total end of quarter operating lease vehicle count 140,667 153,988 168,058 176,231 176,564 26%
Global vehicle inventory (days of supply)(1) 13 15 16 16 15 15%
Solar deployed (MW) 100 67 66 49 41 -59%
Storage deployed (MWh) 2,462 3,889 3,653 3,980 3,202 30%
Tesla locations 963 1,000 1,068 1,129 1,208 25%
Mobile service fleet 1,584 1,692 1,769 1,846 1,909 21%
Supercharger stations 4,678 4,947 5,265 5,595 5,952 27%
Supercharger connectors 42,419 45,169 48,082 51,105 54,892 29%
(1)Days of supply is calculated by dividing new vehicle ending inventory by the relevant quarter’s deliveries and using 75 trading days (aligned with Automotive News definition).
7
T E S L A
Visuals: A single data table with no chart, photo or icon. Columns: row label column (no header text, about 4.6 to 43.3 percent wide), then Q4-2022, Q1-2023, Q2-2023, Q3-2023, Q4-2023 and YoY. Rows in order: Model 3/Y production (419,088; 421,371; 460,211; 416,800; 476,777; 14%); Other models production (20,613; 19,437; 19,489; 13,688; 18,212; -12%); Total production in bold (439,701; 440,808; 479,700; 430,488; 494,989; 13%); empty spacer row; Model 3/Y deliveries (388,131; 412,180; 446,915; 419,074; 461,538; 19%); Other models deliveries (17,147; 10,695; 19,225; 15,985; 22,969; 34%); Total deliveries in bold (405,278; 422,875; 466,140; 435,059; 484,507; 20%); indented row of which subject to operating lease accounting (15,184; 22,357; 21,883; 17,423; 10,563; -30%); empty spacer; Total end of quarter operating lease vehicle count (140,667; 153,988; 168,058; 176,231; 176,564; 26%); Global vehicle inventory (days of supply) with superscript (1) (13; 15; 16; 16; 15; 15%); empty spacer; Solar deployed (MW) (100; 67; 66; 49; 41; -59%); Storage deployed (MWh) (2,462; 3,889; 3,653; 3,980; 3,202; 30%); empty spacer; Tesla locations (963; 1,000; 1,068; 1,129; 1,208; 25%); Mobile service fleet (1,584; 1,692; 1,769; 1,846; 1,909; 21%); empty spacer; Supercharger stations (4,678; 4,947; 5,265; 5,595; 5,952; 27%); Supercharger connectors (42,419; 45,169; 48,082; 51,105; 54,892; 29%). The Q4-2023 column cells are shaded light pink as a highlight column. The table is not cropped and is boxed only by its row fills.
Slide 8
OPERATIONAL SUMMARY
(Unaudited)
2019
2020
2021
2022
2023
YoY
Model 3/Y production
302,301
454,932
906,032
1,298,434
1,775,159
37%
Other models production
62,931
54,805
24,390
71,177
70,826
0%
Total production
365,232
509,737
930,422
1,369,611
1,845,985
35%
Model 3/Y deliveries
300,885
442,562
911,242
1,247,146
1,739,707
39%
Other models deliveries
66,771
57,085
24,980
66,705
68,874
3%
Total deliveries
367,656
499,647
936,222
1,313,851
1,808,581
38%
of which subject to operating lease accounting
25,439
34,470
60,912
47,582
72,226
52%
Total end of year operating lease vehicle count
49,901
72,089
120,342
140,667
176,564
26%
Global vehicle inventory (days of supply)(1)
13
15
6
16
16
0%
Solar deployed (MW)
173
205
345
348
223
-36%
Storage deployed (MWh)
1,651
3,022
3,992
6,541
14,724
125%
Tesla locations(2)
433
523
644
963
1,208
25%
Mobile service fleet
758
894
1,281
1,584
1,909
21%
Supercharger stations
1,821
2,564
3,476
4,678
5,952
27%
Supercharger connectors
16,104
23,277
31,498
42,419
54,892
29%
(1)Days of supply is calculated by dividing new vehicle ending inventory by the relevant year’s deliveries and using 300 trading days (aligned with Automotive News definition).
(2)We revised our methodology for reporting Tesla’s physical footprint to include all sales, service, delivery and body shop locations globally for 2022 onwards.
8
TESLA
Visuals: Table with 7 columns: an unlabelled row-label column, then 2019, 2020, 2021, 2022, 2023 and YoY. Rows in order: Model 3/Y production 302,301 / 454,932 / 906,032 / 1,298,434 / 1,775,159 / 37%. Other models production 62,931 / 54,805 / 24,390 / 71,177 / 70,826 / 0%. Total production (bold) 365,232 / 509,737 / 930,422 / 1,369,611 / 1,845,985 / 35%. Blank spacer row. Model 3/Y deliveries 300,885 / 442,562 / 911,242 / 1,247,146 / 1,739,707 / 39%. Other models deliveries 66,771 / 57,085 / 24,980 / 66,705 / 68,874 / 3%. Total deliveries (bold) 367,656 / 499,647 / 936,222 / 1,313,851 / 1,808,581 / 38%. Indented sub-row 'of which subject to operating lease accounting' 25,439 / 34,470 / 60,912 / 47,582 / 72,226 / 52%. Blank spacer row. Total end of year operating lease vehicle count 49,901 / 72,089 / 120,342 / 140,667 / 176,564 / 26%. Global vehicle inventory (days of supply)(1) 13 / 15 / 6 / 16 / 16 / 0%. Blank spacer row. Solar deployed (MW) 173 / 205 / 345 / 348 / 223 / -36%. Storage deployed (MWh) 1,651 / 3,022 / 3,992 / 6,541 / 14,724 / 125%. Blank spacer row. Tesla locations(2) 433 / 523 / 644 / 963 / 1,208 / 25%. Mobile service fleet 758 / 894 / 1,281 / 1,584 / 1,909 / 21%. Blank spacer row. Supercharger stations 1,821 / 2,564 / 3,476 / 4,678 / 5,952 / 27%. Supercharger connectors 16,104 / 23,277 / 31,498 / 42,419 / 54,892 / 29%. No charts, photographs or illustrations. The 2023 column cells are highlighted in pale pink, and the 2023 values for Total production and Total deliveries are bold; no other cells are highlighted.
Slide 9
VEHICLE CAPACITY / After our scheduled global factory shutdown in Q3, our global production reached a record annualized run rate of nearly 2.0 million vehicles in Q4. The refreshed Model 3 - with a significantly quieter cabin, ventilated seats, a screen for rear seats, longer range and many other improvements - is now available globally. / US: California, Nevada and Texas / Before Tesla purchased the Fremont factory, the record output of the previous owner was nearly 430,000 vehicles made in a single year. In 2023, the Tesla Fremont factory produced nearly 560,000 vehicles thanks to our ~20,000 Fremont-based employees. At Gigafactory Texas, we began production of the Cybertruck and delivered the first units to customers. We expect the ramp of Cybertruck to be longer than other models given its manufacturing complexity. / China: Shanghai / Shanghai resumed normal rate production in Q4, rebounding from the scheduled downtime in Q3. Production of the updated Model 3 ramped to full speed in less than two months. / Europe: Berlin-Brandenburg / Model Y production in Berlin continued to grow in Q4, achieving both a record weekly production rate and a sequential increase in total production volume for the seventh consecutive quarter. / Current Installed Annual Vehicle Capacity / Region | Model | Capacity | Status / California | Model S / Model X | 100,000 | Production / (blank) | Model 3 / Model Y | 550,000 | Production / Shanghai | Model 3 / Model Y | >950,000 | Production / Berlin | Model Y | 375,000 | Production / Texas | Model Y | >250,000 | Production / (blank) | Cybertruck | >125,000 | Production / Nevada | Tesla Semi | - | Pilot production / Various | Next Gen Platform | - | In development / TBD | Roadster | - | In development / Installed capacity ≠ current production rate and there may be limitations discovered as production rates approach capacity. Production rates depend on a variety of factors, including equipment uptime, component supply, downtime related to factory upgrades, regulatory considerations and other factors. / Market share of Tesla vehicles by region (TTM) / US/Canada / Europe / China / 4% / 3% / 2% / 1% / 0% / Q4 2017 / Q1 2018 / Q2 2018 / Q3 2018 / Q4 2018 / Q1 2019 / Q2 2019 / Q3 2019 / Q4 2019 / Q1 2020 / Q2 2020 / Q3 2020 / Q4 2020 / Q1 2021 / Q2 2021 / Q3 2021 / Q4 2021 / Q1 2022 / Q2 2022 / Q3 2022 / Q4 2022 / Q1 2023 / Q2 2023 / Q3 2023 / Q4 2023 / Source: Tesla estimates based on latest available data from ACEA; Autonews.com; CAAM – light-duty vehicles only; TTM = Trailing twelve months / 9 / T E S L A
Visuals: Two visuals. (1) Table titled Current Installed Annual Vehicle Capacity with four columns (Region, Model, Capacity, Status) and nine body rows: California | Model S / Model X | 100,000 | Production; blank region | Model 3 / Model Y | 550,000 | Production; Shanghai | Model 3 / Model Y | >950,000 | Production; Berlin | Model Y | 375,000 | Production; Texas | Model Y | >250,000 | Production; blank region | Cybertruck | >125,000 | Production; Nevada | Tesla Semi | - | Pilot production; Various | Next Gen Platform | - | In development; TBD | Roadster | - | In development. Header row is grey with white labels; body rows are light grey with thin white separators; Capacity values are right-aligned, Status values centred. (2) Line chart titled Market share of Tesla vehicles by region (TTM). X axis: quarters Q4 2017 to Q4 2023 (25 quarterly points, labels rotated about 45 degrees). Y axis: 0% to 4% in 1% steps, light grey horizontal gridlines. Legend above plot: US/Canada (blue line), Europe (red line), China (green line). No values are printed on the chart; approximate readings: US/Canada rises from about 0.25% in Q4 2017 to about 1.0% in Q4 2018, about 1.1% in Q2 2020, about 2.3% in Q4 2021, about 3.6% in Q4 2022 and about 3.95% in Q4 2023. Europe is about 0.2% through 2018, about 0.8% in Q1 2020, about 1.2% in Q4 2021, about 2.0% in Q4 2022 and about 2.85% in Q4 2023. China is about 0.05% in 2017, about 0.9% in Q1 2021, about 1.6% in Q4 2021, about 1.85% in Q4 2022 and about 2.35% in Q4 2023. No highlighted points. No photographs or logos except the faint wordmark.
Slide 10
CORE TECHNOLOGY
Artificial Intelligence Software and Hardware
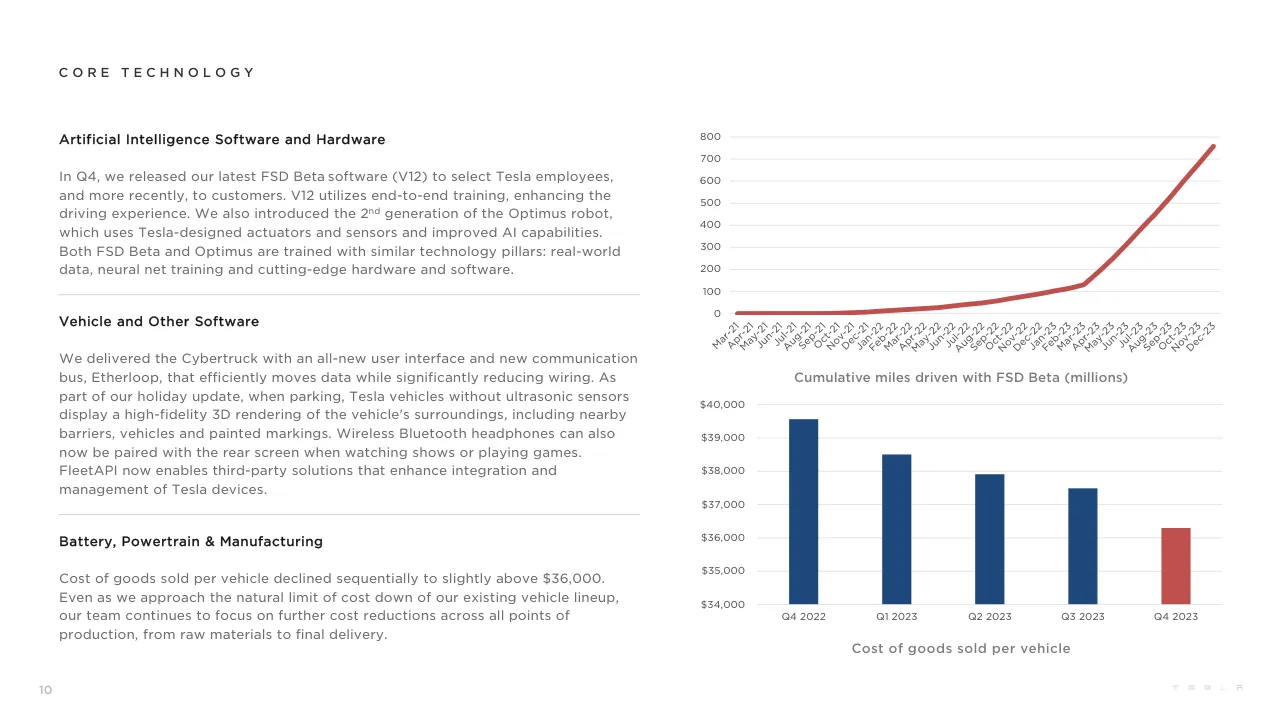
In Q4, we released our latest FSD Beta software (V12) to select Tesla employees, and more recently, to customers. V12 utilizes end-to-end training, enhancing the driving experience. We also introduced the 2nd generation of the Optimus robot, which uses Tesla-designed actuators and sensors and improved AI capabilities. Both FSD Beta and Optimus are trained with similar technology pillars: real-world data, neural net training and cutting-edge hardware and software.
Vehicle and Other Software
We delivered the Cybertruck with an all-new user interface and new communication bus, Etherloop, that efficiently moves data while significantly reducing wiring. As part of our holiday update, when parking, Tesla vehicles without ultrasonic sensors display a high-fidelity 3D rendering of the vehicle's surroundings, including nearby barriers, vehicles and painted markings. Wireless Bluetooth headphones can also now be paired with the rear screen when watching shows or playing games. FleetAPI now enables third-party solutions that enhance integration and management of Tesla devices.
Battery, Powertrain & Manufacturing
Cost of goods sold per vehicle declined sequentially to slightly above $36,000. Even as we approach the natural limit of cost down of our existing vehicle lineup, our team continues to focus on further cost reductions across all points of production, from raw materials to final delivery.
Cumulative miles driven with FSD Beta (millions)
Cost of goods sold per vehicle
10
T E S L A
Visuals: Two charts. (1) Line chart, titled 'Cumulative miles driven with FSD Beta (millions)' placed below the line, with a y-axis labelled 0 to 800 in steps of 100 (no axis unit title, unit is millions as in chart title) and a categorical x-axis of monthly labels rotated about 45 degrees from Mar-21 through Dec-23 (every month, 34 labels). One series, a thick red line about #C0504D, rising from about 0 at Mar-21 to about 10 by Sep-21, about 30 by Apr-22, about 130 by Mar-23 and about 760 at Dec-23; values are estimates (about). No legend, no highlighted points, no value labels. Gridlines are light grey horizontal lines at each 100 step. (2) Vertical bar chart, titled 'Cost of goods sold per vehicle' below the bars, with y-axis labels $34,000 to $40,000 in steps of $1,000 (axis range $34,000 to $40,000) and x-axis categories Q4 2022, Q1 2023, Q2 2023, Q3 2023, Q4 2023. Bars are dark navy #1F497D for Q4 2022 (about $39,550), Q1 2023 (about $38,500), Q2 2023 (about $37,900) and Q3 2023 (about $37,500); the Q4 2023 bar is red #C0504D at about $36,300 and is the only highlighted point. Values are estimates (about) as the slide prints none. No legend. Light grey horizontal gridlines at each $1,000 step; no axis lines beyond the baseline.
Slide 11
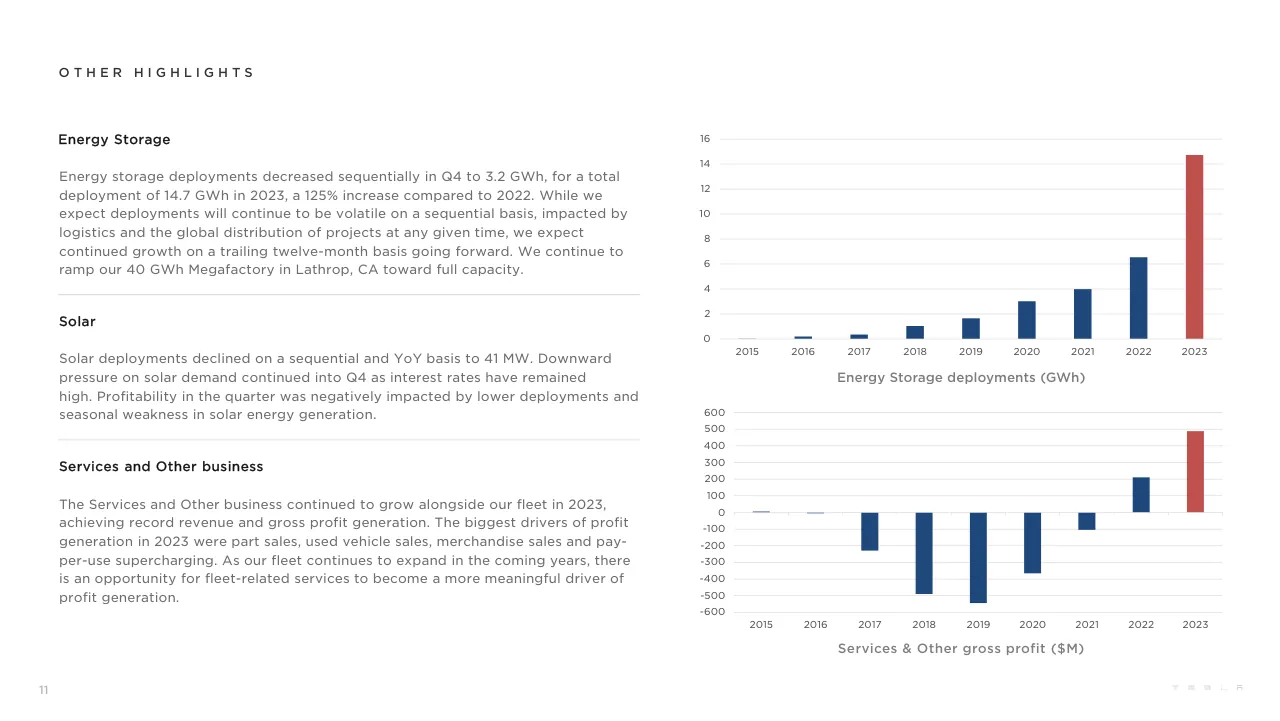
OTHER HIGHLIGHTS / Energy Storage / Energy storage deployments decreased sequentially in Q4 to 3.2 GWh, for a total / deployment of 14.7 GWh in 2023, a 125% increase compared to 2022. While we / expect deployments will continue to be volatile on a sequential basis, impacted by / logistics and the global distribution of projects at any given time, we expect / continued growth on a trailing twelve-month basis going forward. We continue to / ramp our 40 GWh Megafactory in Lathrop, CA toward full capacity. / Solar / Solar deployments declined on a sequential and YoY basis to 41 MW. Downward / pressure on solar demand continued into Q4 as interest rates have remained / high. Profitability in the quarter was negatively impacted by lower deployments and / seasonal weakness in solar energy generation. / Services and Other business / The Services and Other business continued to grow alongside our fleet in 2023, / achieving record revenue and gross profit generation. The biggest drivers of profit / generation in 2023 were part sales, used vehicle sales, merchandise sales and pay- / per-use supercharging. As our fleet continues to expand in the coming years, there / is an opportunity for fleet-related services to become a more meaningful driver of / profit generation. / Energy Storage deployments (GWh) / 16 / 14 / 12 / 10 / 8 / 6 / 4 / 2 / 0 / 2015 / 2016 / 2017 / 2018 / 2019 / 2020 / 2021 / 2022 / 2023 / Services & Other gross profit ($M) / 600 / 500 / 400 / 300 / 200 / 100 / 0 / -100 / -200 / -300 / -400 / -500 / -600 / 2015 / 2016 / 2017 / 2018 / 2019 / 2020 / 2021 / 2022 / 2023 / 11 / T E S L A
Visuals: Two vertical bar charts, both on a white background with light grey horizontal gridlines and no plot border. Chart 1 (top right): column chart titled Energy Storage deployments (GWh) placed below the plot, y-axis 0 to 16 GWh in steps of 2, x-axis years 2015 to 2023. Values: 2015 about 0 (barely visible), 2016 about 0.2, 2017 about 0.4, 2018 about 1.0, 2019 about 1.7, 2020 about 3.0, 2021 about 4.0, 2022 about 6.5, 2023 14.7 (14.7 GWh as stated in the body text). Bars are navy #1F497D except the 2023 bar, which is highlighted in brick red #C0504D. No legend and no data labels. Chart 2 (bottom right): column chart titled Services & Other gross profit ($M), y-axis -600 to 600 in steps of 100, x-axis years 2015 to 2023 placed at the zero line. Values (none printed, estimates): 2015 about 5, 2016 about -10, 2017 about -230, 2018 about -490, 2019 about -540, 2020 about -365, 2021 about -105, 2022 about 210, 2023 about 485. Bars are navy #1F497D except the 2023 bar, highlighted in brick red #C0504D. No legend and no data labels. Both charts' axis labels are grey #595959, Gotham Book, about 1.35% of slide height.
Slide 12
OUTLOOK
Volume
Our company is currently between two major growth waves: the first one began with the global expansion of the / Model 3/Y platform and the next one we believe will be initiated by the global expansion of the next-generation vehicle / platform. In 2024, our vehicle volume growth rate may be notably lower than the growth rate achieved in 2023, as our / teams work on the launch of the next-generation vehicle at Gigafactory Texas. In 2024, the growth rate of deployments / and revenue in our Energy Storage business should outpace the Automotive business.
Cash
We have sufficient liquidity to fund our product roadmap, long-term capacity expansion plans and other expenses. / Furthermore, we will manage the business such that we maintain a strong balance sheet during this uncertain period.
Profit
While we continue to execute on innovations to reduce the cost of manufacturing and operations, over time, we expect / our hardware-related profits to be accompanied by an acceleration of AI, software and fleet-based profits.
Product
Cybertruck production and deliveries will ramp throughout this year. In addition, we continue to make progress on our / next generation platform.
12
Slide 13
PHOTOS & CHARTS / TESLA
Visuals: Tesla wordmark in the bottom-right corner, rendered as a small widely spaced grey logotype spelling T E S L A in a stylised geometric form (about 1.2% of slide height, light grey #7A7A7A). No photographs, charts, or other illustrations.
Slide 14
MODEL Y - BEST-SELLING VEHICLE GLOBALLY IN 2023 / 14
Visuals: One photograph, the only visual image on the slide, placed as a boxed rectangle (not full-bleed) with square corners and no border, shadow or overlay. Subject: a white Tesla Model Y crossover parked on a sandy dune overlooking a beach, seen from the rear three-quarter angle on the driver's side. A surfboard with two dark fins is strapped to the roof rack. The rear light bar glows red and the rear plate is yellow with dark characters, partly legible. The sea on the left shows white breaking waves on blue-green water, a sandy beach curves away, and a green headland sits on the horizon. Foreground has marram-style dune grass and sand ripples with the car's shadow falling forward on the sand. Lighting: low warm sunlight from the right, soft haze and a pale sky brightening towards the right edge. Composition: car placed right of centre, horizon near the upper-middle third, wide landscape framing. Dominant colours: sky blue #7FA7C4, sea teal #2E6F86, sand beige #D9C3A0, dune grass gold #B9A46A, car white #E8E8EA. Not cropped. Also a small faint Tesla wordmark logo in the bottom-right corner, very light grey.
Slide 15
UPDATED MODEL 3 - AVAILABLE GLOBALLY
15
TESLA
MODEL 3
DUAL MOTOR
Visuals: Photograph of a dark blue Tesla Model 3 (updated model) in rear three-quarter view, parked on pale wet-looking sand at a beach. The car is on the left-centre of the frame, angled towards the viewer's left, with its tail toward the right. Calm grey-blue sea fills the middle band behind it, with a small rocky island silhouette on the far right horizon. The upper half is a pale blue sky with thin streaky clouds. Sunlight comes from the left, lighting the car's left flank and casting a long dark shadow to the right across the sand; faint tyre tracks run through the sand in the foreground. Composition: horizon at about 46% of photo height, car occupies roughly 35% of photo width, generous empty sky above. Dominant colours: car #2A4F8A deep blue, sky #A9C0D6, sea #9DB4C6, sand #D9CEC0, shadow #5E5A57. The photo is a rectangle with square corners, boxed inside margins and not cropped or full-bleed, with no overlay or tint. Its visible text on the car reads TESLA on the boot lid, MODEL 3 on the rear number plate, and DUAL MOTOR on the small badge below the plate.
Slide 16
FREMONT FACTORY PRODUCED NEARLY 560,000 VEHICLES IN 2023, AN ALL-TIME RECORD / 16 / T E S L A
Visuals: Photograph of a factory worker in a black cap, clear safety glasses, black short-sleeved polo and grey gloves, smiling broadly with a full dark beard, leaning into the open dashboard area of a white vehicle body during assembly. Left foreground shows a black dashboard with a wood-grain trim strip and a large dark glossy touchscreen panel with a small white 'NA' sticker; a black steering wheel edge is at far left. Right background shows industrial equipment with green-lit machinery, a red electrical box, orange high-voltage cables and a blue plastic wrap bundle. A white wiring harness and beige padding lie along the floor pan in the lower right. Composition is a landscape crop with the subject right of centre and the dashboard filling the left; the image is boxed (not full-bleed) with sharp focus, soft lighting from overhead factory lights, and dominant colours of black, white, grey, with accents of red, green and blue. No overlay or tint.
Slide 17
CYBERTRUCK DELIVERY EVENT
17
TESLA
Visuals: One photograph, boxed and not cropped at the edges, showing a dark indoor event space at night filled with a crowd in silhouette from behind, many raised arms holding up smartphones that glow with screens. Centre background: a green-lit arched stage structure with vertical white-grey striped panels and the orange letters TESLA across its top; a dark doorway or tunnel opening in its centre with a green-lit vehicle silhouette beyond. Two large rectangular projection screens flank the stage, left and right, each showing a glowing white hand-drawn neon style CYBERTRUCK wordmark on a dark olive-brown field. Overhead: exposed black truss, silver ducting and hanging stage spotlights. Lighting is mostly teal and green wash from the ceiling with blue and magenta accents at the left edge. Dominant colours: near-black, teal green #1F7A6B, dark olive #3A3424, white highlights, orange #E0892B on the TESLA lettering. No overlay or tint beyond the existing colour cast. Small faint Tesla wordmark letters in light grey at bottom right, not a photograph element.
Slide 18
CYBERTRUCK
18
Visuals: One photograph, not a chart, table, diagram or icon. Subject: a silver stainless-steel Tesla Cybertruck pickup in three-quarter front view from the left, parked on a rough, snow-covered glacier surface. Action: static, the truck is stationary on the ice with a dark meltwater channel in the foreground. Composition: wide landscape frame, truck in the left-centre third at about mid-height, dark jagged mountain silhouettes on the right horizon, open sky above. Lighting: overcast, cool diffuse daylight with soft shadows under the truck. Dominant colours: slate blue sky, white and pale grey ice, charcoal and near-black truck lower body, dark mountains, silver body panels. The image is boxed inside the margins, not cropped, not full-bleed, with no overlay or tint. A thin bright light bar runs along the front edge of the truck's nose.
Slide 19
CYBERTRUCK PRODUCTION LINE
19
Visuals: Photograph of an unpainted stainless-steel Cybertruck body in a factory. The body is suspended by a red steel jig with two motorised hoist units and red cross-beams from the ceiling. Its driver-side door is open and raised upward at the right, and all four wheels with brake discs are attached. The body is in side view, slightly low angle, roughly centred. Left foreground: a grey concrete column with a white wall-mounted FIRST AID cabinet bearing a red cross. Right: a grey wire-mesh safety cage with a red and white DANGER sign reading AUTHORIZED PERSONNEL ONLY. Background: workers in dark clothing, monitors, racks and overhead lights. Lighting is neutral overhead industrial light, with soft reflections on the steel. Dominant colours are steel grey, signal red, concrete grey and white. The photo is rectangular, not cropped, not full-bleed, with no overlay or tint. A yellow and black striped floor line runs along the bottom edge of the photo.
Slide 20
MEGAPACK PRODUCTION LINE
20
WLL 100,000 LB
TESLA
D16
TESLA
Visuals: One photograph. Subject: a large white Megapack battery enclosure suspended by a red and yellow overhead crane spreader beam in an industrial factory. The beam is stencilled WLL 100,000 LB with a small US flag and a TESLA mark, and has two black hoist cameras or sensors. The enclosure has a row of about nine vertical double doors with black handles and a louvred vent strip along its top. Below it, a row of white cabinets holds stacked orange battery modules in grey frames, with one cabinet open in the centre showing electronics. Cabinets with orange modules continue to the left and right, and a red floor edge runs along the bottom. Background: exposed steel roof trusses, red crane rails, fluorescent lights, a pipe run, and a worker in high-visibility clothing at far left. Composition: eye-level, straight-on, centred, with the suspended enclosure filling the upper half and the cabinets filling the lower half. The photo is not cropped at its edges and is boxed, not full-bleed, with no overlay or tint. Lighting: bright, even factory lighting. Dominant colours: white and light grey, with orange battery modules, red crane and floor accents, and dark steel grey.
Slide 21
TESLA WRAPS
21
Visuals: Two photographs. Left: a matte black Tesla Cybertruck in three-quarter front view facing left, parked on a pale grey concrete ledge that runs across the lower part of the frame, with a mirror-like reflection of the truck and of the glass facade in the glossy ground below the ledge. Behind it is a black-framed glass curtain wall with a grid of mullions reflecting pale sky and city towers. Soft overcast daylight, cool blue-grey tones, dominant colours black, slate grey and pale blue; the image is cropped to a rectangle with square corners and not full-bleed. Right: a silver-blue Tesla Model Y in front three-quarter view, parked on dark grey asphalt in front of a black-framed glass wall reflecting industrial structures and a sky; soft diffuse daylight, dominant colours slate blue, charcoal and grey; the car sits centred in the lower half of the frame with the wall filling the upper part; square corners, boxed and not full-bleed. The Tesla wordmark at bottom right is a faint set of letters in light grey, not a coloured logo.
Slide 22
K E Y M E T R I C S
Q U A R T E R L Y
(Unaudited)
0.5
0.4
0.3
0.2
0.1
0.0
8
7
6
5
4
3
2
1
0
1Q-2021 2Q-2021 3Q-2021 4Q-2021 1Q-2022 2Q-2022 3Q-2022 4Q-2022 1Q-2023 2Q-2023 3Q-2023 4Q-2023
Vehicle Deliveries
(millions of units)
Operating Cash Flow ($B)
Free Cash Flow ($B)
Net Income ($B)
Adjusted EBITDA ($B)
22
T E S L A
Visuals: Three vertical bar charts, all with a white background and light grey horizontal gridlines. Chart 1 (left): Vehicle Deliveries, single blue series, y-axis 0.0 to 0.5 millions of units, gridlines at each 0.1. Estimated values (about, not printed): 1Q-2021 about 0.18; 2Q-2021 about 0.20; 3Q-2021 about 0.24; 4Q-2021 about 0.31; 1Q-2022 about 0.31; 2Q-2022 about 0.25; 3Q-2022 about 0.34; 4Q-2022 about 0.40; 1Q-2023 about 0.42; 2Q-2023 about 0.47; 3Q-2023 about 0.43; 4Q-2023 about 0.48. No legend; the caption below reads Vehicle Deliveries (millions of units). Chart 2 (centre): clustered columns, y-axis 0 to 8 in $B, gridlines at each 1. Blue series Operating Cash Flow ($B), red series Free Cash Flow ($B). Estimated values (about): OCF 1Q-2021 about 1.6, 2Q-2021 about 2.1, 3Q-2021 about 3.1, 4Q-2021 about 4.6, 1Q-2022 about 4.0, 2Q-2022 about 2.3, 3Q-2022 about 5.1, 4Q-2022 about 3.3, 1Q-2023 about 2.5, 2Q-2023 about 3.0, 3Q-2023 about 3.3, 4Q-2023 about 4.3. FCF 1Q-2021 about 0.3, 2Q-2021 about 0.6, 3Q-2021 about 1.3, 4Q-2021 about 2.8, 1Q-2022 about 2.2, 2Q-2022 about 0.6, 3Q-2022 about 3.3, 4Q-2022 about 1.4, 1Q-2023 about 0.4, 2Q-2023 about 1.0, 3Q-2023 about 0.8, 4Q-2023 about 2.0. Chart 3 (right): clustered columns, y-axis 0 to 8 in $B, same gridlines. Blue series Net Income ($B), red series Adjusted EBITDA ($B). Estimated values (about): Net Income 1Q-2021 about 0.4, 2Q-2021 about 1.1, 3Q-2021 about 1.6, 4Q-2021 about 2.3, 1Q-2022 about 3.3, 2Q-2022 about 2.2, 3Q-2022 about 3.3, 4Q-2022 about 3.7, 1Q-2023 about 2.5, 2Q-2023 about 2.7, 3Q-2023 about 1.8, 4Q-2023 about 7.9. Adjusted EBITDA 1Q-2021 about 1.8, 2Q-2021 about 2.5, 3Q-2021 about 3.2, 4Q-2021 about 4.1, 1Q-2022 about 5.0, 2Q-2022 about 3.8, 3Q-2022 about 4.9, 4Q-2022 about 5.4, 1Q-2023 about 4.2, 2Q-2023 about 4.6, 3Q-2023 about 3.7, 4Q-2023 about 3.9. No values are printed and no points are highlighted. Quarter labels are rotated 90 degrees, reading bottom to top, in all three charts. Legend squares are small solid squares, blue and red, placed before each series name. No photographs, logos other than the faint TESLA wordmark, or icons.
Slide 23
KEY METRICS / TRAILING 12 MONTHS (TTM) / (Unaudited) / 2.0 / 1.8 / 1.6 / 1.4 / 1.2 / 1.0 / 0.8 / 0.6 / 0.4 / 0.2 / 0.0 / 1Q-2021 / 2Q-2021 / 3Q-2021 / 4Q-2021 / 1Q-2022 / 2Q-2022 / 3Q-2022 / 4Q-2022 / 1Q-2023 / 2Q-2023 / 3Q-2023 / 4Q-2023 / Vehicle Deliveries / (millions of units) / 20 / 18 / 16 / 14 / 12 / 10 / 8 / 6 / 4 / 2 / 0 / 1Q-2021 / 2Q-2021 / 3Q-2021 / 4Q-2021 / 1Q-2022 / 2Q-2022 / 3Q-2022 / 4Q-2022 / 1Q-2023 / 2Q-2023 / 3Q-2023 / 4Q-2023 / Operating Cash Flow ($B) / Free Cash Flow ($B) / 20 / 18 / 16 / 14 / 12 / 10 / 8 / 6 / 4 / 2 / 0 / 1Q-2021 / 2Q-2021 / 3Q-2021 / 4Q-2021 / 1Q-2022 / 2Q-2022 / 3Q-2022 / 4Q-2022 / 1Q-2023 / 2Q-2023 / 3Q-2023 / 4Q-2023 / Net Income ($B) / Adjusted EBITDA ($B) / 23
Visuals: Three clustered column charts, all with quarterly categories 1Q-2021 to 4Q-2023 on the x-axis (rotated 90 degrees, grey). Chart 1 (left): single-series column chart titled by caption 'Vehicle Deliveries (millions of units)'. Y-axis 0.0 to 2.0 in steps of 0.2, unit millions of units. Single series in blue, values about 0.59, 0.70, 0.80, 0.93, 1.06, 1.11, 1.21, 1.31, 1.42, 1.63, 1.72, 1.81 (no values are printed; all are estimates). No legend. Chart 2 (middle): two series, Operating Cash Flow ($B) in blue and Free Cash Flow ($B) in red. Y-axis 0 to 20 in steps of 2, unit $B. Operating Cash Flow about 8.0, 9.1, 9.9, 11.4, 13.8, 14.0, 16.0, 14.7, 13.2, 13.9, 12.1, 13.2. Free Cash Flow about 3.9, 4.1, 4.0, 5.0, 6.9, 6.9, 8.9, 7.5, 5.7, 6.1, 3.6, 4.3. Legend below the chart: blue square 'Operating Cash Flow ($B)' above red square 'Free Cash Flow ($B)'. No highlighted points. Chart 3 (right): two series, Net Income ($B) in blue and Adjusted EBITDA ($B) in red. Y-axis 0 to 20 in steps of 2, unit $B. Net Income about 1.1, 2.1, 3.4, 5.5, 8.3, 9.5, 11.1, 12.5, 11.7, 12.1, 10.7, 14.9. Adjusted EBITDA about 6.6, 7.9, 9.3, 11.5, 14.7, 16.0, 17.8, 19.1, 18.3, 19.2, 18.0, 16.5. Legend below: blue square 'Net Income ($B)' above red square 'Adjusted EBITDA ($B)'. No highlighted points. Bars are flat-filled rectangles, about 0.6% of slide width each, with two bars per quarter in the middle and right charts and one per quarter in the left chart; bars are drawn with a subtle vertical gradient, darker at the top of the blue bars. Gridlines run horizontally at each axis tick, light grey, hairline.
Slide 24
FINANCIAL STATEMENTS
Visuals: The only non-text visual is a small grey TESLA wordmark in the bottom-right corner, set in widely spaced capital letters with a stylised T, equals-sign-like E, S and L and A forms, rendered in a muted grey (about #6B6B6B). No photograph, chart or diagram.
Slide 25
STATEMENT OF OPERATIONS
(Unaudited)
In millions of USD or shares as applicable, except per share data Q4-2022 Q1-2023 Q2-2023 Q3-2023 Q4-2023
REVENUES
Automotive sales 20,241 18,878 20,419 18,582 20,630
Automotive regulatory credits 467 521 282 554 433
Automotive leasing 599 564 567 489 500
Total automotive revenues 21,307 19,963 21,268 19,625 21,563
Energy generation and storage 1,310 1,529 1,509 1,559 1,438
Services and other 1,701 1,837 2,150 2,166 2,166
Total revenues 24,318 23,329 24,927 23,350 25,167
COST OF REVENUES
Automotive sales 15,433 15,422 16,841 15,656 17,202
Automotive leasing 352 333 338 301 296
Total automotive cost of revenues 15,785 15,755 17,179 15,957 17,498
Energy generation and storage 1,151 1,361 1,231 1,178 1,124
Services and other 1,605 1,702 1,984 2,037 2,107
Total cost of revenues 18,541 18,818 20,394 19,172 20,729
Gross profit 5,777 4,511 4,533 4,178 4,438
OPERATING EXPENSES
Research and development 810 771 943 1,161 1,094
Selling, general and administrative 1,032 1,076 1,191 1,253 1,280
Restructuring and other 34 — — — —
Total operating expenses 1,876 1,847 2,134 2,414 2,374
INCOME FROM OPERATIONS 3,901 2,664 2,399 1,764 2,064
Interest income 157 213 238 282 333
Interest expense (33) (29) (28) (38) (61)
Other (expense) income, net (42) (48) 328 37 (145)
INCOME BEFORE INCOME TAXES 3,983 2,800 2,937 2,045 2,191
Provision for (benefit from) income taxes 276 261 323 167 (5,752)
NET INCOME 3,707 2,539 2,614 1,878 7,943
Net income (loss) attributable to noncontrolling interests and redeemable noncontrolling interests in subsidiaries 20 26 (89) 25 15
NET INCOME ATTRIBUTABLE TO COMMON STOCKHOLDERS 3,687 2,513 2,703 1,853 7,928
Net income per share of common stock attributable to common stockholders
Basic $ 1.18 $ 0.80 $ 0.85 $ 0.58 $ 2.49
Diluted $ 1.07 $ 0.73 $ 0.78 $ 0.53 $ 2.27
Weighted average shares used in computing net income per share of common stock
Basic 3,160 3,166 3,171 3,176 3,181
Diluted 3,471 3,468 3,478 3,493 3,492
25
Visuals: A financial statement table with five numeric columns (Q4-2022, Q1-2023, Q2-2023, Q3-2023, Q4-2023) and a label column, in millions of USD except per-share data. Rows, in order: REVENUES section label; Automotive sales 20,241 / 18,878 / 20,419 / 18,582 / 20,630; Automotive regulatory credits 467 / 521 / 282 / 554 / 433; Automotive leasing 599 / 564 / 567 / 489 / 500; Total automotive revenues (indented, regular) 21,307 / 19,963 / 21,268 / 19,625 / 21,563; Energy generation and storage 1,310 / 1,529 / 1,509 / 1,559 / 1,438; Services and other 1,701 / 1,837 / 2,150 / 2,166 / 2,166; Total revenues (bold) 24,318 / 23,329 / 24,927 / 23,350 / 25,167; COST OF REVENUES section label; Automotive sales 15,433 / 15,422 / 16,841 / 15,656 / 17,202; Automotive leasing 352 / 333 / 338 / 301 / 296; Total automotive cost of revenues 15,785 / 15,755 / 17,179 / 15,957 / 17,498; Energy generation and storage 1,151 / 1,361 / 1,231 / 1,178 / 1,124; Services and other 1,605 / 1,702 / 1,984 / 2,037 / 2,107; Total cost of revenues 18,541 / 18,818 / 20,394 / 19,172 / 20,729; Gross profit (bold) 5,777 / 4,511 / 4,533 / 4,178 / 4,438; OPERATING EXPENSES section label; Research and development 810 / 771 / 943 / 1,161 / 1,094; Selling, general and administrative 1,032 / 1,076 / 1,191 / 1,253 / 1,280; Restructuring and other 34 / — / — / — / —; Total operating expenses 1,876 / 1,847 / 2,134 / 2,414 / 2,374; INCOME FROM OPERATIONS (bold) 3,901 / 2,664 / 2,399 / 1,764 / 2,064; Interest income 157 / 213 / 238 / 282 / 333; Interest expense (33) / (29) / (28) / (38) / (61); Other (expense) income, net (42) / (48) / 328 / 37 / (145); INCOME BEFORE INCOME TAXES 3,983 / 2,800 / 2,937 / 2,045 / 2,191; Provision for (benefit from) income taxes 276 / 261 / 323 / 167 / (5,752); NET INCOME 3,707 / 2,539 / 2,614 / 1,878 / 7,943; Net income (loss) attributable to noncontrolling interests and redeemable noncontrolling interests in subsidiaries 20 / 26 / (89) / 25 / 15; NET INCOME ATTRIBUTABLE TO COMMON STOCKHOLDERS (bold) 3,687 / 2,513 / 2,703 / 1,853 / 7,928; a blank spacer row; Net income per share of common stock attributable to common stockholders (label only); Basic $1.18 / $0.80 / $0.85 / $0.58 / $2.49; Diluted $1.07 / $0.73 / $0.78 / $0.53 / $2.27; Weighted average shares used in computing net income per share of common stock (label only); Basic 3,160 / 3,166 / 3,171 / 3,176 / 3,181; Diluted 3,471 / 3,468 / 3,478 / 3,493 / 3,492. Highlighted: the Q4-2023 column is shaded light pink across its height, and the Q4-2022 to Q3-2023 values are unshaded. Grey bands mark section rows. No chart, photograph or diagram. Tesla wordmark logo at bottom right in very light grey, widely letter-spaced.
Slide 26
BALANCE SHEET
(Unaudited)
In millions of USD | 31-Dec-22 | 31-Mar-23 | 30-Jun-23 | 30-Sep-23 | 31-Dec-23
ASSETS
Current assets
Cash, cash equivalents and investments | 22,185 | 22,402 | 23,075 | 26,077 | 29,094
Accounts receivable, net | 2,952 | 2,993 | 3,447 | 2,520 | 3,508
Inventory | 12,839 | 14,375 | 14,356 | 13,721 | 13,626
Prepaid expenses and other current assets | 2,941 | 3,227 | 2,997 | 2,708 | 3,388
Total current assets | 40,917 | 42,997 | 43,875 | 45,026 | 49,616
Operating lease vehicles, net | 5,035 | 5,473 | 5,935 | 6,119 | 5,989
Solar energy systems, net | 5,489 | 5,427 | 5,365 | 5,293 | 5,229
Property, plant and equipment, net | 23,548 | 24,969 | 26,389 | 27,744 | 29,725
Operating lease right-of-use assets | 2,563 | 2,800 | 3,352 | 3,637 | 4,180
Digital assets, net | 184 | 184 | 184 | 184 | 184
Goodwill and intangible assets, net | 409 | 399 | 465 | 441 | 431
Deferred tax assets | 328 | 399 | 537 | 648 | 6,733
Other non-current assets | 3,865 | 4,185 | 4,489 | 4,849 | 4,531
Total assets | 82,338 | 86,833 | 90,591 | 93,941 | 106,618
LIABILITIES AND EQUITY
Current liabilities
Accounts payable | 15,255 | 15,904 | 15,273 | 13,937 | 14,431
Accrued liabilities and other | 8,205 | 8,378 | 8,684 | 8,530 | 9,080
Deferred revenue | 1,747 | 1,750 | 2,176 | 2,206 | 2,864
Current portion of debt and finance leases (1) | 1,502 | 1,404 | 1,459 | 1,967 | 2,373
Total current liabilities | 26,709 | 27,436 | 27,592 | 26,640 | 28,748
Debt and finance leases, net of current portion (1) | 1,597 | 1,272 | 872 | 2,426 | 2,857
Deferred revenue, net of current portion | 2,804 | 2,911 | 3,021 | 3,059 | 3,251
Other long-term liabilities | 5,330 | 5,979 | 6,924 | 7,321 | 8,153
Total liabilities | 36,440 | 37,598 | 38,409 | 39,446 | 43,009
Redeemable noncontrolling interests in subsidiaries | 409 | 407 | 288 | 277 | 242
Total stockholders' equity | 44,704 | 48,054 | 51,130 | 53,466 | 62,634
Noncontrolling interests in subsidiaries | 785 | 774 | 764 | 752 | 733
Total liabilities and equity | 82,338 | 86,833 | 90,591 | 93,941 | 106,618
(1) Breakdown of our debt is as follows:
Vehicle and energy product financing (non-recourse) | 2,001 | 1,708 | 1,475 | 3,660 | 4,613
Recourse debt | 44 | 44 | 44 | 44 | 44
Total debt excluding vehicle and energy product financing | 44 | 44 | 44 | 44 | 44
Days sales outstanding | 10 | 11 | 12 | 12 | 11
Days payable outstanding | 72 | 75 | 70 | 70 | 63
26
TESLA
Visuals: Table with 6 columns: a row-label column (left-aligned) and five right-aligned value columns headed 31-Dec-22, 31-Mar-23, 30-Jun-23, 30-Sep-23 and 31-Dec-23, with the header label 'In millions of USD' in the first column. Rows are listed in the text field in reading order with values in column order. Bold rows: Total assets, Total liabilities, Total liabilities and equity, Total debt excluding vehicle and energy product financing, Vehicle and energy product financing (non-recourse) is shown in bold label text and Total current assets and Total current liabilities are indented sub-totals. The 31-Dec-23 column (x about 90.5% to 95.4%, y about 14% to 93.5%) is filled with a light pink tint, approximately #F2DCDC, behind the values. Section header bands ASSETS and LIABILITIES AND EQUITY are light grey, approximately #F2F2F2, spanning the full table width at about y 16.2% to 18.1% and y 47.1% to 49.0%. Thin light grey horizontal rules, approximately #D9D9D9 and about 0.1% of slide height, separate rows. No charts, photographs or icons.
Slide 27
STATEMENT OF CASH FLOWS
(Unaudited)
In millions of USD / Q4-2022 / Q1-2023 / Q2-2023 / Q3-2023 / Q4-2023
CASH FLOWS FROM OPERATING ACTIVITIES
Net income
Adjustments to reconcile net income to net cash provided by operating activities:
Depreciation, amortization and impairment
Stock-based compensation
Deferred income taxes
Other
Changes in operating assets and liabilities
Net cash provided by operating activities
CASH FLOWS FROM INVESTING ACTIVITIES
Capital expenditures
Purchases of solar energy systems, net of sales
Purchases of investments
Proceeds from maturities of investments
Proceeds from sales of investments
Receipt of government grants
Business combinations, net of cash acquired
Net cash used in investing activities
CASH FLOWS FROM FINANCING ACTIVITIES
Net cash flows from other debt activities
Net (repayments) borrowings under vehicle and energy product financing
Net cash flows from noncontrolling interests – Solar
Other
Net cash (used in) provided by financing activities
Effect of exchange rate changes on cash and cash equivalents and restricted cash
Net (decrease) increase in cash and cash equivalents and restricted cash
Cash and cash equivalents and restricted cash at beginning of period
Cash and cash equivalents and restricted cash at end of period
27
TESLA
Visuals: A financial table, not a chart. Columns: row label, then Q4-2022, Q1-2023, Q2-2023, Q3-2023, Q4-2023, all values in millions of USD. Rows, with values as Q4-2022 / Q1-2023 / Q2-2023 / Q3-2023 / Q4-2023: CASH FLOWS FROM OPERATING ACTIVITIES (section band, no values). Net income: 3,707 / 2,539 / 2,614 / 1,878 / 7,943. Adjustments to reconcile net income to net cash provided by operating activities: (label only). Depreciation, amortization and impairment: 989 / 1,046 / 1,154 / 1,235 / 1,232. Stock-based compensation: 419 / 418 / 445 / 465 / 484. Deferred income taxes: (81) / (55) / (148) / (113) / (6,033). Other: 354 / 40 / (47) / 145 / 262. Changes in operating assets and liabilities: (2,110) / (1,475) / (953) / (302) / 482. Net cash provided by operating activities (bold): 3,278 / 2,513 / 3,065 / 3,308 / 4,370. CASH FLOWS FROM INVESTING ACTIVITIES (section band). Capital expenditures: (1,858) / (2,072) / (2,060) / (2,460) / (2,306). Purchases of solar energy systems, net of sales: (0) / (1) / (0) / 1 / (1). Purchases of investments: (4,368) / (2,015) / (5,075) / (6,131) / (5,891). Proceeds from maturities of investments: 19 / 1,604 / 3,539 / 3,816 / 3,394. Proceeds from sales of investments: — / — / 138 / — / —. Receipt of government grants: 76 / — / — / — / —. Business combinations, net of cash acquired: — / — / (76) / 12 / —. Net cash used in investing activities (bold): (6,131) / (2,484) / (3,534) / (4,762) / (4,804). CASH FLOWS FROM FINANCING ACTIVITIES (section band). Net cash flows from other debt activities: (162) / (127) / (124) / (140) / (141). Net (repayments) borrowings under vehicle and energy product financing: (335) / (294) / (233) / 2,194 / 952. Net cash flows from noncontrolling interests – Solar: (65) / (43) / (34) / (45) / (76). Other: 67 / 231 / 63 / 254 / 152. Net cash (used in) provided by financing activities (bold): (495) / (233) / (328) / 2,263 / 887. A blank spacer band. Effect of exchange rate changes on cash and cash equivalents and restricted cash: 123 / 50 / (94) / (98) / 146. Net (decrease) increase in cash and cash equivalents and restricted cash: (3,225) / (154) / (891) / 711 / 599. Cash and cash equivalents and restricted cash at beginning of period: 20,149 / 16,924 / 16,770 / 15,879 / 16,590. Cash and cash equivalents and restricted cash at end of period: 16,924 / 16,770 / 15,879 / 16,590 / 17,189. No charts, photographs or icons. The Q4-2023 column is highlighted with a pale pink tint running the full height of the table, and four light grey full-width section bands sit behind the section headers.
Slides 28 to 32 continue in the full text file.
Download this deck
The hosted PDF of every library deck is free for readers of the SlideDeck Co newsletter. Join with your email and the viewer and download appear here.
Preparing a results presentation or business update of your own? The SlideDeck Co Standard Deck is a slide library for business reviews, updates and plans.







