
The deck opens with a letter-style highlights slide summarising 2021 deliveries, cash flow and profitability, followed by a table of contents. It then moves through a financial summary for Q4 and full-year 2021, an operational summary of production, deliveries and infrastructure, and a vehicle capacity overview by factory. Core technology and other highlights cover Autopilot and FSD, energy storage and solar, and services. The outlook section sets out growth and cash expectations. Photos of factories follow, then key metrics charts and the full financial statements, including reconciliations of GAAP to non-GAAP measures. The closing slides contain webcast details, defined terms and forward-looking statement disclaimers. Worth studying are the highlights and financial summary tables, the vehicle capacity table with its status column, and the trailing twelve month charts that smooth quarterly swings.
Slides worth studying
Questions about this deck
What operating margin does the Tesla deck report for Q4 2021?
Slide 3 states a 14.7% operating margin in Q4, and slide 4 lists the Q4-2021 operating margin as 14.7%.
How many slides are in the Tesla presentation deck?
The Tesla deck has 37 slides. Slide 2, the table of contents, lists Additional Information starting on slide 36.
What does the Tesla deck say about installed vehicle capacity by factory?
Slide 9 lists installed annual capacity of 100,000 for Model S / Model X and 500,000 for Model 3 / Model Y at California. It also lists >450,000 for Model 3 / Model Y at Shanghai.
What growth outlook for vehicle deliveries does the Tesla deck give?
Slide 12 says that over a multi-year horizon, Tesla expects to achieve 50% average annual growth in vehicle deliveries. It adds that the rate of growth will depend on equipment capacity, operational efficiency and the capacity and stability of the supply chain.
Details
- Company: Tesla
- Year: 2021
- Type: Investor presentation
- Industry: Automotive
- Pages: 37
More from Tesla
- Tesla investor presentation, 2026
- Tesla investor presentation, 2025
- Tesla investor presentation, Q4 2023 update
- Tesla investor presentation, Q4 2024 update
- Tesla investor presentation, 2024 annual shareholder meeting
- Tesla investor presentation, Q4 2022 update
All Tesla decks in the library
Review score: 7 out of 10, Effective
Presentation quality, judged with the SlideDeck Co review heuristic. Ask, evidence and idea merit are not rated here.
The deck has a clear, consistent system: a contents slide (2), tidy section labels, shaded Q4 columns in the tables (4, 5, 7, 8) and red-versus-grey highlighting in the competitor charts (10). The route is logical, from highlights to financial summary, operations, capacity, technology, outlook, key metrics and statements, and the vehicle capacity table with its status column (9) is a standout. Weaknesses are real: slide 3 is a wall of small grey-on-grey text with the highlights spread across wide gaps, the tables on 4 to 8 and 30 to 35 are very dense with tiny footnotes, and slides 9 and 10 pair long paragraphs with small charts. The photo pages (14 to 25) carry only a small caption and no link to the argument, and the charts (27, 28) have no takeaway titles, so the audience has to find the message themselves.
Worth keeping: Keep the consistent section labels, the shaded Q4 column, the status table on slide 9, the red-against-grey peer comparison on slide 10 and the smoothed TTM charts on 28.
Most useful repair: Rewrite slide 3 so the key figures stand out at larger size with stronger contrast, and give the charts on 26 to 28 headline titles that state what they show.
What would change the score: I would shorten the paragraphs on 9 to 12 and enlarge the charts, and add a one-line point to each photo page or cut some of them.
Confidence medium. 37 of 37 pages inspected on contact sheets, 4 at readable size. Reviewed 2026-11-08. Model-assisted review (claude-sonnet-5-5).
Full text of the slides (37 slides)
Every slide's words and a description of its charts and images, so the deck can be searched and rebuilt. Also available as Markdown.
Slide 1
Q4 and FY2021 Update / 1
Visuals: One logo: the Tesla wordmark in the bottom-right corner, drawn as widely spaced, thin, squared capital letters T, E, S, L, A in light grey, roughly 7.5% of slide width and 1.3% of slide height, with no background or box. No photographs, charts, diagrams or other illustrations.
Slide 2
Highlights 03 / Financial Summary 04 / Operational Summary 07 / Vehicle Capacity 09 / Core Technology 10 / Other Highlights 11 / Outlook 12 / Photos & Charts 13 / Key Metrics 27 / Financial Statements 29 / Additional Information 36 / TESLA
Visuals: Visual elements: only the Tesla wordmark logo, set in small, widely letter-spaced capitals in light grey, in the bottom-right corner. There are no photographs, charts, icons or diagrams.
Slide 3
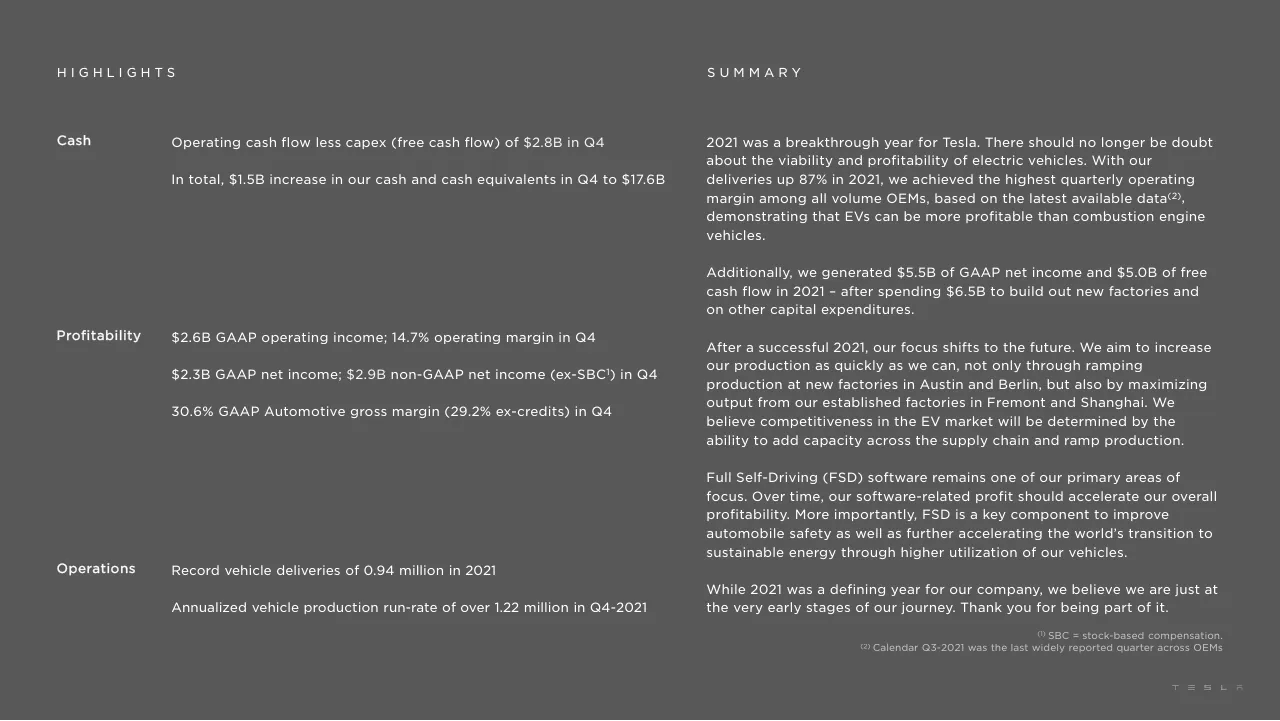
HIGHLIGHTS / SUMMARY / Cash / Operating cash flow less capex (free cash flow) of $2.8B in Q4 / In total, $1.5B increase in our cash and cash equivalents in Q4 to $17.6B / Profitability / $2.6B GAAP operating income; 14.7% operating margin in Q4 / $2.3B GAAP net income; $2.9B non-GAAP net income (ex-SBC) in Q4 / 30.6% GAAP Automotive gross margin (29.2% ex-credits) in Q4 / Operations / Record vehicle deliveries of 0.94 million in 2021 / Annualized vehicle production run-rate of over 1.22 million in Q4-2021 / 2021 was a breakthrough year for Tesla. There should no longer be doubt about the viability and profitability of electric vehicles. With our deliveries up 87% in 2021, we achieved the highest quarterly operating margin among all volume OEMs, based on the latest available data(2), demonstrating that EVs can be more profitable than combustion engine vehicles. / Additionally, we generated $5.5B of GAAP net income and $5.0B of free cash flow in 2021 – after spending $6.5B to build out new factories and on other capital expenditures. / After a successful 2021, our focus shifts to the future. We aim to increase our production as quickly as we can, not only through ramping production at new factories in Austin and Berlin, but also by maximizing output from our established factories in Fremont and Shanghai. We believe competitiveness in the EV market will be determined by the ability to add capacity across the supply chain and ramp production. / Full Self-Driving (FSD) software remains one of our primary areas of focus. Over time, our software-related profit should accelerate our overall profitability. More importantly, FSD is a key component to improve automobile safety as well as further accelerating the world’s transition to sustainable energy through higher utilization of our vehicles. / While 2021 was a defining year for our company, we believe we are just at the very early stages of our journey. Thank you for being part of it. / (1) SBC = stock-based compensation. / (2) Calendar Q3-2021 was the last widely reported quarter across OEMs
Slide 4
FINANCIAL SUMMARY
(Unaudited)
($ in millions, except percentages and per share data)
Q4-2020
Q1-2021
Q2-2021
Q3-2021
Q4-2021
YoY
Automotive revenues
9,314
9,002
10,206
12,057
15,967
71%
of which regulatory credits
401
518
354
279
314
-22%
Automotive gross profit
2,244
2,385
2,899
3,673
4,882
118%
Automotive gross margin
24.1%
26.5%
28.4%
30.5%
30.6%
648 bp
Total revenues
10,744
10,389
11,958
13,757
17,719
65%
Total gross profit
2,066
2,215
2,884
3,660
4,847
135%
Total GAAP gross margin
19.2%
21.3%
24.1%
26.6%
27.4%
813 bp
Operating expenses
1,491
1,621
1,572
1,656
2,234
50%
Income from operations
575
594
1,312
2,004
2,613
354%
Operating margin
5.4%
5.7%
11.0%
14.6%
14.7%
940 bp
Adjusted EBITDA
1,850
1,841
2,487
3,203
4,090
121%
Adjusted EBITDA margin
17.2%
17.7%
20.8%
23.3%
23.1%
586 bp
Net income attributable to common stockholders (GAAP)
270
438
1,142
1,618
2,321
760%
Net income attributable to common stockholders (non-GAAP)
903
1,052
1,616
2,093
2,879
219%
EPS attributable to common stockholders, diluted (GAAP)(1)
0.24
0.39
1.02
1.44
2.05
754%
EPS attributable to common stockholders, diluted (non-GAAP)(1)
0.80
0.93
1.45
1.86
2.54
218%
Net cash provided by operating activities
3,019
1,641
2,124
3,147
4,585
52%
Capital expenditures
(1,151)
(1,348)
(1,505)
(1,819)
(1,810)
57%
Free cash flow
1,868
293
619
1,328
2,775
49%
Cash and cash equivalents
19,384
17,141
16,229
16,065
17,576
-9%
(1)EPS = earnings per share.
4
TESLA
Visuals: Table. Columns: row label (($ in millions, except percentages and per share data)), Q4-2020, Q1-2021, Q2-2021, Q3-2021, Q4-2021 (pink-tinted column), YoY. Rows with values (Q4-2020 / Q1-2021 / Q2-2021 / Q3-2021 / Q4-2021 / YoY): Automotive revenues 9,314 / 9,002 / 10,206 / 12,057 / 15,967 / 71%; of which regulatory credits 401 / 518 / 354 / 279 / 314 / -22%; Automotive gross profit 2,244 / 2,385 / 2,899 / 3,673 / 4,882 / 118%; Automotive gross margin 24.1% / 26.5% / 28.4% / 30.5% / 30.6% / 648 bp; blank spacer row; Total revenues 10,744 / 10,389 / 11,958 / 13,757 / 17,719 / 65%; Total gross profit 2,066 / 2,215 / 2,884 / 3,660 / 4,847 / 135%; Total GAAP gross margin 19.2% / 21.3% / 24.1% / 26.6% / 27.4% / 813 bp; blank spacer row; Operating expenses 1,491 / 1,621 / 1,572 / 1,656 / 2,234 / 50%; Income from operations 575 / 594 / 1,312 / 2,004 / 2,613 / 354%; Operating margin 5.4% / 5.7% / 11.0% / 14.6% / 14.7% / 940 bp; blank spacer row; Adjusted EBITDA 1,850 / 1,841 / 2,487 / 3,203 / 4,090 / 121%; Adjusted EBITDA margin 17.2% / 17.7% / 20.8% / 23.3% / 23.1% / 586 bp; blank spacer row; Net income attributable to common stockholders (GAAP) 270 / 438 / 1,142 / 1,618 / 2,321 / 760%; Net income attributable to common stockholders (non-GAAP) 903 / 1,052 / 1,616 / 2,093 / 2,879 / 219%; blank spacer row; EPS attributable to common stockholders, diluted (GAAP)(1) 0.24 / 0.39 / 1.02 / 1.44 / 2.05 / 754%; EPS attributable to common stockholders, diluted (non-GAAP)(1) 0.80 / 0.93 / 1.45 / 1.86 / 2.54 / 218%; blank spacer row; Net cash provided by operating activities 3,019 / 1,641 / 2,124 / 3,147 / 4,585 / 52%; Capital expenditures (1,151) / (1,348) / (1,505) / (1,819) / (1,810) / 57%; Free cash flow 1,868 / 293 / 619 / 1,328 / 2,775 / 49%; Cash and cash equivalents 19,384 / 17,141 / 16,229 / 16,065 / 17,576 / -9%. No charts, photographs or logos other than the faint wordmark.
Slide 5
FINANCIAL SUMMARY / (Unaudited) / ($ in millions, except percentages and per share data) 2017 2018 2019 2020 2021 YoY / Automotive revenues 9,642 18,515 20,821 27,236 47,232 73% / of which regulatory credits 360 419 594 1,580 1,465 -7% / Automotive gross profit 2,209 4,341 4,423 6,977 13,839 98% / Automotive gross margin 22.9% 23.4% 21.2% 25.6% 29.3% 368 bp / Total revenues 11,759 21,461 24,578 31,536 53,823 71% / Total gross profit 2,223 4,042 4,069 6,630 13,606 105% / Total GAAP gross margin 18.9% 18.8% 16.6% 21.0% 25.3% 426 bp / Operating expenses 3,855 4,430 4,138 4,636 7,083 53% / (Loss) income from operations (1,632) (388) (69) 1,994 6,523 227% / Operating margin -13.9% -1.8% -0.3% 6.3% 12.1% 580 bp / Adjusted EBITDA 644 2,395 2,985 5,817 11,621 100% / Adjusted EBITDA margin 5.5% 11.2% 12.1% 18.4% 21.6% 315 bp / Net (loss) income attributable to common stockholders (GAAP) (1,962) (976) (862) 721 5,519 665% / Net (loss) income attributable to common stockholders (non-GAAP) (1,495) (227) 36 2,455 7,640 211% / EPS attributable to common stockholders, diluted (GAAP)(1) (2.37) (1.14) (0.98) 0.64 4.90 666% / EPS attributable to common stockholders, diluted (non-GAAP)(1) (1.80) (0.27) 0.03 2.24 6.78 203% / Net cash (used in) provided by operating activities (61) 2,098 2,405 5,943 11,497 93% / Capital expenditures (3,415) (2,101) (1,327) (3,157) (6,482) 105% / Free cash flow (3,476) (3) 1,078 2,786 5,015 80% / Cash and cash equivalents 3,368 3,686 6,268 19,384 17,576 -9% / 5 / (1)EPS = earnings per share. / TESLA
Visuals: One table. Columns: row label (about 4.6% to 38.6% wide), then 2017, 2018, 2019, 2020, 2021 and YoY. Header row is grey #7F7F7F with white text. Rows, top to bottom, with values in the order 2017 / 2018 / 2019 / 2020 / 2021 / YoY: Automotive revenues 9,642 / 18,515 / 20,821 / 27,236 / 47,232 / 73%; of which regulatory credits (indented) 360 / 419 / 594 / 1,580 / 1,465 / -7%; Automotive gross profit 2,209 / 4,341 / 4,423 / 6,977 / 13,839 / 98%; Automotive gross margin 22.9% / 23.4% / 21.2% / 25.6% / 29.3% / 368 bp; blank gap; Total revenues 11,759 / 21,461 / 24,578 / 31,536 / 53,823 / 71%; Total gross profit 2,223 / 4,042 / 4,069 / 6,630 / 13,606 / 105%; Total GAAP gross margin 18.9% / 18.8% / 16.6% / 21.0% / 25.3% / 426 bp; blank gap; Operating expenses 3,855 / 4,430 / 4,138 / 4,636 / 7,083 / 53%; (Loss) income from operations (1,632) / (388) / (69) / 1,994 / 6,523 / 227%; Operating margin -13.9% / -1.8% / -0.3% / 6.3% / 12.1% / 580 bp; blank gap; Adjusted EBITDA 644 / 2,395 / 2,985 / 5,817 / 11,621 / 100%; Adjusted EBITDA margin 5.5% / 11.2% / 12.1% / 18.4% / 21.6% / 315 bp; blank gap; Net (loss) income attributable to common stockholders (GAAP) (1,962) / (976) / (862) / 721 / 5,519 / 665%; Net (loss) income attributable to common stockholders (non-GAAP) (1,495) / (227) / 36 / 2,455 / 7,640 / 211%; blank gap; EPS attributable to common stockholders, diluted (GAAP) with superscript (1) (2.37) / (1.14) / (0.98) / 0.64 / 4.90 / 666%; EPS attributable to common stockholders, diluted (non-GAAP) with superscript (1) (1.80) / (0.27) / 0.03 / 2.24 / 6.78 / 203%; blank gap; Net cash (used in) provided by operating activities (61) / 2,098 / 2,405 / 5,943 / 11,497 / 93%; Capital expenditures (3,415) / (2,101) / (1,327) / (3,157) / (6,482) / 105%; Free cash flow (3,476) / (3) / 1,078 / 2,786 / 5,015 / 80%; Cash and cash equivalents 3,368 / 3,686 / 6,268 / 19,384 / 17,576 / -9%. The 2021 column cells are filled light pink, about #F4DADC, and the 2021 header is grey like the others. Alternate data rows are light grey #F2F2F2 and white #FFFFFF, with the row after each blank gap also grey. No chart, photo, or logo beyond the faint wordmark.
Slide 6
FINANCIAL SUMMARY
Revenue
Total revenue grew 65% YoY in Q4 to $17.7B. YoY, revenue was impacted by the following items:
+ growth in vehicle deliveries
+ growth in other parts of the business
Profitability
Our operating income improved to $2.6B in Q4 compared to the same period last year, resulting in a 14.7%
operating margin. This profit level was reached while incurring SBC expense attributable to the 2018 CEO award of $245M in Q4, driven by the final two operational milestones becoming probable. YoY, operating income was primarily impacted by the following items:
+ further per vehicle cost (COGS) reduction
+ growth in vehicle deliveries
+ improved profitability of automotive leasing and Service & Other business
- increase in SG&A driven mainly by $340M payroll tax on 2012 CEO award option exercise
- rising raw material, commodity, logistics and expedite costs
- increased warranty and recall cost related to a specific batch of vehicles
Cash
Quarter-end cash and cash equivalents increased sequentially by $1.5B to $17.6B in Q4, driven mainly by free cash flow of $2.8B, partially offset by net debt and finance lease repayments of $1.5B. Our total debt excluding vehicle and energy product financing has fallen to just $1.4B at the end of 2021.
6
TESLA
Visuals: None apart from a faint TESLA wordmark at bottom-right, set in widely spaced light grey capitals T E S L A in a thin sans-serif, which is a logo. No charts, photographs, tables or diagrams.
Slide 7
OPERATIONAL SUMMARY
(Unaudited)
(blank header cell) / Q4-2020 / Q1-2021 / Q2-2021 / Q3-2021 / Q4-2021 / YoY
Model S/X production / 16,097 / 0 / 2,340 / 8,941 / 13,109 / -19%
Model 3/Y production / 163,660 / 180,338 / 204,081 / 228,882 / 292,731 / 79%
Total production / 179,757 / 180,338 / 206,421 / 237,823 / 305,840 / 70%
Model S/X deliveries / 18,966 / 2,030 / 1,895 / 9,289 / 11,766 / -38%
Model 3/Y deliveries / 161,701 / 182,847 / 199,409 / 232,102 / 296,884 / 84%
Total deliveries / 180,667 / 184,877 / 201,304 / 241,391 / 308,650 / 71%
of which subject to operating lease accounting / 13,636 / 13,602 / 14,492 / 16,658 / 16,160 / 19%
Total end of quarter operating lease vehicle count / 72,089 / 83,032 / 95,491 / 108,757 / 120,342 / 67%
Global vehicle inventory (days of supply)(1) / 11 / 8 / 9 / 6 / 4 / -64%
Solar deployed (MW) / 86 / 92 / 85 / 83 / 85 / -1%
Storage deployed (MWh) / 1,584 / 445 / 1,274 / 1,295 / 978 / -38%
Store and service locations / 523 / 561 / 598 / 630 / 655 / 25%
Mobile service fleet(2) / 894 / 1,013 / 1,091 / 1,190 / 1,281 / 43%
Supercharger stations / 2,564 / 2,699 / 2,966 / 3,254 / 3,476 / 36%
Supercharger connectors / 23,277 / 24,515 / 26,900 / 29,281 / 31,498 / 35%
(1)Days of supply is calculated by dividing new car ending inventory by the relevant quarter’s deliveries and using 75 trading days (aligned with Automotive News definition).
(2)In Q2 2021, we began including mobile service vehicles dedicated to tire repair in our mobile service fleet total. Prior period totals have been adjusted to reflect this change.
7
TESLA
Visuals: Table, no chart or photo. Columns: row label, Q4-2020, Q1-2021, Q2-2021, Q3-2021, Q4-2021 (highlighted pink), YoY. Rows: Model S/X production 16,097 / 0 / 2,340 / 8,941 / 13,109 / -19%; Model 3/Y production 163,660 / 180,338 / 204,081 / 228,882 / 292,731 / 79%; Total production 179,757 / 180,338 / 206,421 / 237,823 / 305,840 / 70% (bold); Model S/X deliveries 18,966 / 2,030 / 1,895 / 9,289 / 11,766 / -38%; Model 3/Y deliveries 161,701 / 182,847 / 199,409 / 232,102 / 296,884 / 84%; Total deliveries 180,667 / 184,877 / 201,304 / 241,391 / 308,650 / 71% (bold); of which subject to operating lease accounting 13,636 / 13,602 / 14,492 / 16,658 / 16,160 / 19% (indented); Total end of quarter operating lease vehicle count 72,089 / 83,032 / 95,491 / 108,757 / 120,342 / 67%; Global vehicle inventory (days of supply)(1) 11 / 8 / 9 / 6 / 4 / -64%; Solar deployed (MW) 86 / 92 / 85 / 83 / 85 / -1%; Storage deployed (MWh) 1,584 / 445 / 1,274 / 1,295 / 978 / -38%; Store and service locations 523 / 561 / 598 / 630 / 655 / 25%; Mobile service fleet(2) 894 / 1,013 / 1,091 / 1,190 / 1,281 / 43%; Supercharger stations 2,564 / 2,699 / 2,966 / 3,254 / 3,476 / 36%; Supercharger connectors 23,277 / 24,515 / 26,900 / 29,281 / 31,498 / 35%. Alternating row bands are light grey, with the Q4-2021 column shaded light pink and the header row in mid grey with white text. The highlighted column and the total rows are the only emphasis; no values are estimated.
Slide 8
OPERATIONAL SUMMARY
(Unaudited)
2017 2018 2019 2020 2021 YoY
Model S/X production 98,339 101,553 62,931 54,805 24,390 -55%
Model 3/Y production 2,686 152,977 302,301 454,932 906,032 99%
Total production 101,025 254,530 365,232 509,737 930,422 83%
Model S/X deliveries 101,417 99,451 66,771 57,085 24,980 -56%
Model 3/Y deliveries 1,764 146,055 300,885 442,562 911,242 106%
Total deliveries 103,181 245,506 367,656 499,647 936,222 87%
of which subject to operating lease accounting 23,250 11,034 25,439 34,470 60,912 77%
Total end of year operating lease vehicle count 66,752 37,134 49,901 72,089 120,342 67%
Global vehicle inventory (days of supply) 28 22 13 15 6 -60%
Solar deployed (MW) 523 326 173 205 345 68%
Storage deployed (MWh) 358 1,041 1,651 3,022 3,992 32%
Store and service locations 330 378 433 523 655 25%
Mobile service fleet 218 411 758 894 1,281 43%
Supercharger stations 1,075 1,421 1,821 2,564 3,476 36%
Supercharger connectors 9,069 12,002 16,104 23,277 31,498 35%
(1) Before we adopted the new revenue accounting standard ASC 606 on January 1, 2018, operating leases included vehicle sales to customers or leasing partners with a resale value guarantee.
(2) Days of supply is calculated by dividing new car ending inventory by the relevant year’s deliveries and using 300 trading days (aligned with Automotive News definition).
(3) In 2021, we began including mobile service vehicles dedicated to tire repair in our mobile service fleet total. Prior period totals have been adjusted to reflect this change.
8
Visuals: No charts, photographs, diagrams or logos other than the small faint Tesla wordmark at bottom right. The single visual is a data table with columns: row label, 2017, 2018, 2019, 2020, 2021, YoY. Rows with values (2017 / 2018 / 2019 / 2020 / 2021 / YoY): Model S/X production 98,339 / 101,553 / 62,931 / 54,805 / 24,390 / -55%; Model 3/Y production 2,686 / 152,977 / 302,301 / 454,932 / 906,032 / 99%; Total production (bold) 101,025 / 254,530 / 365,232 / 509,737 / 930,422 / 83%; blank row; Model S/X deliveries 101,417 / 99,451 / 66,771 / 57,085 / 24,980 / -56%; Model 3/Y deliveries 1,764 / 146,055 / 300,885 / 442,562 / 911,242 / 106%; Total deliveries (bold) 103,181 / 245,506 / 367,656 / 499,647 / 936,222 / 87%; of which subject to operating lease accounting (indented, superscript 1) 23,250 / 11,034 / 25,439 / 34,470 / 60,912 / 77%; blank row; Total end of year operating lease vehicle count (superscript 1) 66,752 / 37,134 / 49,901 / 72,089 / 120,342 / 67%; Global vehicle inventory (days of supply) (superscript 2) 28 / 22 / 13 / 15 / 6 / -60%; blank row; Solar deployed (MW) 523 / 326 / 173 / 205 / 345 / 68%; Storage deployed (MWh) 358 / 1,041 / 1,651 / 3,022 / 3,992 / 32%; blank row; Store and service locations 330 / 378 / 433 / 523 / 655 / 25%; Mobile service fleet (superscript 3) 218 / 411 / 758 / 894 / 1,281 / 43%; blank row; Supercharger stations 1,075 / 1,421 / 1,821 / 2,564 / 3,476 / 36%; Supercharger connectors 9,069 / 12,002 / 16,104 / 23,277 / 31,498 / 35%. No chart axes, legend or highlighted data points beyond the pink 2021 column.
Slide 9
VEHICLE CAPACITY
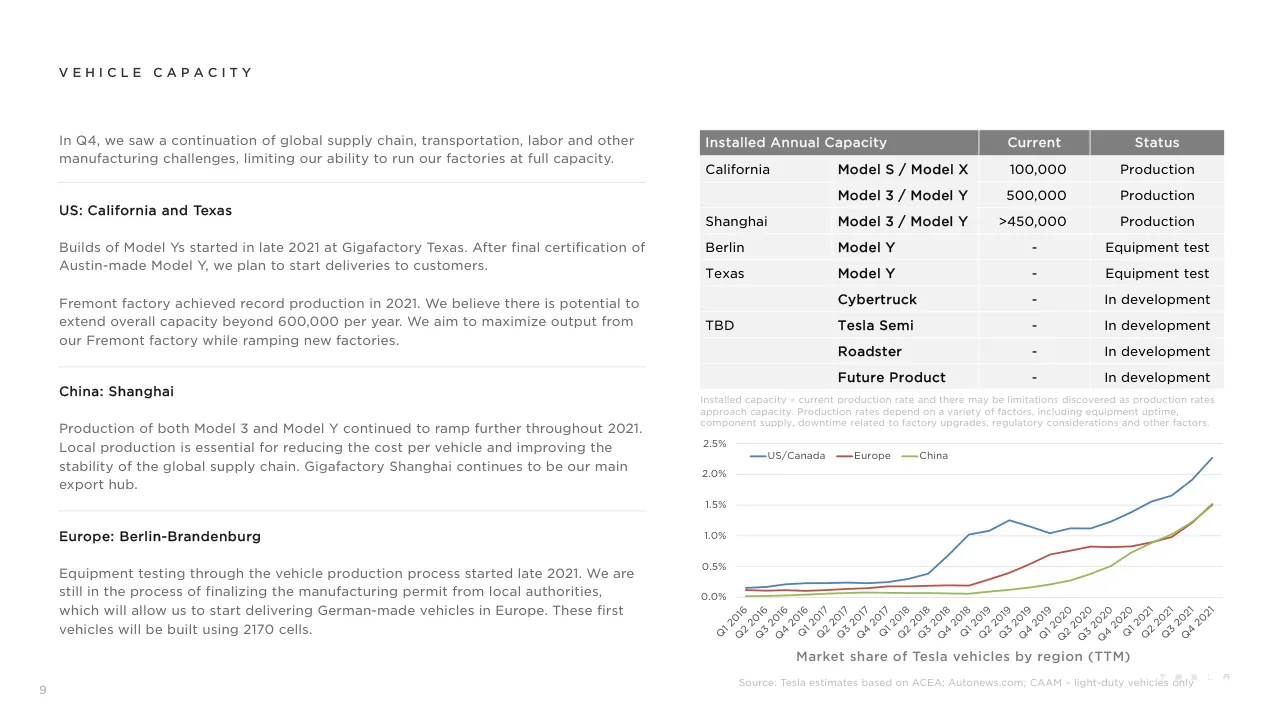
In Q4, we saw a continuation of global supply chain, transportation, labor and other manufacturing challenges, limiting our ability to run our factories at full capacity.
US: California and Texas
Builds of Model Ys started in late 2021 at Gigafactory Texas. After final certification of Austin-made Model Y, we plan to start deliveries to customers.
Fremont factory achieved record production in 2021. We believe there is potential to extend overall capacity beyond 600,000 per year. We aim to maximize output from our Fremont factory while ramping new factories.
China: Shanghai
Production of both Model 3 and Model Y continued to ramp further throughout 2021. Local production is essential for reducing the cost per vehicle and improving the stability of the global supply chain. Gigafactory Shanghai continues to be our main export hub.
Europe: Berlin-Brandenburg
Equipment testing through the vehicle production process started late 2021. We are still in the process of finalizing the manufacturing permit from local authorities, which will allow us to start delivering German-made vehicles in Europe. These first vehicles will be built using 2170 cells.
Installed Annual Capacity / Current / Status
California / Model S / Model X / 100,000 / Production
Model 3 / Model Y / 500,000 / Production
Shanghai / Model 3 / Model Y / >450,000 / Production
Berlin / Model Y / - / Equipment test
Texas / Model Y / - / Equipment test
Cybertruck / - / In development
TBD / Tesla Semi / - / In development
Roadster / - / In development
Future Product / - / In development
Installed capacity ≠ current production rate and there may be limitations discovered as production rates approach capacity. Production rates depend on a variety of factors, including equipment uptime, component supply, downtime related to factory upgrades, regulatory considerations and other factors.
2.5%
2.0%
1.5%
1.0%
0.5%
0.0%
US/Canada
Europe
China
Q1 2016 Q2 2016 Q3 2016 Q4 2016 Q1 2017 Q2 2017 Q3 2017 Q4 2017 Q1 2018 Q2 2018 Q3 2018 Q4 2018 Q1 2019 Q2 2019 Q3 2019 Q4 2019 Q1 2020 Q2 2020 Q3 2020 Q4 2020 Q1 2021 Q2 2021 Q3 2021 Q4 2021
Market share of Tesla vehicles by region (TTM)
Source: Tesla estimates based on ACEA; Autonews.com; CAAM – light-duty vehicles only
9
Visuals: Table: titled Installed Annual Capacity, with columns Installed Annual Capacity (location and model), Current, and Status. Rows: California, Model S / Model X, 100,000, Production; blank location, Model 3 / Model Y, 500,000, Production; Shanghai, Model 3 / Model Y, >450,000, Production; Berlin, Model Y, -, Equipment test; Texas, Model Y, -, Equipment test; blank, Cybertruck, -, In development; TBD, Tesla Semi, -, In development; blank, Roadster, -, In development; blank, Future Product, -, In development. Header row fill #7F7F7F with white text. Body rows alternate #F2F2F2 and white in the model column. No highlighted cells. Line chart: titled Market share of Tesla vehicles by region (TTM). Y axis labelled in percent, range 0.0% to 2.5% in 0.5% steps with light horizontal gridlines. X axis is quarterly from Q1 2016 to Q4 2021, labels rotated about 45 degrees. Three series with no printed data values; estimates: US/Canada (blue) about 0.15% at Q1 2016, about 0.25% at Q4 2017, about 1.0% at Q4 2018, about 1.25% at Q2 2019, about 1.1% at Q1 2020, about 1.6% at Q2 2021, about 2.27% at Q4 2021. Europe (red) about 0.1% at Q1 2016, about 0.2% at Q4 2018, about 0.7% at Q3 2019, about 0.85% at Q2 2020, about 1.0% at Q2 2021, about 1.5% at Q4 2021. China (green) about 0.02% at Q1 2016, about 0.07% at Q2 2018, about 0.2% at Q4 2019, about 0.4% at Q2 2020, about 0.9% at Q2 2021, about 1.5% at Q4 2021. Legend at top of plot area, horizontal, with line swatches: blue US/Canada, red Europe, green China. No highlighted points. Chart is flat, no fills or shadows.
Slide 10
CORE TECHNOLOGY
Autopilot and Full Self-Driving (FSD)
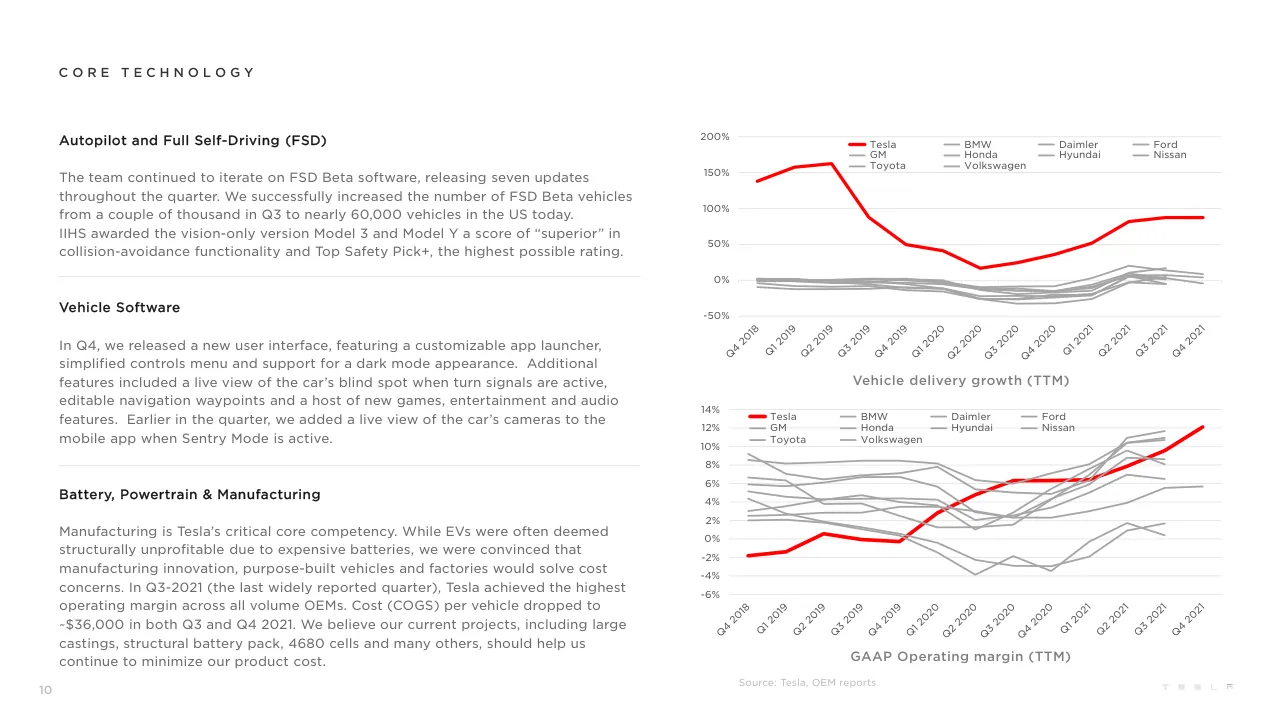
The team continued to iterate on FSD Beta software, releasing seven updates throughout the quarter. We successfully increased the number of FSD Beta vehicles from a couple of thousand in Q3 to nearly 60,000 vehicles in the US today.
IIHS awarded the vision-only version Model 3 and Model Y a score of “superior” in collision-avoidance functionality and Top Safety Pick+, the highest possible rating.
Vehicle Software
In Q4, we released a new user interface, featuring a customizable app launcher, simplified controls menu and support for a dark mode appearance. Additional features included a live view of the car’s blind spot when turn signals are active, editable navigation waypoints and a host of new games, entertainment and audio features. Earlier in the quarter, we added a live view of the car’s cameras to the mobile app when Sentry Mode is active.
Battery, Powertrain & Manufacturing
Manufacturing is Tesla’s critical core competency. While EVs were often deemed structurally unprofitable due to expensive batteries, we were convinced that manufacturing innovation, purpose-built vehicles and factories would solve cost concerns. In Q3-2021 (the last widely reported quarter), Tesla achieved the highest operating margin across all volume OEMs. Cost (COGS) per vehicle dropped to ~$36,000 in both Q3 and Q4 2021. We believe our current projects, including large castings, structural battery pack, 4680 cells and many others, should help us continue to minimize our product cost.
200%
150%
100%
50%
0%
-50%
Q4 2018
Q1 2019
Q2 2019
Q3 2019
Q4 2019
Q1 2020
Q2 2020
Q3 2020
Q4 2020
Q1 2021
Q2 2021
Q3 2021
Q4 2021
Tesla
BMW
Daimler
Ford
GM
Honda
Hyundai
Nissan
Toyota
Volkswagen
Vehicle delivery growth (TTM)
14%
12%
10%
8%
6%
4%
2%
0%
-2%
-4%
-6%
Tesla
BMW
Daimler
Ford
GM
Honda
Hyundai
Nissan
Toyota
Volkswagen
GAAP Operating margin (TTM)
Source: Tesla, OEM reports
10
Visuals: Two line charts stacked vertically on the right half. Chart 1 is titled Vehicle delivery growth (TTM), with a y-axis from -50% to 200% in 50% steps (labels 200%, 150%, 100%, 50%, 0%, -50%) and an x-axis of quarters Q4 2018 to Q4 2021 (13 labels, rotated about 45 degrees). Series: Tesla as a thick red line (about 138% at Q4 2018, about 157% at Q1 2019, about 162% at Q2 2019, about 88% at Q3 2019, about 49% at Q4 2019, about 41% at Q1 2020, about 17% at Q2 2020, about 25% at Q3 2020, about 36% at Q4 2020, about 52% at Q1 2021, about 82% at Q2 2021, about 88% at Q3 2021, about 88% at Q4 2021); nine thin grey lines for BMW, Daimler, Ford, GM, Honda, Hyundai, Nissan, Toyota and Volkswagen cluster between about -30% and +20% with no printed values. Legend sits inside the top of the plot in a four-column grid: Tesla, BMW, Daimler, Ford / GM, Honda, Hyundai, Nissan / Toyota, Volkswagen. Chart 2 is titled GAAP Operating margin (TTM), with a y-axis from -6% to 14% in 2% steps (labels 14%, 12%, 10%, 8%, 6%, 4%, 2%, 0%, -2%, -4%, -6%) and the same thirteen quarter labels. Series: Tesla as a thick red line (about -1.8% at Q4 2018, about -1.3% at Q1 2019, about 0.6% at Q2 2019, about 0% at Q3 2019, about -0.2% at Q4 2019, about 3% at Q1 2020, about 4.8% at Q2 2020, about 6.3% at Q3 2020, about 6.4% at Q4 2020, about 6.5% at Q1 2021, about 8% at Q2 2021, about 9.7% at Q3 2021, about 12.1% at Q4 2021); nine thin grey lines for the other OEMs with no printed values, spanning roughly -4% to 12%. Legend sits inside the top of the plot in the same four-column grid. No points are highlighted beyond the red Tesla series. Charts are drawn with no markers, no gridlines beyond faint horizontal rules, and no fill.
Slide 11
OTHER HIGHLIGHTS
Energy Storage
Energy storage deployments increased by 32% YoY in 2021, mainly driven by strong Megapack deployments. As demand remains substantially above capacity, growth has been limited by supply. We are in the process of building a dedicated Megapack factory to address the growing demand.
Solar Retrofit and Solar Roof
Solar deployments were 345 MW in 2021, increasing by 68% YoY, with cash/loan purchases accounting for nearly all solar deployments. Solar Roof deployments nearly tripled YoY in 2021 and continued to grow sequentially in Q4. We are making further cost improvements, particularly on installation, to increase energy profitability.
Services and Other
In 2021, Services and Other gross margin increased to -2.7%, the best performance in five years, nudging above break-even in Q4-2021. While used car sales remained strong in 2021, profit contribution from other parts of the business, such as service, merchandise and parts sales have improved as well.
Total Energy storage deployments in GWh
4.5
4.0
3.5
3.0
2.5
2.0
1.5
1.0
0.5
0.0
2018
2019
2020
2021
Residential solar deployed in MW
400
350
300
250
200
150
100
50
0
2018
2019
2020
2021
11
Visuals: Two vertical bar charts. Chart 1 (top): type vertical bar chart; title Total Energy storage deployments in GWh (centred below the axis, grey #7F7F7F); y-axis 0.0 to 4.5 in steps of 0.5, unitless with GWh implied by title; x-axis categories 2018, 2019, 2020, 2021; bars are about 1.05 (2018), about 1.65 (2019), about 3.03 (2020) and about 4.0 (2021) GWh, none of which are printed as data labels; bars are narrow rectangles with a vertical gradient from light coral #D9A0A0 at top to deep red #8E2B27 at the base; light grey horizontal gridlines every 0.5 units; no legend; no highlighted points. Chart 2 (bottom): type vertical bar chart; title Residential solar deployed in MW (centred below axis); y-axis 0 to 400 in steps of 50, unit MW; x-axis 2018, 2019, 2020, 2021; bars are about 250 (2018), about 148 (2019), about 195 (2020) and about 335 (2021) MW, none printed as data labels; bars have a vertical gradient from mid blue #3E74B0 at centre to dark navy-blue #2B5585 at top and base with slightly rounded top edges; light grey horizontal gridlines every 50 units; no legend; no highlighted points. Divider rules are light grey hairlines. The TESLA wordmark at bottom right is a small spaced-letter logo in pale grey #D0D0D0 with letters T E S L A.
Slide 12
OUTLOOK
Volume
We plan to grow our manufacturing capacity as quickly as possible. Over a multi-year horizon, we expect to achieve 50% average annual growth in vehicle deliveries. The rate of growth will depend on our equipment capacity, operational efficiency and the capacity and stability of the supply chain. Our own factories have been running below capacity for several quarters as supply chain became the main limiting factor, which is likely to continue through 2022.
Cash
We have sufficient liquidity to fund our product roadmap, long-term capacity expansion plans and other expenses.
Profit
While we continue to execute on innovations to reduce the cost of manufacturing and operations, over time, we expect our hardware-related profits to be accompanied with an acceleration of software-related profits.
Product
The pace of production ramps in Austin and Berlin will be influenced by the successful introduction of many new product and manufacturing technologies in new locations, ongoing supply-chain related challenges and regional permitting. We are making progress on the industrialization of Cybertruck, which is currently planned for Austin production subsequent to Model Y.
12
TESLA
Visuals: none. The only non-text marks are the faint TESLA wordmark in the bottom-right corner, shown as small widely spaced light grey capital letters T E S L A, which is a logo and is listed in elements.
Slide 13
PHOTOS & CHARTS
TESLA
Visuals: None apart from the small grey Tesla wordmark in the bottom-right corner, which is a logo. It is set as a row of five stylised letters (T, ≡, S, L, A-like form) in a flat grey, roughly 3.8% of slide width wide and under 1% of slide height tall.
Slide 14
FREMONT FACTORY - RECORD PRODUCTION IN 2021
14
TESLA
Visuals: One photograph of a factory interior at Fremont. Subject: a worker in a black cap, black sweatshirt with a small white logo, clear safety glasses and a light blue surgical mask, leaning forward and looking down into a blue car body structure on an assembly line. Behind him a second worker in black cap and black clothing sits near a white-wrapped wiring or padding element. In the background, a blue car body shell rises at upper centre, and other blue and red car bodies recede along the line on the left, with red robotic arms and red structural posts. Overhead, fluorescent light tubes and industrial ductwork are visible. A grey textured walkway with yellow-and-red floor markings runs along the lower left. Composition: landscape crop, worker positioned right of centre, car body framing him diagonally from upper centre to lower right. Lighting: bright, even factory lighting with specular highlights on the blue paint. Dominant colours: saturated cobalt blue #1F4FA3, red #C8102E, dark charcoal #2B2F36, grey #8A8F98. The photo is full-bleed within its frame, rectangular, not cropped to a shape, with no overlay or tint.
Slide 15
GIGAFACTORY BERLIN - GRAFFITI / 15 / TESLA
Visuals: One photograph of a painted mural on the side of a building, boxed as a rectangle, not full-bleed. Subject: a stylised black-and-white graphic mural on a pale concrete wall. On the left, a flat vivid blue sky. Black-and-grey geometric shapes include a stepped black triangle pattern at upper left and a tall black tower made of stacked grey-teal three-dimensional cuboid blocks with white window slits, next to a striped grey-and-white stack of blocks. A black lamp-like tower with white rectangular windows stands mid-frame. At lower right, a large black stylised hand with grey outlines holds a glossy pastel sphere shaded pink, lilac and teal. A band of dark magenta-purple with white pinstripes runs diagonally across the lower left, with white marks at the bottom edge. The right side shows a beige building wall, a window with grey glass and brown cladding panels, and a light concrete corner. Composition: low camera angle looking up, diagonal lines from lower left to upper right, mural filling most of the frame. Lighting: bright direct daylight with soft shadows. Dominant colours: sky blue #1F5FBF, concrete grey-white #D9D6CF, black #111111, magenta #8E3F7E, teal #5FC9C0, beige #CDBBA0. The photo is cropped by the rectangle edges; no overlay or tint.
Slide 16
GIGAFACTORY BERLIN - QUALITY CONTROL
16
Visuals: One photograph, boxed (not full-bleed), sharp corners, no overlay or tint. Subject: a glossy black Model Y being inspected inside a black arched inspection tunnel lined with white LED light strips, with the red TESLA wordmark on the black arch header. Two workers in yellow high-visibility vests and dark work clothes lean over the front of the car; the one on the right wears blue gloves and a face mask. The car's bodywork reflects bright white striped light. Composition is a centred, symmetrical one-point perspective view down the tunnel, with the car in the centre foreground. Lighting is bright, artificial and high-contrast, with industrial ceiling lights and factory machinery visible in the background. Dominant colours: black, white, red and yellow, with a grey reflective floor. Two small grey placard labels are visible on the tunnel pillars at left and right. Also present is a faint Tesla wordmark logo at bottom right, drawn in light grey.
Slide 17
GIGAFACTORY BERLIN - BODY SHOP
17
TESLA
Visuals: One photograph of an automotive body shop. Subject: two white-and-silver car body shells (unpainted steel/aluminium bodies in white-grey metal) standing on a conveyor in a central aisle, flanked on both sides by red KUKA industrial robot arms (about 8 to 10 visible arms, mounted on black cylindrical pedestals) that are welding the bodies; a shower of orange-yellow welding sparks falls from the top centre onto the upper body shell. Background shows a large factory hall with grey concrete columns, overhead piping, metal catwalks and staircases, racks, boxes and further robots in red and white. Composition: elevated, roughly centred, symmetrical view looking down the production line, with the bodies in the lower centre and the sparks in the upper centre. Lighting: diffuse, bright overhead factory light with warm sparks as the only saturated highlights. Dominant colours: red (#C8102E-like robot arms), silver-grey (#A9AFB5), concrete grey (#B9B9B4) and white. Full-bleed within a rectangular box, not cropped at the edges of the image, no overlay or tint. The photograph has no captions printed on it except small yellow labels on the robots.
Slide 18
GIGAFACTORY BERLIN - GENERAL ASSEMBLY
18
TESLA
Visuals: Photograph of the general assembly line at Tesla Gigafactory Berlin. The subject is a black vehicle body on a conveyor in the immediate foreground, seen from the rear-above, with its roof and windscreen facing the camera. Behind it a second black body sits on the line, and further back a row of bodies recedes toward a vanishing point at the centre. Workers in yellow high-visibility vests stand or walk along the line: a worker in a white hard hat and grey trousers walks at left, a worker in a white hard hat and yellow vest stands mid-distance, a worker in a yellow vest and face mask stands at right-centre, and a worker in a yellow vest and face mask leans at far right. Yellow and black hazard stripes mark the floor edges at the bottom of the frame. Overhead, white linear light fixtures run along the ceiling on both sides, and white and grey structural columns frame the aisle. Red gantry frames and red cable runs appear in the middle distance. Cardboard boxes sit on wire racks and carts on both sides, and monitors are mounted on arms. Framing is a wide, symmetrical one-point perspective, with the foreground car cropped by the bottom edge of the photograph. Lighting is bright, even and artificial from the overhead fixtures, with specular highlights on the car paint. Dominant colours are white, light grey, black, yellow and cardboard brown, with red accents. The photograph is boxed as a sharp-cornered rectangle inside the margins, not full-bleed, with no overlay or tint. Logo: a small faint Tesla wordmark at bottom-right, drawn in very light grey letters spaced apart.
Slide 19
GIGAFACTORY TEXAS - EXTERIOR
19
T E S L A
Visuals: One aerial drone photograph of the Gigafactory Texas exterior, shown as a rectangular, uncropped, unboxed image. Subject: a very large, flat-roofed, pale cream-white factory building with a long horizontal facade of grey-white panels and horizontal glazing bands, running diagonally across the frame from left to right. The roof is covered with rooftop equipment and construction materials. Surrounding it: a large paved parking lot with rows of parked cars on the left and right, construction cranes and yard equipment at the left-hand end, a red-roofed open pavilion beside the road, and a multi-lane divided highway in the foreground with grass medians, several trucks and cars travelling on it, and a red-roofed shelter at the bottom centre. In the background are flat horizon fields, dark tree lines, a small lake and a distant water tower. Composition: elevated three-quarter aerial view looking down at the building from the south-west, horizon near the upper-middle of the frame. Lighting: bright, clear daylight with low, soft sun. Dominant colours: pale blue sky (about #8DB8E0 at top fading to #DCE6EE near the horizon), cream-white building (about #E8E6DF), green grass (about #7A9A4A), grey asphalt (about #8C8E90), and dark green-brown tree lines (about #3E4A3A). No overlay or tint.
Slide 20
GIGAFACTORY TEXAS - GENERAL ASSEMBLY
20
TESLA
Visuals: One photograph of a general-assembly line at a factory. Subject: four or five blue car bodies (unpainted-style blue, front ends with exposed wiring and components) are carried on red wheeled carriers marked FRONT, each lifted on black bellows-style lift stands. The nearest carrier is in the foreground centre-right and reads FRONT in large white capitals on its red side. Behind it, further carriers recede toward a vanishing point at the left-centre. Overhead, red-painted rails and hanging blue cable hoses run across the upper half. Left foreground has stacked cardboard boxes with yellow wrap and a dark grey shelving stand with a red bin; right foreground has stacked cardboard boxes on pallets, a grey shelving rack, a dark grey stand with a red bin, and an orange forklift at the far right edge. Grey floor with a ribbed metal walkway and red-and-white hazard stripes. Two small grey signs read GA1-TR1-250 at left and GA1-TR1-250 at upper right. Composition is a wide, eye-level, centred view with the nearest car at about the horizontal centre. Lighting is bright, even overhead fluorescent light with a soft white haze. Dominant colours: white and light grey, saturated blue car bodies, red equipment, tan cardboard. The photograph is not cropped to a shape, is boxed with square corners, is not full-bleed, and has no overlay or tint. Also present: a small faint Tesla wordmark (spaced capitals T E S L A) in light grey at bottom right, a logo.
Slide 21
GIGAFACTORY TEXAS - PAINT SHOP
PAINT SHOP
21
T E S L A
Visuals: One photograph, boxed as a rectangle with square corners, not cropped to a shape and not full-bleed. Subject: an interior paint booth. Three robots wrapped in white protective suits with blue DURR logos on their arms stand around a car body shell. The shell is a dark-grey unpainted-looking body with a blue-tinted spray finish on its bonnet and front section, and a fine mist of spray visible above the bonnet. Two arms reach in from the left and one from the right, with one arm from the right reaching from above; the robots' hands rest on the body. Composition: centred, one-point perspective looking down the booth, with the car in the middle third and the floor leading to the vanishing point at the centre. Floor is black grated mesh. Walls and ceiling are covered in clear plastic sheeting, and two tall clear plastic-covered panels frame the left and right edges. Lighting: bright, diffuse, even overhead light with soft highlights on the white suits. Dominant colours: white, light grey, steel grey, black, and blue. No overlay or tint. Non-text elements also include a faint Tesla wordmark at bottom right, rendered in pale grey.
Slide 22
GIGAFACTORY TEXAS - ATTACHING SEATS TO A STRUCTURAL BATTERY PACK
22
Visuals: One photograph. Subject: an assembly line in the Tesla Gigafactory Texas. Two workers in black shirts, black caps and black face masks stand on grey perforated-steel platforms on either side of a red automated guided vehicle (AGV). The AGV carries a battery-pack frame with red lift posts, and on top of the frame sit two black car seats that are being attached. Red overhead gripper arms with blue spiral pneumatic hoses hang from the ceiling on both sides, and two black seats hang from chains at top centre. Side elements include wall-mounted monitors with green-and-black screens, metal shelving with cardboard boxes and blue bins at left and right, a yellow-tagged hanging chain, a 'KNIGHT' sign partly visible at top centre, and a worker kneeling in the background at centre. Composition: a central, roughly symmetrical one-point view down the line, camera at about waist height, wide framing showing the full width of the hall. Lighting: even overhead fluorescent tubes and daylight-neutral cool ambient light, no strong shadows. Dominant colours: red (#C8102E area), black, grey steel (#8A8F94), white ceiling, and blue hoses (#2F6FD0). The photo is not cropped at its edges, is boxed within the margins (not full-bleed), and has no overlay or tint.
Slide 23
GIGAFACTORY SHANGHAI - EXTERIOR / [photograph, no text] / 23 / T E S L A
Visuals: One photograph: an aerial, elevated view of the Tesla Gigafactory Shanghai complex, looking down and slightly oblique across the site. Subject: long, rectangular, flat-roofed factory halls with white and light-grey roof panels and rows of rooftop units, arranged in parallel bands; a straight dark access road runs vertically through the centre between the halls; a fenced storage yard at left holds many blue and red shipping containers and trucks; a canal runs diagonally at left; a yard of parked cars sits at upper right and along the right edge; a partly built steel-frame structure with yellow and red construction cranes sits at lower left; white office and utility buildings with rooftop cooling units appear at lower right; a blue-roofed building and low industrial blocks appear at upper left; flat reclaimed land, a green field and a waterway with a reddish-brown line lie at the edges. Composition: wide landscape frame, full scene visible, no crop of key buildings, viewpoint high and centred on the main halls. Lighting: even daylight with soft shadows, no strong sun glare. Dominant colours: white and light grey roofs, dark grey asphalt, beige and brown earth, blue and red containers, muted green fields. The photograph is a rectangular box with square corners, not full-bleed, with no overlay, tint or border. Its pixel size is 2776 by 1389.
Slide 24
GIGAFACTORY SHANGHAI - GENERAL ASSEMBLY
24
T E S L A
Visuals: One photograph, a wide landscape view of the General Assembly line at Gigafactory Shanghai. Looking upward from floor level, the underbody of a vehicle hangs from red padded overhead carrier arms that run diagonally into the distance on both sides. The top-centre underbody is dark grey metal with a black battery-pack tray and cable harness at upper left. Below it, a second vehicle body-in-white with a black front end and silver cross-member is suspended lower in the centre, and a third black body sits on a red lift frame further down the centre aisle. The scene has a wide-angle, slightly distorted perspective. Long rectangular fluorescent ceiling panels run along both sides, and grey-white steel structure and racking fill the background. Red safety rails, red carrier frames and red-and-white hangers line both sides of the aisle. Small green-text display screens hang on posts, and workers in high-visibility vests stand by the line. Dominant colours are red, white, light grey, dark grey and black, with cool neutral industrial lighting. The photo is not cropped and is shown as a rectangle inside the margins, not full-bleed on the slide, with no overlay or tint.
Slide 25
TESLA SEMI
25
Visuals: Photograph of four white Tesla Semi electric tractor units parked nose-to-tail side by side at a charging area, angled slightly toward the viewer, in a row from left to right with decreasing apparent size. Left foreground shows a white truck trailer partly behind a row of white cabinet-style equipment units (chargers/battery cabinets) with louvred vents. Foreground concrete curb and gravel lot; behind the trucks are a snow-dusted dark mountain range and a pale sky with warm sunset-lit clouds on the left turning to blue on the right. A white bollard stands in front of the first truck. Small text 'Tesla Inc. USDOT 2298268' is printed on the first truck's door. Lighting is low warm sunlight from the left, soft and golden on the sky and white bodies. Dominant colours: white, pale blue, warm peach, grey concrete and dark grey mountains. Framing is a wide landscape crop; the photograph is boxed, not full-bleed, sitting inside white margins with square corners and no overlay or tint.
Slide 26
CUMULATIVE PROFITABILITY SINCE INCEPTION / (Unaudited) / 6.0 / 4.0 / 2.0 / 0.0 / -2.0 / -4.0 / -6.0 / -8.0 / Pre-2010 / 2010 / 2011 / 2012 / 2013 / 2014 / 2015 / 2016 / 2017 / 2018 / 2019 / 2020 / 2021 / Net Income (Loss) Attributable to Common Stockholders ($B) / Retained Earnings (Accumulated Deficit) ($B) / 26
Visuals: Chart: vertical bar and line combo chart titled 'CUMULATIVE PROFITABILITY SINCE INCEPTION' with subtitle '(Unaudited)'. Y axis in $B, labelled 6.0, 4.0, 2.0, 0.0, -2.0, -4.0, -6.0, -8.0, range about -8.0 to 6.0, gridlines at each labelled value. X axis categories: Pre-2010, 2010, 2011, 2012, 2013, 2014, 2015, 2016, 2017, 2018, 2019, 2020, 2021. Series 1, Net Income (Loss) Attributable to Common Stockholders ($B), gradient-filled bars (light blue top, dark navy bottom): values are estimates, Pre-2010 about -0.3, 2010 about -0.2, 2011 about -0.3, 2012 about -0.4, 2013 about -0.1, 2014 about -0.3, 2015 about -0.9, 2016 about -0.7, 2017 about -2.0, 2018 about -1.0, 2019 about -0.9, 2020 about +0.7, 2021 about +5.6. Series 2, Retained Earnings (Accumulated Deficit) ($B), red line with no markers: values are estimates, Pre-2010 about -0.2, 2010 about -0.4, 2011 about -0.7, 2012 about -1.1, 2013 about -1.2, 2014 about -1.4, 2015 about -2.3, 2016 about -3.0, 2017 about -5.0, 2018 about -5.3, 2019 about -6.1, 2020 about -5.4, 2021 about +0.3. Legend below the chart, centred: blue gradient swatch followed by 'Net Income (Loss) Attributable to Common Stockholders ($B)', then red line swatch followed by 'Retained Earnings (Accumulated Deficit) ($B)'. No highlighted points. A solid black horizontal line marks the 0.0 value.
Slide 27
KEY METRICS QUARTERLY
(Unaudited)
0.4
5.0
5.0
4.0
4.0
3.0
3.0
0.3
2.0
2.0
1.0
1.0
0.2
0.0
0.0
-1.0
-1.0
-2.0
0.1
-3.0
-3.0
-4.0
-4.0
0.0
-5.0
-5.0
1Q-2019 2Q-2019 3Q-2019 4Q-2019 1Q-2020 2Q-2020 3Q-2020 4Q-2020 1Q-2021 2Q-2021 3Q-2021 4Q-2021
1Q-2019 2Q-2019 3Q-2019 4Q-2019 1Q-2020 2Q-2020 3Q-2020 4Q-2020 1Q-2021 2Q-2021 3Q-2021 4Q-2021
Operating Cash Flow ($B)
Free Cash Flow ($B)
Net Income ($B)
Adjusted EBITDA ($B)
Vehicle Deliveries
(millions of units)
27
Visuals: Three clustered column charts, all with light horizontal gridlines and no printed data labels. Chart 1: column chart titled Vehicle Deliveries (millions of units), one series, single blue column per quarter. Y-axis 0.0 to 0.4 in steps of 0.1 (millions of units). X-axis quarters 1Q-2019 to 4Q-2021, 12 columns. Estimated values (about, no values printed): 1Q-2019 about 0.063; 2Q-2019 about 0.094; 3Q-2019 about 0.096; 4Q-2019 about 0.110; 1Q-2020 about 0.087; 2Q-2020 about 0.090; 3Q-2020 about 0.138; 4Q-2020 about 0.179; 1Q-2021 about 0.183; 2Q-2021 about 0.200; 3Q-2021 about 0.240; 4Q-2021 about 0.308. Columns rise left to right, with the highest at 4Q-2021. No legend. Chart 2: clustered column chart, no chart title, legend beneath: blue square Operating Cash Flow ($B), red square Free Cash Flow ($B). Y-axis -5.0 to 5.0 in steps of 1.0 ($B). X-axis quarters 1Q-2019 to 4Q-2021. Blue series Operating Cash Flow, estimated (about): 1Q-2019 about -0.6; 2Q-2019 about 0.8; 3Q-2019 about 0.7; 4Q-2019 about 1.4; 1Q-2020 about -0.4; 2Q-2020 about 0.9; 3Q-2020 about 2.4; 4Q-2020 about 3.0; 1Q-2021 about 1.6; 2Q-2021 about 2.1; 3Q-2021 about 3.1; 4Q-2021 about 4.6. Red series Free Cash Flow, estimated (about): 1Q-2019 about -0.9; 2Q-2019 about 0.6; 3Q-2019 about 0.3; 4Q-2019 about 1.0; 1Q-2020 about -0.9; 2Q-2020 about 0.4; 3Q-2020 about 1.4; 4Q-2020 about 1.9; 1Q-2021 about 0.3; 2Q-2021 about 0.6; 3Q-2021 about 1.3; 4Q-2021 about 2.7. Each quarter has the blue column first, then the red column. No highlighted points. Chart 3: clustered column chart, no chart title, legend beneath: blue square Net Income ($B), red square Adjusted EBITDA ($B). Y-axis -5.0 to 5.0 in steps of 1.0 ($B). X-axis quarters 1Q-2019 to 4Q-2021. Blue series Net Income, estimated (about): 1Q-2019 about -0.7; 2Q-2019 about -0.4; 3Q-2019 about 0.1; 4Q-2019 about 0.1; 1Q-2020 about 0.0; 2Q-2020 about 0.1; 3Q-2020 about 0.3; 4Q-2020 about 0.2; 1Q-2021 about 0.4; 2Q-2021 about 1.1; 3Q-2021 about 1.6; 4Q-2021 about 2.3. Red series Adjusted EBITDA, estimated (about): 1Q-2019 about 0.1; 2Q-2019 about 0.5; 3Q-2019 about 1.0; 4Q-2019 about 1.1; 1Q-2020 about 0.9; 2Q-2020 about 1.2; 3Q-2020 about 1.8; 4Q-2020 about 1.8; 1Q-2021 about 1.8; 2Q-2021 about 2.5; 3Q-2021 about 3.2; 4Q-2021 about 4.1. Blue column first, red second in each quarter. No highlighted points.
Slide 28
KEY METRICS TRAILING 12 MONTHS (TTM)
(Unaudited)
1.0
0.8
0.6
0.4
0.2
0.0
Vehicle Deliveries
(millions of units)
12.0
10.0
8.0
6.0
4.0
2.0
0.0
-2.0
-4.0
-6.0
-8.0
-10.0
-12.0
1Q-2019 2Q-2019 3Q-2019 4Q-2019 1Q-2020 2Q-2020 3Q-2020 4Q-2020 1Q-2021 2Q-2021 3Q-2021 4Q-2021
Operating Cash Flow ($B)
Free Cash Flow ($B)
12.0
10.0
8.0
6.0
4.0
2.0
0.0
-2.0
-4.0
-6.0
-8.0
-10.0
-12.0
1Q-2019 2Q-2019 3Q-2019 4Q-2019 1Q-2020 2Q-2020 3Q-2020 4Q-2020 1Q-2021 2Q-2021 3Q-2021 4Q-2021
Net Income ($B)
Adjusted EBITDA ($B)
28
T E S L A
Visuals: Three vertical clustered bar charts with category axes of quarters 1Q-2019 to 4Q-2021 (12 quarters, labels rotated 90 degrees). Chart 1, left: Vehicle Deliveries (millions of units), single series, blue vertical gradient bars from about #3A6494 at the base to about #4A7CB8 at the top; value axis 0.0 to 1.0 in steps of 0.2 with light grey horizontal gridlines; no printed data labels. Estimated values: 1Q-2019 about 0.28, 2Q-2019 about 0.33, 3Q-2019 about 0.35, 4Q-2019 about 0.36, 1Q-2020 about 0.39, 2Q-2020 about 0.38, 3Q-2020 about 0.43, 4Q-2020 about 0.50, 1Q-2021 about 0.59, 2Q-2021 about 0.70, 3Q-2021 about 0.81, 4Q-2021 about 0.94. No legend; axis title below the chart. Chart 2, centre: value axis -12.0 to 12.0 in steps of 2.0 with light grey gridlines and a zero line; two series. Series Operating Cash Flow ($B) in blue #3B6FAF; series Free Cash Flow ($B) in red #B03A3A; each quarter has a blue bar then a red bar. No printed values; estimates: OCF 1Q-2019 about 1.8, 2Q-2019 about 2.8, 3Q-2019 about 2.2, 4Q-2019 about 2.3, 1Q-2020 about 2.5, 2Q-2020 about 2.6, 3Q-2020 about 4.3, 4Q-2020 about 5.9, 1Q-2021 about 8.0, 2Q-2021 about 9.1, 3Q-2021 about 9.9, 4Q-2021 about 11.5. FCF 1Q-2019 about 0.1, 2Q-2019 about 1.4, 3Q-2019 about 0.9, 4Q-2019 about 1.0, 1Q-2020 about 1.0, 2Q-2020 about 0.8, 3Q-2020 about 1.9, 4Q-2020 about 2.7, 1Q-2021 about 3.9, 2Q-2021 about 4.1, 3Q-2021 about 4.0, 4Q-2021 about 5.0. Legend below with blue and red square markers. Chart 3, right: value axis -12.0 to 12.0 in steps of 2.0 with light grey gridlines and a zero line; two series. Series Net Income ($B) in blue #3B6FAF; series Adjusted EBITDA ($B) in red #B03A3A. No printed values; estimates: Net Income 1Q-2019 about -1.0, 2Q-2019 about -0.6, 3Q-2019 about -0.8, 4Q-2019 about -0.9, 1Q-2020 about -0.1, 2Q-2020 about 0.3, 3Q-2020 about 0.5, 4Q-2020 about 0.7, 1Q-2021 about 1.0, 2Q-2021 about 2.1, 3Q-2021 about 3.4, 4Q-2021 about 5.5. Adjusted EBITDA 1Q-2019 about 2.5, 2Q-2019 about 2.9, 3Q-2019 about 2.8, 4Q-2019 about 2.9, 1Q-2020 about 3.7, 2Q-2020 about 4.4, 3Q-2020 about 5.1, 4Q-2020 about 5.7, 1Q-2021 about 6.6, 2Q-2021 about 8.0, 3Q-2021 about 9.3, 4Q-2021 about 11.5. Negative net income bars hang below zero. Legend below with blue and red square markers. No highlighted points.
Slide 29
FINANCIAL STATEMENTS
TESLA
Visuals: The Tesla wordmark logo in the bottom-right corner, rendered small in dim grey letterforms (spaced T, equals-style E, S, L, A glyphs). No photographs, charts or illustrations.
Slides 30 to 37 continue in the full text file.
Download this deck
The hosted PDF of every library deck is free for readers of the SlideDeck Co newsletter. Join with your email and the viewer and download appear here.
Preparing a results presentation or business update of your own? The SlideDeck Co Standard Deck is a slide library for business reviews, updates and plans.







