
The deck opens with a letter-style summary of 2020 highlights, covering volume, cash and profitability, followed by a short list of bullet highlights under those headings. It then moves through financial summaries for the quarter and full year, an operational summary of deliveries, production and deployments, and a vehicle capacity section covering the Fremont, Shanghai and Berlin factories. Core technology and other highlights follow, covering Autopilot, FSD, battery and powertrain, energy storage and solar. The outlook slide sets out the company's approach to volume, cash, profit and product for 2021. The back half is mostly reference material: photos of factories and vehicles, key metric charts, full financial statements, a reconciliation of GAAP to non-GAAP measures, and a closing section with forward-looking statements and definitions. Slides 4, 6 and 11 are the most useful to study for how a financial update pairs a summary table with a short narrative and a guidance section.
Slides worth studying
Questions about this deck
How many slides does the Tesla Q4 and FY2020 Update deck have?
The deck has 34 pages in total, as listed on the cover data for the presentation. Slide 2 gives its contents, with sections running from Highlights on slide 3 to Additional Information on slide 33.
What does the Tesla deck say about its 2021 volume outlook?
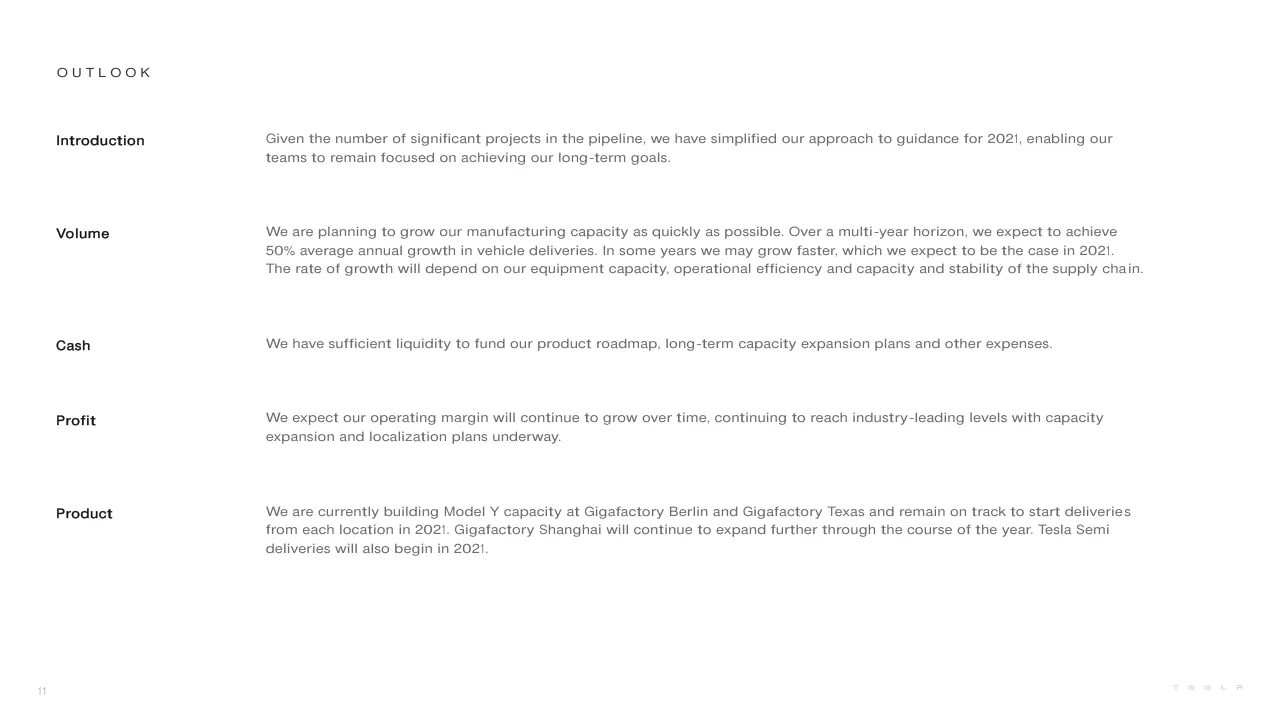
On slide 11, Tesla says that over a multi-year horizon it expects to achieve 50% average annual growth in vehicle deliveries. It also says that in some years it may grow faster, which it expects to be the case in 2021.
What does the Tesla deck say about energy storage deployments in 2020?
On slide 10, Tesla says that for the first time its total battery deployments surpassed 3 GWh in a single year, an 83% increase compared to the prior year. The slide attributes this growth mainly to the popularity of Megapack, its utility scale storage product.
How is the Tesla Q4 and FY2020 Update deck structured?
Slide 2 lists the contents: Highlights (slide 3), Financial Summary (slide 4), Operational Summary (slide 7), Vehicle Capacity (slide 8), Core Technology (slide 9), Other Highlights (slide 10), and Outlook (slide 11). The back half covers Photos and Charts (slide 12), Key Metrics (slide 25), Financial Statements (slide 27), and Additional Information (slide 33).
Details
- Company: Tesla
- Year: 2020
- Type: Investor presentation
- Industry: Automotive
- Pages: 34
More from Tesla
- Tesla investor presentation, 2026
- Tesla investor presentation, 2025
- Tesla investor presentation, Q4 2023 update
- Tesla investor presentation, Q4 2024 update
- Tesla investor presentation, 2024 annual shareholder meeting
- Tesla investor presentation, Q4 2022 update
All Tesla decks in the library
Review score: 7 out of 10, Effective
Presentation quality, judged with the SlideDeck Co review heuristic. Ask, evidence and idea merit are not rated here.
This is a competent, consistent investor update that follows a clear route: contents (2), highlights and summary (3), financial summary table and narrative (4 to 6), operations, capacity, technology, outlook (7 to 11), then photos, charts and statements as reference. The slide 4 table is well built, with grouped rows, a tinted current-quarter column and a YoY column, and the photo pages (13 to 24) are large and well captioned. The weaknesses are consequential: slides 3, 6, 9, 10 and 11 are small-type text blocks with no takeaway headings or visual emphasis, slide 9 packs three topics, a chart and a table into one page, and the statement pages 28 to 33 are tiny. It reads fine as a document sent ahead of an earnings call but would not work projected.
Worth keeping: Keep the slide 4 table structure with grouped metric rows, the tinted Q4-2020 column and the YoY column, plus the full-bleed captioned photos on 13 to 24 and the numbered contents on slide 2.
Most useful repair: Break up the dense prose on slides 3, 6, 9, 10 and 11 with a headline takeaway per section and larger key numbers, and split slide 9 into separate pages for Autopilot, battery and the acceleration comparison.
What would change the score: I would give the bulk of the summary-slide narrative to a few emphasized figures, add titles that state the point of each chart on 8, 10, 25 and 26, and label the axes and units more clearly.
Confidence medium. 34 of 34 pages inspected on contact sheets, 4 at readable size. Reviewed 2026-11-08. Model-assisted review (claude-sonnet-5-5).
Full text of the slides (34 slides)
Every slide's words and a description of its charts and images, so the deck can be searched and rebuilt. Also available as Markdown.
Slide 1
Q4 and FY2020 Update / TESLA
Visuals: Tesla wordmark logo in the bottom-right corner, rendered as small spaced white-grey letters T E S L A in a squared geometric style. No photographs, charts or other graphics.
Slide 2
Highlights / 03 / Financial Summary / 04 / Operational Summary / 07 / Vehicle Capacity / 08 / Core Technology / 09 / Other Highlights / 10 / Outlook / 11 / Photos & Charts / 12 / Key Metrics / 25 / Financial Statements / 27 / Additional Information / 33 / T E S L A
Visuals: No photographs, charts, tables or diagrams. The only non-text element is the Tesla wordmark in the bottom-right corner: the word TESLA set in widely letter-spaced, thin, geometric capitals in light grey (about #BFBFBF), small and horizontal, with no icon or mark beside it.
Slide 3
HIGHLIGHTS
SUMMARY
Cash
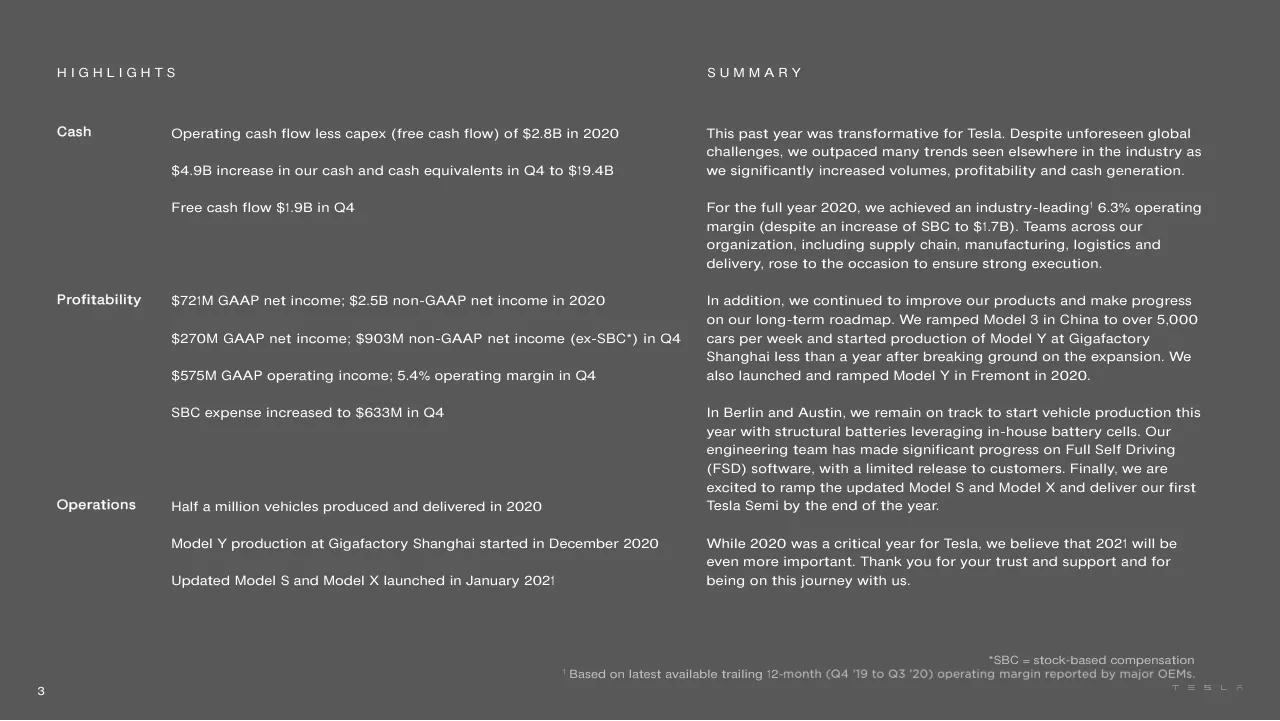
Operating cash flow less capex (free cash flow) of $2.8B in 2020
$4.9B increase in our cash and cash equivalents in Q4 to $19.4B
Free cash flow $1.9B in Q4
This past year was transformative for Tesla. Despite unforeseen global
challenges, we outpaced many trends seen elsewhere in the industry as
we significantly increased volumes, profitability and cash generation.
For the full year 2020, we achieved an industry-leading¹ 6.3% operating
margin (despite an increase of SBC to $1.7B). Teams across our
organization, including supply chain, manufacturing, logistics and
delivery, rose to the occasion to ensure strong execution.
Profitability
$721M GAAP net income; $2.5B non-GAAP net income in 2020
In addition, we continued to improve our products and make progress
on our long-term roadmap. We ramped Model 3 in China to over 5,000
cars per week and started production of Model Y at Gigafactory
$270M GAAP net income; $903M non-GAAP net income (ex-SBC*) in Q4
Shanghai less than a year after breaking ground on the expansion. We
$575M GAAP operating income; 5.4% operating margin in Q4
also launched and ramped Model Y in Fremont in 2020.
SBC expense increased to $633M in Q4
In Berlin and Austin, we remain on track to start vehicle production this
year with structural batteries leveraging in-house battery cells. Our
engineering team has made significant progress on Full Self Driving
(FSD) software, with a limited release to customers. Finally, we are
excited to ramp the updated Model S and Model X and deliver our first
Tesla Semi by the end of the year.
Operations
Half a million vehicles produced and delivered in 2020
Model Y production at Gigafactory Shanghai started in December 2020
While 2020 was a critical year for Tesla, we believe that 2021 will be
even more important. Thank you for your trust and support and for
Updated Model S and Model X launched in January 2021
being on this journey with us.
*SBC = stock-based compensation
¹ Based on latest available trailing 12-month (Q4 '19 to Q3 '20) operating margin reported by major OEMs.
3
Visuals: none apart from a small grey Tesla wordmark at bottom right; no charts, photographs or diagrams. Superscript markers ¹ and * refer to footnotes.
Slide 4
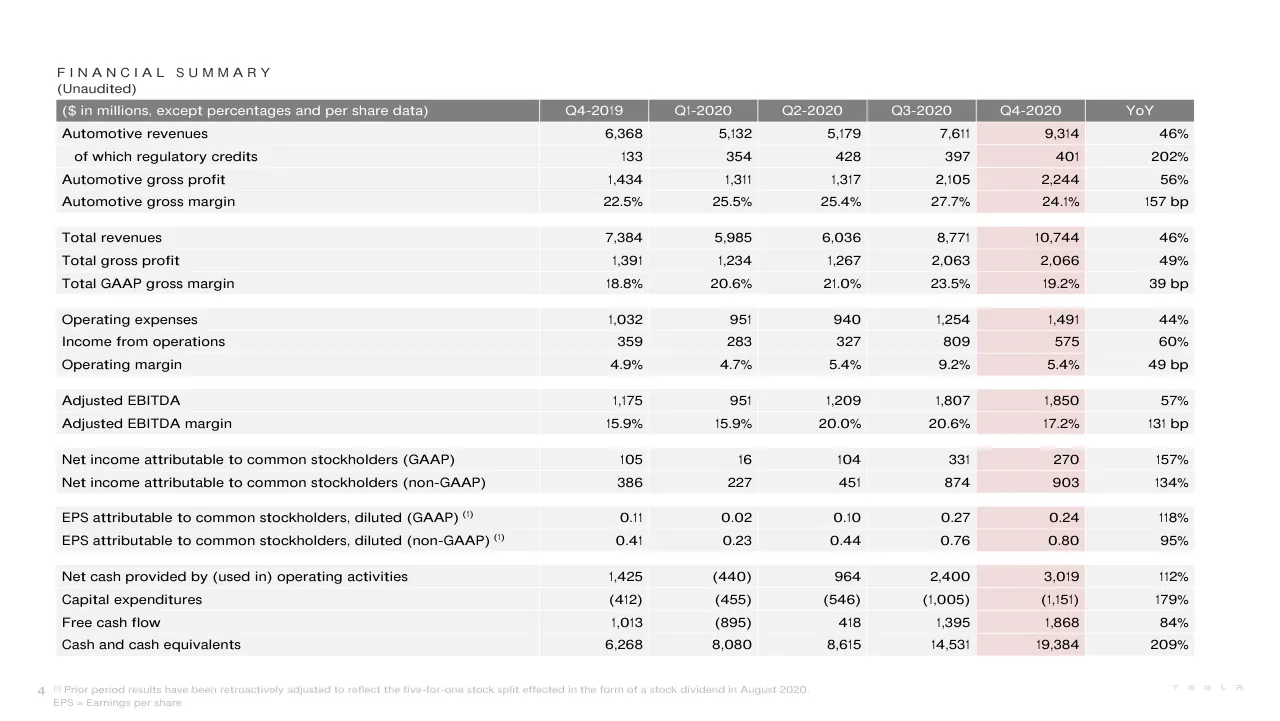
FINANCIAL SUMMARY / (Unaudited) / ($ in millions, except percentages and per share data) / Q4-2019 / Q1-2020 / Q2-2020 / Q3-2020 / Q4-2020 / YoY / Automotive revenues / 6,368 / 5,132 / 5,179 / 7,611 / 9,314 / 46% / of which regulatory credits / 133 / 354 / 428 / 397 / 401 / 202% / Automotive gross profit / 1,434 / 1,311 / 1,317 / 2,105 / 2,244 / 56% / Automotive gross margin / 22.5% / 25.5% / 25.4% / 27.7% / 24.1% / 157 bp / Total revenues / 7,384 / 5,985 / 6,036 / 8,771 / 10,744 / 46% / Total gross profit / 1,391 / 1,234 / 1,267 / 2,063 / 2,066 / 49% / Total GAAP gross margin / 18.8% / 20.6% / 21.0% / 23.5% / 19.2% / 39 bp / Operating expenses / 1,032 / 951 / 940 / 1,254 / 1,491 / 44% / Income from operations / 359 / 283 / 327 / 809 / 575 / 60% / Operating margin / 4.9% / 4.7% / 5.4% / 9.2% / 5.4% / 49 bp / Adjusted EBITDA / 1,175 / 951 / 1,209 / 1,807 / 1,850 / 57% / Adjusted EBITDA margin / 15.9% / 15.9% / 20.0% / 20.6% / 17.2% / 131 bp / Net income attributable to common stockholders (GAAP) / 105 / 16 / 104 / 331 / 270 / 157% / Net income attributable to common stockholders (non-GAAP) / 386 / 227 / 451 / 874 / 903 / 134% / EPS attributable to common stockholders, diluted (GAAP) (1) / 0.11 / 0.02 / 0.10 / 0.27 / 0.24 / 118% / EPS attributable to common stockholders, diluted (non-GAAP) (1) / 0.41 / 0.23 / 0.44 / 0.76 / 0.80 / 95% / Net cash provided by (used in) operating activities / 1,425 / (440) / 964 / 2,400 / 3,019 / 112% / Capital expenditures / (412) / (455) / (546) / (1,005) / (1,151) / 179% / Free cash flow / 1,013 / (895) / 418 / 1,395 / 1,868 / 84% / Cash and cash equivalents / 6,268 / 8,080 / 8,615 / 14,531 / 19,384 / 209% / 4 / (1) Prior period results have been retroactively adjusted to reflect the five-for-one stock split effected in the form of a stock dividend in August 2020. / EPS = Earnings per share / TESLA
Visuals: Table with 7 columns and 22 body rows plus a header row. Columns: row label, Q4-2019, Q1-2020, Q2-2020, Q3-2020, Q4-2020 (highlighted), YoY. Header row is a mid-grey #7F7F7F band with white Gotham text. Body rows alternate light grey #F2F2F2 bands separated by thin white gaps; the Q4-2020 column cells sit on a pale pink tint (about #F4DCDC). Rows: Automotive revenues 6,368 / 5,132 / 5,179 / 7,611 / 9,314 / 46%. of which regulatory credits 133 / 354 / 428 / 397 / 401 / 202%. Automotive gross profit 1,434 / 1,311 / 1,317 / 2,105 / 2,244 / 56%. Automotive gross margin 22.5% / 25.5% / 25.4% / 27.7% / 24.1% / 157 bp. Total revenues 7,384 / 5,985 / 6,036 / 8,771 / 10,744 / 46%. Total gross profit 1,391 / 1,234 / 1,267 / 2,063 / 2,066 / 49%. Total GAAP gross margin 18.8% / 20.6% / 21.0% / 23.5% / 19.2% / 39 bp. Operating expenses 1,032 / 951 / 940 / 1,254 / 1,491 / 44%. Income from operations 359 / 283 / 327 / 809 / 575 / 60%. Operating margin 4.9% / 4.7% / 5.4% / 9.2% / 5.4% / 49 bp. Adjusted EBITDA 1,175 / 951 / 1,209 / 1,807 / 1,850 / 57%. Adjusted EBITDA margin 15.9% / 15.9% / 20.0% / 20.6% / 17.2% / 131 bp. Net income attributable to common stockholders (GAAP) 105 / 16 / 104 / 331 / 270 / 157%. Net income attributable to common stockholders (non-GAAP) 386 / 227 / 451 / 874 / 903 / 134%. EPS attributable to common stockholders, diluted (GAAP) with superscript (1): 0.11 / 0.02 / 0.10 / 0.27 / 0.24 / 118%. EPS attributable to common stockholders, diluted (non-GAAP) with superscript (1): 0.41 / 0.23 / 0.44 / 0.76 / 0.80 / 95%. Net cash provided by (used in) operating activities 1,425 / (440) / 964 / 2,400 / 3,019 / 112%. Capital expenditures (412) / (455) / (546) / (1,005) / (1,151) / 179%. Free cash flow 1,013 / (895) / 418 / 1,395 / 1,868 / 84%. Cash and cash equivalents 6,268 / 8,080 / 8,615 / 14,531 / 19,384 / 209%. No photographs, charts or icons other than the faint TESLA wordmark.
Slide 5
FINANCIAL SUMMARY
(Unaudited)
($ in millions, except percentages and per share data) 2016 2017 2018 2019 2020 YoY
Automotive revenues 6,351 9,642 18,515 20,821 27,236 31%
of which regulatory credits 302 360 419 594 1,580 166%
Automotive gross profit 1,601 2,209 4,341 4,423 6,977 58%
Automotive gross margin 25.2% 22.9% 23.4% 21.2% 25.6% 437 bp
Total revenues 7,000 11,759 21,461 24,578 31,536 28%
Total gross profit 1,599 2,223 4,042 4,069 6,630 63%
Total GAAP gross margin 22.8% 18.9% 18.8% 16.6% 21.0% 447 bp
Operating expenses 2,267 3,855 4,430 4,138 4,636 12%
(Loss) income from operations (667) (1,632) (388) (69) 1,994 N/A
Operating margin -9.5% -13.9% -1.8% -0.3% 6.3% 660 bp
Adjusted EBITDA 832 644 2,395 2,985 5,817 95%
Adjusted EBITDA margin 11.9% 5.5% 11.2% 12.1% 18.4% 630 bp
Net (loss) income attributable to common stockholders (GAAP) (675) (1,962) (976) (862) 721 N/A
Net (loss) income attributable to common stockholders (non-GAAP) (341) (1,495) (227) 36 2,455 6,719%
EPS attributable to common stockholders, diluted (GAAP) (1) (0.94) (2.37) (1.14) (0.98) 0.64 N/A
EPS attributable to common stockholders, diluted (non-GAAP) (1) (0.47) (1.80) (0.27) 0.03 2.24 7,367%
Net cash (used in) provided by operating activities (124) (61) 2,098 2,405 5,943 147%
Capital expenditures (1,281) (3,415) (2,101) (1,327) (3,157) 138%
Free cash flow (1,405) (3,476) (3) 1,078 2,786 158%
Cash and cash equivalents 3,393 3,368 3,686 6,268 19,384 209%
5
(1) Prior period results have been retroactively adjusted to reflect the five-for-one stock split effected in the form of a stock dividend in August 2020.
EPS = Earnings per share
Visuals: Table. Columns: row label ($ in millions, except percentages and per share data), 2016, 2017, 2018, 2019, 2020, YoY. Rows in order with values as printed: Automotive revenues 6,351 / 9,642 / 18,515 / 20,821 / 27,236 / 31%; of which regulatory credits 302 / 360 / 419 / 594 / 1,580 / 166%; Automotive gross profit 1,601 / 2,209 / 4,341 / 4,423 / 6,977 / 58%; Automotive gross margin 25.2% / 22.9% / 23.4% / 21.2% / 25.6% / 437 bp; Total revenues 7,000 / 11,759 / 21,461 / 24,578 / 31,536 / 28%; Total gross profit 1,599 / 2,223 / 4,042 / 4,069 / 6,630 / 63%; Total GAAP gross margin 22.8% / 18.9% / 18.8% / 16.6% / 21.0% / 447 bp; Operating expenses 2,267 / 3,855 / 4,430 / 4,138 / 4,636 / 12%; (Loss) income from operations (667) / (1,632) / (388) / (69) / 1,994 / N/A; Operating margin -9.5% / -13.9% / -1.8% / -0.3% / 6.3% / 660 bp; Adjusted EBITDA 832 / 644 / 2,395 / 2,985 / 5,817 / 95%; Adjusted EBITDA margin 11.9% / 5.5% / 11.2% / 12.1% / 18.4% / 630 bp; Net (loss) income attributable to common stockholders (GAAP) (675) / (1,962) / (976) / (862) / 721 / N/A; Net (loss) income attributable to common stockholders (non-GAAP) (341) / (1,495) / (227) / 36 / 2,455 / 6,719%; EPS attributable to common stockholders, diluted (GAAP) with superscript (1): (0.94) / (2.37) / (1.14) / (0.98) / 0.64 / N/A; EPS attributable to common stockholders, diluted (non-GAAP) with superscript (1): (0.47) / (1.80) / (0.27) / 0.03 / 2.24 / 7,367%; Net cash (used in) provided by operating activities (124) / (61) / 2,098 / 2,405 / 5,943 / 147%; Capital expenditures (1,281) / (3,415) / (2,101) / (1,327) / (3,157) / 138%; Free cash flow (1,405) / (3,476) / (3) / 1,078 / 2,786 / 158%; Cash and cash equivalents 3,393 / 3,368 / 3,686 / 6,268 / 19,384 / 209%. The 2020 column cells are highlighted with a pale pink fill. Logo: a faint Tesla wordmark at bottom right, rendered in light grey letters.
Slide 6
FINANCIAL SUMMARY
Revenue
Total revenue grew 46% YoY in Q4. This was primarily achieved through substantial growth in vehicle deliveries as well as growth in other
parts of the business. At the same time, vehicle average selling price (ASP) declined by 11% YoY as our product mix continued to shift from
Model S and Model X to the more affordable Model 3 and Model Y.
Profitability
Our operating income improved in Q4 compared to the same period last year to $575M, resulting in a 5.4% operating margin. This
profit level was reached while incurring SBC expense attributable to the 2018 CEO award of $267M in Q4, driven by an increase in our
market capitalization and a new operational milestone becoming probable.
Positive impact from volume growth and regulatory credit revenue growth YoY was mainly offset by lower ASP (including price
reduction of China-made Model 3 and price reductions of Model S and Model X before the introduction of updated models) but also by
a series of notable items. These included a portion of Q4 SBC charges, vehicle warranty accruals, additional supply chain costs, Model
S and Model X changeover costs and other items.
Cash
Quarter-end cash and cash equivalents increased to $19.4B in Q4, driven mainly by our recent capital raise of $5.0B (average price of this
offering was ~$632/share) and free cash flow of $1.9B, partially offset by early debt repayments (early conversion of convertible notes).
6
TESLA
Visuals: None apart from a small, faint Tesla wordmark logo at bottom-right, drawn as letter-spaced capitals T E S L A in pale grey (about #D9D9D9), with no other photographs, charts, tables or icons on the slide.
Slide 7
OPERATIONAL SUMMARY / (Unaudited) / Q4-2019 / Q1-2020 / Q2-2020 / Q3-2020 / Q4-2020 / YoY / Model S/X production / 17,933 / 15,390 / 6,326 / 16,992 / 16,097 / -10% / Model 3/Y production / 86,958 / 87,282 / 75,946 / 128,044 / 163,660 / 88% / Total production / 104,891 / 102,672 / 82,272 / 145,036 / 179,757 / 71% / Model S/X deliveries / 19,475 / 12,230 / 10,614 / 15,275 / 18,966 / -3% / Model 3/Y deliveries / 92,620 / 76,266 / 80,277 / 124,318 / 161,701 / 75% / Total deliveries / 112,095 / 88,496 / 90,891 / 139,593 / 180,667 / 61% / of which subject to operating lease accounting / 8,848 / 6,104 / 4,716 / 10,014 / 13,636 / 54% / Total end of quarter operating lease vehicle count / 49,901 / 53,159 / 54,519 / 61,638 / 72,089 / 44% / Global vehicle inventory (days of supply)(1) / 10 / 25 / 17 / 14 / 11 / 10% / Solar deployed (MW) / 54 / 35 / 27 / 57 / 86 / 59% / Storage deployed (MWh) / 530 / 260 / 419 / 759 / 1,584 / 199% / Store and service locations / 433 / 438 / 446 / 466 / 523 / 21% / Mobile service fleet / 743 / 756 / 769 / 780 / 823 / 11% / Supercharger stations / 1,821 / 1,917 / 2,035 / 2,181 / 2,564 / 41% / Supercharger connectors / 16,104 / 17,007 / 18,100 / 19,437 / 23,277 / 45% / (1) Days of supply is calculated by dividing new car ending inventory by the quarter's deliveries and using 75 trading days (aligned with Automotive News definition). / 7
Visuals: A single data table, not a chart. Columns: row label (unnamed), Q4-2019, Q1-2020, Q2-2020, Q3-2020, Q4-2020, YoY. Header row is dark grey #7F7F7F bar with white text. Rows, values as printed: Model S/X production 17,933 / 15,390 / 6,326 / 16,992 / 16,097 / -10%; Model 3/Y production 86,958 / 87,282 / 75,946 / 128,044 / 163,660 / 88%; Total production (bold) 104,891 / 102,672 / 82,272 / 145,036 / 179,757 / 71%; blank spacer row; Model S/X deliveries 19,475 / 12,230 / 10,614 / 15,275 / 18,966 / -3%; Model 3/Y deliveries 92,620 / 76,266 / 80,277 / 124,318 / 161,701 / 75%; Total deliveries (bold) 112,095 / 88,496 / 90,891 / 139,593 / 180,667 / 61%; indented 'of which subject to operating lease accounting' 8,848 / 6,104 / 4,716 / 10,014 / 13,636 / 54%; blank spacer; Total end of quarter operating lease vehicle count 49,901 / 53,159 / 54,519 / 61,638 / 72,089 / 44%; Global vehicle inventory (days of supply)(1) 10 / 25 / 17 / 14 / 11 / 10%; blank spacer; Solar deployed (MW) 54 / 35 / 27 / 57 / 86 / 59%; Storage deployed (MWh) 530 / 260 / 419 / 759 / 1,584 / 199%; blank spacer; Store and service locations 433 / 438 / 446 / 466 / 523 / 21%; Mobile service fleet 743 / 756 / 769 / 780 / 823 / 11%; blank spacer; Supercharger stations 1,821 / 1,917 / 2,035 / 2,181 / 2,564 / 41%; Supercharger connectors 16,104 / 17,007 / 18,100 / 19,437 / 23,277 / 45%. Highlight: the Q4-2020 column data cells carry a pale pink tint (about #F2DCDB) over the grey banding. No bars, lines or charts. Row banding alternates light grey #F2F2F2 with white. No photographs, icons or logos besides the faint wordmark.
Slide 8
VEHICLE CAPACITY
Fremont
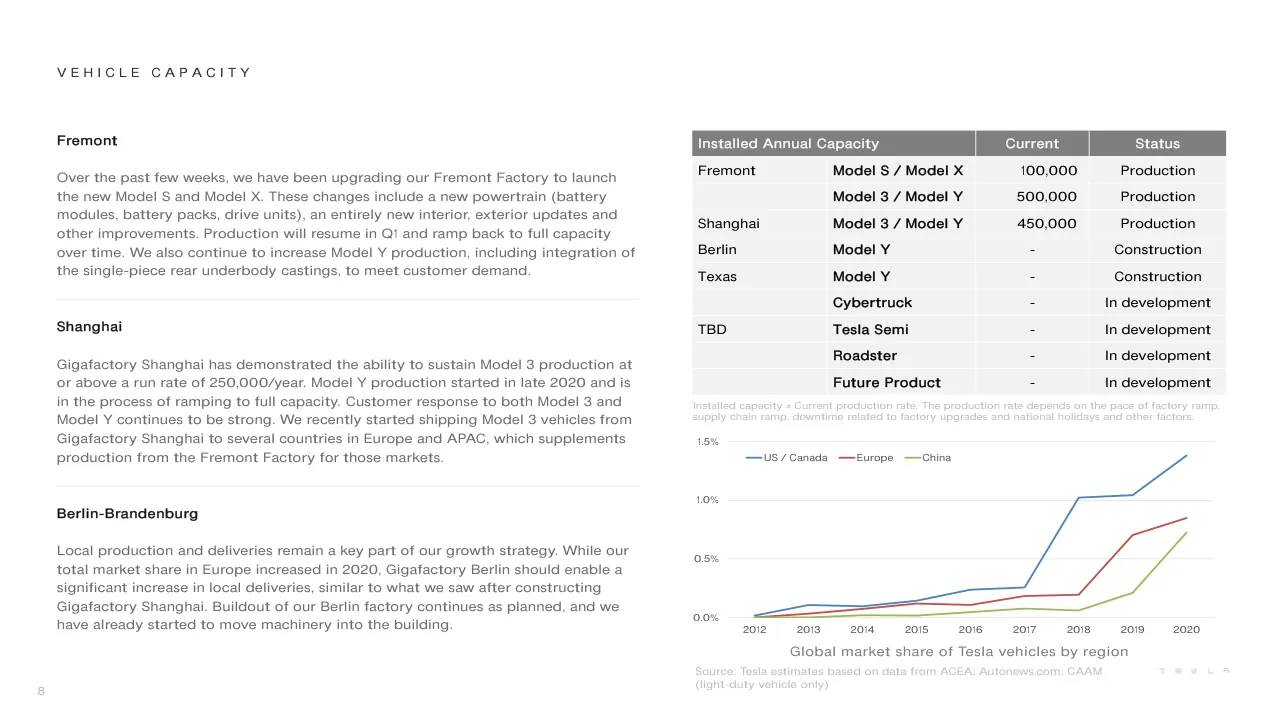
Over the past few weeks, we have been upgrading our Fremont Factory to launch the new Model S and Model X. These changes include a new powertrain (battery modules, battery packs, drive units), an entirely new interior, exterior updates and other improvements. Production will resume in Q1 and ramp back to full capacity over time. We also continue to increase Model Y production, including integration of the single-piece rear underbody castings, to meet customer demand.
Shanghai
Gigafactory Shanghai has demonstrated the ability to sustain Model 3 production at or above a run rate of 250,000/year. Model Y production started in late 2020 and is in the process of ramping to full capacity. Customer response to both Model 3 and Model Y continues to be strong. We recently started shipping Model 3 vehicles from Gigafactory Shanghai to several countries in Europe and APAC, which supplements production from the Fremont Factory for those markets.
Berlin-Brandenburg
Local production and deliveries remain a key part of our growth strategy. While our total market share in Europe increased in 2020, Gigafactory Berlin should enable a significant increase in local deliveries, similar to what we saw after constructing Gigafactory Shanghai. Buildout of our Berlin factory continues as planned, and we have already started to move machinery into the building.
Installed Annual Capacity
Current
Status
Fremont
Model S / Model X
100,000
Production
Model 3 / Model Y
500,000
Production
Shanghai
Model 3 / Model Y
450,000
Production
Berlin
Model Y
-
Construction
Texas
Model Y
-
Construction
Cybertruck
-
In development
TBD
Tesla Semi
-
In development
Roadster
-
In development
Future Product
-
In development
Installed capacity ≠ Current production rate. The production rate depends on the pace of factory ramp,
supply chain ramp, downtime related to factory upgrades and national holidays and other factors.
Global market share of Tesla vehicles by region
Source: Tesla estimates based on data from ACEA; Autonews.com; CAAM
(light-duty vehicle only)
8
Visuals: Table: titled Installed Annual Capacity with columns Installed Annual Capacity (merged header with the first two columns), Current and Status. Rows: Fremont | Model S / Model X | 100,000 | Production; (blank) | Model 3 / Model Y | 500,000 | Production; Shanghai | Model 3 / Model Y | 450,000 | Production; Berlin | Model Y | - | Construction; Texas | Model Y | - | Construction; (blank) | Cybertruck | - | In development; TBD | Tesla Semi | - | In development; (blank) | Roadster | - | In development; (blank) | Future Product | - | In development. Chart: line chart titled with no in-chart title, placed below the table. Y axis is percent of global market share, labelled 0.0%, 0.5%, 1.0% and 1.5% with light horizontal gridlines; range 0.0% to 1.5%. X axis is years 2012 to 2020, one label per year. Legend at top-left of plot: US / Canada (blue line), Europe (red line), China (green line). Values are not printed; estimates: US / Canada about 0.02% (2012), 0.11% (2013), 0.10% (2014), 0.14% (2015), 0.24% (2016), 0.26% (2017), 1.02% (2018), 1.04% (2019), 1.38% (2020). Europe about 0.00% (2012), 0.04% (2013), 0.08% (2014), 0.12% (2015), 0.11% (2016), 0.19% (2017), 0.20% (2018), 0.70% (2019), 0.85% (2020). China about 0.00% (2012), 0.00% (2013), 0.02% (2014), 0.02% (2015), 0.05% (2016), 0.08% (2017), 0.06% (2018), 0.22% (2019), 0.73% (2020). No highlighted points. Chart x-axis caption below: Global market share of Tesla vehicles by region. No photographs or illustrations. Logo: faint TESLA wordmark bottom-right in light grey.
Slide 9
CORE TECHNOLOGY
Autopilot & Full Self Driving (FSD)
Over the last few months, we released multiple software updates to our FSD City Streets beta testers.1 With each iteration, the system is becoming more robust, resulting in the widening of our user base. We continue to work on the development of our Dojo supercomputer. This computer is designed to process video data from our fleet and train our neural network at an extremely fast rate.
Vehicle Software
As has been the tradition in recent years, we released a holiday software update for our vehicles in December. This time, we included a variety of new games, enabled drivers to make an entrance with custom horn sounds through the external speaker and improved driving visualization among many other updates.
Battery & Powertrain
While our Model S and Model X battery module architecture evolved over the past 8 years, both the battery pack and modules have now been fully redesigned. Additionally, we have incorporated Model 3 and Model Y motor technology throughout as well as our heat pump for better winter range. These changes enable 5x more high-speed quarter-mile runs than the prior architecture, while further improving energy efficiency.
The Performance versions of Model S and Model X were replaced by Plaid, featuring a tri-motor powertrain with a unique high-speed, high-power rotor. Model S Plaid is the fastest accelerating production car ever made with a 0-60 mph time of <2.0 seconds and a quarter mile in under 9.3 seconds, faster than a Bugatti Chiron.
Sources: Tesla; OEM data
450
400
350
300
250
200
150
100
50
0
Jan-2019
Jan-2020
Jan-2021
Tesla Model S (AWD)
Highest range non-Tesla EV (AWD)
EPA est. range gap continues to widen
Model
0-60 mph
1/4 mile
Tesla Model S Plaid
<2.0 sec
<9.3 sec
Porsche 918 Spyder
2.1 sec
9.7 sec
Porsche 911 Turbo S (992)
2.2 sec
10.1 sec
Lamborghini Huracán Performante
2.2 sec
10.2 sec
Tesla Model S Performance
2.3 sec
10.4 sec
Dodge Challenger SRT Demon
2.3 sec
10.7 sec
Bugatti Chiron
2.4 sec
9.4 sec
Porsche Taycan Turbo S
2.4 sec
10.3 sec
Nissan GT-R Nismo
2.5 sec
10.8 sec
Bugatti Veyron
2.5 sec
9.9 sec
The fastest accelerating production cars ever made
Sources: Tesla; Auto Motor & Sport; Car and Driver; CarIndigo;
Carscoops; Hot Rod, Motor Trend; Road & Track; TopSpeed
TESLA
9
1 No revenue is recognized for software released for initial FSD City beta testers
Visuals: Bar chart (clustered columns), top right. Title: none printed inside chart; caption below legend reads 'EPA est. range gap continues to widen'. Axes: vertical axis 0 to 450, gridlines every 50, no unit printed; horizontal axis categories Jan-2019, Jan-2020, Jan-2021. Series 1 'Tesla Model S (AWD)' in dark red, series 2 'Highest range non-Tesla EV (AWD)' in steel blue. No data values are printed; estimates: Jan-2019 red about 335, blue about 235; Jan-2020 red about 373, blue about 254; Jan-2021 red about 412, blue about 268. Legend below the axis with small square swatches, red then blue. No highlighted points. Table below the chart: columns Model, 0-60 mph, 1/4 mile; 10 data rows as listed in elements; first row Tesla Model S Plaid is highlighted with a pale pink fill and values <2.0 sec and <9.3 sec. Caption under table reads 'The fastest accelerating production cars ever made'. No photographs or icons; one faint TESLA wordmark bottom-right.
Slide 10
OTHER HIGHLIGHTS
Energy Storage
Energy storage deployments grew substantially from 2019 to 2020. For the first time, our total battery deployments surpassed 3 GWh in a single year, which is an 83% increase compared to the prior year. This growth was driven mainly by the popularity of Megapack, our utility scale storage product. Powerwall demand continues to increase as the residential business continues to grow. While we have made progress on production, we should see even further increases in supply in the next few months.
Our energy storage business continues to be supply-constrained as backlog remains strong. We are looking to increase capacity both on the manufacturing equipment side as well as supply chain side, to allow us to continue to grow at a similar pace again in 2021.
Solar Retrofit and Solar Roof
In 2020, solar deployments increased to 205 MW, 18% more than the prior year. This growth is the result of meaningful improvements to our solar retrofit strategy, including product simplification, cost reduction and industry-leading pricing. We have also made great progress growing our Solar Roof deployments, as we have expanded the team while simultaneously improving our installation efficiency.
3.0
2.5
2.0
1.5
1.0
0.5
0.0
2015
2016
2017
2018
2019
2020
Tesla energy storage deployments in GWh
10
Visuals: Chart: vertical bar chart, six bars, one per year 2015 to 2020. Title: none printed above the chart; the x-axis title reads Tesla energy storage deployments in GWh. Y axis: 0.0 to 3.0, gridlines and tick labels every 0.5, no unit printed on the axis. X axis: categories 2015, 2016, 2017, 2018, 2019, 2020. Series: one series, energy storage deployments in GWh. No values are printed on the bars; estimated values: 2015 about 0.02 (a barely visible sliver), 2016 about 0.2, 2017 about 0.37, 2018 about 1.05, 2019 about 1.67, 2020 about 3.0 (bar reaches the top gridline). The 2020 value is the top of the axis range. Bars are filled with a dark red radial gradient, darker red edges (#8E2A2A) and lighter red centres (#B83C3C), with no outlines. Gridlines are thin light grey (#E0E0E0) horizontal lines at each 0.5 step with the baseline at 0.0 slightly darker. No legend and no highlighted points. Bar widths are equal, about 4.6% of the slide width each. Bar heights in % of slide height: 2016 1.5, 2017 2.7, 2018 7.7, 2019 12.2, 2020 22.5. Tesla wordmark: small letter-spaced grey logo at bottom right, light grey (#BABABA), about 4.5% wide.
Slide 11
OUTLOOK / Introduction / Given the number of significant projects in the pipeline, we have simplified our approach to guidance for 2021, enabling our / teams to remain focused on achieving our long-term goals. / Volume / We are planning to grow our manufacturing capacity as quickly as possible. Over a multi-year horizon, we expect to achieve / 50% average annual growth in vehicle deliveries. In some years we may grow faster, which we expect to be the case in 2021. / The rate of growth will depend on our equipment capacity, operational efficiency and capacity and stability of the supply chain. / Cash / We have sufficient liquidity to fund our product roadmap, long-term capacity expansion plans and other expenses. / Profit / We expect our operating margin will continue to grow over time, continuing to reach industry-leading levels with capacity / expansion and localization plans underway. / Product / We are currently building Model Y capacity at Gigafactory Berlin and Gigafactory Texas and remain on track to start deliveries / from each location in 2021. Gigafactory Shanghai will continue to expand further through the course of the year. Tesla Semi / deliveries will also begin in 2021. / 11 / TESLA
Slide 12
PHOTOS & CHARTS
TESLA
Slide 13
TESLA MODEL S - FRONT INTERIOR
13
Tesla logo (faint, bottom right)
Visuals: Photograph (1921 by 960 px), full-width boxed rectangle with square corners, not cropped by any overlay. Subject: interior of a Tesla Model S from the driver's seat looking forward through the windshield. A yoke-style steering wheel with a black rim and grey centre hub sits centre-left, with the 'TESLA' logo on the hub. The instrument cluster shows a small red Tesla car on a dark display. The centre touchscreen shows a games library: a banner for The Witcher 3: Wild Hunt with the character Geralt, and a row of seven game cover thumbnails (Witcher, Cat Quest, Fallout-style, Hotline-style, Stardew-style, and others). Above the windshield is a frameless rear-view mirror. Through the windshield is a hazy blue sky over pale mountain ranges. Red car bodies are visible at the left and right side windows. Lighting is soft, diffuse daylight from the windshield. Dominant colours: white and pale grey (#E9ECEF), walnut wood (#5A3A22), black (#1A1A1A), pale sky blue (#C9DCEB). Composition is centred and symmetrical, with the camera at eye level and a wide framing. Nothing is cropped at the edges except the side window edges.
Slide 14
TESLA MODEL S - REAR INTERIOR / 14 / TESLA
Visuals: One photograph of the rear seat area of a Tesla Model S. Subject: two rear seats with light grey perforated upholstery and dark headrests, a centre armrest with a wood-trim cup holder, and a seatback-mounted rear touchscreen at right showing a colourful cartoon game. Through the windows is a pale blue-grey sky over distant mountain ridges. A red car body panel is visible at the far left edge. Composition is a wide landscape view from the rear-left seat looking forward across the cabin, framed as a rectangle, not full-bleed, with slight cropping at the image edges. Lighting is soft, even daylight from the windows. Dominant colours are light grey, charcoal, blue-grey sky and red at the left edge. The image is boxed with no overlay or tint.
Slide 15
TESLA MODEL S PLAID - EXTERIOR / 15 / T E S L A (logo)
Visuals: Photograph of a red Tesla Model S Plaid in three-quarter front view, driving left to right on a grey asphalt road with white lane markings. Background is a pale blue hazy sky, a range of snow-dusted mountains and a flat green grassy plain. The car casts a soft shadow on the road; the road and lower right foreground show horizontal motion blur, implying speed. Lighting is soft daylight from the upper left, with bright highlights on the red bodywork and white LED headlight. Dominant colours are red, pale blue, grey and green. The photo is a rectangular box, not cropped, not full-bleed, with no overlay or tint. Wordmark at bottom right is a small, very light grey Tesla logo with letter spacing.
Slide 16
GIGAFACTORY SHANGHAI - MODEL Y DIE CAST / 16 / T E S L A
Visuals: One photograph of an interior factory hall at the Gigafactory Shanghai die-casting area. Subject: three large red protective enclosures with rounded, sloped tops and red-painted lower skirts, each sitting over a die-casting press. Two of the enclosures are at the centre and upper right, and a third is partly visible at the top right. Between them and in front, a large light-grey enclosure with a sloped top and a yellow handrail is in the lower centre and right. Yellow industrial robot arms are visible inside the open red enclosures. In the foreground left are rows of white electrical cabinets with yellow safety railings. A steel conveyor or pipe run with a green stripe crosses the upper left, and gantry steel framework and an overhead crane hook hang at the top. Two workers in white hard hats and hi-vis vests stand on a yellow-railed platform at right centre. A stencilled label on the grey enclosure at lower centre reads DCC 6000 with smaller text beneath it. Composition is an elevated three-quarter view looking down across the hall. The photo is rectangular, not cropped to a shape, and not full-bleed. Lighting is flat, even industrial overhead light. Dominant colours are red #C8102E, light grey #D9D9D9, white #F2F2F2, yellow #F5C400, and dark steel grey #4A4A4A. No overlay or tint is applied.
Slide 17
GIGAFACTORY SHANGHAI - MODEL Y STAMPING / 17
Visuals: One photograph, boxed (not full-bleed, not cropped), spanning about 91% of slide width and 81% of slide height. Subject: an interior view of a vehicle-body stamping area in a large factory hall. A long grey enclosure with the TESLA wordmark in dark grey capitals runs across the right half, with a red horizontal stripe along its upper edge and red-and-white handrails and a stair on its face. In the foreground, a stainless steel work table on casters stands on a grey floor pad; two workers in dark work clothes, one in a yellow high-visibility vest, lean over it. A third worker in dark clothing stands at left beside a white frame and a black-and-red rack of stacked panels labelled REV B. Two wall monitors show green panel images. There is a yellow safety column at right, blue storage bins on the right, and a red overhead crane at top right. Framing is a wide, slightly low, one-point perspective view from the front left. Lighting is bright overhead industrial lighting with white fluorescent tubes and high-bay lamps, giving a neutral cool-white tone. Dominant colours: white, light grey, red accents, blue bins, yellow safety elements. No overlay or tint.
Slide 18
GIGAFACTORY SHANGHAI - MODEL Y BODY SHOP
18
TESLA
Visuals: One photograph, boxed and not cropped, spanning the content width below the title. Subject: an automotive body shop with red KUKA industrial robots. Six or more articulated red robot arms with black cable conduits stand on black cylindrical pedestals at the left, right and centre foreground, and reach toward a silver-grey Model Y body-in-white on a red fixture line. Two robot tool heads carry grey plastic protective wrapping. Composition is a symmetrical one-point perspective looking down the production line, with the body centred. Lighting is even, bright overhead factory light with soft shadows. Dominant colours are red (#D7261E approx.), silver-grey (#A9AEB3 approx.), black (#1A1A1A approx.) and white (#F2F2F2 approx.). Blue barrier panels and grey structural columns appear at the edges. Robot labels read KUKA in yellow-orange on black. No overlay or tint.
Slide 19
GIGAFACTORY SHANGHAI - MODEL Y GENERAL ASSEMBLY
19
TESLA
Visuals: One photograph, a wide landscape image of a factory general assembly line. Subject: a dark slate-grey Tesla Model Y on a conveyor/assembly track, viewed from an elevated three-quarter front angle, with its driver-side front door open. A worker in a yellow high-visibility vest, black long-sleeve top, dark trousers, blue bouffant cap, face mask and white gloves stands at the open door and is pulling it. Further left, another worker in a yellow vest and blue cap leans over the car's front area, and several more workers in yellow vests and blue caps are visible down the line, with more vehicles queued in the distance. Lighting: bright, cool-white artificial light from angled overhead fluorescent light banks and vertical light panels lining both sides of the hall, producing strong specular reflections on the car's paint and floor. Dominant colours: white, light grey, slate blue-grey (car), yellow (vests), blue (caps), dark grey floor plates. Composition: the car is in the lower-left and centre, the open door and worker at right of centre, with the perspective receding to the upper right. The photo is boxed (not full-bleed), with a hard rectangular edge, no overlay or tint, and no visible cropping of the main subjects. The image is a rectangle with square corners.
Slide 20
GIGAFACTORY SHANGHAI - MODEL 3 FACTORY (FOREGROUND); MODEL Y FACTORY (BACKGROUND) / 20 / TESLA
Visuals: Photograph (aerial night view) of Gigafactory Shanghai. Subject: large industrial complex with long low warehouse-style factory halls, rooftops covered with rows of skylights and lit rooftop units, truck docks with lorries and trailers backed up along the right-hand loading side, stacked shipping containers and a large parking lot with cars in the upper left, a canal running diagonally through the lower right, and the illuminated TESLA sign on the dark-grey facade of the left-hand building. Upper background shows distant lit port or industrial areas and a dark hazy sky. Composition: elevated three-quarter aerial view looking down and across the site, the factory complex running from centre-left to upper right, framed as a boxed rectangular image with sharp corners. Lighting: night, with warm sodium-orange and white artificial light from buildings, roadways and skylights against a deep blue-black sky. Dominant colours: deep navy and charcoal, warm amber and cream. Not cropped; boxed, not full-bleed; no overlay or tint.
Slide 21
GIGAFACTORY BERLIN -
MODEL Y FACTORY CONSTRUCTION
21
TESLA
Visuals: One aerial drone photograph of the Tesla Gigafactory Berlin under construction. Subject: long grey-white flat-roofed factory halls with rooftop equipment and white ducts, concrete-walled production halls at the front right with open floors and columns, a separate smaller warehouse hall at upper right with loading docks, several tower cranes (red, orange, yellow and green), construction vehicles, tractors, excavators, yellow vehicles, stacked concrete blocks, shipping containers, blue site cabins, white marquee tents, a service road curving around the buildings, and a dark pine forest with cleared land along the horizon under an overcast sky. Composition: wide oblique aerial view from the front, framed as a landscape rectangle, not cropped, not full-bleed, boxed inside the white margins with no border or overlay. Lighting: flat, diffuse overcast daylight with no hard shadows. Dominant colours: light grey roofs (about #D9DCDE), dark green forest (about #2E3B2F), brown earth (about #8A7457), grey-blue sky (about #AEB6BE), with accents of red, yellow and blue machinery.
Slide 22
GIGAFACTORY BERLIN - MODEL Y FACTORY INTERIOR
22
TESLA
Visuals: One photograph of a large unfinished single-storey factory interior under construction, shown in a wide landscape view from a low corner-to-corner angle. Steel roof trusses in a lattice pattern span across the top, with translucent skylight panels and red-and-black conduit or pipe runs along the roof. Rows of pale grey concrete columns recede toward a vanishing point at the centre-left. On the concrete floor are several orange Boels aerial work platforms: a boom lift with a raised basket and a worker in a yellow hi-vis vest and blue helmet at centre-left, a second boom lift at centre, and a scissor lift with a caged platform and a Boels RENTAL machine at lower right, plus another Boels machine cut off at the right edge. Stacked red pipes sit at lower left, and a green tarpaulin hangs in the background at centre. Lighting is diffuse daylight from the skylights, giving soft shadows. Dominant colours are concrete grey, steel grey, white and orange. The photo is not cropped, sits as a rectangular box inside the margins, and has no overlay or tint.
Slide 23
GIGAFACTORY BERLIN - MODEL Y FACTORY INTERIOR / 23
Visuals: One photograph, a wide eye-level interior view of a factory under construction, with a 1916 by 958 pixel image placed in a rectangular box, not full-bleed. Subject: a concrete and steel structure with grey concrete columns, exposed beams, silver flexible ducting and cable trays running across the ceiling. A mezzanine with red steel railings sits in the middle distance, with blue industrial machines, grey wall-mounted cabinets and a standing work light on a tripod. In the foreground are large white shrink-wrapped crates on a grey concrete floor, several marked with black printed labels reading approximately GEICO180-SHA. At the right, an orange scissor lift carries a worker in a hi-vis orange vest on a raised platform, and a red and white sign on the lift reads WIESECKER GROUP. A black plastic tarp sits at the left-centre and a silver duct runs diagonally across the centre. Lighting is mixed: flat overhead industrial light with warm lamp glow in the mid-ground and cool grey daylight through the far space. Dominant colours are concrete grey, white, orange and red, with blue machinery. The photo is cropped at the edges by the frame, with no overlay or tint.
Slide 24
GIGAFACTORY TEXAS
3 months ago
Present day
24
T E S L A
Visuals: Two aerial photographs, each boxed as a plain unbordered rectangle with square corners and no overlay or tint, neither cropped beyond its rectangle. Left photograph: '3 months ago', an aerial view of a flat, cleared, tan-brown earth site with a yellow crawler crane at upper left, rows of small concrete footings and foundation piers across the middle, scattered excavators and pile rigs, a dark tree line and transmission towers in the background, and a pale blue hazy sky along the top edge; soft low daylight, dominant colours tan/brown earth, dark green trees and pale blue sky. Right photograph: 'Present day', an aerial view of a large long industrial building with a white/light grey roof and steel frame under construction, with exposed concrete and steel columns along its west side, a canal or drainage channel curving along the lower left, many construction vehicles, stacked steel beams and pipes across the lot, a warm low sun glowing at upper right with hazy orange-gold light, dominant colours white roof, tan earth and warm amber sky. Logo: a faint small spaced wordmark 'T E S L A' at bottom right in light grey.
Slide 25
KEY METRICS QUARTERLY
(Unaudited)
200,000 / 180,000 / 160,000 / 140,000 / 120,000 / 100,000 / 80,000 / 60,000 / 40,000 / 20,000 / 0
1Q-2018 / 2Q-2018 / 3Q-2018 / 4Q-2018 / 1Q-2019 / 2Q-2019 / 3Q-2019 / 4Q-2019 / 1Q-2020 / 2Q-2020 / 3Q-2020 / 4Q-2020
Vehicle Deliveries (units)
4.0 / 3.0 / 2.0 / 1.0 / 0.0 / -1.0 / -2.0 / -3.0 / -4.0
1Q-2018 / 2Q-2018 / 3Q-2018 / 4Q-2018 / 1Q-2019 / 2Q-2019 / 3Q-2019 / 4Q-2019 / 1Q-2020 / 2Q-2020 / 3Q-2020 / 4Q-2020
Operating Cash Flow ($B)
Free Cash Flow ($B)
0.8 / 0.6 / 0.4 / 0.2 / 0.0 / -0.2 / -0.4 / -0.6 / -0.8
1Q-2018 / 2Q-2018 / 3Q-2018 / 4Q-2018 / 1Q-2019 / 2Q-2019 / 3Q-2019 / 4Q-2019 / 1Q-2020 / 2Q-2020 / 3Q-2020 / 4Q-2020
Net Income ($B)
25
TESLA
Visuals: Three vertical bar charts with gridlines. Left chart: column chart titled Vehicle Deliveries (units), y-axis 0 to 200,000 units in 20,000 steps, one blue bar per quarter from 1Q-2018 to 4Q-2020 with about values: 1Q-2018 30,000; 2Q-2018 41,000; 3Q-2018 84,000; 4Q-2018 91,000; 1Q-2019 63,000; 2Q-2019 95,000; 3Q-2019 97,000; 4Q-2019 112,000; 1Q-2020 88,000; 2Q-2020 91,000; 3Q-2020 140,000; 4Q-2020 181,000 (values estimated, none printed). Middle chart: clustered column chart, y-axis -4.0 to 4.0 in $B steps of 1.0, two series per quarter: Free Cash Flow ($B) in red and Operating Cash Flow ($B) in blue, both values about (none printed): 1Q-2018 FCF -1.05 and OCF -0.40; 2Q-2018 FCF -0.75 and OCF -0.10; 3Q-2018 FCF 0.88 and OCF 1.40; 4Q-2018 FCF 0.90 and OCF 1.25; 1Q-2019 FCF -0.95 and OCF -0.65; 2Q-2019 FCF 0.60 and OCF 0.88; 3Q-2019 FCF 0.37 and OCF 0.75; 4Q-2019 FCF 1.02 and OCF 1.42; 1Q-2020 FCF -0.92 and OCF -0.45; 2Q-2020 FCF 0.42 and OCF 0.97; 3Q-2020 FCF 1.42 and OCF 2.40; 4Q-2020 FCF 1.88 and OCF 3.02. Legend below the middle chart: blue square Operating Cash Flow ($B) above red square Free Cash Flow ($B). Right chart: column chart titled Net Income ($B), y-axis -0.8 to 0.8 in steps of 0.2, blue bars with about values: 1Q-2018 -0.71; 2Q-2018 -0.72; 3Q-2018 0.31; 4Q-2018 0.14; 1Q-2019 -0.71; 2Q-2019 -0.41; 3Q-2019 0.15; 4Q-2019 0.11; 1Q-2020 0.02; 2Q-2020 0.11; 3Q-2020 0.33; 4Q-2020 0.27. No bars are highlighted. Bars are narrow vertical bars with a vertical gradient from mid blue at the base to dark navy at the top, bars for the middle chart use a red-to-dark-maroon gradient for the red series. Gridlines are thin light grey horizontal lines at each axis tick; there are no visible axis lines beyond the baseline at zero.
Slide 26
KEY METRICS
TRAILING 12 MONTHS (TTM)
(Unaudited)
500,000
450,000
400,000
350,000
300,000
250,000
200,000
150,000
100,000
50,000
0
6.0
5.0
4.0
3.0
2.0
1.0
0.0
-1.0
-2.0
-3.0
-4.0
-5.0
-6.0
3.0
2.0
1.0
0.0
-1.0
-2.0
-3.0
1Q-2018 2Q-2018 3Q-2018 4Q-2018 1Q-2019 2Q-2019 3Q-2019 4Q-2019 1Q-2020 2Q-2020 3Q-2020 4Q-2020
1Q-2018 2Q-2018 3Q-2018 4Q-2018 1Q-2019 2Q-2019 3Q-2019 4Q-2019 1Q-2020 2Q-2020 3Q-2020 4Q-2020
1Q-2018 2Q-2018 3Q-2018 4Q-2018 1Q-2019 2Q-2019 3Q-2019 4Q-2019 1Q-2020 2Q-2020 3Q-2020 4Q-2020
Operating Cash Flow ($B)
Free Cash Flow ($B)
Vehicle Deliveries (units)
Net Income ($B)
26
Visuals: Three bar charts, all vertical columns with year-quarter category labels rotated 90 degrees under the horizontal axis, and value axes with horizontal light grey gridlines. Chart 1: Vehicle Deliveries (units), single series of blue bars. Y axis 0 to 500,000 in steps of 50,000 with thousands separators. Values are not printed; about 1Q-2018 110,000; 2Q-2018 127,000; 3Q-2018 185,000; 4Q-2018 245,000; 1Q-2019 280,000; 2Q-2019 333,000; 3Q-2019 347,000; 4Q-2019 368,000; 1Q-2020 393,000; 2Q-2020 389,000; 3Q-2020 432,000; 4Q-2020 500,000. No legend. The 4Q-2020 bar reaches the top of the axis and is the highest. Chart 2: unlabelled title, with legend below axis labels: blue square 'Operating Cash Flow ($B)' and red square 'Free Cash Flow ($B)'. Y axis -6.0 to 6.0 in steps of 1.0. Each quarter has a blue bar (operating cash flow) and a red bar (free cash flow) side by side, both starting from zero. Values are not printed; about OCF: 1Q-2018 -0.4; 2Q-2018 -0.3; 3Q-2018 1.4; 4Q-2018 2.1; 1Q-2019 1.9; 2Q-2019 2.85; 3Q-2019 2.2; 4Q-2019 2.4; 1Q-2020 2.6; 2Q-2020 2.7; 3Q-2020 4.35; 4Q-2020 5.95. About FCF: 1Q-2018 -3.9; 2Q-2018 -3.5; 3Q-2018 -1.2; 4Q-2018 -0.05; 1Q-2019 0.1; 2Q-2019 1.5; 3Q-2019 1.0; 4Q-2019 1.1; 1Q-2020 1.1; 2Q-2020 0.9; 3Q-2020 1.9; 4Q-2020 2.8. No highlighted points; the 4Q-2020 bars are the tallest. Chart 3: Net Income ($B), single series of blue bars. Y axis -3.0 to 3.0 in steps of 1.0. Values are not printed; about 1Q-2018 -2.35; 2Q-2018 -2.7; 3Q-2018 -1.8; 4Q-2018 -0.98; 1Q-2019 -0.98; 2Q-2019 -0.65; 3Q-2019 -0.83; 4Q-2019 -0.87; 1Q-2020 -0.15; 2Q-2020 0.36; 3Q-2020 0.56; 4Q-2020 0.72. No legend. Bars hang from the zero line; 2Q-2018 is the most negative.
Slide 27
FINANCIAL STATEMENTS
Slide 28
STATEMENT OF OPERATIONS
(Unaudited)
In millions of USD or shares as applicable, except per share data Q4-2019 Q1-2020 Q2-2020 Q3-2020 Q4-2020
REVENUES
Automotive sales 6,143 4,893 4,911 7,346 9,034
Automotive leasing 225 239 268 265 280
Total automotive revenue 6,368 5,132 5,179 7,611 9,314
Energy generation and storage 436 293 370 579 752
Services and other 580 560 487 581 678
Total revenues 7,384 5,985 6,036 8,771 10,744
COST OF REVENUES
Automotive sales 4,815 3,699 3,714 5,361 6,922
Automotive leasing 119 122 148 145 148
Total automotive cost of revenues 4,934 3,821 3,862 5,506 7,070
Energy generation and storage 385 282 349 558 787
Services and other 674 648 558 644 821
Total cost of revenues 5,993 4,751 4,769 6,708 8,678
Gross profit 1,391 1,234 1,267 2,063 2,066
OPERATING EXPENSES
Research and development 345 324 279 366 522
Selling, general and administrative 699 627 661 888 969
Restructuring and other (12) — — — —
Total operating expenses 1,032 951 940 1,254 1,491
INCOME FROM OPERATIONS 359 283 327 809 575
Interest income 10 10 8 6 6
Interest expense (170) (169) (170) (163) (246)
Other (expense) income, net (25) (54) (15) (97) 44
INCOME BEFORE INCOME TAXES 174 70 150 555 379
Provision for income taxes 42 2 21 186 83
NET INCOME 132 68 129 369 296
Net income attributable to noncontrolling interests and redeemable noncontrolling interests 27 52 25 38 26
NET INCOME ATTRIBUTABLE TO COMMON STOCKHOLDERS 105 16 104 331 270
Less: Buy-out of noncontrolling interest — — — 31 —
NET INCOME USED IN COMPUTING NET INCOME PER SHARE OF COMMON STOCK 105 16 104 300 270
Net income per share of common stock attributable to common stockholders(1)
Basic $ 0.12 $ 0.02 $ 0.11 $ 0.32 $ 0.28
Diluted $ 0.11 $ 0.02 $ 0.10 $ 0.27 $ 0.24
Weighted average shares used in computing net income per share of common stock(1)
Basic 902 915 928 937 951
Diluted 935 994 1,036 1,105 1,124
28 (1) Prior period results have been retroactively adjusted to reflect the five-for-one stock split effected in the form of a stock dividend in August 2020.
TESLA
Visuals: A single data table, no chart or image. Columns: row label, Q4-2019, Q1-2020, Q2-2020, Q3-2020, Q4-2020 (values in millions of USD except per-share data and share counts). Rows in order: REVENUES (section band); Automotive sales 6,143 / 4,893 / 4,911 / 7,346 / 9,034; Automotive leasing 225 / 239 / 268 / 265 / 280; Total automotive revenue 6,368 / 5,132 / 5,179 / 7,611 / 9,314; Energy generation and storage 436 / 293 / 370 / 579 / 752; Services and other 580 / 560 / 487 / 581 / 678; Total revenues 7,384 / 5,985 / 6,036 / 8,771 / 10,744; COST OF REVENUES (section band); Automotive sales 4,815 / 3,699 / 3,714 / 5,361 / 6,922; Automotive leasing 119 / 122 / 148 / 145 / 148; Total automotive cost of revenues 4,934 / 3,821 / 3,862 / 5,506 / 7,070; Energy generation and storage 385 / 282 / 349 / 558 / 787; Services and other 674 / 648 / 558 / 644 / 821; Total cost of revenues 5,993 / 4,751 / 4,769 / 6,708 / 8,678; Gross profit (bold) 1,391 / 1,234 / 1,267 / 2,063 / 2,066; OPERATING EXPENSES (section band); Research and development 345 / 324 / 279 / 366 / 522; Selling, general and administrative 699 / 627 / 661 / 888 / 969; Restructuring and other (12) / — / — / — / —; Total operating expenses 1,032 / 951 / 940 / 1,254 / 1,491; INCOME FROM OPERATIONS (shaded band, bold) 359 / 283 / 327 / 809 / 575; Interest income 10 / 10 / 8 / 6 / 6; Interest expense (170) / (169) / (170) / (163) / (246); Other (expense) income, net (25) / (54) / (15) / (97) / 44; INCOME BEFORE INCOME TAXES 174 / 70 / 150 / 555 / 379; Provision for income taxes 42 / 2 / 21 / 186 / 83; NET INCOME (shaded band) 132 / 68 / 129 / 369 / 296; Net income attributable to noncontrolling interests and redeemable noncontrolling interests 27 / 52 / 25 / 38 / 26; NET INCOME ATTRIBUTABLE TO COMMON STOCKHOLDERS (bold, shaded band) 105 / 16 / 104 / 331 / 270; Less: Buy-out of noncontrolling interest — / — / — / 31 / —; NET INCOME USED IN COMPUTING NET INCOME PER SHARE OF COMMON STOCK 105 / 16 / 104 / 300 / 270; Net income per share of common stock attributable to common stockholders(1) (label row); Basic $ 0.12 / $ 0.02 / $ 0.11 / $ 0.32 / $ 0.28; Diluted $ 0.11 / $ 0.02 / $ 0.10 / $ 0.27 / $ 0.24; Weighted average shares used in computing net income per share of common stock(1) (label row); Basic 902 / 915 / 928 / 937 / 951; Diluted 935 / 994 / 1,036 / 1,105 / 1,124. The whole Q4-2020 column is highlighted in a pale rose tint, except the header, INCOME FROM OPERATIONS and NET INCOME rows, which are not tinted. No chart, legend, photograph, or icon is present. The faint TESLA wordmark at bottom right is a logo, set in widely tracked capitals in light grey.
Slide 29
BALANCE SHEET
(Unaudited)
In millions of USD / 31-Dec-19 / 31-Mar-20 / 30-Jun-20 / 30-Sep-20 / 31-Dec-20
ASSETS
Current assets
Cash and cash equivalents 6,268 8,080 8,615 14,531 19,384
Accounts receivable, net 1,324 1,274 1,485 1,757 1,886
Inventory 3,552 4,494 4,018 4,218 4,101
Prepaid expenses and other current assets 959 1,045 1,218 1,238 1,346
Total current assets 12,103 14,893 15,336 21,744 26,717
Operating lease vehicles, net 2,447 2,527 2,524 2,742 3,091
Solar energy systems, net 6,138 6,106 6,069 6,025 5,979
Property, plant and equipment, net 10,396 10,638 11,009 11,848 12,747
Operating lease right-of-use assets 1,218 1,197 1,274 1,375 1,558
Goodwill and intangible assets, net 537 516 508 521 520
Other non-current assets 1,470 1,373 1,415 1,436 1,536
Total assets 34,309 37,250 38,135 45,691 52,148
LIABILITIES AND EQUITY
Current liabilities
Accounts payable 3,771 3,970 3,638 4,958 6,051
Accrued liabilities and other 3,222 2,825 3,110 3,252 3,855
Deferred revenue 1,163 1,186 1,130 1,258 1,458
Customer deposits 726 788 713 708 752
Current portion of debt and finance leases (1) 1,785 3,217 3,679 3,126 2,132
Total current liabilities 10,667 11,986 12,270 13,302 14,248
Debt and finance leases, net of current portion (1) 11,634 10,666 10,416 10,559 9,556
Deferred revenue, net of current portion 1,207 1,199 1,198 1,233 1,284
Other long-term liabilities 2,691 2,667 2,870 3,049 3,330
Total liabilities 26,199 26,518 26,754 28,143 28,418
Redeemable noncontrolling interests in subsidiaries 643 632 613 608 604
Convertible senior notes — 60 44 48 51
Total stockholders' equity 6,618 9,173 9,855 16,031 22,225
Noncontrolling interests in subsidiaries 849 867 869 861 850
Total liabilities and equity 34,309 37,250 38,135 45,691 52,148
(1) Breakdown of our debt is as follows:
Vehicle and energy product financing (non-recourse) 4,183 4,022 4,043 4,141 3,930
Other non-recourse debt 355 708 1,415 605 630
Recourse debt 7,263 7,600 7,106 7,448 5,660
Total debt excluding vehicle and energy product financing 7,618 8,308 8,521 8,053 6,290
29
Visuals: A balance sheet table with no chart, photograph or icon. Columns: row label, 31-Dec-19, 31-Mar-20, 30-Jun-20, 30-Sep-20, 31-Dec-20 (values in millions of USD). Rows: ASSETS (section band) with Current assets, Cash and cash equivalents 6,268 / 8,080 / 8,615 / 14,531 / 19,384; Accounts receivable, net 1,324 / 1,274 / 1,485 / 1,757 / 1,886; Inventory 3,552 / 4,494 / 4,018 / 4,218 / 4,101; Prepaid expenses and other current assets 959 / 1,045 / 1,218 / 1,238 / 1,346; Total current assets 12,103 / 14,893 / 15,336 / 21,744 / 26,717; Operating lease vehicles, net 2,447 / 2,527 / 2,524 / 2,742 / 3,091; Solar energy systems, net 6,138 / 6,106 / 6,069 / 6,025 / 5,979; Property, plant and equipment, net 10,396 / 10,638 / 11,009 / 11,848 / 12,747; Operating lease right-of-use assets 1,218 / 1,197 / 1,274 / 1,375 / 1,558; Goodwill and intangible assets, net 537 / 516 / 508 / 521 / 520; Other non-current assets 1,470 / 1,373 / 1,415 / 1,436 / 1,536; Total assets 34,309 / 37,250 / 38,135 / 45,691 / 52,148. LIABILITIES AND EQUITY (section band), Current liabilities: Accounts payable 3,771 / 3,970 / 3,638 / 4,958 / 6,051; Accrued liabilities and other 3,222 / 2,825 / 3,110 / 3,252 / 3,855; Deferred revenue 1,163 / 1,186 / 1,130 / 1,258 / 1,458; Customer deposits 726 / 788 / 713 / 708 / 752; Current portion of debt and finance leases (1) 1,785 / 3,217 / 3,679 / 3,126 / 2,132; Total current liabilities 10,667 / 11,986 / 12,270 / 13,302 / 14,248; Debt and finance leases, net of current portion (1) 11,634 / 10,666 / 10,416 / 10,559 / 9,556; Deferred revenue, net of current portion 1,207 / 1,199 / 1,198 / 1,233 / 1,284; Other long-term liabilities 2,691 / 2,667 / 2,870 / 3,049 / 3,330; Total liabilities 26,199 / 26,518 / 26,754 / 28,143 / 28,418; Redeemable noncontrolling interests in subsidiaries 643 / 632 / 613 / 608 / 604; Convertible senior notes — / 60 / 44 / 48 / 51; Total stockholders' equity 6,618 / 9,173 / 9,855 / 16,031 / 22,225; Noncontrolling interests in subsidiaries 849 / 867 / 869 / 861 / 850; Total liabilities and equity 34,309 / 37,250 / 38,135 / 45,691 / 52,148. Footnote (1) Breakdown of our debt is as follows: Vehicle and energy product financing (non-recourse) 4,183 / 4,022 / 4,043 / 4,141 / 3,930; Other non-recourse debt 355 / 708 / 1,415 / 605 / 630; Recourse debt 7,263 / 7,600 / 7,106 / 7,448 / 5,660; Total debt excluding vehicle and energy product financing 7,618 / 8,308 / 8,521 / 8,053 / 6,290. Totals and subtotal rows are set in bold. Rows are separated by thin light grey rules; the 31-Dec-20 column is shaded light pink across the whole table height from the column header to the last row.
Slides 30 to 34 continue in the full text file.
Download this deck
The hosted PDF of every library deck is free for readers of the SlideDeck Co newsletter. Join with your email and the viewer and download appear here.
Preparing a results presentation or business update of your own? The SlideDeck Co Standard Deck is a slide library for business reviews, updates and plans.







