

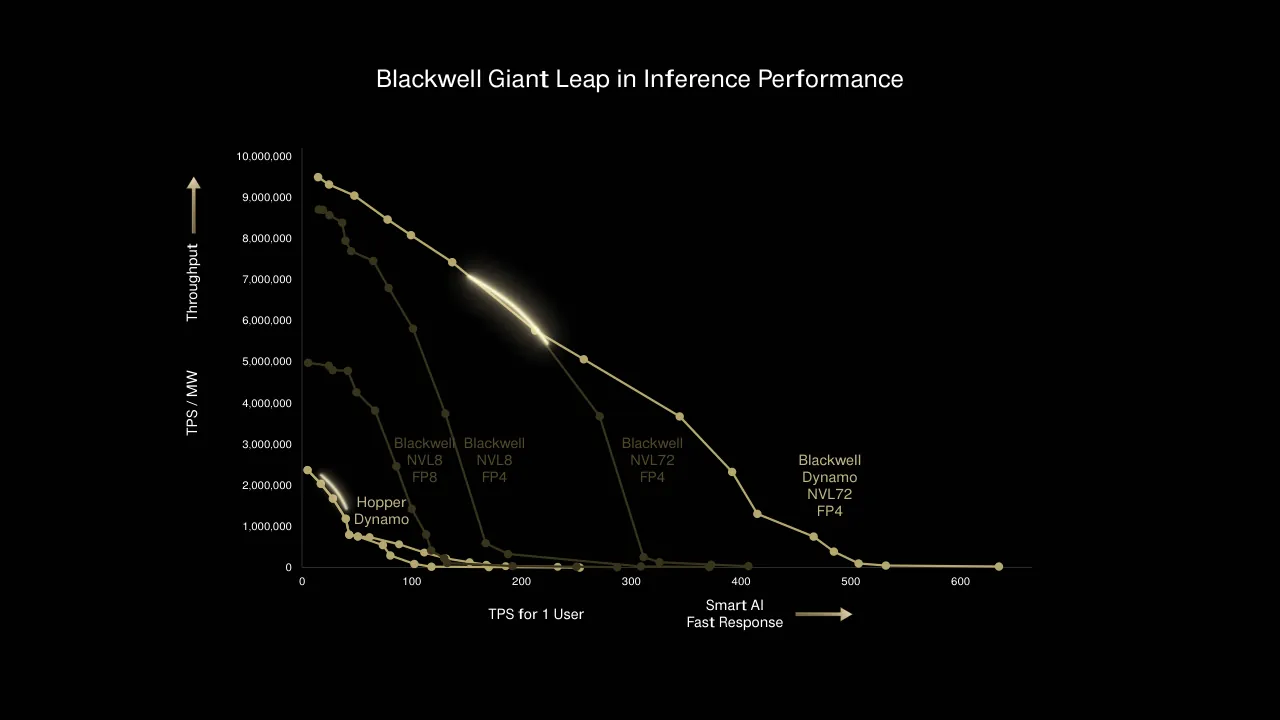
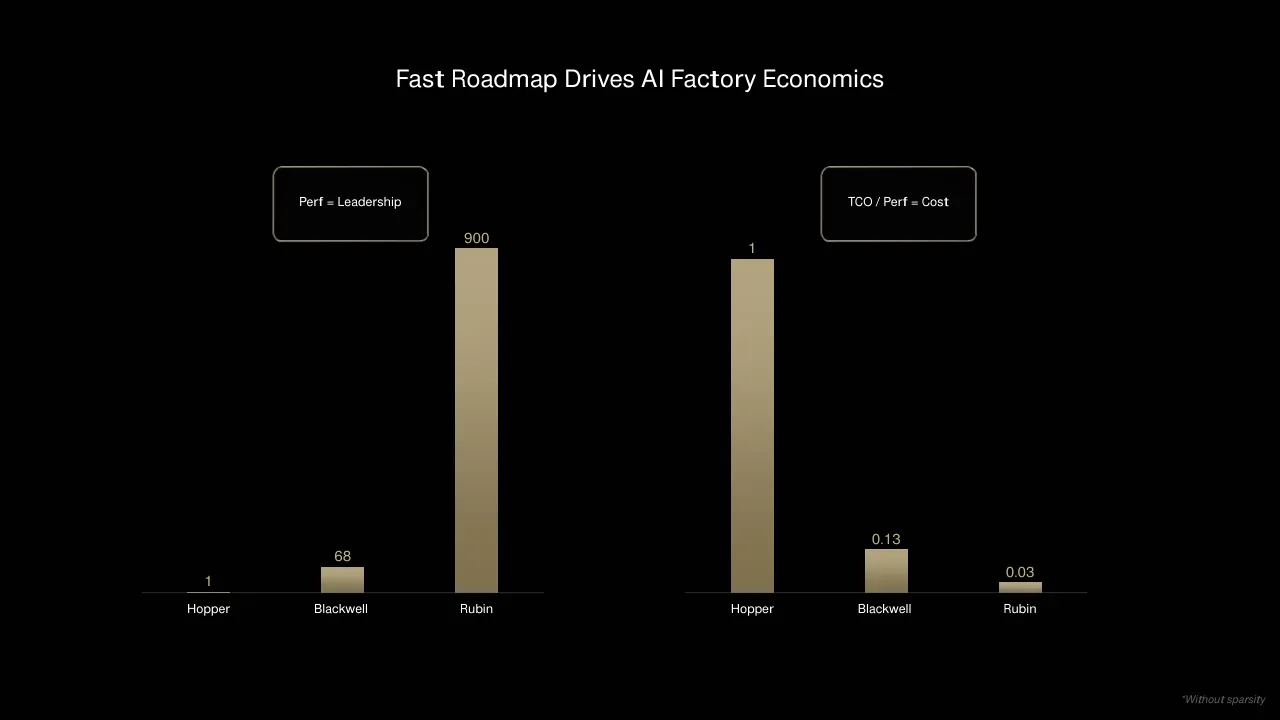
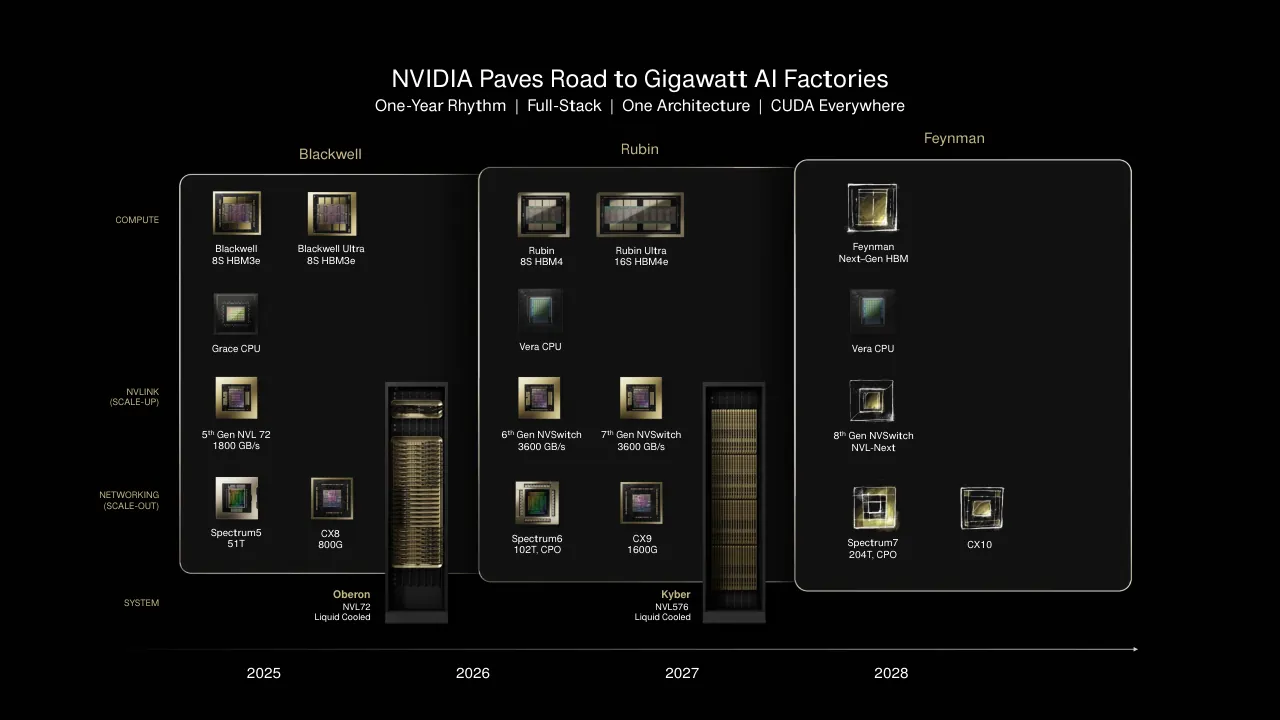
The deck is the keynote presentation from NVIDIA GTC 2025. It opens with headline growth figures for Hopper and Blackwell GPUs and data center revenue, then frames the industry around a computing inflection point. The middle sections cover the Blackwell system and inference performance, shown through a series of incremental benchmark charts that build from Hopper to Blackwell NVL72 with Dynamo. Further sections present the product roadmap through Blackwell Ultra, Vera Rubin and Rubin Ultra, followed by networking and co-packaged photonics, enterprise AI infrastructure and workstations, Llama Nemotron models, Omniverse and Cosmos for physical AI, and Isaac GR00T robotics. It closes with a summary slide restating the main announcements. Many slides use a single large figure or a stepped chart to carry the argument, and several roadmap slides compare generations side by side.
Slides worth studying
Questions about this deck
How many slides are in the NVIDIA GTC 2025 keynote deck?
The deck has 73 slides, and slide 1 is the NVIDIA title slide. The slides run in order from slide 1 through slide 73.
What does the NVIDIA deck say about the Blackwell 72 system specifications?
Slide 18, titled NVIDIA Blackwell System 72, lists 72 Blackwell GPUs, 1.1 EF FP4, 20 TB of memory, and 130 Trillion Transistors. It also lists 18 NVLink Switches and 72 ConnectX-8 NICs.
What does the NVIDIA deck say about the Rubin Ultra NVL576 roadmap?
Slide 35 gives Rubin Ultra NVL576 with a timing of Second Half 2027, 15 EF FP4 Inference, and 5 EF FP8 Training. It also lists 4 Reticle-Sized GPUs and 1TB HBM4e.
What does the NVIDIA deck say about Blackwell and Hopper GPU shipments to top US cloud providers?
Slide 9, titled Top 4 US CSPs, shows 3.6M Blackwell GPUs So Far (2-GPUs per Chip) and 1.3M Hopper GPUs. The chart compares 2024 and 2025.
Details
- Company: NVIDIA
- Year: 2025
- Type: Keynote
- Industry: Semiconductors
- Pages: 73
More from NVIDIA
- NVIDIA investor presentation, September 2026 NDR
- NVIDIA investor presentation, Annual Stockholder Meeting June 2026
- NVIDIA investor presentation, Q2 FY27 quarterly presentation
- NVIDIA keynote, GTC Europe 2026
- NVIDIA presentation, 2026
- NVIDIA keynote, GTC 2026 Keynote
All NVIDIA decks in the library
Review score: 8 out of 10, Strong
Presentation quality, judged with the SlideDeck Co review heuristic. Ask, evidence and idea merit are not rated here.
The deck keeps one visual language (black ground, gold and green accents, sparse titles) and uses large, well-chosen visuals, so the audience can follow a keynote route from scaling laws (5-8) to Blackwell inference (19-30), the roadmap (33-38, 44), enterprise (45-63) and robotics (64-70), closing on a summary (71). The stepped chart build on 22-28 and the one-chart-per-point slides like 9, 10 and 38 communicate a leap in performance clearly, and the roadmap on 44 is organised into legible rows and columns. Weaknesses are small type on several slides (the annotation labels on 27-28, the enterprise architecture diagrams on 53-63, the logo wall on 2), dim de-emphasised series on 26, and a few near-empty or low-information pages (20, 69, 72), which suggest the deck depends on a speaker and video for full effect.
Worth keeping: Keep the dark, restrained visual system, the single-message slide structure, the stepped chart reveal on 22-28 and the clean generation comparison on 44.
Most useful repair: Enlarge or cut the tiny annotation text on 27-28 and the partner diagrams on 53-63, and brighten the dimmed series and labels on 25-26.
What would change the score: I would add a short agenda or section marker and replace the placeholder-like pages (20, 69, 72) with stills that stand alone.
Confidence medium. 72 of 73 pages inspected on contact sheets, 4 at readable size. Reviewed 2026-11-08. Model-assisted review (claude-sonnet-5-5).
Full text of the slides (73 slides)
Every slide's words and a description of its charts and images, so the deck can be searched and rebuilt. Also available as Markdown.
Slide 1
NVIDIA
Visuals: Logo: the NVIDIA eye-and-square mark on the left, in NVIDIA green, with the white wordmark 'NVIDIA' to its right. The mark is a stylised eye whose iris and pupil are split by a vertical cut, set inside a green square whose left edge is cut by the eye shape. The wordmark is set in bold, wide, flat-topped white capitals. No photograph, chart or other graphic.
Slide 2
GTC25
accenture
Adobe
airbnb
Alibaba Cloud
amazon
AMGEN
Ansys
Apple
aramco
arm
AT&T
Baidu
BARCLAYS
BlackRock
BMW GROUP
BNP PARIBAS
Bristol Myers Squibb
cadence
Capital One
cerence ai
CISCO
Coca-Cola
COHESITY
CoreWeave
CORTEVA agriscience
databricks
DataRobot
ddn
DELL
Deloitte.
DELTA
Disney Research
EA
ebay
EPIC GAMES
EQUINIX
ERICSSON
EY
Flipkart
Ford
FOXCONN
FUJITSU
GE HealthCare
GSK
hp
Hewlett Packard Enterprise
HEXAGON
HITACHI
HRT
Hugging Face
IBM
Infosys
JD.COM
JLR
Kroger
Lambda
LangChain
Lenovo
LOCKHEED MARTIN
Lowe's
MLB
mastercard
MARS
MAYO CLINIC
Meta
Micron
Microsoft
MISTRAL AI
Nasdaq
NHL
NAVER Cloud
NetApp
NOVARTIS
NTT Group
NYSE
OpenAI
ORACLE
PEGATRON
PEPSICO
PETROBRAS
Pfizer
PPG
PING AN
QCT
Red Hat
rescale
RIVIAN
ROBLOX
Roche
Rockwell Automation
Royal Bank of Canada
SAAB
salesforce
SAP
SAMSUNG ELECTRONICS
Schneider Electric
servicenow
Shell
shopify
SIEMENS
SK hynix
slb
SoftBank
S&P Global
telenor
Tencent
The Weather Company
T-Mobile
together.ai
tsmc
Uber
UBS
Unilever
usbank
verizon
VISA
vmware
VOLVO
Volkswagen
waabi
Walmart
WAYMO
WAYVE
Weights & Biases
wipro
X
xiaomi
Yum!
ZOOX
Visuals: Full-slide black background image with white chalk-like linework. Central element: a white sketched polygonal emblem (faceted, diamond-like shape with a grid of crossing lines and a dark glossy interior, lit from the upper left with a soft glow) at about 33.6% x, 34% y, 32.4% by 35.3% size. Above it, the GTC25 wordmark in glossy green 3D lettering on a black ground at about 41.2% x, 31.8% y, 21.1% by 11.3%. Around these, about 130 white monochrome company logos in rows, each listed in the text field in reading order, with no tints, overlays or shadows.
Slide 3
GEFORCE RTX 5090
Visuals: One photograph of two NVIDIA GeForce RTX 5090 graphics cards, rendered as a product shot. At back left is a light grey, beige-white shroud (the card's cooler cover) with the embossed text 'GEFORCE RTX 5090' running diagonally across its top surface, grille vents along its side ends and chevron-shaped indents on its top. In the foreground right is a black Founders-Edition-style card with two five-blade fans set in rounded square silver-chrome frames joined by an X-shaped chrome cross. Lighting is soft studio light with specular highlights on the chrome rims and fan hubs. Dominant colours are black, light grey and silver. Composition is a low three-quarter angle with shallow depth of field, the background blurred. The photo is not cropped inside its frame; it is boxed with rounded corners and a thin gold outline, and it sits on a black surround.
Slide 4
Visuals: Photograph of an ornate Baroque-style palace courtyard seen in one-point perspective from the pool toward the facade. A large central dome with a ribbed, gilded drum, arched windows, and a lantern with a small spire rises at the centre. Behind it are snow-capped mountains under a clear pale blue sky. Flanking the centre are two symmetrical stone wings with carved gold-leaf ornament, arched colonnades, balconies, and ivy on the outer columns. A central portal with an arched gate and a balustrade with carved panels stands in front of the dome. Potted palms and shrubs line the courtyard. A reflecting pool in the foreground holds lily pads, white water lilies, and small gold floating bowls or lanterns. Lighting is bright, even daylight with soft shadows. Dominant colours are warm ivory and beige stone, gold, pale sky blue, muted blue-grey roof tiles, and deep green foliage. The photo is cropped at the frame edges and is not boxed, overlaid, or tinted.
Slide 5
2012 ALEXNET
PERCEPTION AI
SPEECH RECOGNITION
DEEP RECSYS
MEDICAL IMAGING
GENERATIVE AI
DIGITAL MARKETING
CONTENT CREATION
AGENTIC AI
CODING ASSISTANT
CUSTOMER SERVICE
PATIENT CARE
PHYSICAL AI
AUTONOMOUS VEHICLES
GENERAL ROBOTICS
Visuals: Two white chalk-style sketch illustrations sit at lower left under the caption '2012 ALEXNET'. The upper one is a stacked, layered network sketch with rectangular blocks and vertical bars, read as a neural-network architecture diagram. The lower one is a horizontal rounded rectangle containing a circular swirl, read as a sensor or camera-like sketch. A single curved green arrow, about 4 pt stroke, starts near the AlexNet sketch, passes under the Perception AI text, sweeps up through Generative AI and Agentic AI, and ends in a filled green triangular arrowhead pointing up-right just below the Physical AI heading. Arrow colour is about #76B900 with a slight dark-green fade near its tail. No photographs, charts or tables.
Slide 6
FROM ONE TO THREE / SCALING LAWS
“INTELLIGENCE”
PRE-TRAINING SCALING
POST-TRAINING SCALING
TEST-TIME SCALING / “LONG THINKING”
PERCEPTION / AI
GENERATIVE / AI
AGENTIC / AI
PHYSICAL / AI
Visuals: Hand-drawn chalk-style line chart. Type: rising scaling-curve diagram with a labelled vertical axis ("INTELLIGENCE", no units or numeric ticks) and a horizontal axis of successive stages (no numeric scale). Title: "FROM ONE TO THREE SCALING LAWS". Series: three green arrowed curves, each rising from lower left to upper right. The lowest curve, starting near (27%, 79%) and ending in an arrowhead at about (46%, 59%), is labelled PRE-TRAINING SCALING. The middle curve branches off the main line near (40%, 60%) and ends in an arrowhead at about (56%, 43%), labelled POST-TRAINING SCALING. The highest curve, the main arrow, branches from the line near (48%, 49%), runs up to an arrowhead at about (65%, 22%), and is labelled TEST-TIME SCALING "LONG THINKING". Stage labels along the x-axis: PERCEPTION AI, GENERATIVE AI, AGENTIC AI, PHYSICAL AI, with short white hand-drawn arrows between them and a trailing arrow line after PHYSICAL AI pointing right and ending at about 80%. No legend, no data values, no highlighted points beyond the green arrowheads. Drawing style: white chalk strokes with rough, uneven edges.
Slide 7
FROM ONE TO THREE / SCALING LAWS
“INTELLIGENCE”
PRE-TRAINING SCALING
POST-TRAINING SCALING
TEST-TIME SCALING / “LONG THINKING”
PERCEPTION / AI
GENERATIVE / AI
AGENTIC / AI
PHYSICAL / AI
STEP 1 / STEP 2 / STEP 3
LLM / LLM / LLM
PROMPT / STEP 1 / STEP 2
REASONING AI INFERENCE / COMPUTE / >100X ONE-SHOT
Visuals: Hand-drawn sketch-style diagram, not a chart with values. A vertical axis labelled “INTELLIGENCE” (no units or scale) and a horizontal axis carrying four stages joined by hand-drawn arrows: PERCEPTION AI, GENERATIVE AI, AGENTIC AI, PHYSICAL AI, with a short unlabelled arrow stub after PHYSICAL AI. Three green hand-drawn arrows rise diagonally from lower left to upper right, labelled PRE-TRAINING SCALING (lowest, starting near the origin), POST-TRAINING SCALING (middle, with a shorter branch arrow) and TEST-TIME SCALING “LONG THINKING” (top, the longest arrow). Upper right: a reasoning inference diagram of rounded-rectangle boxes with white sketch outlines and grey text. Top row: STEP 1, STEP 2, STEP 3 boxes with upward arrows to a row of LLM boxes, and a dashed arrow leaving STEP 3 to the right. Middle row: three LLM boxes, each with an upward arrow into its step box. Bottom row: PROMPT box, then STEP 1 and STEP 2 boxes. Arrows run PROMPT to STEP 1 (rightward), STEP 1 to STEP 2 (rightward), and wrap-around loops (STEP 1 top-row to bottom STEP 1, and STEP 2 top to bottom STEP 2) drawn as elbow connectors with upward arrowheads into the LLM boxes. Caption below the diagram reads REASONING AI INFERENCE / COMPUTE / >100X ONE-SHOT. No photographs, logos or icons.
Slide 8
FROM ONE TO THREE / SCALING LAWS / “INTELLIGENCE” / TEST-TIME SCALING / “LONG THINKING” / POST-TRAINING SCALING / PRE-TRAINING SCALING / PROBLEM / PROMPTS / VERIFIER / MODEL / ANSWER / POST-TRAINING WITH RLVR / >100T TOKENS / PERCEPTION / AI / GENERATIVE / AI / AGENTIC / AI / PHYSICAL / AI
Visuals: Hand-drawn chalk-style diagram in white and green on black. (1) Y-axis: a single white chalk line, vertical, from about y 22 to y 86 at x 22, labelled '“INTELLIGENCE”' (no units, no numeric scale, no tick marks). (2) X-axis: a white chalk baseline from the y-axis corner at (22, 85) running right to about x 75, with four stage labels in capitals (PERCEPTION AI, GENERATIVE AI, AGENTIC AI, PHYSICAL AI) and white arrowheads on the connectors between them (from PERCEPTION to GENERATIVE, GENERATIVE to AGENTIC, AGENTIC to PHYSICAL); the line after PHYSICAL AI ends at about x 80 with no arrowhead. (3) Three green chalk arrows rising to the upper right, all starting near (27, 86): the longest reaches about (65, 12) and is labelled TEST-TIME SCALING / 'LONG THINKING'; a middle arrow ends about (56, 40) and a shorter arrow ends about (46, 59); the labels are POST-TRAINING SCALING (on the middle branch) and PRE-TRAINING SCALING (near the origin). No numeric values, no legend, no highlighted data points. (4) Process diagram on the right: a rounded rectangle 'VERIFIER' at top, a rounded rectangle 'MODEL' below it, and a rounded rectangle 'PROBLEM PROMPTS' to the left of MODEL. A white arrow points down from VERIFIER to MODEL, a white arrow points right from PROBLEM PROMPTS to MODEL, and a white loop arrow leaves the right side of MODEL, curves up along x 81 and returns with an arrowhead into the right side of VERIFIER, labelled ANSWER beside the loop. The caption POST-TRAINING WITH RLVR / >100T TOKENS sits below the boxes. Boxes have white chalk outlines about 2 px wide with rounded corners and black interiors. Measured images: a full-slide 4000 by 2250 pixel image forming the black background, and about 23 small image-based strokes and label pieces (arrows, box outlines, the axis lines and the stage labels) placed as listed in the elements.
Slide 9
Top 4 US CSPs
3.6M
Blackwell GPUs So Far
(2-GPUs per Chip)
1.3M
Hopper GPUs
2024
2025
Visuals: Chart: vertical bar chart with two bars, titled 'Top 4 US CSPs'. There is no y-axis, no gridlines and no axis title. The horizontal x-axis is a thin dark grey line running from about x 42.1% to 58.3% at y 80.9%. Category labels below the axis: 2024 and 2025. Series: one series of GPU shipments with two labelled values. 2024 bar labelled 1.3M, callout 'Hopper GPUs'. 2025 bar labelled 3.6M, callout 'Blackwell GPUs So Far (2-GPUs per Chip)'. Bar heights are approximately proportional to the values: the 2024 bar is about 17% of slide height tall and the 2025 bar about 48% tall. Both bars are filled with a vertical gradient from pale cream at the top to dark olive-brown at the bottom. The 2025 bar is the tallest and brightest. No legend. No highlighted points beyond the tallest bar.
Slide 10
Computing At Inflection Point / $1T+ / $1,000 / $750 / $500 / $250 / 2022 / 2023 / 2024 / 2025 / 2026 / 2027 / 2028 / NVDA DC Revenue / Data Center Capex / (Dell’Oro Projections)
Visuals: Chart: grouped and single bar chart with two series, titled 'Computing At Inflection Point'. Y-axis: linear, labelled $1,000, $750, $500 and $250 with gridlines absent, range $0 to $1,000 (baseline at $0 on the horizontal axis line). X-axis: years 2022 to 2028, one category per year. Series 1 'NVDA DC Revenue' (beige bars with gradient, only for 2022 to 2024): 2022 about $15, 2023 about $45, 2024 about $100; no printed values. Series 2 'Data Center Capex (Dell’Oro Projections)' (purple gradient bars, all years): 2022 about $235, 2023 about $260, 2024 about $395, 2025 about $515, 2026 about $655, 2027 about $775, 2028 about $880; the 2028 value is annotated only by the text '$1T+' above it, and no values are printed on the bars. Legend: at right, beige square for NVDA DC Revenue, purple square for Data Center Capex with the note (Dell’Oro Projections) beneath. Highlighted points: the years 2022, 2023 and 2024 are colour-highlighted in beige and enclosed by a thin beige outlined rounded rectangle, while 2025 to 2028 are white. A thin dark purple arrow runs in two segments from just above the 2022 purple bar up and to the right, with arrowheads, ending above the 2028 bar near the '$1T+' label. Several image elements are placed over the chart area; they carry the bar and arrow graphics.
Slide 11
CUDA-X FOR EVERY INDUSTRY / WARP / PHYSICS / cuDF / cuML / DATA SCIENCE AND PROCESSING / cuDSS / cuSPARSE / cuFFT / AMGX / COMPUTER AIDED ENGINEERING / TRT-LLM / MEGATRON / NCCL / cuDNN / CUTLASS / cuBLAS / DEEP LEARNING / cuEQUIVARIANCE / cuTENSOR / QUANTUM CHEMISTRY / cuQUANTUM / CUDA-Q / QUANTUM COMPUTING / EARTH-2 / WEATHER ANALYTICS / MONAI / MEDICAL IMAGING / PARABRICKS / GENE SEQUENCING / cuOPT / DECISION OPTIMIZATION / AERIAL / SIONNA / 5G/6G / SIGNAL PROCESSING / cuLITHO / COMPUTATIONAL LITHOGRAPHY / cuPYNUMERIC / NUMERICAL COMPUTING
Visuals: Thirteen hand-sketched rounded-rectangle cards with white chalk-like outlines, each containing an illustration on a black ground, left to right: (1) WARP: swirling green, blue and magenta fluid vortices with white line sketches, tall card, about 15% wide. (2) cuDF/cuML: sparse scattered dots in purple, green and blue on black, arranged in loose clusters. (3) cuDSS/cuFFT/AMGX: grey-white smoky streaks and a jet-engine turbine drawn in white and yellow-green particles. (4) TRT-LLM/Deep learning: a dark blue gradient background with a white line drawing of a server rack and a connected component. (5) cuEQUIVARIANCE/QUANTUM CHEMISTRY: a ball-and-stick molecule with teal, blue, red and grey spheres. (6) cuQUANTUM: a glowing gold cylindrical cryostat with white line detail. (7) EARTH-2: a dark blue globe showing the Americas with green and magenta tints. (8) MONAI: a torso and organ scan in teal, green and orange. (9) PARABRICKS: dark blue-grey cloud-like clusters with purple and orange accents. (10) cuOPT: a glowing green node with a blue network of lines and points. (11) AERIAL SIONNA: white outlined buildings with bright green radio ray lines and a yellow lamp shape. (12) cuLITHO: a white outlined chip-layout pattern with gold details. (13) cuPYNUMERIC: a purple, blue and white spiral galaxy. Below each card, a label block: a gold (#E6C27A) product name line group and white (#F2F2F2) sub-label, centred. No charts, tables or photographs.
Slide 12
Visuals: Photograph-style rendering of planet Earth as a full sphere viewed from above the North Pole region, showing North America, Greenland, the Arctic, the Caribbean, Central America and northern South America. Subject: the whole Earth disc with a thin bright blue atmospheric rim glowing at the edge. Snow and ice cover northern Canada and the Arctic archipelago, Hudson Bay appears as a dark patch, and green aurora-like glow is visible over northeastern Canada and the North Atlantic. The western United States and Mexico are brown and tan, the Gulf of Mexico and Caribbean are deep navy, and the Atlantic and Pacific are dark blue with white cloud streaks. Composition: the sphere is centred, slightly tilted, with the terminator not visible; lighting is even daylight from the upper left, giving a soft highlight on the disc. Dominant colours: black background, navy #0B2A4A to deep blue #1E4D8C ocean, tan #8A6A4A land, white #F2F2F2 ice. The image is not cropped; the globe is fully within the frame. No overlay or tint; the image covers the slide edge to edge.
Slide 13
AI FOR EVERY INDUSTRY
ROBOTS, AV
Omniverse-Cosmos
Isaac GR00T
DRIVE AV
ENTERPRISE IT
NVIDIA AI Enterprise
CLOUD SERVICE
PROVIDERS
Leading Technology
Full-Stack AI
CUDA-X Diverse Applications
Rich Developer Ecosystem
ROBOTIC
MANUFACTURING
Omniverse-Cosmos
EDGE, 6G
Aerial-Sionna
6G AI-RAN
GPU CLOUDS
AI Factory
Blueprint and Full Stack
Visuals: One illustration: a hand-painted circular pie divided into six wedges by thin white hand-drawn radial lines, with a thin white hand-drawn circle outline. The wedges run clockwise from 12 o'clock: Enterprise IT (blue #1F6FB0, 12 to 2 o'clock); Cloud Service Providers (purple #7A1E9A, 2 to 4 o'clock); GPU Clouds (magenta #A3196E, 4 to 6 o'clock); Edge, 6G (orange #C8692B, 6 to 8 o'clock); Robotic Manufacturing (yellow #E8E81A, 8 to 10 o'clock); Robots, AV (green #6A9A10, 10 to 12 o'clock). Each wedge is filled with visible circular brush strokes that darken towards the centre and edge. The pie is not cropped and has no overlay. A rounded outline panel with a thin tan #C1B485 stroke and a black fill sits to the right of the pie, containing four centred items: Leading Technology, Full-Stack AI, CUDA-X Diverse Applications, Rich Developer Ecosystem. No logos or icons.
Slide 14
gm / NVIDIA
Visuals: Three non-text visuals. (1) A full-bleed near-black background image (4000 by 2250 px) covering the whole slide. (2) A monochrome white-line sketch illustration, placed at 7.5%, 24.9%, 86.7% by 75.1%, on a black field so its edges blend into the background, with no box or border. The left vehicle is a large SUV in three-quarter front view facing right, with a rectangular grille, a crest emblem on the grille, slim vertical LED headlamps, and wheels at the bottom. The right vehicle is a smaller electric SUV in three-quarter front view facing left, with a chevron-patterned grille, a crest emblem, and thin vertical lighting strips at each side. Both are drawn in hatched, sketchy white and grey strokes with warm gold-amber rim highlights along their roof and shoulder lines. Lighting is dramatic and low-key, from the upper edges, with the rest in shadow. Dominant colours are black, white and warm gold. (3) Two logos: the General Motors 'gm' mark, a rounded-square outline containing lowercase 'gm' in a bright sky-blue; and the NVIDIA logo, a green eye-shaped emblem followed by the white bold geometric wordmark 'NVIDIA'. A thin vertical grey hairline separates the two logos.
Slide 15
Announcing NVIDIA Halos / Chip-to-Deployment AV Safety System / GTC / AI Conference March 17-21, 2025 | Keynote March 18 | Exhibits March 18-21 | Workshops March 16-20 | San Jose, CA & Virtual / EN / Register Now | Log In / Keynote / Session Catalog / Agenda / Attend / Sponsors & Exhibitors / More / Autonomous Vehicle Safety Day / Safety is the top priority in autonomous vehicles. In this workshop, we'll showcase how NVIDIA is accelerating the development of safe and secure AVs. / View All Autonomous Vehicle Safety Sessions / Featured Sessions / Session cards (titles too small to read reliably in the image: Introduction to NVIDIA's Strategy for AV Safety, Guardrails for AI Safety Across the Product Life-Cycle, Safety Regulation and Standardization in the Era of AI-Based AVs, Navigating the High-Stakes Safety Challenges of Autonomous Driving, Exploring NVIDIA's Strategy for AV Safety, From Research to Production: Transforming AV Technology With AI, Accelerate the Future of AI-Defined Vehicles and Autonomous Driving, Developing Next-Gen AVs with Physical AI-Powered World Foundation Models, Advancing AV Development With Sensor Simulation and Cosmos, Advancing AI to Build the Most-Trusted Driver, AI's Next Frontier: Taking Autonomous from Digital to Physical Reality, Crafting a New Automotive Experience With End-to-End Embodied AI)
Visuals: Photograph of a dark, glossy sedan seen from the rear three-quarter view, driving away on a reflective dark road. Its red brake lights glow at left and centre-left. Above the car, a curved, electric blue-white arc of light forms a dome-shaped halo over the vehicle. The composition is wide and low, with the car at the lower left of the halo and the edges fading into black. Lighting is dramatic and low-key, with cool blue highlights and warm red tail lights. Dominant colours are black, deep navy, electric blue-white and red. The photograph is not boxed, it blends into the black background with no visible border. Second visual is a screenshot of the NVIDIA GTC event web page, shown at a slight perspective tilt with a soft drop shadow. It has a black top navigation bar with a green GTC logo block, a white content area, a black photo of a green-and-black autonomous car, a small street-scene photo and a green-street photo at upper right, a bright green button, and a grid of twelve white session cards in three rows of four.
Slide 16
Visuals: Photograph-style computer-rendered street scene from a forward-facing vehicle camera, split into two halves. Left half: semantic segmentation overlay. An elevated pink-roofed structure (overpass or pedestrian walkway) runs diagonally from the left edge to the centre, with grey pillars supporting it. Blue trees, green railings and fencing, grey pillars and blue cylindrical bins line the left sidewalk. Picnic tables are at the left edge. The road is orange with white lane lines. The sidewalk is grey and the buildings and structures are pink. A small green car sits in the centre distance, and a second car is further away. Right half: photorealistic render. A road with white dashed centre markings, a concrete curb, a glass-fronted modern building with dark columns and a low grey panel fence on the right, several young green trees along the sidewalk, a tall beige office tower and a tall white tower in the background, a street lamp, and a green-domed white tower in the centre-left distance. Blue sky with scattered white cumulus clouds. Foreground: the bonnet of the vehicle, shown in a red-to-silver gradient across the bottom 25% of the frame, with a silver Mercedes-Benz three-pointed star emblem at about x 51%, y 72% on the bonnet. The image is cropped to the frame with no rounded corners, boxed rather than framed, and not tinted beyond the segmentation colours. Lighting is soft overcast daylight. Dominant colours: pink, orange, red, blue, green, grey and sky blue.
Slide 17
Lenovo / CoreWeave / Dell Technologies / Microsoft Azure / aws / Meta / Google Cloud / ORACLE CLOUD Infrastructure / Hewlett Packard Enterprise / AiVRES / ASUS / GIGABYTE / ingrasys / Inventec / PEGATRON / SUPERMICRO / QCT / Grace Blackwell in Full Production
Visuals: Row of 16 vendor logos in white, each centred above one photographed server rack, ordered left to right: Lenovo (wordmark in white box), CoreWeave with Dell Technologies stacked beneath (two logos), Microsoft Azure (four-square logo with wordmark), aws (smile arrow), Meta (infinity mark with wordmark), Google Cloud (wordmark), ORACLE CLOUD Infrastructure (stacked wordmark), Hewlett Packard Enterprise (stacked wordmark), AiVRES (wordmark), ASUS (wordmark), GIGABYTE (wordmark), ingrasys (circle mark with wordmark), Inventec (wordmark), PEGATRON (wordmark), SUPERMICRO (oval mark), QCT (cloud mark). Below each logo is a photograph of a populated server rack seen from the front, straight-on, tall and narrow, dark enclosure with cabling and networking gear; racks vary in height slightly and are bottom-aligned at the slide edge and cropped by it. Lighting is dim studio lighting with the racks lit internally by blue, green and white LEDs and cable colours of red, yellow, blue and green. Dominant colours of the racks are black, dark grey and silver, with occasional blue or green highlights. The photographs are not boxed; they sit directly on the black background.
Slide 18
NVIDIA Blackwell System
72 Blackwell GPUs
1.1 EF FP4
576 Memory Chips
20 TB
576 TB/s
18 NVLink Switches
130 TB/s All-to-All
130 Trillion Transistors
2,592 Grace CPU Cores
72 ConnectX-8 NICs
18 BlueField DPUs
Grace Blackwell NVLink72
Visuals: 1) Circular backdrop photograph, about 43% of slide width, centred at x 28.5 to 71.5 and y 14.5 to 90.9. It shows a blurred, marbled, brushed-metal abstract in silver, white and charcoal, with bright diagonal streaks running from upper right to lower left. Circular crop, full opacity, no overlay. 2) Chip graphic, a top-down render of the Grace Blackwell NVLink72 die, placed as a square boxed image at x 38.7 to 61.3 horizontally, spanning about 24.2% to 75.8% in the wider square frame. It shows a dense grid of small silver and grey square tiles, with rows of large compute blocks, a central horizontal band of smaller tiles and interconnect traces, memory-tile rows above and below, and a black border around the die. Lighting is soft and even, dominant colours are silver, grey and black. The whole die is visible, not cropped. 3) Thin gold circular arcs, about 0.1% stroke, #C1B485, forming two partial rings: a left arc from about x 29 y 22 down to x 29 y 81 and a right arc from about x 68 y 22 down to x 67 y 81, both outside the circle. 4) Eight small gold spheres as markers on the arcs, each about 1% of slide width, with a metallic gold highlight: left at about x 24.8 y 43.1, x 24.1 y 52.8 and x 24.8 y 63.2; right at about x 75.2 y 43.1, x 75.7 y 49.8, x 75.7 y 56.4 and x 75.2 y 63.2. 5) Server rack image, a tall dark enclosure with horizontal gold-lit trays and black chassis, boxed, unrounded, placed at x 28.7 to 34.3 and y 71.5 to 100 (bottom edge cropped by slide bottom), overlapping the left arc. 6) Caption banner image behind the text 'Grace Blackwell NVLink72', a dark grey gradient bar fading to transparent at its ends, at x 38.7 to 60.7 and y 77.3 to 86.3.
Slide 19
Inference At-Scale is Extreme Computing
Revenue
Throughput
Tokens per Second
For Factory
FLOPS
HBM Memory
HBM Bandwidth
Software and
Architecture
Smart AI
Fast Response
Tokens per Second
For One User
Visuals: Conceptual line chart with no printed numeric scale, so no axis values are shown. Vertical axis labelled 'Throughput' with an upward white arrow; horizontal axis labelled 'Smart AI Fast Response' with a rightward white arrow, and a second caption 'Tokens per Second For One User' under the axis. A gold curve descends from upper left (about 28% x, 23% y) to lower right (about 77% x, 74% y) and is the highlighted curve; its middle section carries a bright white-gold glow. Above it, a gold arrow pointing up-right is labelled 'Revenue'. A dimmer grey curve starts about 28% x, 50% y and descends to about 39% x, 74% y; it is labelled 'Tokens per Second For Factory' on the vertical side, with a gold arrow pointing up-right at the FLOPS label, which lists the drivers 'FLOPS, HBM Memory, HBM Bandwidth, Software and Architecture'. Behind the curves is a dim photograph of rows of server racks in perspective.
Slide 20
I need to seat 7 people around a table at my wedding reception, but my parents and in-laws should not sit next to each other. Also, my wife insists we look better in pictures when she's on my left, but I need to sit next to my best man. How do I seat us on a round table? But then, what happens if we invited our pastor to sit with us?
Send
Traditional LLM Model
Tokens: 439
Reasoning Model
Tokens: 8,559
Reasoning On
20x More Tokens
150x More Compute
Visuals: Left: an empty rectangle with a red outline (about #D00000, roughly 2px stroke, small corner radius) and black fill, containing no content. Right: a rectangle with a green outline (#76B900, roughly 2px stroke, small corner radius) and black fill, containing a green toggle switch (filled #76B900 pill with a black circular knob on the right) labelled 'Reasoning On' and the centred bold text '20x More Tokens / 150x More Compute'. Top box: a paper-plane icon in black on the green Send pill button. No photographs, charts or diagrams.
Slide 21
Announcing NVIDIA Dynamo / Distributed Inference Serving Library / Query / Prefill / KV $ / Decode / Disaggregated Inference / GPU Resource Allocation / KV Cache Routing / Communication Library (NIXL) / cohere / Fireworks AI / Meta / Microsoft Azure / perplexity / PyTorch / SGL / together.ai / VAST / vLLM
Visuals: Illustration of a distributed inference pipeline on a black background. Four dark-grey rounded cards are stacked behind a larger front card, offset up and to the left to suggest depth. On the front card, a 'Query' label with a thin grey arrow points right into a gold-bronze chip icon labelled 'Prefill' (a square processor with a grid of small gold cells, framed by a gold bezel). A second thin arrow runs to a rectangular gold-bronze block labelled 'KV $' with a bevelled, metallic look. A third arrow runs to a second gold chip icon labelled 'Decode', identical in style to the Prefill chip. From the Decode chip, a thin grey arrow path rises, bends right and drops down onto a row of five small squares: the first is solid white and the other four are mid-grey (#5A5A5A-ish). A grey loop path leaves the bottom of the square row, bends left and returns upward with an arrowhead into the bottom of the Decode chip, forming a feedback loop. A final thin grey arrow leaves the right end of the square row and points right to the card edge. The front card has a thin gold-grey stroke. Four outlined label chips below the card read: Disaggregated Inference, GPU Resource Allocation, KV Cache Routing, Communication Library (NIXL). Lighting is flat with a soft metallic highlight on the gold chips. Composition is centred and horizontally symmetrical. Nothing is cropped or full-bleed except the black background.
Slide 22
Blackwell Giant Leap in Inference Performance
Throughput
10,000,000
9,000,000
8,000,000
7,000,000
6,000,000
5,000,000
4,000,000
3,000,000
TPS / MW
Hopper
2,000,000
1,000,000
0
0
100
200
300
400
500
600
TPS for 1 User
Smart AI
Fast Response
Visuals: Chart: a line-with-markers chart, no title of its own. Y-axis labelled Throughput (arrow pointing up) and TPS / MW, range 0 to 10,000,000 with ticks every 1,000,000 (labels 0, 1,000,000 to 10,000,000). X-axis labelled TPS for 1 User and Smart AI Fast Response (arrow pointing right), range 0 to about 650 with ticks at 0, 100, 200, 300, 400, 500, 600. One series, gold #C1B485 line with round gold markers, values estimated (no values printed): about (5, 2,360,000), (17, 2,020,000), (28, 1,660,000), (40, 1,180,000), (43, 790,000), (51, 750,000), (74, 530,000), (80, 280,000), (102, 80,000), (118, 20,000), (170, about 0), (253, about 0). Series is labelled Hopper in gold text beside the point near (28, 1,660,000) with the label placed right and above. No legend. No points highlighted beyond the Hopper label. Two small gold arrow images: an upward arrow beside the Throughput label and a rightward arrow beside Smart AI Fast Response; both are solid gradient gold shafts with triangular heads.
Slide 23
Blackwell Giant Leap in Inference Performance
10,000,000
9,000,000
Throughput
8,000,000
7,000,000
TPS / MW
6,000,000
Blackwell
NVL8
FP8
5,000,000
Hopper
4,000,000
3,000,000
Smart AI
TPS for 1 User
Fast Response
2,000,000
1,000,000
0
0
100
200
300
400
500
600
Visuals: Chart: scatter-style line chart with markers joined by straight line segments, plotted on black. Title: none inside the chart; the slide title is above it. X axis: labelled 'TPS for 1 User' with a secondary label 'Smart AI / Fast Response' and a right-pointing arrow; range 0 to 600 with tick labels every 100 (0, 100, 200, 300, 400, 500, 600); thin grey baseline at the bottom. Y axis: labelled 'TPS / MW' with a separate vertical arrow labelled 'Throughput' pointing up; range 0 to 10,000,000 with tick labels every 1,000,000 (0, 1,000,000, 2,000,000, 3,000,000, 4,000,000, 5,000,000, 6,000,000, 7,000,000, 8,000,000, 9,000,000, 10,000,000); thin dark grey vertical axis line. Series 1 'Blackwell NVL8 FP8' in gold #C1B485: about 5,000,000 at about 5 TPS, about 4,900,000 at about 22, about 4,800,000 at about 28 and about 40, about 4,270,000 at about 48, about 3,820,000 at about 65, about 2,470,000 at about 85, about 1,440,000 at about 100, about 800,000 at about 113, about 420,000 at about 117, about 220,000 at about 130, about 90,000 at about 133, about 30,000 at about 190, about 15,000 at about 250, about 5,000 at about 285. Series 2 'Hopper' in dark olive #514929: about 2,360,000 at about 5 TPS, about 2,050,000 at about 18, about 1,680,000 at about 28, about 1,200,000 at about 38, about 790,000 at about 41, about 740,000 at about 50, about 530,000 at about 73, about 290,000 at about 82, about 70,000 at about 102, about 10,000 at about 117, and near zero at about 170. Legend: none; series are identified by in-plot labels. Highlighted points: none; all markers are filled circles about 1% of slide width, same size per series. Gold markers sit above dark olive markers throughout.
Slide 24
Blackwell Giant Leap in Inference Performance
10,000,000
9,000,000
8,000,000
7,000,000
6,000,000
5,000,000
4,000,000
3,000,000
2,000,000
1,000,000
0
0
100
200
300
400
500
600
Throughput
TPS / MW
Blackwell
NVL8
FP8
Blackwell
NVL8
FP4
Hopper
TPS for 1 User
Smart AI
Fast Response
Visuals: Chart: line chart with markers (scatter-line), black background. Title: none inside the chart. Y-axis: 'TPS / MW' with ticks 0 to 10,000,000 in steps of 1,000,000 (tick labels 0, 1,000,000 ... 10,000,000), with an upward arrow above the label reading 'Throughput'. X-axis: 'TPS for 1 User' with ticks 0 to 600 in steps of 100, with a right arrow labelled 'Smart AI Fast Response'. Series 1, Blackwell NVL8 FP4 (gold #C1B485): about 8,700,000 at x about 15, about 8,600,000 at x about 25, about 8,400,000 at x about 37, about 7,900,000 at x about 40, about 7,700,000 at x about 45, about 7,450,000 at x about 65, about 6,800,000 at x about 80, about 5,800,000 at x about 103, about 3,750,000 at x about 130, about 580,000 at x about 166, about 330,000 at x about 190, about 20,000 at x about 308, about 0 at x about 370. Series 2, Blackwell NVL8 FP8 (dark olive #514929): about 4,950,000 at x about 5, about 4,900,000 at x about 25, about 4,800,000 at x about 27, about 4,800,000 at x about 40, about 4,250,000 at x about 48, about 3,800,000 at x about 65, about 2,450,000 at x about 85, about 1,450,000 at x about 102, about 800,000 at x about 115, about 420,000 at x about 118, about 200,000 at x about 130, about 60,000 at x about 135. Series 3, Hopper (dark olive #514929): about 2,350,000 at x about 5, about 2,050,000 at x about 15, about 1,680,000 at x about 28, about 1,200,000 at x about 40, about 780,000 at x about 42, about 740,000 at x about 50, about 530,000 at x about 75, about 290,000 at x about 80, about 80,000 at x about 102, about 20,000 at x about 118. Legend: none; series are labelled directly with text. Highlighted points: none beyond gold series markers. Gridlines: none.
Slide 25
Blackwell Giant Leap in Inference Performance / Throughput / 10,000,000 / 9,000,000 / 8,000,000 / 7,000,000 / 6,000,000 / TPS / MW / 5,000,000 / 4,000,000 / 3,000,000 / Blackwell / NVL8 / FP8 / Blackwell / NVL8 / FP4 / Blackwell / NVL72 / FP4 / Hopper / 2,000,000 / 1,000,000 / 0 / 0 / 100 / 200 / 300 / 400 / 500 / 600 / Smart AI / TPS for 1 User / Fast Response
Visuals: Line chart with markers. Title: Blackwell Giant Leap in Inference Performance. Y axis: Throughput, labelled TPS / MW, 0 to 10,000,000 in steps of 1,000,000 (ticks at 0, 1,000,000, 2,000,000, 3,000,000, 4,000,000, 5,000,000, 6,000,000, 7,000,000, 8,000,000, 9,000,000, 10,000,000). X axis: TPS for 1 User, 0 to 600 in steps of 100 (ticks 0, 100, 200, 300, 400, 500, 600), with a second axis label Smart AI / Fast Response on the arrow. No values are printed on the points, so all values below are estimates marked about. Series 1, Blackwell NVL72 FP4, gold line #C1B485 with gold markers, the brightest series: about (12, 9.5M), (25, 9.3M), (47, 9.05M), (80, 8.45M), (100, 8.1M), (136, 7.45M), (213, 5.8M), (270, 3.7M), (310, 0.25M), (326, 0.15M), (372, 0.08M), (407, 0.03M). Series 2, Blackwell NVL8 FP4, dark olive line #514929 with dark markers: about (15, 8.7M), (20, 8.7M), (27, 8.6M), (37, 8.4M), (40, 7.95M), (45, 7.7M), (65, 7.45M), (80, 6.8M), (100, 5.8M), (120, 3.75M), (165, 0.6M), (190, 0.3M), (250, 0.05M), (290, 0.02M), (310, 0.01M). Series 3, Blackwell NVL8 FP8, dark olive line with dark markers: about (5, 4.95M), (25, 4.9M), (30, 4.8M), (42, 4.8M), (50, 4.25M), (65, 3.8M), (85, 2.45M), (100, 1.45M), (115, 0.8M), (120, 0.4M), (130, 0.1M), (130, 0.2M), (110, 0.25M), (100, 0.05M), (120, 0.02M). Series 4, Hopper, dark olive line with dark markers: about (5, 2.35M), (15, 2.05M), (30, 1.7M), (40, 1.2M), (42, 0.8M), (50, 0.75M), (70, 0.5M), (80, 0.3M), (100, 0.05M), (120, 0.02M). Legend: none; series are identified by direct labels Blackwell NVL72 FP4 (gold, right of the gold line near 270 to 330 on x and 3M to 2M on y), Blackwell NVL8 FP4 and Blackwell NVL8 FP8 (dark, centred near x 130 and x 85 at about 3M), and Hopper (dark, about x 80 at 1.5M). Highlighted points: the NVL72 FP4 series is the only highlighted series, drawn in gold with the lighter markers. Gridlines: none. Up arrow: a gold tan vertical arrow with a triangular head at the top of the y-axis title, pointing up. Right arrow: a gold tan horizontal arrow with a triangular head at the right end of the x-axis label, pointing right.
Slide 26
Blackwell Giant Leap in Inference Performance
Throughput
10,000,000
9,000,000
8,000,000
7,000,000
6,000,000
5,000,000
4,000,000
3,000,000
2,000,000
1,000,000
0
TPS / MW
Blackwell Blackwell
Blackwell
NVL8 NVL8 NVL72
Blackwell
Dynamo
NVL72
FP4
Hopper
Dynamo
FP8 FP4 FP4
0 100 200 300 400 500 600
TPS for 1 User
Smart AI
Fast Response
Visuals: Line chart of connected point series with no internal title and no legend; series are labelled directly on the plot. Y axis: TPS / MW (also captioned Throughput by the up arrow), linear, 0 to 10,000,000, gridlines absent, ticks every 1,000,000 with labels at 0, 1,000,000 through 10,000,000. X axis: TPS for 1 User (with Smart AI / Fast Response arrow), linear, 0 to about 640, ticks labelled 0, 100, 200, 300, 400, 500, 600. Series values are not printed, so the following are estimates: (1) Blackwell Dynamo NVL72 FP4, gold #C1B485, the outermost curve, about 9.5 million at about 15 TPS, about 9.0 million at about 45, about 8.1 million at about 100, about 7.4 million at about 137, about 5.1 million at about 265, about 3.7 million at about 345, about 2.3 million at about 392, about 1.3 million at about 413, about 0.7 million at about 465, about 0.4 million at about 485, about 0.1 million at about 507, about 0.05 million at about 533, about 0 at about 635; highlighted by a soft gold glow along the segment from about 137 to 225 TPS. (2) Hopper Dynamo, gold, lower-left curve, about 2.4 million at about 5 TPS, about 2.0 million at about 17, about 1.7 million at about 28, about 1.2 million at about 40, about 0.8 million at about 40 to 50, falling to about 0 near 120 TPS; highlighted by a soft gold glow from about 15 to 40 TPS. (3) Blackwell NVL8 FP8, dark olive #3A3420, about 8.7 million at about 15 TPS, about 8.4 million at about 35, about 7.5 million at about 60, about 6.8 million at about 80, about 5.8 million at about 98, about 2.5 million at about 85 to 90, about 1.4 million at about 100, about 0.8 million at about 115, falling to near 0 by about 130 TPS. (4) Blackwell NVL8 FP4, dark olive, about 3.7 million at about 130, about 0.6 million at about 168, about 0.3 million at about 190, near 0 by about 300. (5) Blackwell NVL72 FP4, dark olive, about 3.7 million at about 270, about 0.2 million at about 310, about 0.1 million at about 325, near 0 by about 400. (6) A dark series from about 5.0 million at about 5 TPS through about 4.8 million at about 30, about 4.3 million at about 45, about 3.8 million at about 65, falling to about 0 near 250 TPS. Dark series end markers cluster near 370 to 410 TPS and near 0 in 250 to 290 TPS. Markers are filled circles about 1 percent of slide width in size. Highlight glow images: one soft gold-white bloom around the Blackwell Dynamo NVL72 FP4 curve between about 137 and 225 TPS, one around the Hopper Dynamo curve between about 15 and 40 TPS. Up arrow: solid gold-beige shaft and triangular head, about #C1B485, pointing up, positioned left of the y-axis title. Right arrow: solid beige #C1B485 shaft and triangular head pointing right, positioned at the lower right beside Fast Response. Axes: thin grey #6B6B6B y-axis at the left edge of the plot and x-axis along the zero line.
Slide 27
Blackwell 25X Hopper
FP4, NVL72, Dynamo, and TRT-LLM Continuous Optimization
1K ISL / 2K OSL
10,000,000
EP8, Batch 3072, Disagg Off
EP32, Batch 1792, Disagg Off
9,000,000
EP64, Batch 896, Disagg Off
Throughput
EP64, Batch 512, Disagg Off
8,000,000
EP64, Batch 384, Disagg Off
EP64, Batch 256, Disagg Off
7,000,000
EP64, Batch 128, Disagg Off
TPS / MW
Blackwell
EP64+EP4, Batch 64, 26% Context, MTP On
6,000,000
FP4
Hopper
EP64+EP4, Batch 32, 19% Context, MTP On
NVL72
FP8
Dynamo
5,000,000
NVL8
EP64+EP4, Batch 16, 12% Context, MTP On
Dynamo
EP64+EP4, Batch 8, 7% Context, MTP On
4,000,000
EP64+EP4, Batch 4, 4% Context, MTP On
EP64+EP4, Batch 2, 2% Context, MTP On
3,000,000
Smart AI
TEP8EP8+EP4, Batch 4, 1% Context, MTP On
TEP8+EP4, Batch 2, 1% Context, MTP On
2,000,000
TEP16+EP4, Batch 2, 1% Context, MTP On
1,000,000
0
0
100
200
300
400
500
600
TPS for 1 User
Fast Response
Visuals: One line chart (scatter-with-connecting-lines, a Pareto frontier style). Title: none inside the chart; the heading above reads Blackwell 25X Hopper. Y axis: 'Throughput', labelled 'TPS / MW', unit tokens per second per megawatt, range 0 to 10,000,000 with ticks every 1,000,000 (0, 1,000,000, 2,000,000 ... 10,000,000). X axis: 'TPS for 1 User' with ticks 0 to 600 every 100, with the 'Smart AI / Fast Response' arrow beneath pointing right, unit tokens per second per user. Series 1 (Blackwell FP4 NVL72 Dynamo, pale gold #C1B485 line and markers, upper curve): points labelled EP8 Batch 3072 Disagg Off at about x 14, y 9,500,000; EP32 Batch 1792 about x 25, y 9,300,000; EP64 Batch 896 about x 47, y 9,050,000; EP64 Batch 512 about x 79, y 8,450,000; EP64 Batch 384 about x 101, y 8,080,000; EP64 Batch 256 about x 137, y 7,430,000; EP64 Batch 128 about x 212, y 5,750,000 (highlighted with a soft glow streak); EP64+EP4 Batch 64 26% Context MTP On about x 255, y 5,080,000; EP64+EP4 Batch 32 19% Context about x 345, y 3,650,000; Batch 16 12% Context about x 393, y 2,330,000; Batch 8 7% Context about x 414, y 1,310,000; Batch 4 4% Context about x 465, y 700,000 (approximate); Batch 2 2% Context about x 485, y 400,000; TEP8EP8+EP4 Batch 4 1% Context about x 508, y 70,000; TEP8+EP4 Batch 2 1% Context about x 534, y 50,000; TEP16+EP4 Batch 2 1% Context about x 635, y 10,000 (all approximate; no values printed). Series 2 (Hopper FP8 NVL8 Dynamo, pale gold line and markers, lower curve): points about x 5, y 2,380,000; x 12, y 2,050,000; x 20, y 1,690,000; x 30, y 1,190,000; x 35, y 790,000; x 45, y 750,000; x 60, y 700,000; x 80, y 540,000; x 99, y 620,000 and further markers down to about x 240, y 0 (all approximate). Highlighted points: the glow streaks at about (Blackwell curve near x 212, y 5,750,000) and (Hopper near x 40, y 1,000,000). Legend: none. Dashed grey reference lines (#8A8A8A, 1 px) run from the y 5,750,000 point horizontally to the y axis and from the x 212 point vertically to the x axis. A dark translucent rectangle (gold tint) covers the lower-left quadrant to the reference lines, and a small dark grey dashed rectangle marks the Hopper area near the origin. Leader lines are thin grey (#5A5A5A) diagonal connectors from each point to its label.
Slide 28
Blackwell 40X Hopper / FP4, NVL72, Dynamo, and TRT-LLM Continuous Optimization / 32K ISL / 8K OSL / 1,000,000 / EP64PP2+PP4, Batch 480, 52% Context / EP64PP2+PP4, Batch 224, 50% Context / 900,000 / EP64PP2+PP4, Batch 160, 48% Context / Throughput / EP64PP4+PP4, Batch 224, 46% Context / 800,000 / EP64PP4+PP4, Batch 160, 44% Context / EP64+EP4, Batch 32, 47% Context, MTP On / 700,000 / EP64+EP4, Batch 16, 43% Context, MTP On / TPS / MW / Blackwell / EP64+EP4, Batch 8, 36% Context, MTP On / 600,000 / FP4 / Hopper / EP64+EP4, Batch 4, 29% Context, MTP On / NVL72 / FP8 / Dynamo / 500,000 / NVL8 / EP64+EP4, Batch 2, 19% Context, MTP On / Dynamo / EP64+EP4, Batch 1, 12% Context, MTP On / 400,000 / TEP4+EP4, Batch 1, 3% Context, MTP On / TEP8+EP4, Batch 1, 2%Context, MTP On / 300,000 / Smart AI / TEP16+EP4, Batch 1, 1% Context, MTP On / TPS for 1 User / Fast Response / TEP32+EP4, Batch 1, 1% Context, MTP On / 200,000 / 100,000 / 0 / 0 / 100 / 200 / 300 / 400 / 500 / 600
Visuals: Line chart titled Blackwell 40X Hopper with subtitle FP4, NVL72, Dynamo, and TRT-LLM Continuous Optimization and 32K ISL / 8K OSL. Y axis labelled TPS / MW with a rising arrow labelled Throughput, ticks 0 to 1,000,000 in steps of 100,000. X axis labelled TPS for 1 User (ticks 0 to 600 in steps of 100) with a right-pointing arrow labelled Smart AI / Fast Response. One tan line connects about 35 markers from upper left to lower right, descending from about 860,000 TPS/MW at about 18 TPS for 1 User to near 0 at about 630 TPS for 1 User. Labelled points (values about, as no numbers are printed): EP64PP2+PP4 Batch 480 52% Context at about 18 and 860,000; Batch 224 50% Context about 30 and 830,000; Batch 160 48% Context about 45 and 800,000; EP64PP4+PP4 Batch 224 46% Context about 60 and 765,000; Batch 160 44% Context about 75 and 720,000; EP64+EP4 Batch 32 47% Context, MTP On about 95 and 630,000; Batch 16 43% Context about 155 and 625,000; Batch 8 36% Context about 235 and 525,000 (highlighted with a glowing point and a glowing streak); Batch 4 29% Context about 330 and 420,000; Batch 2 19% Context about 395 and 275,000; Batch 1 12% Context about 440 and 165,000; TEP4+EP4 Batch 1 3% Context about 465 and 48,000; TEP8+EP4 Batch 1 2% Context about 550 and 30,000; TEP16+EP4 Batch 1 1% Context about 595 and 15,000; TEP32+EP4 Batch 1 1% Context about 630 and 5,000. A second cluster of Hopper points sits near the origin: about 8 TPS and 180,000, 8 and 160,000, 15 and 130,000, 20 and 128,000, 30 and 95,000, 55 and 60,000, 65 and 40,000, 75 and 25,000, 95 and 12,000, 130 and 5,000, 165 and 3,000, 230 and 1,000. Hopper points carry a soft glow near about 27 and 97,000. Leader lines run from each marker to its label, drawn as thin grey diagonal lines. Series label colours: EP64PP2+PP4 orange #FF9900 and brown tones; EP64PP2+PP4 batch 160 yellow #F5E467; EP64PP4+PP4 lime #D0FF7D; EP64+EP4 cyan #09DCFF; TEP4+EP4 light blue #82CAFF; TEP8+EP4 purple #8720BA; TEP16+EP4 magenta #E91598; TEP32+EP4 grey #CDCDCD. Two dashed guide lines in grey mark the Batch 8 point: a horizontal dashed line at about 525,000 from the Y axis to the point and a vertical dashed line at about 235 TPS from the X axis to the point. A dark translucent box with a dashed outline covers the lower-left region up to about 235 TPS and 525,000, with a smaller dashed box at the origin up to about 30 TPS and 100,000. Region callouts: Hopper FP8 NVL8 Dynamo in tan at lower left, and Blackwell FP4 NVL72 Dynamo in tan at centre right. No legend box.
Slide 29
100 MW AI Factory / H100 NVL8 / GPU Dies / 45K / Racks / 1,400 / Data Center Productivity / 300M / DeepSeek R1 Context and Generation, , ISL=32K, OSL=8K @ Pareto optimal TPS/User
Visuals: Full-bleed photograph of rows of black data-centre equipment: many identical dark grey rack or container units arranged in a grid and receding in perspective from the bottom-left foreground to a faded distant horizon at the top. The nearest units are sharpest and largest in the lower-left, with a fine silver-grey highlight on their front edges and small lit indicator panels (pale yellow-green and white) on the fronts. Each unit casts a soft reflection on a glossy black floor. Lighting is low-key, dark and directional, with the far rows dissolving into black. Dominant colours are black and charcoal grey with pale grey highlights. The image is not cropped in a visible way and is not boxed; it covers the full slide, with an overlay of the black background fading the top and far edges. Data table: 2 columns, 4 rows including header. Header row: '100 MW AI Factory' | 'H100 NVL8'. Row 1: 'GPU Dies' | '45K'. Row 2: 'Racks' | '1,400'. Row 3: 'Data Center Productivity' | '300M'. No chart, legend or highlighted points.
Slide 30
Blackwell 40X Hopper Inference Performance
NVLink Flops Per Watt ~ AI Factory Output
100 MW AI Factory / H100 NVL8 / GB200 NVL72
GPU Dies / 45K / 85K
Racks / 1,400 / 600
Data Center Productivity / 300M / 12,000M / 40X More Token Revenue
DeepSeek R1 Context and Generation, , ISL=32K, OSL=8K @ Pareto optimal TPS/User
Visuals: A three-quarter perspective rendering of rows of black AI server racks/containers, each with glowing gold-lit vertical rack slots and reflections on a black floor, receding from lower-left to upper-right and cropped at the left and right edges. The racks are dark charcoal with warm gold-yellow illumination, and they fade into darkness toward the top. Table: columns '100 MW AI Factory' (row labels), 'H100 NVL8' and 'GB200 NVL72'. Rows: GPU Dies 45K | 85K (bold gold); Racks 1,400 | 600 (bold gold); Data Center Productivity 300M | 12,000M (bold gold). Callout beside last row: 40X More Token Revenue. No chart, logos or icons.
Slide 31
Reviewers
Omniverse App Streaming
Application Hosting
On Premises
Cloud
Container
World State Controller
Kit App Streaming
Simulation Data Delegate
NVIDIA Warp
Flow
IndeX
VERTIV
Schneider Electric
Design Engineer
DCC/CAD ISV Application
3D Assets
USD Simulation Schema
USD Database
Network Admin
NVIDIA Air
Surrogate Model NIM
PhysicsNeMo Inference
USD Search
Edify 3D
Mechanical Engineers
cadence
AI Model Training
Simulation Data
Scene Data
Simulation Data
PhysicsNeMo Training
Simulation Foundation Model
AI Training ISV Application
AI Engineer
Electrical Engineers
etap
cadence
etap
CAD
SC'16 Data Center
Omniverse Channel APIs
USD APIs
Omniverse
Visuals: Left panel: a dark flow diagram with small line icons, orange and green square icons and blue person icons, connected by thin white arrows; boxes labelled Application Hosting (On Premises and Cloud icons), World State Controller (Kit App Streaming, Simulation Data Delegate, NVIDIA Warp, Flow, IndeX), 3D Assets (USD Simulation Schema, USD Database), Surrogate Model NIM (PhysicsNeMo Inference, USD Search, Edify 3D), and AI Model Training (Simulation Data, PhysicsNeMo Training, Simulation Foundation Model); the left column lists Reviewers, Design Engineer, Network Admin, Mechanical Engineers and Electrical Engineers as blue person icons with their application icons (Vertiv, Schneider Electric, DCC/CAD ISV Application, NVIDIA Air, cadence, etap). Centre column: four stacked thumbnail images, each with a green bottom edge: a cadence CFD render of a data hall with rainbow airflow streamlines, an etap single-line electrical layout, an NVIDIA render of a grey wireframe rack model, and a CAD render of a data center in white and yellow with the caption SC'16 Data Center. Dashed white double-headed arrows labelled Omniverse Channel APIs and USD APIs run down the centre. Right panel: a photograph of a dark server hall with rows of cream-coloured networking switches and blade racks, lit softly, shot from a low three-quarter angle and cropped at the panel edges. Omniverse logo: a green ring with a black centre, about 2.5 percent of slide width. Overall tint: the photo is darkened with a black overlay and the panels are semi-transparent.
Slide 32
Visuals: One photograph, a photorealistic 3D render of a data-centre aisle. Subject: a row of tall black server racks with cream and gold-coloured compute trays and networking switches, seen from a three-quarter angle. On the left a pair of glass doors in a dark metal frame carry white NVIDIA eye-shaped logos and the word NVIDIA, cut off at the panel edges. Left of the doors is a grey cabinet, and red and blue insulated pipes run down the top left. Overhead, black cable bundles drop from green and grey cable trays and wire mesh trays that run across the ceiling, with blue pipework above. Right side: further racks with gold-coloured cable connectors. The camera is at eye level, centred on the racks, with the aisle receding slightly to the left. Lighting is even and cool, with soft highlights on the metal. Dominant colours: black, charcoal grey, cream/gold, red, blue and green. The photo is not cropped, is boxed by rounded corners, and has no overlay or tint. No charts, tables, logos apart from the NVIDIA logos on the glass doors, or icons.
Slide 33
Grace
Blackwell Ultra NVL72
Second Half 2025
1.1 EF Dense FP4 Inference
0.36 EF FP8 Training
1.5X GB200 NVL72
New Attention Instructions
2X
20 TB HBM | 40 TB Fast Memory
1.5X
14.4 TB/s CX8
2X
Blackwell Ultra
2 Reticle-Sized GPUs
15PF Dense FP4 | 288GB HBM3e
Oberon Rack
Liquid Cooled
Visuals: 1) Photograph of an Oberon liquid-cooled rack (NVIDIA NVL72 Blackwell Ultra), tall portrait, occupying about x 7.6 to 28.6 and full height y 0 to 100 on a black ground; the rack has a dark charcoal frame and dark cabinet with gold-coloured compute trays (gold #C1B485-like brass tones) stacked in rows, with black cable bundles running down the sides; soft studio lighting, frontal view, centred composition, not cropped, boxed by the black background. 2) Photograph of the Grace CPU chip, square, about x 67.8 to 97.8 region in the top right area (image box about x 67.8 y 9.7 w 30 h 30 at 1200x675 pixels, the chip itself sits centre of a black square package with a dark bezel); the die shows a multicolour (green, orange, magenta) grid-like pattern lit from the centre. 3) Photograph of the Blackwell Ultra GPU package, about x 76.4 y 59.5 w 12.1 h 18.4; a gold-metal heatsink-style lid with four HBM stacks on top and bottom edges and a central die with a multicolour (pink, green, purple) pattern; it is boxed, not cropped, lit from above. 4) Raster image strips at about x 37.7 spanning the statistic lines (y 43.6 to 77.7), duplicating the text rows; they are visually identical to the text lines.
Slides 34 to 73 continue in the full text file.
Download this deck
The hosted PDF of every library deck is free for readers of the SlideDeck Co newsletter. Join with your email and the viewer and download appear here.
Building a deck of your own? The SlideDeck Co Standard Deck is a slide library for business presentations: reviews, updates and plans.







