
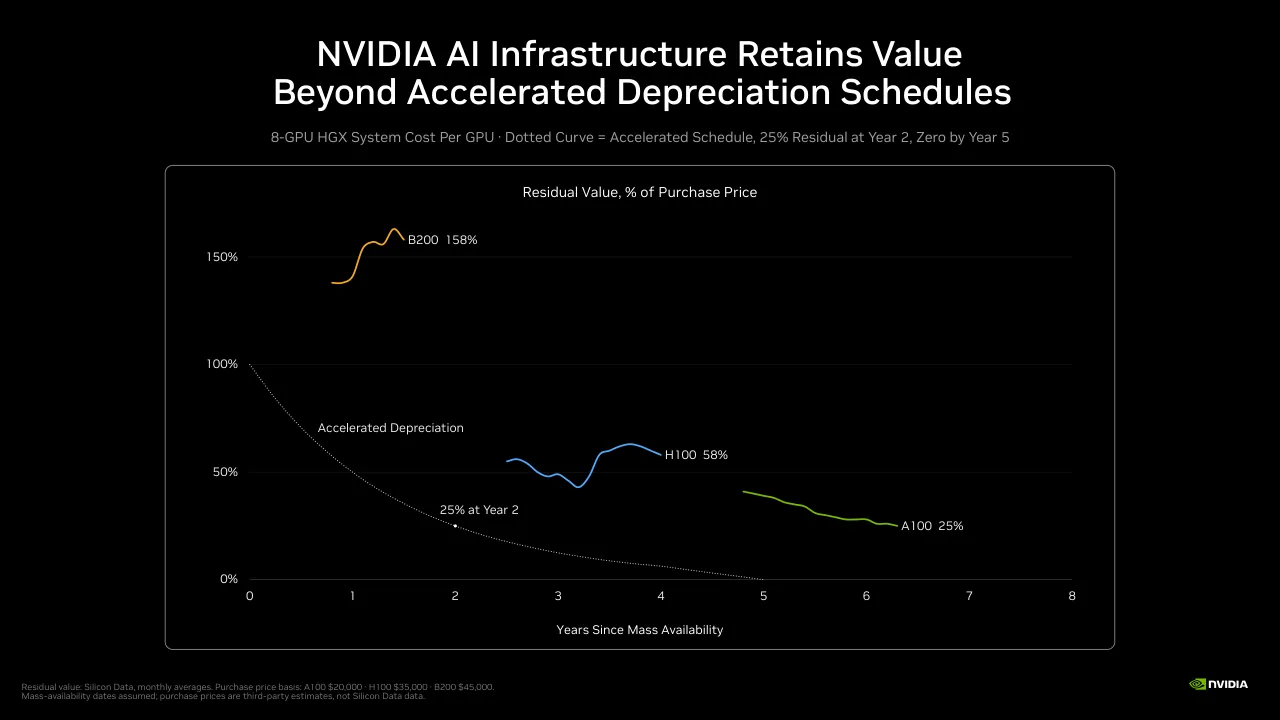
The deck is NVIDIA's September 2026 non-deal roadshow presentation for investors. It opens with a title slide and a long safe-harbor disclaimer covering forward-looking statements and non-GAAP measures, then moves into the company overview, describing NVIDIA as a full-stack AI factory platform and setting out its unique position across workload breadth, co-design, the CUDA ecosystem, deployment and global reach. A recent-events slide lists announcements since the last earnings report, followed by sections on capital returns and strategic investments, the full-stack platform, ecosystem customers, financial capacity and commitments, token economics, and product segments including Vera CPU, Groq 3 LPX, networking, NVLink Fusion and CUDA. Later sections cover residual value of GPUs, open models, Nemotron, physical AI and a closing summary of compounding growth. Slides worth studying include the per-gigawatt revenue chart on slide 11, the token economics comparison on slide 10, the networking growth chart on slide 17 and the GPU residual value curve on slide 22, all of which use charts to carry the argument.
Slides worth studying
Questions about this deck
What does the NVIDIA deck say about its per-gigawatt revenue opportunity?
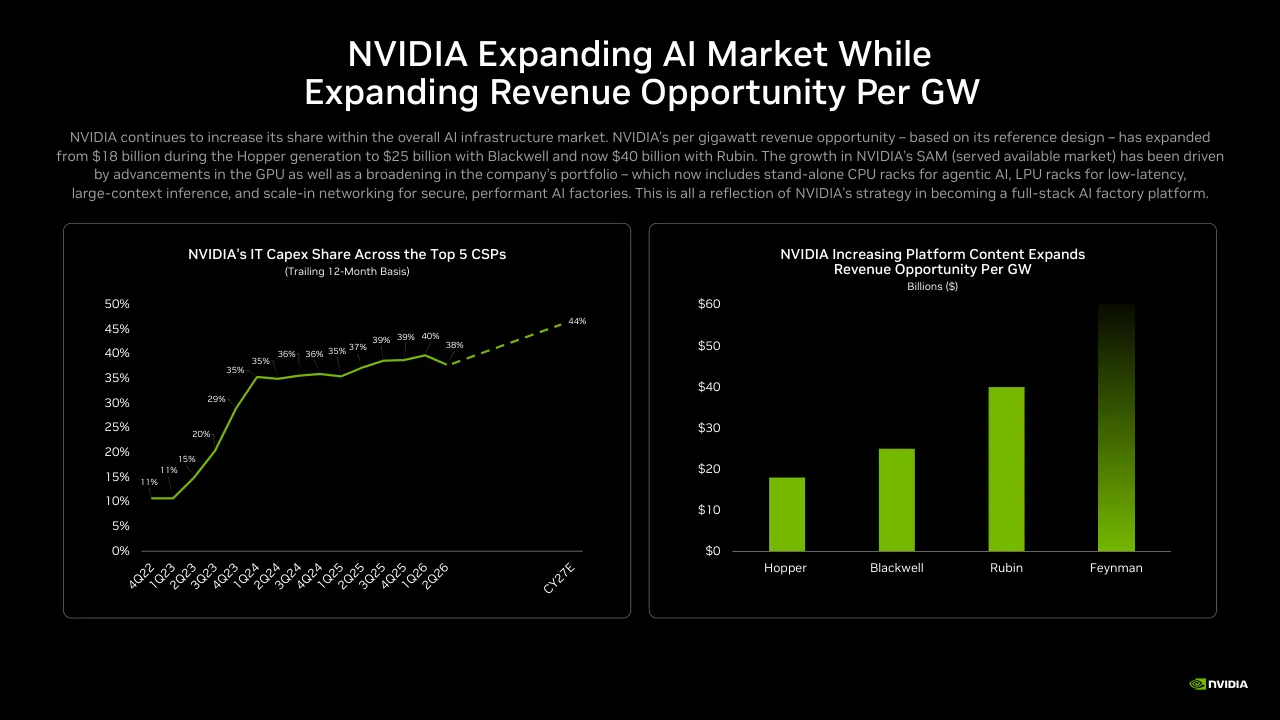
Slide 11 says NVIDIA's per gigawatt revenue opportunity, based on its reference design, has expanded from $18 billion during the Hopper generation to $25 billion with Blackwell and now $40 billion with Rubin. The slide ties this growth to advances in the GPU and a broader portfolio that includes stand-alone CPU racks, LPU racks and scale-in networking.
How many slides does the NVIDIA non-deal roadshow presentation have?
The NVIDIA deck has 29 pages. It opens with a title slide on slide 1 and a safe-harbor disclaimer on slide 2, then moves into the company overview.
What does the NVIDIA deck say about its share repurchase authorization?
Slide 6 says NVIDIA announced on September 28 a $150 billion increase to its share repurchase authorization, bringing the total authorization to $235 billion. The company expects to utilize this authorization through FY28.
What does the NVIDIA deck say about its networking revenue growth?
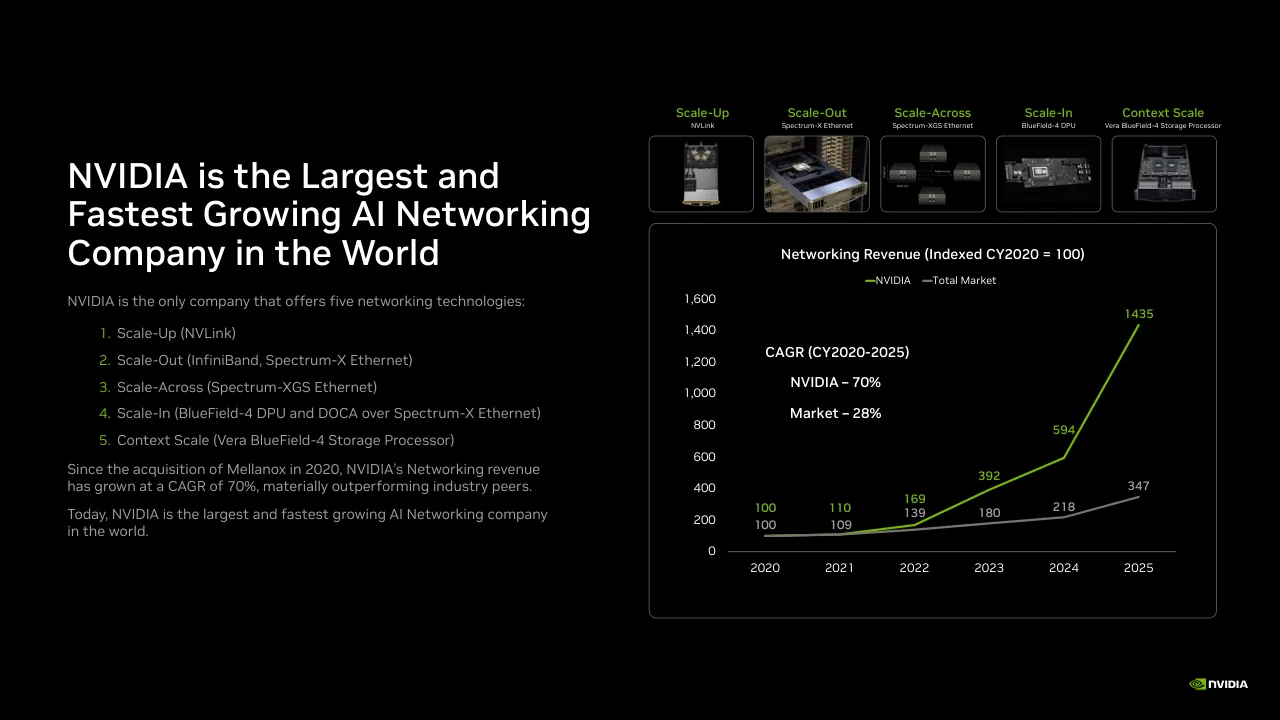
Slide 17 says that since the acquisition of Mellanox in 2020, NVIDIA's Networking revenue has grown at a CAGR of 70%, materially outperforming industry peers. The slide's chart shows the total market CAGR for CY2020-2025 at 28%.
Details
- Company: NVIDIA
- Year: 2026
- Type: Investor presentation
- Industry: Semiconductors
- Pages: 29
More from NVIDIA
- NVIDIA investor presentation, Annual Stockholder Meeting June 2026
- NVIDIA investor presentation, Q2 FY27 quarterly presentation
- NVIDIA keynote, GTC Europe 2026
- NVIDIA presentation, 2026
- NVIDIA keynote, GTC 2026 Keynote
- NVIDIA investor presentation, October 2025 NDR presentation
All NVIDIA decks in the library
Review score: 7 out of 10, Effective
Presentation quality, judged with the SlideDeck Co review heuristic. Ask, evidence and idea merit are not rated here.
The deck has a consistent black and NVIDIA green identity, action-style titles, and charts that carry real arguments, notably the paired curves on slide 10, the per-GW bars on slide 11 and the indexed networking chart on slide 17. The route from platform to economics to products to residual value to a closing summary is mostly coherent. Weaknesses are consequential: many slides depend on small gray body text and tiny labels (slides 4, 8, 13, 18, 21, 22), the financial tables on slide 9 are unreadable at presentation size, and slide 2 is a dense disclaimer wall. The deck reads better as a pre-read than as a projected presentation, and the closing slide 28 is a plain text block that ends weakly.
Worth keeping: Keep the paired comparison charts on slide 10, the green-against-gray emphasis with annotated multiples, and the single-chart-with-numbered-list layout on slide 17.
Most useful repair: Enlarge or simplify the small body text and diagram labels on slides 4, 8, 13, 18 and 21, and replace the screenshot-style tables on slide 9 with a few legible headline figures.
What would change the score: I would rebuild slide 28 as a visual summary tied to the three growth pillars, and cut the intro paragraphs above the charts on slides 11 and 15 to one line each.
Confidence medium. 29 of 29 pages inspected on contact sheets, 4 at readable size. Reviewed 2026-11-08. Model-assisted review (claude-sonnet-5-5).
Full text of the slides (29 slides)
Every slide's words and a description of its charts and images, so the deck can be searched and rebuilt. Also available as Markdown.
Slide 1
NVIDIA / NVIDIA Non-Deal / Roadshow / September 2026
Visuals: Full-bleed photograph of a dark, faceted, low-poly wall of black and charcoal triangular tiles with subtle blue-grey highlights at the top right. A large three-dimensional glossy NVIDIA eye-shaped logo in bright green (#76B900) sits on the right, angled, with its edges casting soft dark shadows on the tiles. Lighting is directional from the upper right, producing specular highlights on the green logo. Composition is landscape, the logo is cropped by the right edge of the frame. The image is not boxed and has no tint or overlay. Logo at top-left: green eye emblem with white NVIDIA wordmark.
Slide 2
Certain matters in this presentation including, but not limited to, statements as to: expectations with respect to growth, demand, performance, benefits, value
and availability of and opportunities for NVIDIA’s products, services, and technologies, including Vera Rubin, Vera and Groq3 LPX; NVIDIA’s financial position and
financial and business outlook; NVIDIA’s future cash dividends and other returns to shareholders, including share repurchases; expectations with respect to
NVIDIA’s third party arrangements, including with its collaborators and partners and its proposed Hugging Face acquisition; expectations with respect to
NVIDIA’s strategies, plans and investments; third parties adopting our products and technologies; expectations with respect to technology developments, and
related trends and drivers; projected market growth, opportunities and trends; expectations with respect to NVIDIA’s share in the market; expectations with
respect to AI and related industries and demand for AI; and other statements that are not historical facts are forward-looking statements within the meaning of
Section 27A of the Securities Act of 1933, as amended, and Section 21E of the Securities Exchange Act of 1934, as amended, which are subject to the “safe
harbor” created by those sections based on management’s beliefs and assumptions and on information currently available to management and are subject to
risks and uncertainties that could cause results to be materially different than expectations.
Important factors that could cause actual results to differ materially include: global economic and political conditions; NVIDIA’s reliance on third parties to
manufacture, assemble, package and test NVIDIA’s products; the impact of technological development and competition; development of new products and
technologies or enhancements to NVIDIA’s existing products and technologies; market acceptance of NVIDIA’s products or NVIDIA’s partners’ products; design,
manufacturing or software defects; changes in consumer preferences or demands; changes in industry standards and interfaces; unexpected loss of
performance of NVIDIA’s products or technologies when integrated into systems; NVIDIA’s ability to realize the potential benefits of business investments or
acquisitions; and changes in applicable laws and regulations, as well as other factors detailed from time to time in the most recent reports NVIDIA files with the
Securities and Exchange Commission, or SEC, including, but not limited to, its Annual Report on Form 10-K and Quarterly Reports on Form 10-Q. Copies of
reports filed with the SEC are posted on the company’s website and are available from NVIDIA without charge. These forward-looking statements are not
guarantees of future performance and speak only as of the date hereof, and, except as required by law, NVIDIA disclaims any obligation to update these forward-
looking statements to reflect future events or circumstances.
Many of the products and features described herein remain in various stages and will be offered on a when-and-if-available basis. The statements within are not
intended to be, and should not be interpreted as a commitment, promise, or legal obligation, and the development, release, and timing of any features or
functionalities described for our products is subject to change and remains at the sole discretion of NVIDIA. NVIDIA will have no liability for failure to deliver or
delay in the delivery of any of the products, features or functions set forth herein.
NVIDIA uses certain non-GAAP measures in this presentation including free cash flow. NVIDIA believes the presentation of its non-GAAP financial measures
enhances investors' overall understanding of the company's historical financial performance. The presentation of the company's non-GAAP financial measures is
not meant to be considered in isolation or as a substitute for the company's financial results prepared in accordance with GAAP, and the company's non-GAAP
measures may be different from non-GAAP measures used by other companies. Further information relevant to the interpretation of non-GAAP financial
measures, and reconciliations of these non-GAAP financial measures to the most comparable GAAP measures, may be found in the slide titled “Reconciliation of
Non-GAAP to GAAP Financial Measures.”
Visuals: Full-bleed photograph (6000 by 3375 px, 16:9) of a dark, low-key 3D surface of interlocking grey and black triangular facets, with lighter grey highlights at upper right and along the lower-right edge; no people, objects, logos or text other than the body copy. The image fills the entire frame, uncropped, with a near-black overall tone and no overlay beyond the image's own darkness.
Slide 3
NVIDIA
NVIDIA’s invention of the GPU in 1999 sparked the growth of the PC gaming market, redefined computer graphics, revolutionized accelerated computing, and ignited the era of modern AI.
NVIDIA has evolved from a chip provider to today, a full-stack AI factory platform – spanning GPUs, CPUs, networking, systems, software, developer tools, and cloud-scale deployment.
Today, NVIDIA is driving one of the most important computing platform shifts in decades as it builds the intelligence infrastructure layer for the global AI economy.
Every major technology era creates a new foundational layer. Electricity required power grids. The internet required networks, data centers, and cloud platforms. AI requires a new kind of infrastructure: AI factories that convert data and energy into intelligence – monetizable tokens.
As software, systems, robots, factories, vehicles, and enterprises become AI-powered, they will need infrastructure that is fast, trusted, scalable, widely adopted, fungible, and durable. NVIDIA is the full-stack infrastructure platform for the age of AI: the company that turns chips, systems, software, developers, and data centers into AI factories.
Headquarters: Santa Clara, CA | Employees: 42,000+
Visuals: One photograph filling the full slide as background. Subject: a modern campus outdoor space with a large open steel space-frame canopy of crossing white-grey beams and diagonal struts, a round tiered structure with warm terracotta-coloured walls beneath it, a glass building wing on the left, and landscaped lawns, pathways, stone benches and trees in the foreground. The photo is heavily blurred (depth-of-field and motion softness) and viewed from an elevated angle. Lighting is soft natural daylight with warm late-sun tones on the trees and pale blue sky at the top left. Dominant colours: sky blue, pale grey-white steel, green foliage, warm tan and terracotta. The image is not cropped in a way that matters, is full-bleed, and has a dark overlay panel on its right side. No logos or icons.
Slide 4
NVIDIA’s Unique Position in the AI Economy
NVIDIA combines CUDA programmable compute, full-stack AI factory co-design,
a developer ecosystem and global deployment channels in one AI infrastructure platform.
AI Workload Breadth
One programmable
platform spans training,
inference and agentic AI
across open and closed
models, capturing more of
AI’s expanding workloads.
Existing customer demand
growing >100% year over
year, with an expanding
customer base.
Extreme Co-Design
Compute, networking and
software co-designed
at factory scale improve
tokens per watt and
tokens per dollar.
Vera Rubin delivers up to
45X lower cost per token.
CUDA Ecosystem
CUDA compounds developer
innovation and installed-
base value, keeping NVIDIA
compute productive,
fungible and durable.
~10 years A100 productive
life. Excellent cloud rental
economics and strong
residual value.
Full-Stack AI Factory
A complete and optimized
platform enables more
customers to deploy AI
factories and expands
NVIDIA content per factory.
NVIDIA content growing:
Hopper $18B/GW to
Rubin $40B/GW.
Global Market Reach
Open models, enterprise
agents, sovereign AI and
physical AI unlock new
builders, industries,
and markets.
ACI&E approx. half of the
business and growing
~100% year over year.
Visuals: Five line icons in lime green #BFEB2E with 2px-equivalent strokes, one per card. Card 1: a bar chart of four vertical outlined bars of varying heights with a rising zigzag line above them and a circled dollar sign at the top right of the line. Card 2: a circled dollar sign with an arrow curving clockwise from its upper right edge. Card 3: a browser-style window outline with a top bar and three small dashes at the right, containing a centred code symbol with angle brackets and a slash. Card 4: a factory silhouette with a sawtooth roof, a small square window block at lower left, three vertical tick marks, and a tall slanted chimney with a circle near its top. Card 5: a globe drawn as an outlined circle with a vertical ellipse and horizontal latitude lines. Three of the five icons are not cropped and sit fully inside their cards. Below each icon is a chevron, a downward-pointing V in green #76B900. No photographs, charts or tables.
Slide 5
Since Our Q2 Earnings Announcement…
1.
New models/agents on NVIDIA infrastructure – Astra (OpenAI), Muse (Meta), Grok Bot (SpaceXAI)
2.
NVIDIA announced Open Agent Safety Platform with OpenShell and Sentry with broad industry support
3.
NVIDIA to acquire Hugging Face for $12.9 billion
4.
Anthropic contracts 2.6 GW to date in NVIDIA AI infrastructure to be shipped through 2028
5.
Anthropic’s total reported contracted value across multiple CSPs/neoclouds now exceeds $180B
6.
NVIDIA’s neocloud partners in Australia deliver up to 2GW by 2027
7.
Nscale and Firmus file for IPO
8.
Palantir to deliver Ontology for Cybersecurity via Cisco’s Security AI factory with NVIDIA as a preferred full-stack foundation
9.
d-Matrix to connect its next-gen XPUs to NVIDIA AI infrastructure via NVLink Fusion
10.
Cisco adds rack-scale AI computing solutions to its portfolio
Visuals: One small NVIDIA logo at bottom right: the green NVIDIA eye mark (#76B900) followed by the white NVIDIA wordmark in bold capitals. No charts, photographs, diagrams or other graphics.
Slide 6
NVIDIA Announces a $150B Share Repurchase Authorization Increase / NVIDIA makes strategic investments across the ecosystem to develop and accelerate growth of the market and CUDA ecosystem. Today, NVIDIA's portfolio consists of / 13 public companies and 229 private companies. Realized ROI on exits-to-date exceeds 3X. We are committed to sharing the company's success with shareholders and / will return excess free cash flow net of strategic uses in the form of share repurchases and a gradually growing dividend. On September 28, we announced a $150 / billion increase to our share repurchase authorization, bringing our total authorization to $235 billion, which we expect to utilize through FY28. / Strategic Investments Across All Layers of the AI Cake / Applications / ABRIDGE / Agility Robotics / NOKIA / Orbital Industries / Revolut / SYNOPSYS / WAYVE / Models / ANTHROPIC / Mistral AI / OpenAI / SPACEX / ssi / THINKING MACHINES / Infrastructure / CoreWeave / Crusoe / firmus / Lambda / NEBIUS / NSCALE / VOLTA / Chips / COHERENT / CORNING / intel. / LUMENTUM / MARVELL / MEDIATEK / SiFive / Energy / LPS / ATOMIC CANYON / LANCIUM / REDWOOD MATERIALS / SB Energy / TerraPower / Note: Strategic investments are not exclusive to those included in the table. / Increasing Stock Repurchases ($ Billions) / $250 / $235 / $200 / $150 / FY27: $53B YTD / Already / $13B above / full-year FY26 / New Authorization, / $150 / $100 / $50 / $40 / $34 / $10 / $0 / FY24 / FY25 / FY26 / FY27 YTD / Total / Remaining Prior / Authorization, / $85 / Authorization
Visuals: Left panel: a logo matrix in five groups, each with a green category label centred above a row of white logos separated by thin grey horizontal rules. Applications (7 logos): Abridge, Agility Robotics, Nokia, Orbital Industries, Revolut, Synopsys, Wayve. Models (6 logos): Anthropic, Mistral AI, OpenAI, SpaceX, SSI, Thinking Machines. Infrastructure (7 logos): CoreWeave, Crusoe, firmus, Lambda, Nebius, Nscale, Volta. Chips (7 logos): Coherent, Corning, Intel, Lumentum, Marvell, MediaTek, SiFive. Energy / LPS (5 logos): Atomic Canyon, Lancium, Redwood Materials, SB Energy, TerraPower. All logos are white or light grey on black. Right panel: a vertical bar chart titled 'Increasing Stock Repurchases ($ Billions)', y-axis $0 to $250 in steps of $50 with labels, x-axis categories FY24, FY25, FY26, FY27 YTD, Total Authorization. Series values as printed: FY24 $10, FY25 $34, FY26 $40, FY27 YTD $53 (highlighted in bright lime #B8FF3C with a callout box), Total Authorization $235 (stacked: New Authorization $150 in deep purple #351147 on top, Remaining Prior Authorization $85 in darker purple at the base). Bars for FY24 to FY26 are dark olive green #3B5D00; the FY27 YTD bar is lime green. A rounded callout box with lime outline (about x 75 to 90, y 51 to 64) reads 'FY27: $53B YTD / Already $13B above full-year FY26', connected by a thin lime leader line from the box to the top of the FY27 YTD bar. No legend; the note about the stacked total is in-chart text labels.
Slide 7
NVIDIA Full-Stack AI Factory Platform,
Not the Chip, Determines Economic Output
What NVIDIA builds is fundamentally different from
what other chip companies build.
The Vera Rubin platform integrates seven purpose-
built chips across five rack-scale systems. And,
through the DSX AI factory platform, NVIDIA helps
design, build and operate efficient, resilient and
grid-ready AI factories.
The ability to extreme co-design at AI factory scale
is unique to NVIDIA, and the result is integrated yet
customizable infrastructure that can be deployed
across every major cloud, inside enterprise data
centers, at the edge, and into robotics and physical
AI systems.
NVIDIA delivers x-factor performance gains every year
and continuously improves the performance of its
installed base through software enhancements.
The NVIDIA Full-Stack AI Factory
CUDA-X Libraries
Platform Libraries
Open Models
cuDNN
NIXL
CCCL
DOCA
cuSPARSE
NVSHMEM
CUDA Python
NCCL
NVTX
cuBLAS
TensorRT-LLM
cuTILE Python
Megatron Core
NVRTC
Transformer Engine
CUTLASS
Dynamo
CuTe DSL
Vera Rubin NVL72 Compute Tray
Vera Rubin NVL72 NVLink Switch Tray
Vera CPU Tray
Spectrum-6 SPX Switch Tray
Groq 3 LPX Tray
Vera BlueField-4 STX Storage Tray
Vera CPU Tray
Rubin GPU
Vera
Grace BlueField
ConnectX-9
NVLink 6 Switch
Vera
Spectrum-6 Switch
Groq 3
Vera BlueField-4 STX
Vera BlueField-4
NVIDIA DSX
Visuals: A single framed panel image (about 57.3% by 57.3% of slide, 16:9 image of 3840 by 2160 px) with a near-black background and a thin light grey rounded border. Its title reads The NVIDIA Full-Stack AI Factory in white sans-serif, centered near the top. The upper part has three groups of icons with captions. Left group, captioned CUDA-X Libraries in gold, shows a row of six overlapping rectangular tiles with green, teal and blue computer-graphics renderings, the central tile brightest with a glowing blue and green circuit image. Centre group, captioned Platform Libraries in gold, is a grid of labelled grey rounded rectangles: top row cuDNN; second row NIXL, CCCL, DOCA; third row cuSPARSE, NVSHMEM, CUDA Python, NCCL, NVTX; fourth row cuBLAS, TensorRT-LLM, cuTILE Python, Megatron Core, NVRTC; fifth row Transformer Engine, CUTLASS, Dynamo; sixth row CuTe DSL. Right group, captioned Open Models in gold, shows six overlapping tiles with figurative renderings: a globe, a DNA-like helix, a central humanoid figure, a spiral and a human body figure. Below is a row of seven line-drawn server rack illustrations in glowing gold and white outline, each with a small two-line caption above: Vera Rubin NVL72 Compute Tray (with labels Rubin GPU, Vera, Grace BlueField, ConnectX-9 pointing to the rack), Vera Rubin NVL72 NVLink Switch Tray (label NVLink 6 Switch), Vera CPU Tray (label Vera), Spectrum-6 SPX Switch Tray (label Spectrum-6 Switch), Groq 3 LPX Tray (label Groq 3), Vera BlueField-4 STX Storage Tray (labels Vera BlueField-4 STX), and Vera CPU Tray (label Vera BlueField-4). The lower band of the panel, on a dark purple-to-blue gradient, shows a large isometric rendering of a flat AI data-centre building with glowing warm white lights along its edges and a blue-lit central hall, captioned NVIDIA DSX in gold at the bottom centre. The panel has no overlay beyond the dark tint and is boxed, not cropped or full-bleed.
Slide 8
CUDA Programmability and Full-Stack AI Factory
Expand the Global Diverse AI Market
Programmability open new growth | CUDA-X libraries connect ecosystems | Full-stack AI factory open go-to-market options
ENTERPRISE & INDUSTRIAL
CSPs
AI LABS
SELF-HOST
AI NATIVES
NVIDIA
Full-Stack
AI Factory
ODMs & OEMs
NEOCLOUDS
Auto | Gaming | Public Sector
Defense | Healthcare | Retail & Logistics
Energy | M & E | Supercomputing
FSI | Manufacturing | Telco
AWS | Microsoft Azure
Google Cloud | Oracle Cloud
Meta | SpaceXAI
Anthropic
Gemini
Meta
OpenAI
SpaceXAI
10K+ Startups
AI2 | Periodic Labs
AMI Labs | Physical Intelligence
BFL | Prometheus
Cognition | Reflection
Cursor | Revolution Labs
Epochal | Ricursive Intelligence
Flapping Airplanes | River AI
Humans& | Sakana
Ineffable | Skild.AI
Inception Labs | SSI
Magic | TML
Mistral | Cohere
Aivres | Gigabyte | Quanta
Asus | HPE | Supermicro
Bull | Inventec | Wistron
Dell | Lenovo | Wiwynn
Foxconn | Pegatron
CoreWeave | IREN | Reliance
Crusoe | Lambda | Volta
Firebird | Mistral | Yotta
Firmus | Nebius
GMI | Nscale
Visuals: Donut diagram made of six equal-looking wedges arranged clockwise from the top right: CSPs (top right, pale lime gradient), AI NATIVES (right, light lime gradient), NEOCLOUDS (bottom right, bright lime green gradient), ODMs & OEMs (bottom left, medium green gradient), AI LABS SELF-HOST (left, medium green gradient), ENTERPRISE & INDUSTRIAL (top left, dark olive green gradient). Each wedge is separated from its neighbours by a thin black gap. A black centre disc holds the label NVIDIA Full-Stack AI Factory in white. Six dark callout boxes list the members of each group: Enterprise & Industrial box lists Auto, Defense, Energy, FSI, Gaming, Healthcare, M & E, Manufacturing, Public Sector, Retail & Logistics, Supercomputing, Telco. CSPs box lists AWS, Google Cloud, Meta, Microsoft Azure, Oracle Cloud, SpaceXAI. AI Labs Self-Host box lists Anthropic, Gemini, Meta, OpenAI, SpaceXAI. 10K+ Startups box lists AI2, AMI Labs, BFL, Cognition, Cursor, Epochal, Flapping Airplanes, Humans&, Ineffable, Inception Labs, Magic, Mistral, Periodic Labs, Physical Intelligence, Prometheus, Reflection, Revolution Labs, Ricursive Intelligence, River AI, Sakana, Skild.AI, SSI, TML, Cohere. ODMs & OEMs box lists Aivres, Asus, Bull, Dell, Foxconn, Gigabyte, HPE, Inventec, Lenovo, Pegatron, Quanta, Supermicro, Wistron, Wiwynn. Neoclouds box lists CoreWeave, Crusoe, Firebird, Firmus, GMI, IREN, Lambda, Mistral, Nebius, Nscale, Reliance, Volta, Yotta. No photographs or icons; no logos.
Slide 9
NVIDIA Will Leverage Its Financial Capacity to Support the Ecosystem
Future commitments by fiscal year as of July 26, 2026, were as follows:
Remainder of 2027 / 2028 / 2029 / 2030 / 2031 / 2032 and thereafter / Total
(In billions)
Supply and capacity $ 92 $ 87 $ 88 $ 6 $ 5 $ 1 $ 279
Cloud service agreements 3 8 7 6 4 1 29
Data center leases not commenced — 1 1 2 1 20 25
Equity investments 18 3 2 2 — — 25
Capital expenditures 7 1 — — — — 8
Total $ 120 $ 100 $ 98 $ 16 $ 10 $ 22 $ 366
Future commitments by fiscal year as of July 26, 2026, were as follows:
Remainder of 2027 / 2028 / 2029 / 2030 / 2031 / 2032 and thereafter / Total
(In billions)
AI cloud agreements $ — $ 6 $ 8 $ 7 $ 6 $ 9 $ 36
Data center leases not commenced for third party — — 1 1 1 17 20
Total $ — $ 6 $ 9 $ 8 $ 7 $ 26 $ 56
The following table summarizes the maximum gross exposure related to our guarantees, including the SB Energy Corp. guarantees signed in August 2026 (in billions):
Land, power, and shell guarantees for AI clouds $ 3.5
SB Energy Corp. guarantees 105.0
Total $ 108.5
We’ve partnered with our extensive network of suppliers to secure the critical components needed to meet demand for the next several years. Our commitments increased from $119 billion last quarter to $279 billion, primarily related to the procurement of memory.
We’ve partnered with leading AI clouds to enable broader access to our AI infrastructure to serve AI startups, model builders, enterprises, research organizations and sovereign customers. Under these agreements, we will earn revenue on the upfront sale of our infrastructure and, if certain criteria are met, we will participate in revenue share generated by the AI clouds from their third-party customers.
We signed data center lease agreements with terms of ~15 years that are expected to commence between FY2028 and FY2029. We expect to reassign these data center leases to third parties.
We entered into guarantees to provide credit support on the land, power, and shell buildout to secure approximately 4.25 GW at SB Energy's PORTS-Pike Technology Campus in Ohio, which will exclusively host several generations of NVIDIA infrastructure under 20-year leases to OpenAI, subject to limited exceptions.
Visuals: Four green line arrows, each with a filled triangular head pointing right toward the text. Arrow 1 is horizontal, pointing from the first table to paragraph 1. Arrow 2 is diagonal, rising from the bottom of the second table to paragraph 2. Arrow 3 is a shallow diagonal descending from the second table to paragraph 3. Arrow 4 is a shallow diagonal descending from the third table to paragraph 4. Table 1 (top, white box): caption 'Future commitments by fiscal year as of July 26, 2026, were as follows:'; columns Remainder of 2027, 2028, 2029, 2030, 2031, 2032 and thereafter, Total, with the header line '(In billions)'. Rows: Supply and capacity $92, $87, $88, $6, $5, $1, $279; Cloud service agreements 3, 8, 7, 6, 4, 1, 29; Data center leases not commenced —, 1, 1, 2, 1, 20, 25; Equity investments 18, 3, 2, 2, —, —, 25; Capital expenditures 7, 1, —, —, —, —, 8; Total $120, $100, $98, $16, $10, $22, $366. Table 2 (middle, white box): same caption and columns. Rows: AI cloud agreements $—, $6, $8, $7, $6, $9, $36; Data center leases not commenced for third party —, —, 1, 1, 1, 17, 20; Total $—, $6, $9, $8, $7, $26, $56. Table 3 (bottom, white box): caption 'The following table summarizes the maximum gross exposure related to our guarantees, including the SB Energy Corp. guarantees signed in August 2026 (in billions):'; rows Land, power, and shell guarantees for AI clouds $3.5; SB Energy Corp. guarantees 105.0; Total $108.5 (total ruled above). Table cell text is black on white with thin black rules under column headers and above totals; light grey row banding alternates on rows.
Slide 10
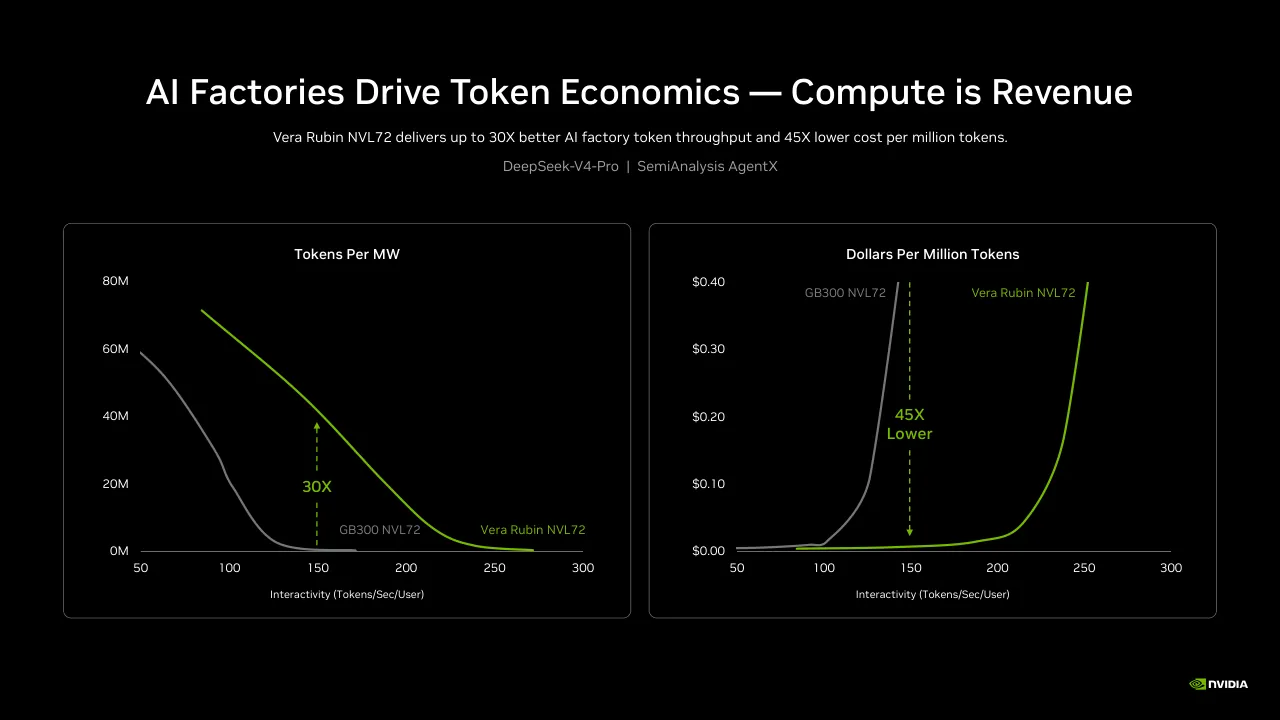
AI Factories Drive Token Economics — Compute is Revenue
Vera Rubin NVL72 delivers up to 30X better AI factory token throughput and 45X lower cost per million tokens.
DeepSeek-V4-Pro | SemiAnalysis AgentX
Tokens Per MW
80M
60M
40M
20M
0M
50
100
150
200
250
300
GB300 NVL72
Vera Rubin NVL72
30X
Interactivity (Tokens/Sec/User)
Dollars Per Million Tokens
$0.40
$0.30
$0.20
$0.10
$0.00
50
100
150
200
250
300
GB300 NVL72
Vera Rubin NVL72
45X
Lower
Interactivity (Tokens/Sec/User)
Visuals: Two line charts in outlined rounded-corner boxes. Left chart: title 'Tokens Per MW'; y-axis 0M to 80M in 20M steps, unlabelled units beyond the 'M' suffix; x-axis 'Interactivity (Tokens/Sec/User)' ticks 50, 100, 150, 200, 250, 300. Series 1 'Vera Rubin NVL72' (green #76B900) starts about x=84 at about 71M and falls smoothly to about 0M near x=272. Series 2 'GB300 NVL72' (grey #7F7F7F) starts about x=50 at about 58M, falls steeply to about 0M by x=170. A green dashed vertical double-headed arrow at x=150 spans from the GB300 curve to the Vera Rubin curve, labelled '30X' in green. Right chart: title 'Dollars Per Million Tokens'; y-axis $0.00 to $0.40 in $0.10 steps; x-axis 'Interactivity (Tokens/Sec/User)' ticks 50 to 300. Series 'GB300 NVL72' (grey) stays near $0.00 to about x=100, then rises steeply, exiting the top of the plot at about x=142 at $0.40. Series 'Vera Rubin NVL72' (green) stays near $0.00 until about x=190, then rises, exiting the top at about x=254 at $0.40. A green dashed vertical arrow at x=150 points down from the top of the plot to the baseline, labelled '45X Lower' in green. No legend box; series are identified by direct labels next to the curves. No values are printed on the curves; the 30X and 45X labels are the only printed values.
Slide 11
NVIDIA Expanding AI Market While
Expanding Revenue Opportunity Per GW
NVIDIA continues to increase its share within the overall AI infrastructure market. NVIDIA’s per gigawatt revenue opportunity – based on its reference design – has expanded
from $18 billion during the Hopper generation to $25 billion with Blackwell and now $40 billion with Rubin. The growth in NVIDIA’s SAM (served available market) has been driven
by advancements in the GPU as well as a broadening in the company’s portfolio – which now includes stand-alone CPU racks for agentic AI, LPU racks for low-latency,
large-context inference, and scale-in networking for secure, performant AI factories. This is all a reflection of NVIDIA’s strategy in becoming a full-stack AI factory platform.
NVIDIA’s IT Capex Share Across the Top 5 CSPs
(Trailing 12-Month Basis)
50%
45%
40%
35%
30%
25%
20%
15%
10%
5%
0%
4Q22
1Q23
2Q23
3Q23
4Q23
1Q24
2Q24
3Q24
4Q24
1Q25
2Q25
3Q25
4Q25
1Q26
2Q26
CY27E
11%
11%
15%
20%
29%
35%
35%
36%
36%
35%
37%
39%
39%
40%
38%
44%
NVIDIA Increasing Platform Content Expands
Revenue Opportunity Per GW
Billions ($)
$60
$50
$40
$30
$20
$10
$0
Hopper
Blackwell
Rubin
Feynman
Visuals: Two charts. Left: a line chart titled NVIDIA’s IT Capex Share Across the Top 5 CSPs with subtitle (Trailing 12-Month Basis); y-axis 0% to 50% in 5% steps, no gridlines, x-axis categories 4Q22, 1Q23, 2Q23, 3Q23, 4Q23, 1Q24, 2Q24, 3Q24, 4Q24, 1Q25, 2Q25, 3Q25, 4Q25, 1Q26, 2Q26 (solid) then CY27E (dashed projection), labels rotated about 45 degrees. One green (#76B900) series with labelled values: 4Q22 11%, 1Q23 11%, 2Q23 15%, 3Q23 20%, 4Q23 29%, 1Q24 35%, 2Q24 35%, 3Q24 36%, 4Q24 36%, 1Q25 35%, 2Q25 37%, 3Q25 39%, 4Q25 39%, 1Q26 40%, 2Q26 38%; dashed extension to CY27E 44%. Data labels in small white text with thin leader ticks; no legend; no highlighted points. Right: a column chart titled NVIDIA Increasing Platform Content Expands / Revenue Opportunity Per GW with unit line Billions ($); y-axis $0 to $60 in $10 steps; categories Hopper, Blackwell, Rubin, Feynman; no data labels on bars. Hopper bar about $18 (from text), Blackwell $25 (from text), Rubin $40 (from text), Feynman about $60 by axis reading (no value printed). Bars are solid #76B900 except Feynman, which is a vertical gradient from near-black olive at top to #76B900 at bottom. No legend. Logo: NVIDIA eye mark in green with white NVIDIA wordmark, bottom right.
Slide 12
Increasing Share of Data Center CapEx
Vera Rubin NVL72
Compute Node
Model Processing
Vera MGX
Compute Node
Secure Agent Processing
Vera CMX
Storage Node
Context KV$ Offload
Vera DPX
Storage Node
Data Processing
Visuals: Four photographic renderings of data centre server units, shown at three-quarter angles on a black reflective surface with soft mirror reflections beneath each unit. From left to right: (1) Vera Rubin NVL72 Compute Node, a flat tray-style board with gold-edged handles, several gold-lidded processor modules with green and blue centres, a central black heat spine and a dark board with small connectors; (2) Vera MGX Compute Node, a tray with six visible dark processor packages with blue and green centres, four small gold-framed modules along the bottom edge, and a silver-grey lower panel with gold handles; (3) Vera CMX Storage Node, an open chassis with a black interior board, two large processor packages with green centres, several smaller modules and connectors, and a silver lower panel with gold-coloured vents; (4) Vera DPX Storage Node, a taller rack-style chassis with gold-coloured heatsink fins on top, a dark circuit board with a row of connectors, and a gold-toned front grille with vent panels. Lighting is a single soft key light from above, producing highlights on the metal edges. Dominant colours are black, gold, silver-grey and small green and blue accents. Each unit is shown whole, not cropped, and is not boxed; the photograph covers the full slide.
Slide 13
Announcing NVIDIA Open Agent Security Platform
An Open Reference Design with NVIDIA OpenShell and NVIDIA Sentry
OpenShell is a policy-controlled runtime between an agent and the enterprise systems it can affect – data, files, credentials, tools, APIs, models, and networks.
OpenShell addresses the agent security problem: 1) Prevents uncontrolled access to enterprise data, 2) Limits credential exposure and misuse, 3) Controls agent tool use and code execution, 4) Applies default-deny network egress where appropriate, 5) Helps contain prompt injection, malicious retrieved content, and harmful tool calls, and 6) Creates an auditable runtime boundary for long-running autonomous workflows.
Secure Runtime Boundary
Governs and Mediates All Actions, Enforces Policy at Runtime
In-Silicon Out-of-Band Monitor
Agent Reasoning Inspection and Tamper-Proof Telemetry
NVIDIA OpenShell
Gateway
Supervisor
Policy Prover
Agent Harness
Agent Sandbox
NVIDIA Sentry
Hardware-Based Enforcement
Continuous Agent Monitoring and Threat Detection
Trusted Telemetry and Detection Pipeline
Millisecond-Scale Containment and Quarantine
Vera CPU
BlueField-4
Prompt / Tools / Data / Model / Policies
Prompt
Tools
Data
Model
Vera MGX Compute Node
Secure Agent Processing
Visuals: 1) Photograph/illustration: a tall, dark, vertical compute-node rack centred horizontally at about x 40 to 60 percent and spanning roughly y 32 to 96 percent. It shows stacked black chassis with heatsink fins, four rows of square chips with coloured blue and pink-purple glowing dies on the upper and middle sections, two gold-brown chips near the bottom, a silver metal cover plate at the base, and gold-tan handles at the foot. Lighting is dim and directional with the chips lit. Dominant colours are black, dark grey, silver and gold-tan with small blue and magenta accents. The image is unboxed and sits directly on the black background; it is not cropped. Text labels Vera CPU and BlueField-4 sit on small dark boxes with thin white outlines over the chassis. 2) Diagram: a green (#76B900) double-headed arrow runs horizontally from the OpenShell panel to the rack at about y 50 percent, with arrowheads at both ends and a thin line. A green vertical double-headed arrow runs from the upper rack chips down to the bottom chips at about x 44 percent, with arrowheads at both ends. A green horizontal arrow at about y 76 percent runs from the rack's lower chips to the Sentry panel, with an arrowhead pointing right into the panel. Grey stacked labels Prompt, Tools, Data, Model, Policies sit between the rack and the Sentry panel at about x 60 percent. 3) Shapes: NVIDIA OpenShell and NVIDIA Sentry are rounded-corner rectangles with a 2 px green (#76B900) outline and no fill. Inside OpenShell are three dark grey tiles (Gateway, Supervisor, Policy Prover) and one larger dark grey tile (Agent Harness) inside a white dashed rounded rectangle labelled Agent Sandbox. Inside Sentry are four dark grey tiles in a vertical stack. Below Sentry are four dark grey tiles in a row, each linked by a grey dashed double-headed arrow to the Sentry panel. 4) Icons: two green outline padlocks, one at the top-left corner of the OpenShell panel and one at the top-right corner of the Sentry panel. 5) Logo: the NVIDIA logo in green and white at bottom right.
Slide 14
NVIDIA Vera Delivers / Maximum Single-Threaded / Performance at Scale / NVIDIA’s data center CPU journey began in 2021 with the / introduction of the Grace CPU. / Today, we are in full production of our next-generation Vera CPU. / As a stand-alone product, Vera expands NVIDIA’s SAM even further. / CPUs have historically traded speed against volume: how fast one / task finishes versus how many run at once. Pre-cloud CPUs chose / speed, while cloud CPUs chose volume (more but slower cores). / Agentic AI needs both, and Vera is the first data center CPU / purpose-built for these workloads. / High / NEW / Pre-Cloud CPU / Frequency-Optimized / Max Single-Threaded / CPU at Scale / Single-Threaded / Core Performance / Low / Cloud CPU / Scale Out / Low / High / Throughput
Visuals: Diagram: a 2x2 quadrant matrix drawn with thin light-grey (#757575) lines, outer frame about 58.3% to 92.6% of slide width and 18.0% to 75.1% of slide height, with a vertical divider at about 75.4% of width and a horizontal divider at about 46.3% of height. Y-axis labelled High (top) and Low (bottom) with the green rotated-free label Single-Threaded Core Performance placed between them on the left; X-axis labelled Low (left column) and High (right column) beneath the frame, with the green label Throughput centred below. Top-left quadrant: small grey filled dot (#757575, about 1% diameter) above the grey label Pre-Cloud CPU and italic grey Frequency-Optimized. Top-right quadrant: highlighted box with a bright green (#76B900) border about 0.3% wide and a dark green tint fill (#598B00 at 15% opacity over black, appearing about #0E1A00); small bright green filled dot (#76B900) above green label NEW, then white label Max Single-Threaded / CPU at Scale. Bottom-right quadrant: small grey filled dot (#757575) above grey label Cloud CPU and italic grey Scale Out. Bottom-left quadrant is empty. No photographs, icons, or charts beyond this matrix; the only logo is the NVIDIA wordmark with its eye symbol in green (#76B900) and white text at bottom right.
Slide 15
NVIDIA Vera Delivers Over 2X More Performance
and Memory Bandwidth for a 100 MW CPU Data Center
Vera completes agentic tasks 2.2X faster on the SPEC benchmark and provides 2.5X more bandwidth than leading x86 data center CPUs. With shipments
already underway to lead partners including OCI, SpaceXAI and AWS, Vera is expected to be deployed by every major hyperscaler, neocloud, AI lab, and
system OEM. With CPU revenue expected to more than double in FY2028, NVIDIA is set to become one of the world’s leading CPU suppliers.
100 MW CPU Data Center
x86 CPU 128C
NVIDIA Vera 88C
2.5X
2.0X
1.5X
1.0X
0.5X
0.0X
2.4X
2.1X
1.2X
210
7,600
180
140
3,600
90
CPUs (k)
Throughput
(SPECrate2026_int_base)
Memory Bandwidth (PB/s)
NVIDIA
Visuals: Grouped bar chart titled 100 MW CPU Data Center, set inside a thin-outlined rounded rectangle panel. Legend above the plot: grey square followed by x86 CPU 128C, then green square followed by NVIDIA Vera 88C. Y axis runs from 0.0X to 2.5X in steps of 0.5X, labelled with X-suffixed values and no axis title. X axis categories are CPUs (k), Throughput (SPECrate2026_int_base) and Memory Bandwidth (PB/s). Series values: CPUs (k) x86 140 at 1.0X and Vera 180 at 1.2X; Throughput x86 3,600 at 1.0X and Vera 7,600 at 2.1X; Memory Bandwidth x86 90 at 1.0X and Vera 210 at 2.4X. Raw values are printed inside the bars in black bold or medium type, and multiplier labels sit above each bar in white. Grey bars are #989898 and green bars are #76B900, with a thin grey baseline. No highlighted points beyond the green series.
Slide 16
Groq 3 LPX Co-Designed with Vera Rubin / Delivers Leadership Low-Latency Inference Performance / NVIDIA is in full production of Groq 3 LPX, the company’s first rack-scale LPU system. Together with the Vera Rubin NVL72 system, LPX expands the frontier / addressable by NVIDIA’s full-stack computing platform – specifically, the low-latency inference segment of the market. Groq 3 LPX is already setting records, / demonstrating nearly 4x the number of tokens per second against the next best alternative on Artificial Analysis’ Gemma 4 31B benchmark. / Throughput (TPS/MW) / Vera Rubin NVL72 / Blackwell / NVL72 / Hopper / NVL8 / LPX / Lowest Latency / Inference / User Interactivity (TPS / User) / Output Speed: Gemma 4 31B (Reasoning) / Output speed: o200k_base tokens per second · 100,000 input tokens / 3,431 / 4X Faster / 870 / 188 / 151 / 101 / 48 / 35 / 34 / 31 / 29 / NVIDIA Groq 3 LPX / Private, Pre-Release / Endpoint / Live Serverless Data / Public API Endpoints / Source: Artificial Analysis / NVIDIA logo
Visuals: Two charts. (1) Left: a line-style throughput diagram titled 'Throughput (TPS/MW)' with x-axis 'User Interactivity (TPS / User)' and y-axis unlabelled, drawn as arrowed grey axes meeting at the bottom-left corner. Three curves: a green curve labelled 'Vera Rubin NVL72' starts high at the left axis, stays flat, then falls steeply to the baseline near x 23.5%; a white curve labelled 'Blackwell NVL72' starts at mid-height and falls to the baseline near x 13.4%; a short grey curve labelled 'Hopper NVL8' sits at the origin. A flat green segment labelled 'LPX' / 'Lowest Latency Inference' begins at the foot of the Vera Rubin drop and runs right and slightly down to the x-axis end. Two dashed green arrows: one diagonal from the Blackwell curve up toward the Vera Rubin curve, one horizontal from the LPX start pointing right. No values are printed on the axes. (2) Right: vertical bar chart titled 'Output Speed: Gemma 4 31B (Reasoning)' with subtitle 'Output speed: o200k_base tokens per second · 100,000 input tokens'. Y-axis is unlabelled with no printed scale; x-axis has no tick labels. Ten bars with printed values: NVIDIA Groq 3 LPX 3,431 (green, the highlighted bar, the tallest); 870; 188; 151; 101; 48; 35; 34; 31; 29 (grey). Values for the grey bars after 870 are printed; the bar heights for those are about proportional to value on a linear scale with 3,431 as full height. A green horizontal reference line runs from the top of the 3,431 bar to the right at the level of its top. A grey dashed double-headed vertical arrow runs from that reference line down to the top of the 870 bar, labelled '4X Faster' in green. Bar group labels: 'NVIDIA Groq 3 LPX' under the green bar, 'Private, Pre-Release / Endpoint' bold under it; 'Live Serverless Data / Public API Endpoints' under the grey bars. No legend.
Slide 17
NVIDIA is the Largest and
Fastest Growing AI Networking
Company in the World
NVIDIA is the only company that offers five networking technologies:
1. Scale-Up (NVLink)
2. Scale-Out (InfiniBand, Spectrum-X Ethernet)
3. Scale-Across (Spectrum-XGS Ethernet)
4. Scale-In (BlueField-4 DPU and DOCA over Spectrum-X Ethernet)
5. Context Scale (Vera BlueField-4 Storage Processor)
Since the acquisition of Mellanox in 2020, NVIDIA's Networking revenue
has grown at a CAGR of 70%, materially outperforming industry peers.
Today, NVIDIA is the largest and fastest growing AI Networking company
in the world.
Scale-Up
NVLink
Scale-Out
Spectrum-X Ethernet
Scale-Across
Spectrum-XGS Ethernet
Scale-In
BlueField-4 DPU
Context Scale
Vera BlueField-4 Storage Processor
Networking Revenue (Indexed CY2020 = 100)
NVIDIA
Total Market
CAGR (CY2020-2025)
NVIDIA – 70%
Market – 28%
1,600
1,400
1,200
1,000
800
600
400
200
0
1435
594
392
169
100
110
139
180
218
347
100
109
2020
2021
2022
2023
2024
2025
Visuals: Five product photographs in a row, each in a thin-bordered rounded rectangle, with a green label above and a small white caption below. (1) Scale-Up, labelled NVLink: a dark grey vertical NVLink switch/compute board with a heatsink and connectors, shown upright, centred on black, small framing with black surround. (2) Scale-Out, labelled Spectrum-X Ethernet: a dark metal networking switch chassis in a three-quarter angled view with a visible fan grille and a round top vent, lit with warm light, filling the tile and cropped at the edges. (3) Scale-Across, labelled Spectrum-XGS Ethernet: a diagram-style illustration on black of four small grey switch boxes arranged around a central box, connected by thin white lines, with small labels reading Scale-Up, Scale-Across and Scale-Out in tiny text. (4) Scale-In, labelled BlueField-4 DPU: a dark green-black circuit board with a central square chip, heatsinks and connectors, shown flat, black background. (5) Context Scale, labelled Vera BlueField-4 Storage Processor: a dark grey rack server chassis viewed from the front-top angle with an open lid, showing a green-lit board inside and rows of drive bays. Below the tiles, one bordered chart: a line chart titled Networking Revenue (Indexed CY2020 = 100). Legend above plot, centred: green line NVIDIA, grey line Total Market. Y axis: 0 to 1,600 in steps of 200, unitless index, no gridlines, tick labels at left. X axis: 2020, 2021, 2022, 2023, 2024, 2025 along a thin grey baseline at 0. Series NVIDIA (green #76B900, thick line, labelled values): 2020 100, 2021 110, 2022 169, 2023 392, 2024 594, 2025 1435. Series Total Market (grey #A1A1A1, labelled values): 2020 100, 2021 109, 2022 139, 2023 180, 2024 218, 2025 347. Labels are printed at each point; the 2025 NVIDIA point is highlighted in green with its label at the top. Inside the plot, at left-centre, a text callout reads CAGR (CY2020-2025) with NVIDIA – 70% and Market – 28% in white. Chart has no visible axis titles. Also the NVIDIA logo: green eye-shaped mark with the wordmark NVIDIA in white, bottom right.
Slide 18
NVLink Fusion Expands NVIDIA Opportunities
NVIDIA NVLink Fusion offers customers the option to build semi-custom AI factories by integrating their custom XPUs or CPUs with NVIDIA’s proven rack architecture.
And to accelerate adoption, NVIDIA is partnering with various CPU, custom silicon, EDA and optical interconnect suppliers.
Customer reception has been strong with AWS, Intel, RIKEN, and others already committed to adopting NVLink scale-up technology.
NVLink Fusion opportunity to approach $250 billion by the end of the decade.
NVLink Connectors
XPU
XPU Package
NVIDIA NVLink 6
Switch
NVIDIA Vera or
Custom CPU
NVIDIA NVLink
Cable Cartridge
NVIDIA Grace
BlueField
NVIDIA ConnectX-9
Compute Tray x18
NVIDIA NVLink Switch Tray x9
NVIDIA NVLink Spine x1
NVIDIA MGX Rack
Cableless, Hoseless, Modular Design
3.6 TB/s per XPU All-to-All Bandwidth
Connects 72 XPUs in a Single Domain
Third-Generation Design
45C Inlet Temp
3X Lower Latency
100% Liquid Cooled
Built-In Factory Resiliency
Visuals: Five visuals on a black field. (1) XPU: a square dark-grey (#262626) chip package about 8.5% by 15.5% of the slide with tan (#C8B98A) contact pads along its top, bottom, left and right edges, and a blue (#0074DF, 90% opacity) die with a grid of lighter blue cells labelled XPU in white at its centre. (2) White arrow pointing right from the XPU to the Compute Tray. (3) Photograph of a Compute Tray x18: a black-background, backlit, line-drawn style top view of a server tray with four glowing XPU packages in a row at the top, two smaller glowing Vera or custom CPU modules below them, a single glowing Grace BlueField module lower centre and two small ConnectX-9 modules at the bottom; lit with amber and white highlights, full frame, boxed to about 10.9% by 34.1%, dominant colours black, gold and amber. Leader lines and labels: NVLink Connectors (white, from the top edge of the tray diagonally up-right to the label), XPU Package (horizontal line to the upper-row packages), NVIDIA Vera or Custom CPU (horizontal line to a CPU module), NVIDIA Grace BlueField (horizontal line to the Grace module), NVIDIA ConnectX-9 (horizontal line to the bottom modules). (4) Photograph of an NVIDIA NVLink Switch Tray x9: a black-background, backlit line-drawn view of a server tray with four glowing rectangular NVLink 6 switch chips arranged in a V shape at the upper centre, with cabling and board detail below, boxed to about 10.9% by 34.0%, dominant colours black, gold and amber. Leader lines: NVIDIA NVLink 6 Switch (horizontal white line to the right-hand switch chips) and NVLink Connectors (diagonal white line from the top connector area of this tray to the label above). (5) Photograph of an NVIDIA NVLink Spine x1: four tall black vertical cable-cartridge modules standing side by side, each with a column of small glowing gold/amber contact points down its inner edge, on a black background, boxed to about 11.3% by 28.7%; a white leader line from the NVIDIA NVLink Cable Cartridge label points to the left-hand module. (6) White arrow pointing right from the Spine to the MGX Rack. (7) Photograph of an NVIDIA MGX Rack: a tall black enclosure with a thin grey frame, a brushed-gold lit band of horizontal rails across its middle, dark top and base, shown front-on and centred, boxed to about 6.6% by 44.9%, dominant colours black and gold. (8) NVIDIA logo bottom right in green and white. Nothing is cropped, full-bleed or tinted except the photographs which sit on the black background.
Slide 19
NVIDIA CUDA Turns Programmability into Ecosystem Scale
NVIDIA CUDA defines NVIDIA’s strategy and powers the flywheel. Developers drive new applications. New applications create new ecosystems.
New ecosystems grow the installed base. And a larger installed base invites more developers.
NVIDIA compute accelerates every workload. AI and non-AI. All fields of science.
NVIDIA continuously updates its software, driving down the cost of computing, and improving the installed base’s productivity.
Built on CUDA, NVIDIA compute is versatile, fungible, durable, and therefore investable.
NEW
APPLICATIONS
ECOSYSTEMS
DEVELOPERS
INSTALLED
BASE
20 YEARS
CUDA
FLYWHEEL
Developers
3M
11M
2021
2026 Q2
AI
Startups
9K
50K
2021
2026 Q2
CUDA Downloads
32M
1.2B
2021
2026 Q2
GPU -Accelerated
Applications
2K
9K
2021
2026 Q2
NVIDIA
Visuals: Left: a circular flywheel diagram with four white hand-drawn curved arrows arranged clockwise in a ring around a green handwritten label. The ring's four nodes are NEW APPLICATIONS (top), DEVELOPERS (right), INSTALLED BASE (bottom) and ECOSYSTEMS (left); the arrows run ECOSYSTEMS to NEW APPLICATIONS (arrowhead at the top), NEW APPLICATIONS to DEVELOPERS (arrowhead at the upper right), DEVELOPERS to INSTALLED BASE (arrowhead at the lower right), and INSTALLED BASE to ECOSYSTEMS (arrowhead at the lower left). The centre reads 20 YEARS / CUDA / FLYWHEEL in #76B900 handwritten capitals. Right: four bubble charts, each with two solid #76B900 circles scaled by value. Developers: 3M (2021, small circle) and 11M (2026 Q2, large circle), circle sizes about proportional to value. AI Startups: 9K (2021) and 50K (2026 Q2). CUDA Downloads: 32M (2021, smallest circle) and 1.2B (2026 Q2, largest circle). GPU-Accelerated Applications: 2K (2021) and 9K (2026 Q2). Each chart has a thin grey baseline with the category label to its left. Values are printed above the circles in bold white; no axes or legend. Only the 2026 Q2 values are printed larger than the 2021 values in the same chart; the circle areas are not labelled as estimates.
Slide 20
NVIDIA CUDA-X Accelerates
Apps and Reduces the Cost of Computing
CUDA-X libraries accelerate apps, enabling them to run orders of magnitude faster, more efficiently, and at lower cost than on CPUs. Over time the introduction of new
libraries expands our platform's addressable set of applications and use cases, unlocking new markets and increasing our long-term growth opportunity.
With ~9,000 apps, AI models, and libraries running on CUDA, NVIDIA addresses the largest market opportunity of any computing platform.
cuLitho
Computational Lithography
cuDSS
cuSPARSE
cuFFT
AmgX
Computer Aided Engineering
cuOpt
Decision Optimization
Warp
Physics
cuDF
cuML
Data Science and Processing
Megatron
Dynamo
NIXL
cuDNN
CUTLASS
Deep Learning
cuEquivariance
cuTensor
Quantum Chemistry
cuQuantum
CUDA-Q
Quantum Computing
Earth-2
Weather Analytics
MONAI
Medical Imaging
Parabricks
Genomics
Aerial
Sionna
5G/6G
Signal Processing
cuPyNumeric
Numerical Computing
Visuals: Thirteen rectangular photographic or rendered cards in one row, left to right: (1) cuLitho: tall dark grey block structure with blue and gold circuit-like patterning, lit by bright blue and gold light, on a blue-black ground. (2) cuDSS: a black pipe seen in cross-section with a rainbow-coloured CFD flow stream on a blue sky background. (3) cuOpt: a purple 3D surface plot with a white line chart drawn across it, on a dark dotted grid. (4) Warp: a grey box with a white wall and coloured streamlines in red, green and blue on a dark grey floor with a grey sphere. (5) cuDF and cuML: black background with a grid and scattered coloured particle clouds in yellow, orange, cyan, pink and purple. (6) Megatron Dynamo NIXL cuDNN CUTLASS: dark teal background with a white-outlined network diagram of stacked blocks linked by lines. (7) cuEquivariance cuTensor: a ball-and-stick molecule model on black with red, blue, cyan, white and yellow atoms. (8) cuQuantum CUDA-Q: a gold dilution refrigerator cryostat with copper plates, on a dark background. (9) Earth-2: a view of Earth from space showing blue ocean, brown and green land and white clouds. (10) MONAI: colourful 3D segmented organ shapes in green, red, blue and yellow on a grey background. (11) Parabricks: a lavender double helix of DNA on a dark purple-black background. (12) Aerial Sionna: an aerial view of rooftops and streets with bright green ray paths on a grey-white city. (13) cuPyNumeric: a spiral galaxy with a purple and pink core on a deep blue starfield. Each card is a rounded-corner rectangle with a thin pale gold edge and a soft drop shadow. Below the cards is a faint, dark mirrored reflection of the row fading to black.
Slide 21
NVIDIA AI Factories Are Productive, Durable, and Fungible / Productive / Profitable Tokens / Payback well inside / depreciation window / $100M / $75M / $30M / $10M / Cost / Open Models / Frontier Labs / ISP Tokens / Revenue $M/MW/year / Cost: $60M/MW build · 6-yr depreciation / Durable / CUDA-Driven Installed-Base Enhancement / Earns after full depreciation and / improves over time through software / V100 / DGX-1 / 10 yrs in service / A100 / 6 yrs old · 9 yrs sold / NVL72 / 1 yr old · 7 yrs sold / Fungible / One CUDA Architecture – Global Ecosystem / One platform, / many offtakers, any workload / AI Labs / Every Closed / and Open Model / Financial Services / Jane Street, / HRT, JPM, GS / Industrial / LG, Cadence / Pharma / Roche, Lilly / Automotive / Hyundai, BMW
Visuals: Three panels. Left panel: vertical bar chart with title 'Payback well inside depreciation window' and a y-axis that is not drawn. Bars from left to right: Cost $10M (grey #757575), Open Models $30M (dark green about #3E6600), Frontier Labs $75M (green #5E9000, #76B900 at 80 percent opacity), ISP Tokens $100M (lime #B8FF3C). Values are printed above each bar. Bars sit on a thin grey baseline at about 76.5% of slide height; axis labels are printed under each bar. Footnote under the chart gives the units and assumptions. The chart has no legend and no gridlines. ISP Tokens is the highlighted bar. Middle panel: three horizontal stacked bars on a shared 0 to full-width scale with no axis. V100 / DGX-1: one full-width bar in #76B900 labelled 10 yrs in service. A100: green segment from about 38.1% to 52.4% of slide width, dark green #3E6600 segment to about 59.5%, grey #757575 segment to about 62.0%, labelled 6 yrs old · 9 yrs sold. NVL72: green segment 38.1% to about 40.5%, dark green to about 54.8%, grey to about 62.0%, labelled 1 yr old · 7 yrs sold. Each bar has a dark track #2A2E31 behind it. Right panel: six line icons in lime green #76B900 with bold white labels. AI Labs icon shows three people figures above a stacked group. Financial Services icon shows a rising line chart over three bars with a dollar coin. Industrial icon shows a factory with chimneys. Pharma icon shows a medicine bottle with a cross and a capsule. Automotive icon shows a side-view car, with a thin green leader line crossing it from the Financial Services label area. All icons are outline style with about 0.2% stroke weight.
Slide 22
NVIDIA AI Infrastructure Retains Value
Beyond Accelerated Depreciation Schedules
8-GPU HGX System Cost Per GPU · Dotted Curve = Accelerated Schedule, 25% Residual at Year 2, Zero by Year 5
Residual Value, % of Purchase Price
B200 158%
150%
100%
Accelerated Depreciation
H100 58%
50%
25% at Year 2
A100 25%
0%
0
1
2
3
4
5
6
7
8
Years Since Mass Availability
Residual value: Silicon Data, monthly averages. Purchase price basis: A100 $20,000 · H100 $35,000 · B200 $45,000.
Mass-availability dates assumed; purchase prices are third-party estimates, not Silicon Data data.
Visuals: One line chart titled 'Residual Value, % of Purchase Price', with the x axis 'Years Since Mass Availability' running 0 to 8 (ticks every 1 year, unit years) and the y axis 'Residual Value, % of Purchase Price' running 0% to about 160% (labelled ticks 0%, 50%, 100%, 150%, no unit beyond %). Series: (1) Dotted white curve 'Accelerated Depreciation' from about (0 yr, 100%) falling convexly to (2 yr, 25%, labelled '25% at Year 2' with a small white dot marker) and reaching (5 yr, 0%); it is a decay curve, values at other points about: 1 yr about 50%, 3 yr about 12%, 4 yr about 6%. (2) Orange solid wavy line 'B200 158%' from about 0.8 yr at about 138% rising to a peak about 1.4 yr near 162%, ending at about 1.5 yr at 158%, labelled at its end. (3) Blue solid wavy line 'H100 58%' from about 2.5 yr at about 55% dipping to about 43% at 3.2 yr, rising to a peak about 62% at 3.7 yr and ending at 4.0 yr at 58%, labelled at its end. (4) Green solid wavy line 'A100 25%' from about 4.8 yr at about 41% declining in steps to about 27% near 6 yr and ending at about 6.3 yr at 25%, labelled at its end. No legend; series are identified by end labels. Highlighted point: the white dot at 2 yr, 25% on the dotted curve. Faint horizontal gridlines at 50%, 100% and 150%, with a slightly brighter baseline at 0%.
Slides 23 to 29 continue in the full text file.
Download this deck
The hosted PDF of every library deck is free for readers of the SlideDeck Co newsletter. Join with your email and the viewer and download appear here.
Preparing a results presentation or business update of your own? The SlideDeck Co Standard Deck is a slide library for business reviews, updates and plans.







