
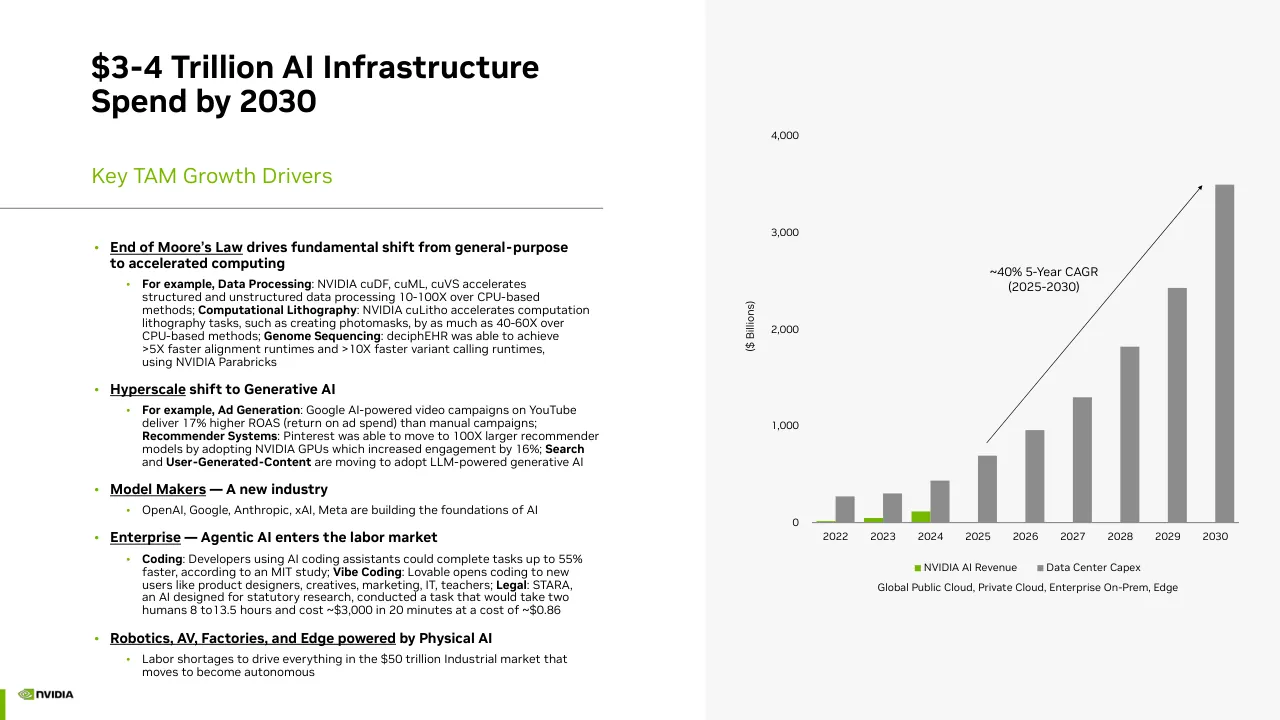
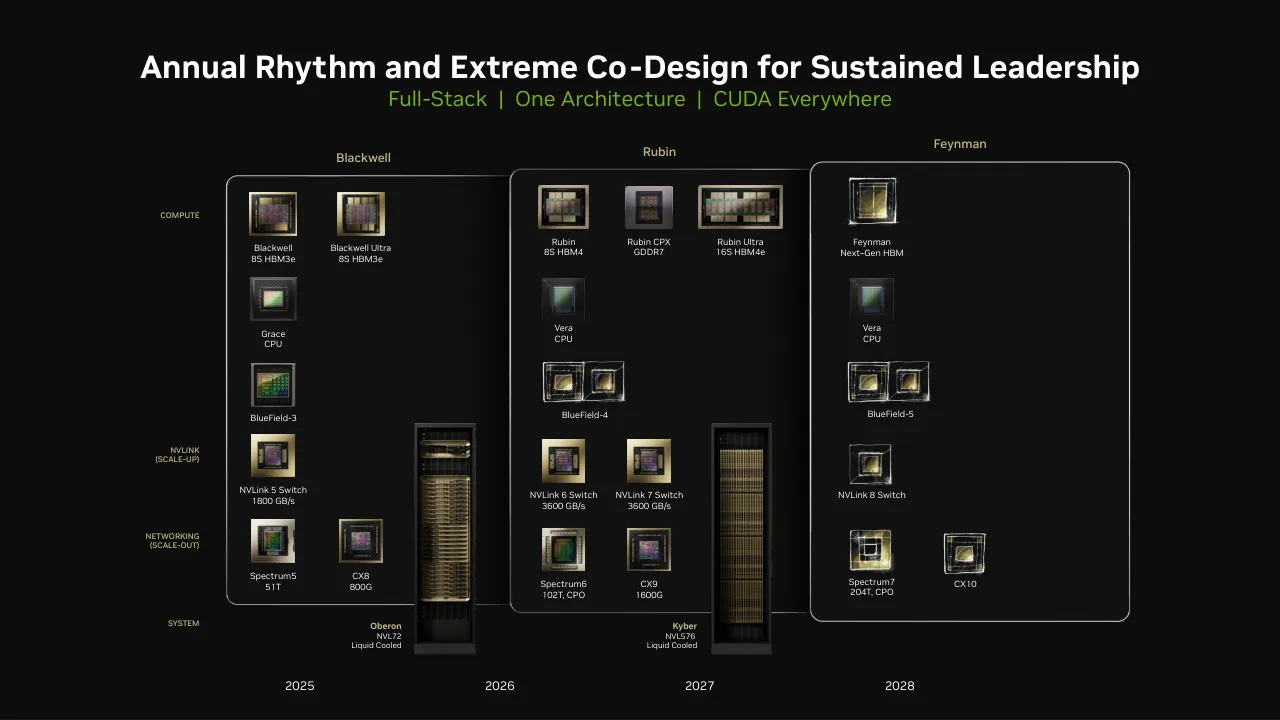
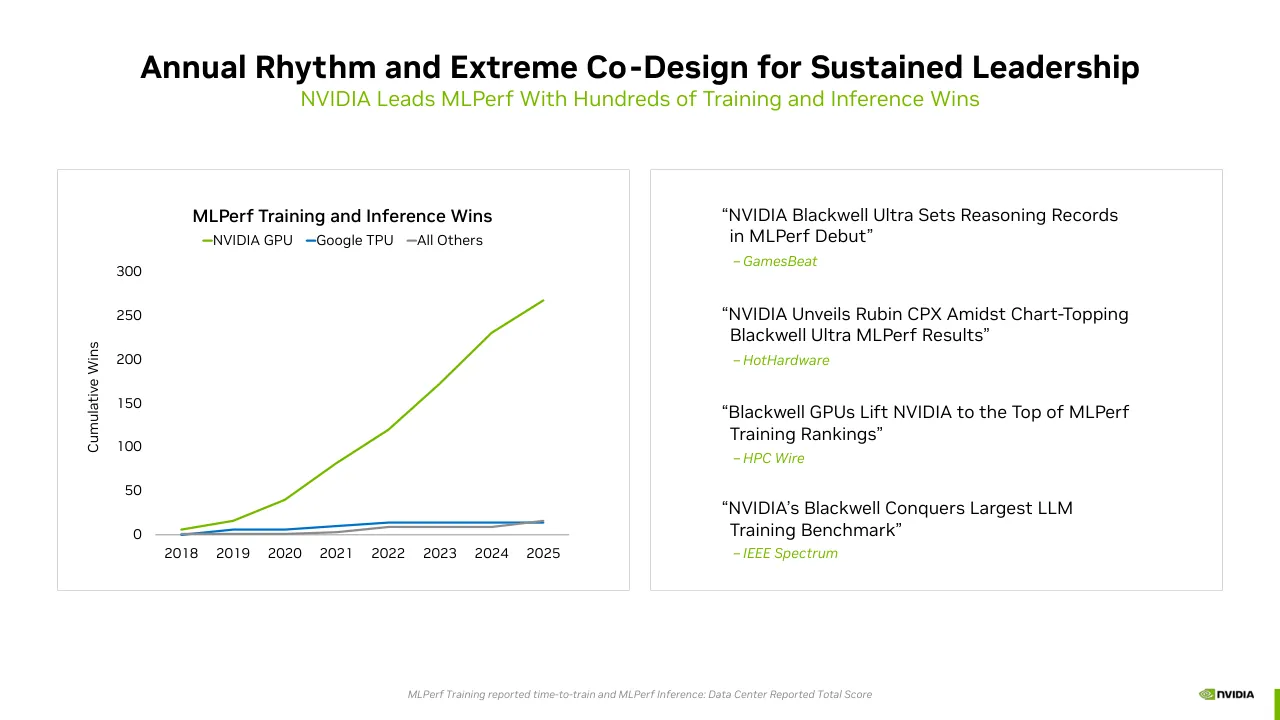
The deck opens with a title slide and a long forward-looking statements disclaimer, then sets out NVIDIA's shift from chips to an AI infrastructure company. The middle sections cover the market case, citing $3-4 trillion of AI infrastructure spend by 2030 and growth drivers across cloud, enterprise and physical AI, then show the CUDA-X platform stack and token-usage growth. Further sections cover physical AI computing (training, simulation and deployment across robotics, autonomous vehicles and factories), an annual product roadmap from Blackwell through Rubin to Feynman, MLPerf benchmark wins, and a partnership with OpenAI for at least 10 gigawatts of infrastructure. The deck closes on that OpenAI partnership slide, which sets out the investment terms and spend per gigawatt. Slides 4, 10 and 12 are worth studying for how they use dense but structured data, a roadmap grid and benchmark charts to carry the argument.
Slides worth studying
Questions about this deck
How many slides does the NVIDIA non-deal roadshow deck from October 2025 have?
The deck has 15 slides in total. Slide 1 is the title slide and slide 15 is the closing NVIDIA slide.
What does the NVIDIA deck say about the AI infrastructure market size?
Slide 4 is titled '$3-4 Trillion AI Infrastructure Spend by 2030' and includes a chart of NVIDIA AI Revenue and Data Center Capex from 2022 to 2030. The chart also shows a '~40% 5-Year CAGR (2025-2030)' label.
What investment terms does the NVIDIA deck give for the OpenAI partnership?
Slide 14 says NVIDIA intends to invest in increments over time up to $100 billion in equity, and that every 1GW build-out will require $50-60 billion in total spend. The same slide says the partnership will build at least 10 gigawatts of infrastructure, with the first gigawatt launching in 2026 on the Vera Rubin platform.
What product roadmap does the NVIDIA deck show?
Slide 10, titled 'Annual Rhythm and Extreme Co-Design for Sustained Leadership', shows an annual product roadmap running from Blackwell through Rubin to Feynman. The slide is a grid of chip, networking and system products across the years 2025 to 2028.
Details
- Company: NVIDIA
- Year: 2025
- Type: Investor presentation
- Industry: Semiconductors
- Pages: 15
More from NVIDIA
- NVIDIA investor presentation, September 2026 NDR
- NVIDIA investor presentation, Annual Stockholder Meeting June 2026
- NVIDIA investor presentation, Q2 FY27 quarterly presentation
- NVIDIA keynote, GTC Europe 2026
- NVIDIA presentation, 2026
- NVIDIA keynote, GTC 2026 Keynote
All NVIDIA decks in the library
Review score: 7 out of 10, Effective
Presentation quality, judged with the SlideDeck Co review heuristic. Ask, evidence and idea merit are not rated here.
The deck has a clear route from NVIDIA's shift to an AI infrastructure company, through the market case, platform, physical AI and annual roadmap, to the OpenAI partnership, and it is built with consistent branding, green accents and a generally legible template. Slides 10 and 12 are strong: the roadmap grid on slide 10 organizes a lot of product detail by year and layer, and the MLPerf chart on slide 12 makes one comparison immediately readable. The weaknesses are consequential. Slide 4 packs small bullet text beside a chart whose point is partly lost, and slides 5 to 9 reuse the title '$3-4 Trillion AI Infrastructure Spend by 2030' on content that is not about spend, so titles stop carrying the message. Slides 13 and 14 have tiny text or chart labels and uneven spacing, slide 3's timeline labels are very small, and the deck ends on a logo slide rather than a takeaway.
Worth keeping: Keep the slide 10 roadmap grid, the slide 12 chart with its single clear contrast, the consistent NVIDIA green and black palette, and the strong imagery on slides 5 and 7 to 9.
Most useful repair: Rewrite titles on slides 5 to 9 and 11 to 13 so each states that page's actual claim, and cut and enlarge the slide 4 bullets and the slide 13 and 14 text to a readable size.
What would change the score: I would split the slide 4 bullets from the chart, label the chart's key values, and end the deck on a summary slide instead of the logo page.
Confidence medium. 15 of 15 pages inspected on contact sheets, 4 at readable size. Reviewed 2026-11-08. Model-assisted review (claude-sonnet-5-5).
Full text of the slides (15 slides)
Every slide's words and a description of its charts and images, so the deck can be searched and rebuilt. Also available as Markdown.
Slide 1
NVIDIA Non-Deal Roadshow
October 2025
Visuals: Logo: NVIDIA logo at top-left, a green eye-shaped emblem (#76B900 green) in a square followed by the black wordmark 'NVIDIA' in bold uppercase sans-serif. Background illustration: abstract 3D rendering of stacked, curved green ribbon-like layers sweeping from the lower-right toward the upper-left, with glossy bright green (#8BC812 to #A6E03A) surfaces and dark green (#0F3D08) recesses in the lower-right curved openings. Lighting is soft and directional from the upper-left, creating highlights along the ribbon edges; the upper-left area fades to white. The illustration is full-bleed, covering the entire slide with no border. A small bottom-right image (about 4.8% wide, 3.4% high) is an unidentified small graphic on the right edge; its content is not legible at this size.
Slide 2
Certain statements in this presentation including, but not limited to, statements as to: expectations with respect to growth, performance and benefits of / NVIDIA’s products, services and technologies, and related trends and drivers; expectations with respect to supply and demand for NVIDIA’s products, services / and technologies, and related matters; expectations with respect to NVIDIA’s third party arrangements, including with its collaborators and partners such as / OpenAI, Intel and CoreWeave; expectations with respect to NVIDIA’s investments; expectations with respect to energy efficiency; expectations with respect to / NVIDIA’s strategies; expectations with respect to technology developments, and related trends and drivers; projected market growth and trends; expectations / with respect to AI and related industries; and other statements that are not historical facts are forward-looking statements within the meaning of Section 27A / of the Securities Act of 1933, as amended, and Section 21E of the Securities Exchange Act of 1934, as amended, which are subject to the “safe harbor” created / by those sections based on management’s beliefs and assumptions and on information currently available to management and are subject to risks and / uncertainties that could cause results to be materially different than expectations. / Important factors that could cause actual results to differ materially include: global economic and political conditions; NVIDIA’s reliance on third parties to / manufacture, assemble, package and test NVIDIA’s products; the impact of technological development and competition; development of new products and / technologies or enhancements to NVIDIA’s existing product and technologies; market acceptance of NVIDIA’s products or NVIDIA’s partners’ products; design, / manufacturing or software defects; changes in consumer preferences or demands; changes in industry standards and interfaces; unexpected loss of / performance of NVIDIA’s products or technologies when integrated into systems; and changes in applicable laws and regulations, as well as other factors / detailed from time to time in the most recent reports NVIDIA files with the Securities and Exchange Commission, or SEC, including, but not limited to, its annual / report on Form 10-K and quarterly reports on Form 10-Q. Copies of reports filed with the SEC are posted on the company’s website and are available from / NVIDIA without charge. These forward-looking statements are not guarantees of future performance and speak only as of the date hereof, and, except as / required by law, NVIDIA disclaims any obligation to update these forward-looking statements to reflect future events or circumstances. / Many of the products and features described herein remain in various stages and will be offered on a when-and-if-available basis. The statements within are not / intended to be, and should not be interpreted as a commitment, promise, or legal obligation, and the development, release, and timing of any features or / functionalities described for our products is subject to change and remains at the sole discretion of NVIDIA. NVIDIA will have no liability for failure to deliver or / delay in the delivery of any of the products, features or functions set forth herein.
Visuals: A full-bleed abstract illustration covers the whole slide behind the text: curved, sweeping light streaks in pale to bright lime green, with thin glowing white highlight lines running diagonally from lower left to upper right. The top band of the slide is white and the green gradient rises in from the lower left and right edges, so the streaks are densest in the lower half and pale near the text in the upper left. It is not cropped beyond the slide edges and has no overlay other than the white fade at the top. One small logo image, probably the NVIDIA wordmark, sits in the bottom-right corner over the green gradient; it is low contrast and barely legible in the render.
Slide 3
NVIDIA’s Evolution From Chips to an AI Infrastructure Company
ACCELERATOR
1999
GPU
ACCELERATED COMPUTING
2006
CUDA
AI
2012
cuDNN
AI
SUPERCOMPUTER
2016
DGX-1
NVL8
AI
DATACENTER
2019
MELLANOX
2020
SELENE
2024
NVL72 SCALE-UP
3-SCALING LAWS
AI INFRASTRUCTURE
SPECTRUM-X
SCALE-OUT AND
SCALE-ACROSS
Visuals: Line-art hand-drawn illustrations in white outlines with olive-gold shading, arranged as a rising sequence. (1) GPU: a small rectangular graphics card with a grid of chip shapes and gold-olive fill, at about x 6.2%, y 84.9%, 4.3 by 4.6%. (2) DGX-1: a low wide server box with a dark front panel and gold-olive fill, at about x 33.7%, y 85.8%, 6.9 by 4.9%. (3) Selene / DGX SuperPOD: a long horizontal rack of many stacked compute trays, sketched in white outline with olive-gold fill, at about x 46.2%, y 74.2%, 13.5 by 7.1%. (4) NVL72 rack: a tall narrow cabinet with a white outline and olive-gold fill, at about x 66.6%, y 61.3%, 4.3 by 20.1%. (5) Spectrum-X: a cluster of four flat switch units, three with olive-gold shading and one central diagonal unit with a bright gold highlight, each with rows of port ticks on their front edges, at about x 69.5%, y 33.8%, 27.2 by 12.2%, the top-right unit running off to a soft gold glow near the right edge. Connectors: short white strokes between the steps, and two longer diagonal white cables, one from the NVL72 rack up to the Spectrum-X cluster (about x 72.5%, y 49.3%, 9.5 by 16.3%) and one from the datacenter block to the NVL72 rack (about x 61.3%, y 69.8%, 4.8 by 2.9%). Stroke weight is thin and irregular, like a pen sketch.
Slide 4
$3-4 Trillion AI Infrastructure
Spend by 2030
Key TAM Growth Drivers
4,000
3,000
2,000
1,000
0
($ Billions)
•
End of Moore’s Law drives fundamental shift from general-purpose
to accelerated computing
•
For example, Data Processing: NVIDIA cuDF, cuML, cuVS accelerates
structured and unstructured data processing 10-100X over CPU-based
methods; Computational Lithography: NVIDIA cuLitho accelerates computation
lithography tasks, such as creating photomasks, by as much as 40-60X over
CPU-based methods; Genome Sequencing: deciphEHR was able to achieve
>5X faster alignment runtimes and >10X faster variant calling runtimes,
using NVIDIA Parabricks
•
Hyperscale shift to Generative AI
•
For example, Ad Generation: Google AI-powered video campaigns on YouTube
deliver 17% higher ROAS (return on ad spend) than manual campaigns;
Recommender Systems: Pinterest was able to move to 100X larger recommender
models by adopting NVIDIA GPUs which increased engagement by 16%; Search
and User-Generated-Content are moving to adopt LLM-powered generative AI
•
Model Makers — A new industry
•
OpenAI, Google, Anthropic, xAI, Meta are building the foundations of AI
•
Enterprise — Agentic AI enters the labor market
•
Coding: Developers using AI coding assistants could complete tasks up to 55%
faster, according to an MIT study; Vibe Coding: Lovable opens coding to new
users like product designers, creatives, marketing, IT, teachers; Legal: STARA,
an AI designed for statutory research, conducted a task that would take two
humans 8 to13.5 hours and cost ~$3,000 in 20 minutes at a cost of ~$0.86
•
Robotics, AV, Factories, and Edge powered by Physical AI
•
Labor shortages to drive everything in the $50 trillion Industrial market that
moves to become autonomous
2022
2023
2024
2025
2026
2027
2028
2029
2030
~40% 5-Year CAGR
(2025-2030)
NVIDIA AI Revenue
Data Center Capex
Global Public Cloud, Private Cloud, Enterprise On-Prem, Edge
Visuals: Chart: clustered column chart, vertical bars, two series. X-axis: years 2022 to 2030 (categories, no units). Y-axis: titled '($ Billions)', range 0 to 4,000, labelled ticks 0, 1,000, 2,000, 3,000, 4,000; horizontal baseline at about y 72.5%. Series 'NVIDIA AI Revenue' in green #76B900, bars only for 2022 to 2024. Series 'Data Center Capex' in grey #8C8C8C for all nine years. No values are printed; estimates: NVIDIA AI Revenue about 10 (2022), about 45 (2023), about 115 (2024). Data Center Capex about 270 (2022), about 300 (2023), about 430 (2024), about 690 (2025), about 955 (2026), about 1,300 (2027), about 1,820 (2028), about 2,430 (2029), about 3,500 (2030). Legend centred under the plot in one row: green square 'NVIDIA AI Revenue', grey square 'Data Center Capex'. Caption under legend: 'Global Public Cloud, Private Cloud, Enterprise On-Prem, Edge'. Annotation: thin black diagonal arrow with a small arrowhead at its upper-right end, starting just above the 2025 capex bar and ending near the 2030 bar top, labelled '~40% 5-Year CAGR (2025-2030)' above the arrow. No highlighted points. Logo: NVIDIA eye-mark and wordmark in green #76B900 and black at bottom-left.
Slide 5
$3-4 Trillion AI Infrastructure Spend by 2030 / NVIDIA CUDA-X Platforms Enable Shift From CPU to GPU Accelerated Computing / cuLitho / Computational / Lithography / cuDSS / cuSPARSE / cuFFT / AmgX / Computer Aided / Engineering / cuOpt / Decision / Optimization / Warp / Physics / cuDF / cuML / Data Science / and Processing / Megatron / Dynamo / NIXL / cuDNN / CUTLASS / Deep / Learning / cuEquivariance / cuTensor / Quantum / Chemistry / cuQuantum / CUDA-Q / Quantum / Computing / Earth-2 / Weather / Analytics / MONAI / Medical / Imaging / Parabricks / Genomics / Aerial / Sionna / 5G/6G / Signal Processing / cuPyNumeric / Numerical / Computing
Visuals: Image strip of 15 overlapping rounded-rectangle tiles, each with a thin dark grey border and a soft drop shadow, arranged left to right and angled slightly so each tile sits a little higher or lower than its neighbour. Tile 1 (cuLitho, leftmost, largest): dark tall panel with glowing cyan-lit rows of lithography chip patterns and a bright cyan base strip. Tile 2 (cuDSS/cuSPARSE/cuFFT/AmgX): grey-silver car body in a studio setting with a yellow-orange particle or CFD flow near the wheel. Tile 3 (cuOpt): deep blue background with a network of white connected nodes and a glowing green-yellow centre point. Tile 4 (Warp): swirling multicolour fluid in magenta, green, cyan and blue on black. Tile 5 (cuDF/cuML): black field with scattered clusters of purple and teal data points. Tile 6 (Megatron/Dynamo/NIXL/cuDNN/CUTLASS): blue background with a grey schematic diagram of stacked boxes and connecting lines. Tile 7 (cuEquivariance/cuTensor): ball-and-stick molecule with cyan, blue, red and white atoms on black. Tile 8 (cuQuantum/CUDA-Q): gold-coloured cylindrical quantum cryostat with stacked tiers, on dark background. Tile 9 (Earth-2): Earth seen from orbit with white clouds over blue ocean and continents in red-brown. Tile 10 (MONAI): dark background with colourful 3D segmented organ masks in green, orange, purple and white. Tile 11 (Parabricks): blue molecular surface of a protein with an orange and white DNA strand. Tile 12 (Aerial/Sionna): grey aerial city-block view with bright green radio ray lines crossing it. Tile 13 (cuPyNumeric): colourful nebula in red, magenta, blue and gold on dark space. Image is a single composite, not cropped in a box, placed full width across the lower-middle of the slide. Lighting is mostly self-lit glow on each tile. Logo: NVIDIA logo in green and black at bottom right. Decorative bar: thin solid green vertical strip at the far right edge near the bottom.
Slide 6
$3-4 Trillion AI Infrastructure Spend by 2030
3 AI Scaling Laws Driving Exponential Computing Demand
NVIDIA Excels at Pre-Training, Post-Training, and Inference
Test-Time Scaling
“Long Thinking”
Post-Training Scaling
Pre-Training Scaling
Perception AI
Generative AI
Agentic AI
Physical AI
Token Generation is Doubling Every Two Months
•
ChatGPT is at ~700M WAUs, with usage up ~4X y/y
•
OpenAI now counts 5M paying business users,
up from 3M in June
•
Microsoft processed over 500 trillion tokens served by
Foundry APIs in FY2025, up 7X y/y
•
Alphabet processed over 980 trillion tokens in the month
of June across its AI services, up from a monthly run-rate
of 480 trillion tokens in May
•
The Gemini app had more than 450M MAUs as of the end
of July with daily requests up >50% in Q2 vs. Q1
Visuals: Line-sketch diagram (not a data chart with axes values). Black L-shaped axis: vertical line at x about 6.9% from y 32.4% down to y 74.2%, horizontal line at y 74.2% from x 6.9% to about 45.6%, with a small corner at the origin. Along the horizontal axis, four stage labels (Perception AI, Generative AI, Agentic AI, Physical AI) are joined by black arrows with solid triangular heads pointing right (Perception AI to Generative AI, Generative AI to Agentic AI, Agentic AI to Physical AI; the last segment ends without a head). Three green (#76B900) hand-drawn curved lines of rising slope, about 3 pt stroke, sketch the scaling trend: the lowest curve starts near (12.6%, 71.4%) at the lower left and rises to a point near (27.0%, 61.6%), where a second curve branches up to near (42.0%, 52.9%); a shorter line branches from about (34.9%, 50.6%) toward (29.7%, 46.1%)... and a separate branch continues up to about (34.7%, 32.4%) at the top right. A green filled arrowhead sits at about (21.6%, 58.2%) on the first segment pointing up-right. Each curve is labelled in green text: Pre-Training Scaling (lower left, under the first curve), Post-Training Scaling (mid, beside the middle branch), Test-Time Scaling / “Long Thinking” (upper, above the top branch). No values are printed on the axes and no legend exists.
Slide 7
$3-4 Trillion AI Infrastructure Spend by 2030 / NVIDIA 3-Computers Enable Physical AI – the Next Wave of AI / Manipulating Robot / Training / Robot AI / Practicing in / Digital Twin / Jetson AGX Thor / GB200 / RTX PRO Server
Visuals: Four photographs, three icons and two server photographs, plus green connector lines. (1) Circular photo at top centre, about 8.9% of width: a grey-and-black humanoid robot on a pure black background, cropped to a circle with a thin green rim; a Jetson AGX Thor module (black printed circuit board with black heatsink and a small green-lit chip) overlaps its lower edge. (2) Left rounded photo, about 24.9 by 30.2 percent of the slide: a robotics lab seen from above, with a wooden table in the foreground holding a black robotic hand, a white spray bottle with red trigger and a grey robot arm at right; translucent pink and light-blue motion-trail arcs are overlaid on the arm, and the floor behind is grey with yellow-black hazard tape and metal truss towers. (3) Right rounded photo, same size: a digital-twin kitchen render with a mint-green wall, pale blue and lime cabinets, pink lower cabinets, a grey-white humanoid robot with a black head and blue ring, a beige bowl on a wooden countertop, and glassware on open shelves at right. (4) Green 3D hexagon icon with black neural-network node graph overlapping the bottom edge of the left photo. (5) Green 3D ring icon with black centre overlapping the bottom edge of the right photo. (6) GB200 server photo: dark chassis with gold-tinted modules, front-facing, full view. (7) RTX PRO Server photo: black rack chassis with rows of front drive bays, front-facing. Green lines: two elbow connectors from the robot circle down to the photo labels, each ending in a downward arrowhead; one elbow connector along the bottom joining the two server racks with upward arrowheads. No photos are cropped except to the rounded frames.
Slide 8
$3-4 Trillion AI Infrastructure Spend by 2030 / NVIDIA 3-Computers Enable Physical AI – the Next Wave of AI / Driving Car / Training / AV AI / Practicing in / Digital Twin / DRIVE AGX Thor / GB200 / RTX PRO Server
Visuals: Hub at top centre: a circular photo (about 8.9% of slide width) of a translucent wireframe car with cyan glow on a dark background, with a dark-blue/black DRIVE AGX Thor circuit board (about 8.9% wide) overlapping its lower edge. Left: a full-colour rendered photo of a white autonomous car on a bridge road with magenta and cyan motion light trails, warm brick tower at left, grey overcast sky; boxed with rounded green border. Left icon: green hexagon with a black neural-network node graphic (GB200 icon) overlapping the bottom edge of the left photo, and below it a dark rack server photo labelled GB200 (black and silver server unit with vertical modules). Right: a screenshot of a digital-twin construction scene (grey asphalt road with yellow double lines, orange excavator, white-and-red barriers, orange traffic cones, a grey sedan, dense trees) with a dark UI panel on the left showing a grid of vehicle and equipment thumbnails and a dark panel on the right with prompt text; boxed with rounded green border. Right icon: green ring with black centre (RTX PRO icon) overlapping the bottom edge of the right screenshot, and below it a dark rack server photo labelled RTX PRO Server. Connectors: a green line from the hub's left edge runs horizontally left then down with an arrowhead pointing down into the Training label area; a mirrored line from the hub's right edge runs right then down with an arrowhead pointing down toward Practicing in Digital Twin. A green line runs along the bottom from under GB200 to under RTX PRO Server with upward arrowheads at both ends. Bottom right: NVIDIA logo in green and black.
Slide 9
$3-4 Trillion AI Infrastructure Spend by 2030
NVIDIA 3-Computers Enable Physical AI – the Next Wave of AI
Running Factories
Training
Factory AI
Practicing in
Digital Twin
Jetson AGX Thor
GB200
RTX PRO Server
NVIDIA logo
Visuals: Four photographs and illustrations plus icons and connectors. (1) Hub: a circular photograph, about 178 px in diameter, of an aerial view of a factory floor with a large chip in the centre, with a thin green ring stroke. A rectangular photograph of a Jetson AGX Thor module (black PCB with a grey heatsink and a small green-and-black chip) overlaps the lower edge of the circle. (2) Left panel: a rounded rectangular photograph, about 25% of slide width, with a green border. It shows a 3D digital-twin render of a white factory floor with conveyor lines, workers and machines, on a black background at top right. A thin strip of four small camera-style frames runs along its bottom edge, and a tall column at its right edge shows a grey grid with coloured person-tracking dots and track lines labelled RTLS and people. A green hexagonal icon with a black node-network symbol overlaps the bottom edge of this panel. (3) Right panel: a rounded rectangular photograph with a green border showing a wide, bright, grey factory hall with a tiled ceiling and rows of lights, machines lining both sides, a worker in a blue cap at left, and a yellow-and-black floor stripe on the right; the lighting is soft and even, and the dominant colours are grey and white. A green ring icon with a black centre overlaps the bottom edge of this panel. (4) Servers: a black rack-server image of GB200 below the left panel, and a dark rack-server image of RTX PRO Server below the right panel, both showing rows of gold-and-black hardware modules. (5) Connectors: green lines with arrowheads as described in elements.
Slide 10
Annual Rhythm and Extreme Co-Design for Sustained Leadership / Full-Stack | One Architecture | CUDA Everywhere / Feynman / Rubin / Blackwell / COMPUTE / Rubin / Rubin CPX / Rubin Ultra / Feynman / Blackwell / Blackwell Ultra / 8S HBM4 / GDDR7 / 16S HBM4e / Next–Gen HBM / 8S HBM3e / 8S HBM3e / Vera / Vera / Grace / CPU / CPU / CPU / BlueField-4 / BlueField-5 / BlueField-3 / NVLink 5 Switch / 2025 / 2026 / 2027 / 2028 / NVLink 6 Switch / NVLink 7 Switch / NVLink 8 Switch / NVLINK / 1800 GB/s / 3600 GB/s / 3600 GB/s / (SCALE-UP) / Spectrum5 / CX8 / Spectrum6 / CX9 / Spectrum7 / CX10 / 51T / 800G / 204T, CPO / NETWORKING / 102T, CPO / 1600G / (SCALE-OUT) / Oberon / Kyber / SYSTEM / NVL72 / NVL576 / Liquid Cooled / Liquid Cooled
Visuals: Diagram-style product roadmap with no chart axes. Three rounded rectangular panels: Blackwell panel (left, x 16.9 to about 65 percent, y 21.8 to 79.2), Rubin panel (x 40.2 to about 63.5, y 22.5 to 81.0) and Feynman panel (x 63.5 to 88.4, y 21.2 to 81.8). Each panel holds small square chip and component images in rows: Blackwell column of Blackwell 8S HBM3e, Blackwell Ultra 8S HBM3e, Grace CPU, BlueField-3, NVLink 5 Switch 1800 GB/s, Spectrum5 51T and CX8 800G; Rubin columns of Rubin 8S HBM4, Rubin CPX GDDR7, Rubin Ultra 16S HBM4e, Vera CPU, BlueField-4, NVLink 6 Switch 3600 GB/s, NVLink 7 Switch 3600 GB/s, Spectrum6 102T CPO, CX9 1600G; Feynman column of Feynman Next-Gen HBM, Vera CPU, BlueField-5, NVLink 8 Switch, Spectrum7 204T CPO and CX10. The chips are gold-rimmed square modules on black with coloured die detail. Feynman items are hand-sketched white line drawings of squares with gold glow. Two dark tall rack illustrations: Oberon NVL72 Liquid Cooled (x 32.4 to 37.2, y 58.8 to 91.3), a gold-trimmed rack with stacked trays, and Kyber NVL576 Liquid Cooled (x 55.5 to 60.3, y 58.8 to 91.3), a dense narrow rack with vertical gold-lit bars. A thin grey-white horizontal line (about 0.6 percent high) sits at y 91.7 spanning x 12.0 to 62.6, linking the panels to the racks. A small image at x 93.1 y 94.8 is a faint logo-like mark in the bottom right.
Slide 11
Annual Rhythm and Extreme Co-Design for Sustained Leadership
Combining simultaneous breakthroughs in GPU, CPU, NIC, NVLink scale-up fabric, Spectrum-X Ethernet scale-out
and scale-across network, system architecture, and a mountain of software and algorithms,
we are delivering leaps in performance and cost efficiency never seen before.
NVIDIA extreme co-design has delivered 1,000,000X performance gain in past 10 years – versus
100X of traditional Moore’s law.
GB200 NVL72 SuperPOD
Grace Blackwell MGX Node
NVLink Switch
Quantum Switch
Spectrum-X Switch
Chips Purpose-Built for AI Supercomputing
GPU | CPU | DPU | NIC | NVLink Switch | IB Switch | ENET Switch
Chips to Systems to NVLink to networking to CUDA-X, DOCA, NCCL, TRT-LLM, NIXL, to Dynamo
Visuals: One photograph-style render (boxed, not cropped, not full-bleed) of an NVIDIA GB200 NVL72 SuperPOD. Composition is a wide, eye-level, centred view: at left, a Grace Blackwell MGX Node (a dark server tray with silver-grey chassis and gold-tinted modules) and an NVLink Switch (a tray with blue-black cable bundles); in the centre, a row of ten tall black rack cabinets, with green-yellow cable loops visible in the rack fronts and two central racks showing dark fan or cooling panels with gold-brown edges; at right, a Quantum Switch and a Spectrum-X Switch, both dark silver chassis. Along the bottom centre sit seven small square chip packages (gold, silver and dark green-gold tones) labelled as listed in the text. Lighting is soft studio lighting from above on a graded charcoal background that darkens toward the edges. Dominant colours: charcoal #1E1E1E to #3A3A3A, silver #A8A8A8, gold #C9A227, lime green #76B900 accents in cables. No overlay or tint; the image has square corners.
Slide 12
Annual Rhythm and Extreme Co-Design for Sustained Leadership
NVIDIA Leads MLPerf With Hundreds of Training and Inference Wins
MLPerf Training and Inference Wins
NVIDIA GPU
Google TPU
All Others
300
250
200
150
100
50
0
Cumulative Wins
2018
2019
2020
2021
2022
2023
2024
2025
“NVIDIA Blackwell Ultra Sets Reasoning Records in MLPerf Debut”
– GamesBeat
“NVIDIA Unveils Rubin CPX Amidst Chart-Topping Blackwell Ultra MLPerf Results”
– HotHardware
“Blackwell GPUs Lift NVIDIA to the Top of MLPerf Training Rankings”
– HPC Wire
“NVIDIA’s Blackwell Conquers Largest LLM Training Benchmark”
– IEEE Spectrum
MLPerf Training reported time-to-train and MLPerf Inference: Data Center Reported Total Score
NVIDIA
Visuals: Line chart titled 'MLPerf Training and Inference Wins', positioned inside the left panel. Y-axis titled 'Cumulative Wins', unitless count, linear scale from 0 to 300 with ticks every 50 (0, 50, 100, 150, 200, 250, 300); x-axis is categorical years 2018 to 2025 with one tick per year. Legend above the plot, horizontal, left to right: green line 'NVIDIA GPU', blue line 'Google TPU', grey line 'All Others'. Series values are not printed; estimates: NVIDIA GPU about 6 (2018), 15 (2019), 39 (2020), 82 (2021), 119 (2022), 174 (2023), 231 (2024), 268 (2025), rising steeply after 2020. Google TPU about 0 (2018), 6 (2019), 6 (2020), 10 (2021), 14 (2022), 14 (2023), 14 (2024), 13 (2025), flat after 2022. All Others about 0 (2018), 1 (2019), 1 (2020), 3 (2021), 8 (2022), 8 (2023), 8 (2024), 15 (2025), ending near the Google TPU line. Lines are about 2 pt wide, no markers, no highlighted points. Horizontal grey x-axis baseline at 0. No gridlines. Right panel contains no graphics, only four quotation blocks in black with green italic source names.
Slide 13
Annual Rhythm and Extreme Co-Design for Sustained Leadership / GB NVL72 for Training to Inference / OOM Leap in Inference Throughput and Cost Reduction / INFERENCEMAX V2 PERFORMANCE / GB200 / 15X TPS/GPU / VS. H200 / 12,500 / 10,000 / 7,500 / 5,000 / 2,500 / 0 / 1 / 50 / H200 / THROUGHPUT / TPS PER GPU / (HIGHER AI FACTORY OUTPUT) / INTERACTIVITY / TPS PER USER / (HIGHER IS BETTER)
Visuals: Hand-drawn style line chart (sketch-like, black ink with a grey and a green series) titled INFERENCEMAX V2 PERFORMANCE in small capitals at the top of the chart. Y-axis: THROUGHPUT, TPS PER GPU (HIGHER AI FACTORY OUTPUT), with a black upward arrow above the label; tick labels 0, 2,500, 5,000, 7,500, 10,000, 12,500 (linear, range 0 to 12,500). X-axis: INTERACTIVITY, TPS PER USER (HIGHER IS BETTER), with a black rightward arrow; tick labels 1 at the left origin and 50 at the midpoint (about 50 at the dashed line), range from 1 rightward. Series GB200 (bright green #76B900, thick sketched line): starts about 11,800 at x near 1.5, falls to about 10,300 near x 10, about 9,500 at x 50 (about), and ends about 6,800 near the right end of the axis. Series H200 (grey #8C8C8C, thick sketched line): starts about 1,300 near x 1.5 and falls to about 300 at its end near x 80 (about); labelled H200 above its start. A vertical grey dashed line at x=50 marks the reference point. A callout line in grey points from the label 15X TPS/GPU to the GB200 curve at x=50. The label reads 15X in bright green #76B900 bold, TPS/GPU in black bold, with VS. H200 in black regular beneath. No photographs; no icons other than the NVIDIA logo.
Slide 14
NVIDIA and OpenAI Partnership / Multi-Year, Multi-Generational Build Out of at Least 10 Gigawatts / The OpenAI partnership is a powerful demonstration of NVIDIA’s ability as an AI infrastructure partner – delivering architecture, chips, systems, networking, data centers, software, operations, and financing as one integrated solution / The partnership extends existing collaboration to scale multi-giga-watts of infrastructure at Microsoft, OCI, and CoreWeave / In addition to CSP capacity, OpenAI and NVIDIA will build at least 10 gigawatts – millions of GPUs – of infrastructure to be operated by OpenAI; The first gigawatt launches in 2026 on the Vera Rubin platform / For the first time, OpenAI will buy directly from NVIDIA, secure multi-cycle supply, forging close engineering collaboration to build AI factories / NVIDIA intends to invest in increments over time up to $100 billion in equity; Every 1GW build-out will require $50-60 billion in total spend. OpenAI will need to re-invest future revenue and/or secure other sources of financing to cover the total cost of their build outs.
Visuals: Two logos in the right panel and one small logo at bottom-left. (1) OpenAI wordmark: the word OpenAI in a bold geometric black sans-serif, black #000000 on the light grey panel, about 20% of slide width, centred horizontally around x 77% and y 32%. (2) NVIDIA logo: a green #76B900 eye-shaped mark followed by the black #000000 wordmark NVIDIA in heavy sans-serif capitals, about 25% of slide width, centred around x 78% and y 68%. (3) Small NVIDIA logo at bottom-left, the same green eye mark and black wordmark, about 4.8% of slide width. A thin grey horizontal rule (about #808080, roughly 1 px) runs under the subtitle. No charts, photographs or diagrams.
Slide 15
NVIDIA
Visuals: Illustration: a 3D render of stacked, curved green ribbon-like layers sweeping from the lower-right toward the upper-left, forming nested arch shapes. The innermost arch opens into a dark green recess with thin layered lines. The surface is glossy with soft highlights. The composition is full-bleed, and the image covers the entire slide. Dominant colours are bright green (#76B900) and lighter lime (#B5E61D) fading to white in the upper-left. Lighting is soft and diffuse from the upper-left, with shadows in deep green (#1E4D00) inside the arches. There is no overlay or tint. Logo: NVIDIA logo, green eye mark (#76B900) with black (#000000) wordmark in bold geometric sans-serif capitals. A small second image sits at the bottom-right corner over the green layers, with no legible content visible.
Download this deck
The hosted PDF of every library deck is free for readers of the SlideDeck Co newsletter. Join with your email and the viewer and download appear here.
Preparing a results presentation or business update of your own? The SlideDeck Co Standard Deck is a slide library for business reviews, updates and plans.







