The deck opens with a title slide for the Q2 FY27 investor presentation dated August 2026, followed by a dense safe-harbor section covering forward-looking statements, risk factors and the use of non-GAAP measures. The headline section comes next, with a revenue overview and a stream of single-metric slides on Data Center revenue split between Hyperscale and ACIE, gross margin, operating expenses, earnings per share, free cash flow and capital return. Each of these uses a simple before-and-after pair of bars or figures for Q2 FY26 against Q2 FY27, with a one-line headline stating the takeaway. A GAAP and a non-GAAP P&L table follow, then the Q3 FY27 outlook for revenue, gross margin and operating expenses. The back half is a series of reconciliation slides that bridge non-GAAP figures to GAAP, with footnotes explaining each adjustment, and it closes with a free cash flow reconciliation and a blank final slide. Slides 3, 4 and 8 are the strongest examples of the single-message layout to study.
Full text of the slides (17 slides)
Every slide's words and a description of its charts and images, so the deck can be searched and rebuilt. Also available as Markdown.
Slide 1
NVIDIA
Investor Presentation
Q2 FY27
August 2026
Visuals: One full-bleed photograph-style abstract 3D render covering the whole slide. Subject: stacked, curved green ribbon-like arches with rounded edges, nested in concentric rings that sweep from the lower left toward a dark recessed opening at the lower right. Composition: diagonal sweep from lower left to upper right, with fine translucent streaks and thin light lines fanning across the upper-left dark area. Lighting: soft specular highlights along the top edges of the green forms, with the recesses falling into deep shadow. Dominant colours: black #000000 and NVIDIA green #76B900 with brighter lime highlights. The image is not cropped in a box and has no overlay, but the dark upper-left area provides contrast for the text. A faint starfield of small white dots is visible across the upper-left dark area. The NVIDIA logo at top left is a logo: the green square-eye emblem with the white NVIDIA wordmark, placed over the dark area. A second small logo image sits at the lower right (about x 93, y 94.7, w 5.9, h 3.6) and is not visibly rendered in the preview.
Slide 2
Certain matters in this presentation including, but not limited to, statements as to: expectations with respect to NVIDIA AI infrastructure; expectations with respect to growth, performance and benefits of
NVIDIA’s products, services, and technologies, including Blackwell and Vera Rubin, and related trends and drivers; expectations with respect to supply and demand for NVIDIA’s products, services, and
technologies, including Blackwell and Vera Rubin, and related matters including inventory, production and distribution; NVIDIA’s financial position and financial and business outlook; NVIDIA’s future cash
dividends and other returns to shareholders; expectations with respect to technology developments and related trends and drivers; projected market growth and trends; expectations with respect to AI and
related industries; and other statements that are not historical facts are forward-looking statements within the meaning of Section 27A of the Securities Act of 1933, as amended, and Section 21E of the
Securities Exchange Act of 1934, as amended, which are subject to the “safe harbor” created by those sections based on management’s beliefs and assumptions and on information currently available to
management and are subject to risks and uncertainties that could cause results to be materially different than expectations.
Important factors that could cause actual results to differ materially include: global economic and political conditions; NVIDIA’s reliance on third parties to manufacture, assemble, package and test NVIDIA’s
products; the impact of technological development and competition; development of new products and technologies or enhancements to NVIDIA’s existing product and technologies; market acceptance of
NVIDIA’s products or NVIDIA’s partners’ products; design, manufacturing or software defects; changes in consumer preferences or demands; changes in industry standards and interfaces; unexpected loss of
performance of NVIDIA’s products or technologies when integrated into systems; NVIDIA’s ability to realize the potential benefits of business investments or acquisitions; and changes in applicable laws and
regulations, as well as other factors detailed from time to time in the most recent reports NVIDIA files with the Securities and Exchange Commission, or SEC, including, but not limited to, its annual report on
Form 10-K and quarterly reports on Form 10-Q. Copies of reports filed with the SEC are posted on the company’s website and are available from NVIDIA without charge. These forward-looking statements are
not guarantees of future performance and speak only as of the date hereof, and, except as required by law, NVIDIA disclaims any obligation to update these forward-looking statements to reflect future events
or circumstances.
Many of the products and features described herein remain in various stages and will be offered on a when-and-if-available basis. The statements within are not intended to be, and should not be interpreted as
a commitment, promise, or legal obligation, and the development, release, and timing of any features or functionalities described for our products is subject to change and remains at the sole discretion of
NVIDIA. NVIDIA will have no liability for failure to deliver or delay in the delivery of any of the products, features or functions set forth herein.
NVIDIA uses certain non-GAAP measures in this presentation including non-GAAP gross margin, non-GAAP operating expense, non-GAAP operating income, non-GAAP net income, non-GAAP diluted earnings
per share, and free cash flow. NVIDIA believes the presentation of its non-GAAP financial measures enhances investors' overall understanding of the company's historical financial performance. The presentation
of the company's non-GAAP financial measures is not meant to be considered in isolation or as a substitute for the company's financial results prepared in accordance with GAAP, and the company's non-GAAP
measures may be different from non-GAAP measures used by other companies. Further information relevant to the interpretation of non-GAAP financial measures, and reconciliations of these non-GAAP
financial measures to the most comparable GAAP measures, may be found in the slide titled “Reconciliation of Non-GAAP to GAAP Financial Measures”.
Visuals: Full-slide dark photographic background of abstract diagonal streaks: blurred grey-white and muted green light bands running from lower-left to upper-right across a black field, low contrast, no subject or people. Bottom-right corner: NVIDIA logo, a green eye-shaped emblem followed by the white NVIDIA wordmark. A narrow vertical green bar sits at the far right edge in the lower part of the slide. No charts, tables or diagrams.
Slide 3
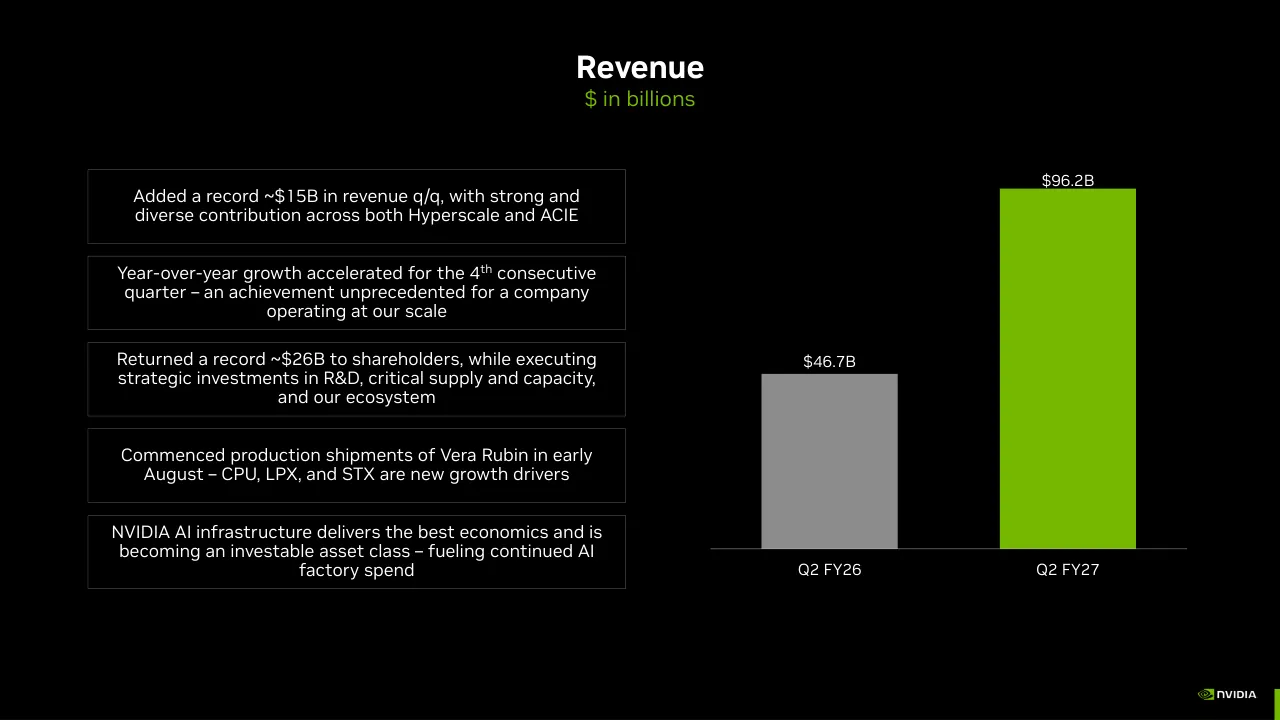
Revenue
$ in billions
Added a record ~$15B in revenue q/q, with strong and
diverse contribution across both Hyperscale and ACIE
Year-over-year growth accelerated for the 4th consecutive
quarter – an achievement unprecedented for a company
operating at our scale
Returned a record ~$26B to shareholders, while executing
strategic investments in R&D, critical supply and capacity,
and our ecosystem
$46.7B
Commenced production shipments of Vera Rubin in early
August – CPU, LPX, and STX are new growth drivers
NVIDIA AI infrastructure delivers the best economics and is
becoming an investable asset class – fueling continued AI
factory spend
Q2 FY26
Q2 FY27
$96.2B
Visuals: Bar chart, no chart title beyond the slide title 'Revenue' with subtitle '$ in billions'. Two vertical bars on a shared horizontal baseline (a thin light grey line about 0.1% of slide height, spanning about 55.5% to 92.8% of slide width). No y-axis, no gridlines, no tick labels; value labels sit above each bar. Series 1: category 'Q2 FY26', value $46.7B, grey bar #8C8C8C, roughly 24.3% of slide height tall, left bar at about 59.5% to 70.1% across. Series 2: category 'Q2 FY27', value $96.2B, bright green bar #76B900, roughly 50.0% of slide height tall, right bar at about 78.1% to 88.7% across. No legend. No highlighted points beyond the green colour on the Q2 FY27 bar. Five outlined rectangles (not a chart) hold the text on the left. NVIDIA logo (green stylised eye mark followed by white 'NVIDIA' wordmark) bottom right.
Slide 4
Data Center
Revenue $ in billions
Hyperscale
$48.7B
$24.2B
Q2 FY26
Q2 FY27
AI Clouds, Industrial, and Enterprise (ACIE)
$40.3B
$16.9B
Q2 FY26
Q2 FY27
Continued strong demand for our Blackwell architecture
NVIDIA logo (wordmark) at bottom right
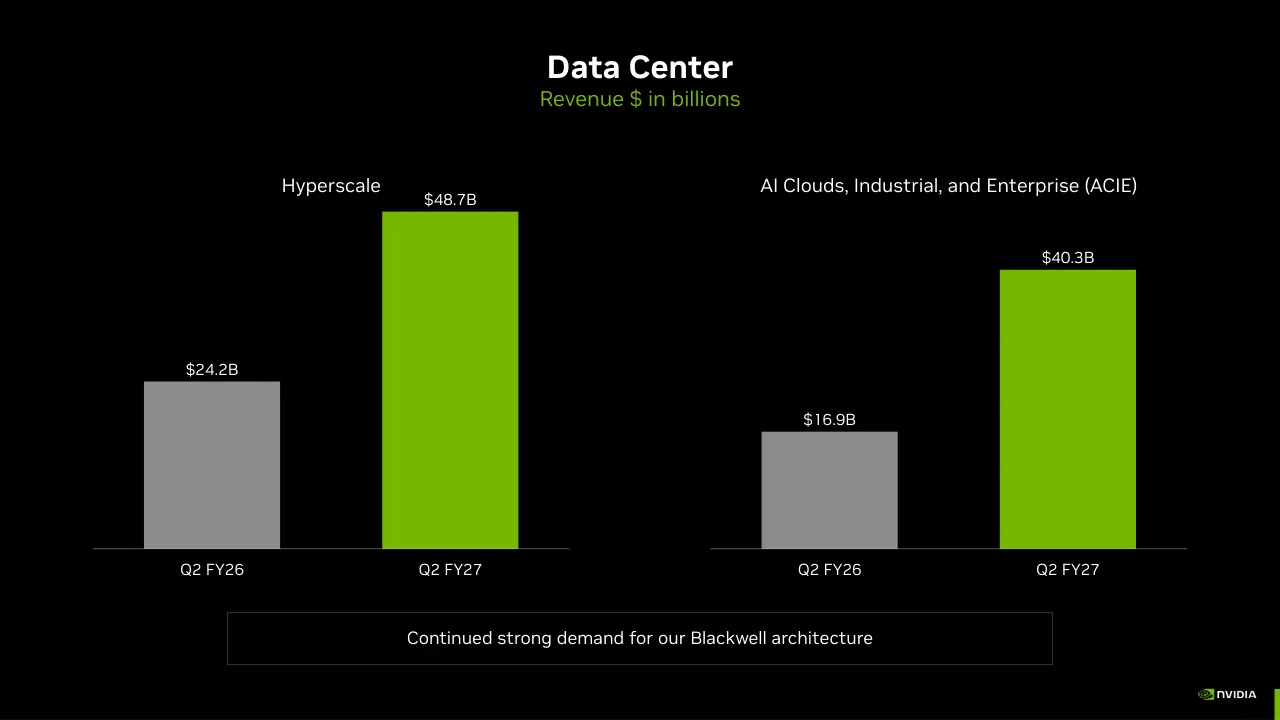
Visuals: Two grouped vertical bar charts, both with a 'Revenue $ in billions' unit (subtitle) and categories Q2 FY26 (grey) and Q2 FY27 (green) on a horizontal baseline; no y-axis, gridlines or numeric axis scale are shown. Left chart titled 'Hyperscale': Q2 FY26 bar labelled $24.2B (grey #8C8C8C), Q2 FY27 bar labelled $48.7B (green #76B900, the tallest bar on the slide). Right chart titled 'AI Clouds, Industrial, and Enterprise (ACIE)': Q2 FY26 bar labelled $16.9B (grey #8C8C8C), Q2 FY27 bar labelled $40.3B (green #76B900). Bar heights are proportional to the printed values, with the Q2 FY27 Hyperscale bar about 1.9 times the Q2 FY26 Hyperscale bar. No legend; colour grey versus green distinguishes the two years, and no points are separately highlighted beyond the green bars. A small NVIDIA wordmark logo in green and white sits at bottom right, and a thin green vertical bar runs along the right edge at the bottom.
Slide 5
Gross Margin
GAAP
72.4%
75.0%
Q2 FY26
Q2 FY27
Non-GAAP
72.5%
75.0%
Q2 FY26
Q2 FY27
Gross margin year-on-year increase driven by improved mix from Blackwell Ultra
Visuals: Two grouped vertical bar charts, side by side, with no visible value axis, no gridlines and no legend. Left chart titled GAAP: two bars, Q2 FY26 grey #8C8C8C labelled 72.4%, and Q2 FY27 green #76B900 labelled 75.0%. Right chart titled Non-GAAP: Q2 FY26 grey #8C8C8C labelled 72.5%, and Q2 FY27 green #76B900 labelled 75.0%. Bars are equal width (about 10.6% of slide width) and both charts use the same scale, so the 75.0% bars share the same top height (about 33.5% from top) and the 72.4% and 72.5% bars sit slightly lower (about 39% from top). Each chart has a thin light grey baseline (about 0.1% height) beneath its bars. Highlighted points: none beyond the green colour on the Q2 FY27 bars. Also a small NVIDIA logo (green eye mark and NVIDIA wordmark in white) at bottom right, and a thin green vertical bar at the far right edge.
Slide 6
Operating Expenses
$ in billions
GAAP
$8.4B
$5.4B
Q2 FY26
Q2 FY27
Non-GAAP
$8.2B
$5.4B
Q2 FY26
Q2 FY27
Investing to address the multitude of growth opportunities ahead
NVIDIA
Visuals: One bar chart split into two panels, GAAP (left) and Non-GAAP (right). Each panel has two vertical bars on a shared horizontal baseline with no y-axis, gridlines or legend. GAAP: grey bar for Q2 FY26 labelled $5.4B (about 64% of the height of the green bar); green bar for Q2 FY27 labelled $8.4B. Non-GAAP: grey bar for Q2 FY26 labelled $5.4B; green bar for Q2 FY27 labelled $8.2B. Bar heights are proportional to the printed values from a zero baseline. Under the caption box there is an outlined rectangle containing the caption text. Bottom-right: NVIDIA eye-and-wordmark logo in green and white.
Slide 7
Earnings per Share
GAAP
$2.46
Non-GAAP
$2.22
$1.08
$1.01
Q2 FY26
Q2 FY27
Q2 FY26
Q2 FY27
Record revenue and operating income drive strong EPS growth
Visuals: Two clustered column charts, both with the same structure. Left chart titled GAAP: grey bar Q2 FY26 at $1.08 and green bar Q2 FY27 at $2.46. Right chart titled Non-GAAP: grey bar Q2 FY26 at $1.01 and green bar Q2 FY27 at $2.22. Bars are about 10.6% of slide width each, with the labelled value above each bar. There are no y-axis ticks, axis titles or units, and no legend; grey (#8C8C8C) marks FY26 and green (#76B900) marks FY27. Each chart has a thin light-grey horizontal baseline under its bars. Bar heights are proportional to the values. The NVIDIA logo (green eye mark with NVIDIA wordmark) sits at bottom right.
Slide 8
Free Cash Flow and Capital Return
$ in billions
Free Cash Flow
Capital Return
Dividends
Share Repurchases
$21.3B
$26.0B
$13.5B
$10.0B
Q2 FY26
Q2 FY27
Q2 FY26
Q2 FY27
Returned a record ~$26B to shareholders while investing for growth
Visuals: Two vertical bar charts with $ in billions units and no printed axes or gridlines. Left chart, Free Cash Flow: Q2 FY26 grey bar labelled $13.5B and Q2 FY27 bright green bar labelled $21.3B, both sharing a thin grey baseline. Right chart, Capital Return, with legend at top right (dark green square labelled Dividends, bright green square labelled Share Repurchases): Q2 FY26 is a single grey bar labelled $10.0B with no split shown; Q2 FY27 is a stacked bar labelled $26.0B, with a dark green Dividends segment at the bottom and a bright green Share Repurchases segment above it. Segment values are not printed; by drawn scale the Q2 FY27 Dividends segment is about $6.1B and Share Repurchases about $19.9B. No segments are highlighted beyond the colour coding.
Slide 9
GAAP P&L Financial Measures
$ in billions, except EPS
Q2 FY27
YoY %
Q2 FY26
Revenue
$96.2
106%
$46.7
Gross Margin %
75.0%
+2.6 pts
72.4%
Operating Expenses
$8.4
55%
$5.4
Operating Income
$63.7
124%
$28.4
Net Income
$59.7
126%
$26.4
Diluted EPS
$2.46
128%
$1.08
Visuals: One table with four columns and seven rows. The header row has an empty first cell, then the columns Q2 FY27, YoY %, and Q2 FY26, with grey fill #8C8C8C and white text. The body rows are: Revenue, $96.2, 106%, $46.7; Gross Margin %, 75.0%, +2.6 pts, 72.4%; Operating Expenses, $8.4, 55%, $5.4; Operating Income, $63.7, 124%, $28.4; Net Income, $59.7, 126%, $26.4; Diluted EPS, $2.46, 128%, $1.08. The body cells are black with thin light-grey cell borders. No chart, photograph, or highlighted points appear. A small NVIDIA logo (green eye mark with black-and-white NVIDIA wordmark, shown in white/green on black) sits bottom right.
Slide 10
Non-GAAP P&L Financial Measures
$ in billions, except EPS
Q2 FY27
YoY %
Q2 FY26
Revenue
$96.2
106%
$46.7
Gross Margin %
75.0%
+2.5 pts
72.5%
Operating Expenses
$8.2
54%
$5.4
Operating Income
$64.0
124%
$28.5
Net Income
$54.0
118%
$24.8
Diluted EPS
$2.22
120%
$1.01
Visuals: Table with 4 columns and 6 rows (one header row and five data rows). Column 1 (label, left-aligned): blank header cell, then Revenue, Gross Margin %, Operating Expenses, Operating Income, Net Income, Diluted EPS. Column 2 header Q2 FY27 with values $96.2, 75.0%, $8.2, $64.0, $54.0, $2.22. Column 3 header YoY % with values 106%, +2.5 pts, 54%, 124%, 118%, 120%. Column 4 header Q2 FY26 with values $46.7, 72.5%, $5.4, $28.5, $24.8, $1.01. Header row filled mid-grey #8C8C8C with white text; body rows filled black #000000 with white text. Thin light-grey (#BFBFBF approx.) 1 px cell borders on all cells and an outer border. No chart, no highlighted cells. NVIDIA logo: green-and-white wordmark with the eye symbol, in the bottom-right corner.
Slide 11
Q3 FY27 Outlook – Non-GAAP
Q3 FY27
Revenue
$108.0 billion*
+ / - 2%
Gross Margin %
74.0%
+ / - 50 bps
Operating Expenses
$9.0 billion
Approximately
For the full year fiscal 2027, expect non-GAAP tax rates to be between 16.0% and 18.0%, excluding
any discrete items and material changes to our tax environment
*Outlook does not assume any Data Center compute revenue from China
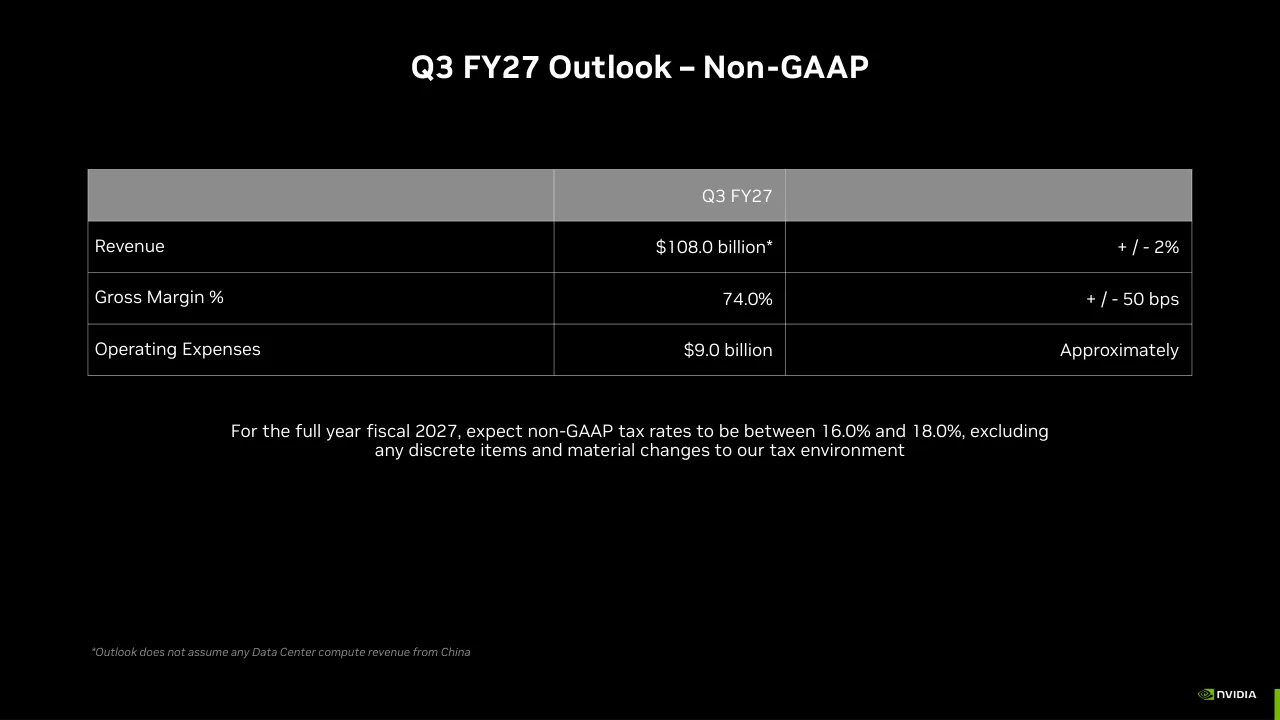
Visuals: One table with three columns and four rows. Column 1 (x 6.9 to 43.3%) has no header text. Column 2 (x 43.3 to 61.4%) is headed Q3 FY27. Column 3 (x 61.4 to 93.1%) has no header text. Header row (y 23.6 to 30.7%) is filled #8C8C8C with white text. Row 1 Revenue: $108.0 billion* | + / - 2%. Row 2 Gross Margin %: 74.0% | + / - 50 bps. Row 3 Operating Expenses: $9.0 billion | Approximately. Body rows are black with thin light grey (about #8C8C8C) cell borders, roughly 1 px. Column 1 text is left-aligned; columns 2 and 3 are right-aligned. No chart, photo or icon. The NVIDIA logo in #76B900 green wordmark with eye emblem sits bottom-right at x 93.0, y 94.7, w 5.9, h 3.6 (image 1863 by 641 pixels).
Slide 12
Reconciliation of Non-GAAP to
GAAP Financial Measures
Visuals: Full-bleed photographic-style abstract 3D render of smooth, glossy green curved ribbons or bands sweeping from the lower-right toward the upper-left against a black starfield background. The bands are lit with bright lime-green highlights on the right and darker olive-green tones toward the left, with thin pale rim highlights along the edges. Faint small white specks of light appear in the upper-left dark area. The composition is full-bleed with no border, and the ribbons are cropped by the right and bottom edges. A small logo image (1863 by 641 px) sits at the bottom right, about 93% from the left and 94.7% from the top, over the green ribbon area; its content is not legible in the render.
Slide 13
Reconciliation of Non-GAAP to GAAP Financial Measures
Q2 FY2027
Non-GAAP
Acquisition-
Related and Other
Costs (A)
Gain/(loss) on
Equity Securities
Other (B)
Tax Impact of
Adjustments
GAAP
Gross margin ($ in million)
$72,188
(46)
—
—
—
$72,142
Gross margin %
75.0%
—
—
—
—
75.0%
Operating expense ($ in million)
$8,232
176
—
—
—
$8,408
Operating income ($ in million)
$63,956
(222)
—
—
—
$63,734
Net income ($ in million)
$53,954
(222)
7,771
(298)
(1,517)
$59,688
Diluted shares (millions)
24,285
—
—
—
—
24,285
Diluted EPS
$2.22
(0.01)
0.32
(0.01)
(0.06)
$2.46
A. Consists of amortization of intangible assets, transaction costs, and certain compensation charges.
B. Consists of net gains/(losses) on equity derivatives, interest expense related to acquisition consideration discount to be paid in the future, share of net earnings/(losses) related to equity method investments, and dividend income on equity securities
Visuals: A data table with a grey header row and black body. Columns: Q2 FY2027 (row labels, left-aligned), Non-GAAP, Acquisition-Related and Other Costs (A), Gain/(loss) on Equity Securities, Other (B), Tax Impact of Adjustments, GAAP. Rows: Gross margin ($ in million): $72,188 | (46) | — | — | — | $72,142. Gross margin %: 75.0% | — | — | — | — | 75.0%. Operating expense ($ in million): $8,232 | 176 | — | — | — | $8,408. Operating income ($ in million): $63,956 | (222) | — | — | — | $63,734. Net income ($ in million): $53,954 | (222) | 7,771 | (298) | (1,517) | $59,688. Diluted shares (millions): 24,285 | — | — | — | — | 24,285. Diluted EPS: $2.22 | (0.01) | 0.32 | (0.01) | (0.06) | $2.46. Cell borders are thin grey lines. No chart, photograph or highlight. The only graphic is the small NVIDIA logo, green eye mark with wordmark, bottom right.
Slide 14
Reconciliation of Non-GAAP to GAAP Financial Measures
Q2 FY2026 | Non-GAAP | Acquisition-Related and Other Costs (A) | Gain/(loss) on Equity Securities | Other (B) | Tax Impact of Adjustments | GAAP
Gross margin ($ in million) | $33,902 | (49) | — | — | — | $33,853
Gross margin % | 72.5% | (0.1) | — | — | — | 72.4%
Operating expense ($ in million) | $5,361 | 37 | — | 15 | — | $5,413
Operating income ($ in million) | $28,541 | (86) | — | (15) | — | $28,440
Net income ($ in million) | $24,763 | (86) | 2,247 | (16) | (486) | $26,422
Diluted shares (millions) | 24,532 | — | — | — | — | 24,532
Diluted EPS | $1.01 | — | 0.09 | — | (0.02) | $1.08
Beginning in Q1 FY27, NVIDIA's non-GAAP financial measures no longer exclude stock-based compensation expense. The historical non-GAAP financial information presented has been updated to include stock-based compensation expense.
A. Consists of amortization of intangible assets, transaction costs, and certain compensation charges.
B. Consists primarily of legal settlements.
Visuals: Table. Columns: Q2 FY2026 (row label), Non-GAAP, Acquisition-Related and Other Costs (A), Gain/(loss) on Equity Securities, Other (B), Tax Impact of Adjustments, GAAP. Header row is filled #5E5E5E with white regular text; body rows sit on black with white text and thin grey (#5E5E5E-ish) 1 px cell borders. Rows: Gross margin ($ in million): $33,902 | (49) | — | — | — | $33,853. Gross margin %: 72.5% | (0.1) | — | — | — | 72.4%. Operating expense ($ in million): $5,361 | 37 | — | 15 | — | $5,413. Operating income ($ in million): $28,541 | (86) | — | (15) | — | $28,440. Net income ($ in million): $24,763 | (86) | 2,247 | (16) | (486) | $26,422. Diluted shares (millions): 24,532 | — | — | — | — | 24,532. Diluted EPS: $1.01 | — | 0.09 | — | (0.02) | $1.08. No chart, photograph or highlighted cells. Logo: NVIDIA, green eye-mark with white wordmark, bottom right.
Slide 15
Reconciliation of Non-GAAP to GAAP Financial Measures (contd.)
($ in Billions)
Q3 FY27 Outlook
Non-GAAP gross margin
74.0%
Impact of acquisition-related costs and other costs
—
GAAP gross margin
74.0%
Non-GAAP operating expenses
9.0
Acquisition-related costs and other costs
0.2
GAAP operating expenses
9.2
Visuals: One table, no chart. Columns: label column (header '($ in Billions)') and value column (header 'Q3 FY27 Outlook'). Rows, top to bottom: header row; 'Non-GAAP gross margin' | 74.0%; 'Impact of acquisition-related costs and other costs' (indented) | —; 'GAAP gross margin' | 74.0%; blank spacer row | (empty); 'Non-GAAP operating expenses' | 9.0; 'Acquisition-related costs and other costs' (indented) | 0.2; 'GAAP operating expenses' | 9.2. Header row is filled #5E5E5E; body rows are black with thin grey (about #5E5E5E, about 0.1% of slide width) horizontal rules and a thin vertical rule at x about 75.1%, and a thin outer border. Values are unitless, in billions for opex, and percentages for margins. One NVIDIA logo: the green eye emblem with the white-green 'NVIDIA' wordmark in the bottom-right corner, placed at x 93.0%, y 94.7%.
Slide 16
Reconciliation of Non-GAAP to GAAP Financial Measures (contd.)
($ in Millions) / Free Cash Flow / Purchases Related to / Property and Equipment / and Intangible Assets / Principal Payments on / Property and Equipment / and Intangible Assets / Net Cash Provided by / Operating Activities
Q2 FY2027 / $21,341 / (2,677) / (59) / $24,077
Q2 FY 2026 / $13,450 / (1,894) / (21) / $15,365
Visuals: One table, no chart. Columns: row label column (header text '($ in Millions)'), 'Free Cash Flow', 'Purchases Related to Property and Equipment and Intangible Assets', 'Principal Payments on Property and Equipment and Intangible Assets', 'Net Cash Provided by Operating Activities'. Rows: 'Q2 FY2027' with $21,341, (2,677), (59), $24,077; 'Q2 FY 2026' with $13,450, (1,894), (21), $15,365. Header row is filled mid grey #5E5E5E; data rows are black with thin grey (#5E5E5E-like) vertical and horizontal dividing lines and a light grey outer border. Values are centred in their cells. Logo: NVIDIA wordmark with eye symbol in green, white/grey lettering, small, bottom right, boxed by no frame. No photographs or illustrations.
Slide 17
Visuals: One illustration covers the whole slide: a 3D render of curved, glossy green (#76B900) arc-shaped bands sweeping from the lower-left toward the right edge. The bands are stacked concentrically around a dark, recessed opening at the lower right. Thin, faint curved lines and a scatter of small pale stars sit on the black upper-left area. Lighting is a soft specular highlight along the top edges of the green bands, and the rest is in shadow. Dominant colours are black #000000 and bright green #76B900 with darker green shading. The image is full-bleed, not cropped, and has no overlay or tint. Logo: the NVIDIA logo in the upper-left, consisting of a green (#76B900) stylised eye emblem and the white wordmark 'NVIDIA' in a bold, squared sans-serif, followed by a small ® mark. A second NVIDIA logo file is placed at the lower right (x 93.0, y 94.7, w 5.9, h 3.6), but it is not visibly apparent in the rendered slide.