
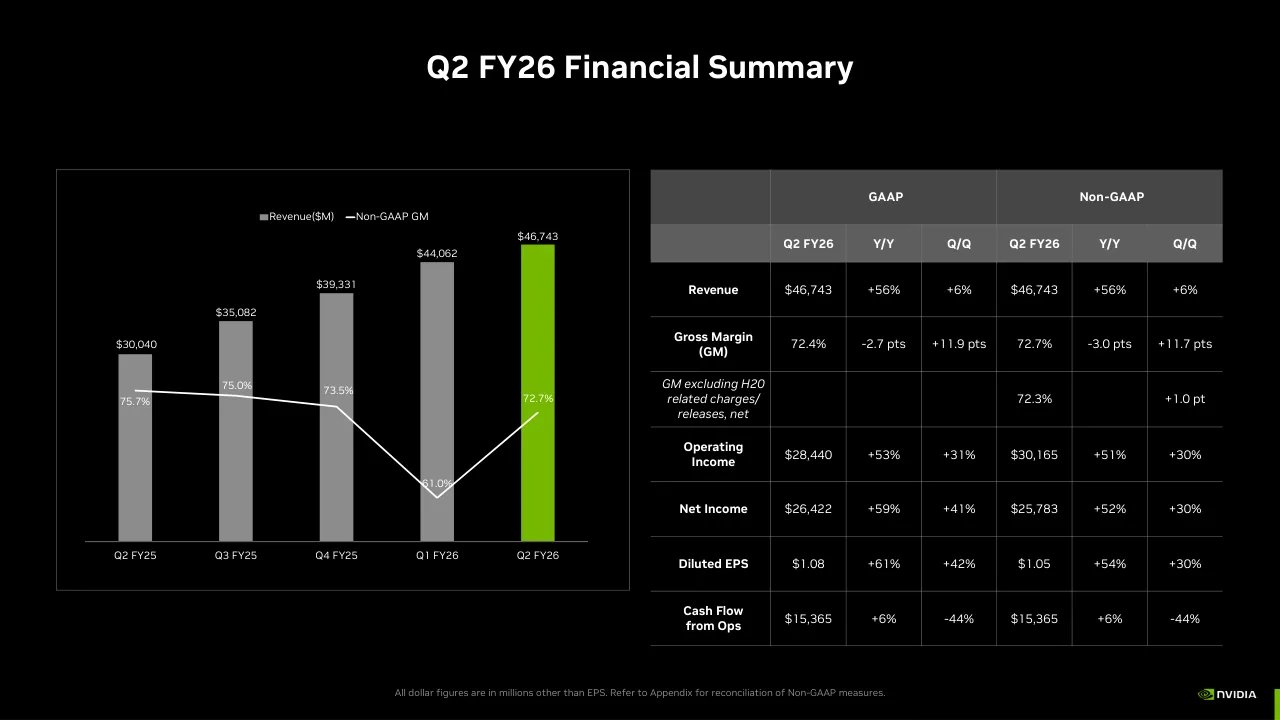
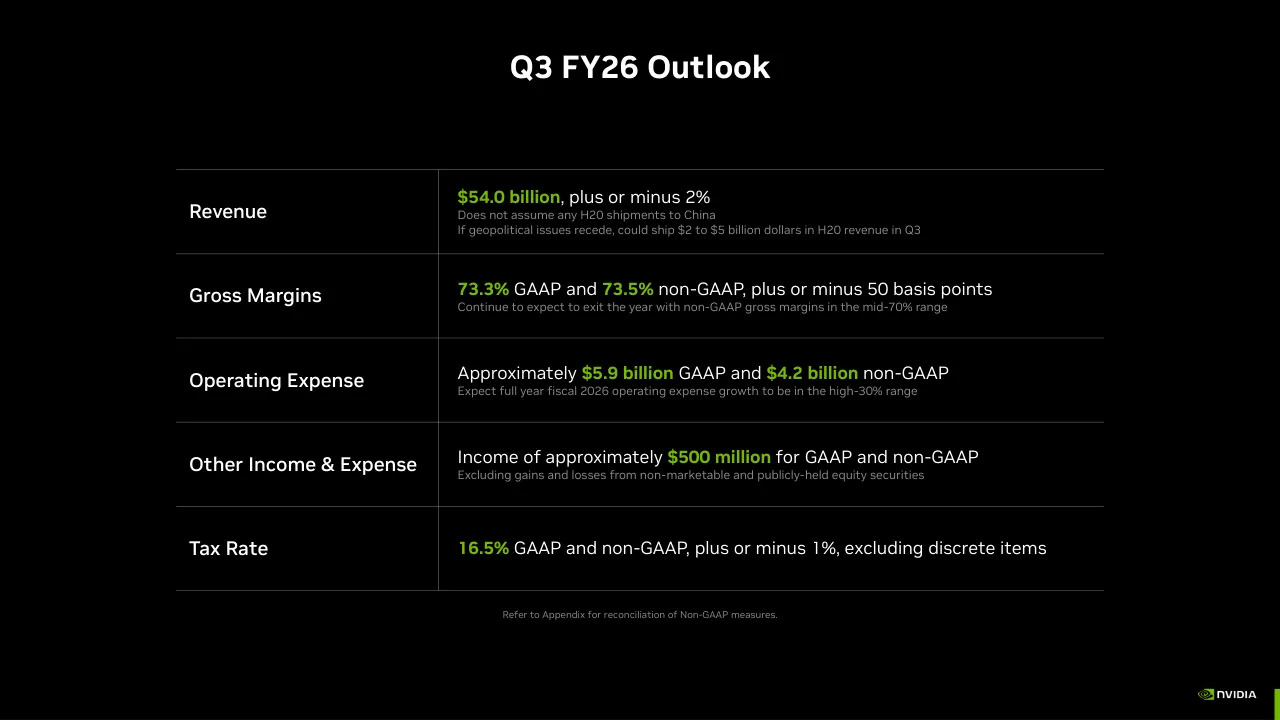
The deck opens with a title slide and a long forward-looking statements disclaimer covering risks and non-GAAP measures, a standard framing for an investor presentation. It then moves through a short agenda into an earnings summary for Q2 FY26, with highlights, a financial summary table and quarterly charts for Data Center, Gaming, Professional Visualization, Automotive and cash flow. A Q3 FY26 outlook slide follows, setting out revenue, margin, operating expense, other income and tax guidance. A section on key announcements then covers partnerships and product news in Europe, healthcare, manufacturing, cloud, MLPerf results, open models, RTX PRO servers, robotics and Jetson Thor. The closing section reconciles non-GAAP figures to GAAP for the quarter, prior quarters and the outlook. Slides worth studying include the financial summary table pairing GAAP and non-GAAP columns with Y/Y and Q/Q changes, the one-number-per-chart quarterly bar series, the outlook slide with its explicit assumptions, and the reconciliation tables that tie each adjustment to a footnote.
Slides worth studying
Questions about this deck
How many slides does NVIDIA's Q2 FY26 investor presentation have?
The NVIDIA Q2 FY26 investor presentation has 28 slides. Slide 1 is the title slide, Investor Presentation Q2 FY26, dated September 2025.
What revenue outlook does NVIDIA give for Q3 FY26?
On slide 12, NVIDIA gives a Q3 FY26 revenue outlook of $54.0 billion, plus or minus 2%. The outlook does not assume any H20 shipments to China.
What were NVIDIA's Data Center results in Q2 FY26?
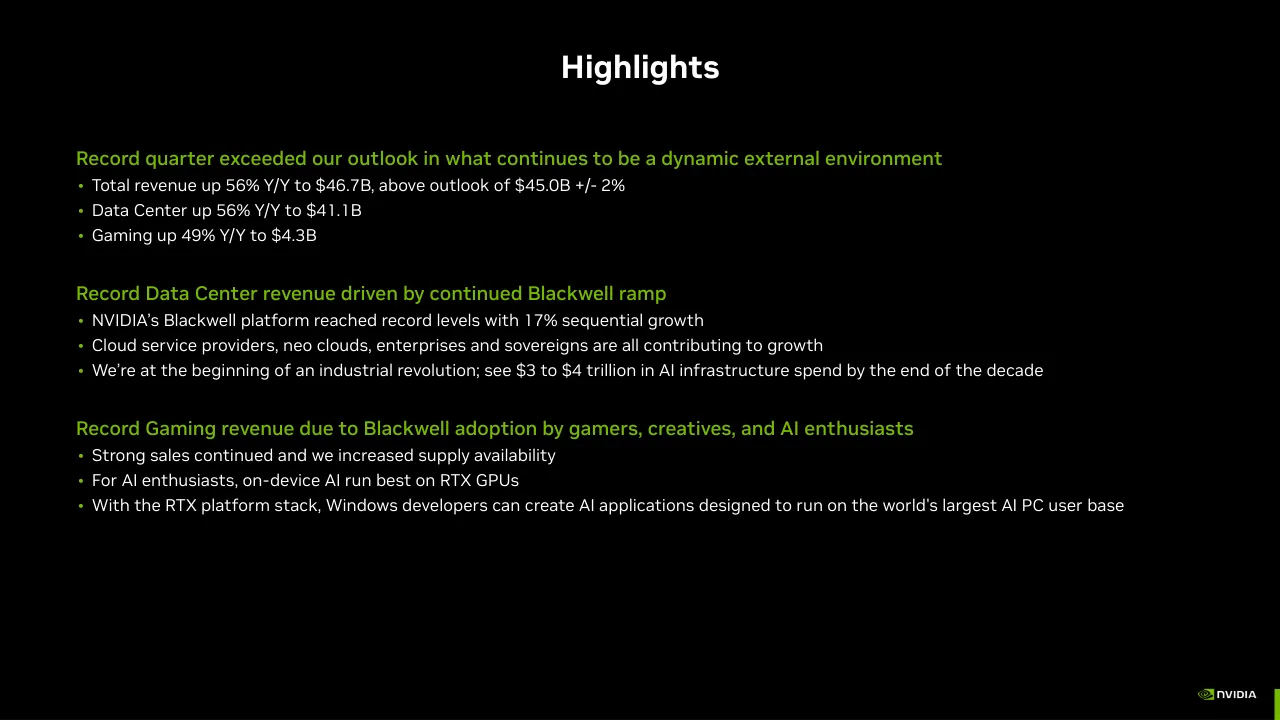
Slide 7 reports Data Center revenue of $41,096 million in Q2 FY26, shown as 56% Y/Y and 5% Q/Q. Slide 5 describes this as Data Center up 56% Y/Y to $41.1B.
How is NVIDIA's investor presentation structured?
Slide 3 lists the deck's main sections as Q2 FY26 Earnings Summary, Key Announcements This Quarter, and Reconciliation of Non-GAAP to GAAP Financial Measures. The deck opens with a forward-looking statements disclaimer on slide 2.
Details
- Company: NVIDIA
- Year: 2025
- Type: Investor presentation
- Industry: Semiconductors
- Pages: 28
More from NVIDIA
- NVIDIA investor presentation, September 2026 NDR
- NVIDIA investor presentation, Annual Stockholder Meeting June 2026
- NVIDIA investor presentation, Q2 FY27 quarterly presentation
- NVIDIA keynote, GTC Europe 2026
- NVIDIA presentation, 2026
- NVIDIA keynote, GTC 2026 Keynote
All NVIDIA decks in the library
Review score: 7 out of 10, Effective
Presentation quality, judged with the SlideDeck Co review heuristic. Ask, evidence and idea merit are not rated here.
The deck has a clear investor-update route: title, disclaimer, agenda, earnings summary, outlook, announcements, then reconciliation. The strongest pages (6, 12) have good hierarchy, with green used for key figures, and the quarterly charts on 7 to 11 highlight the current quarter in green against grey history. Weaknesses are consequential: the announcements section (14 to 23) uses very small body text, with slides 14 to 18 and 20 to 23 running in tiny type and slide 2 an unreadable wall of legal text. Chart labels are small, the slide 6 margin line labels collide with the bars, and the announcements add little connection to the financial story before the appendix.
Worth keeping: Keep the slide 12 outlook layout with green key numbers and grey assumptions, and the green-highlighted current quarter bar on slides 6 to 11.
Most useful repair: Enlarge body text on slides 7 to 11 and 14 to 23, and fix the margin line labels on slide 6 where they overlap the bars.
What would change the score: I would cut each announcement slide to two or three bullets with one stated takeaway, and give slides 7, 8 and 9 headlines that state the point rather than just the segment name.
Confidence medium. 28 of 28 pages inspected on contact sheets, 4 at readable size. Reviewed 2026-11-08. Model-assisted review (claude-sonnet-5-5).
Full text of the slides (28 slides)
Every slide's words and a description of its charts and images, so the deck can be searched and rebuilt. Also available as Markdown.
Slide 1
Investor Presentation
Q2 FY26
September 2025
Visuals: Full-bleed abstract 3D render of nested, glossy green arcs (rounded ring-like bands, #76B900 with bright highlight edges) sweeping from the lower-left toward the right edge and curving around a dark central opening at the lower right. Behind them, fine light lines and faint stars on a near-black field fill the upper-left. Lighting is soft specular rim light on the green surfaces; dominant colours are black #000000 and green #76B900. The image covers the whole slide, is not cropped to a shape, and has no overlay or tint. Also present: the NVIDIA logo (green eye mark with white wordmark) at top left, and a second logo image at bottom right which is not visibly rendered against the green artwork.
Slide 2
Certain matters in this presentation including, but not limited to, statements as to: the impact of H20 export licensing requirements; expectations with respect to growth, performance and benefits of NVIDIA’s
products, services, and technologies, including Blackwell, and related trends and drivers; expectations with respect to supply and demand for NVIDIA’s products, services, and technologies, including Blackwell,
and related matters including inventory, production and distribution; our financial position; projected market growth and trends, market opportunity, demand, and growth drivers; our financial and business
outlook; our dividend program; expectations with respect to NVIDIA’s third party arrangements, including with its collaborators and partners; third parties adopting our products and technologies; expectations
with respect to technology developments, including Rubin, and related trends and drivers; expectations with respect to AI and related industries; and other statements that are not historical facts are forward-
looking statements within the meaning of Section 27A of the Securities Act of 1933, as amended, and Section 21E of the Securities Exchange Act of 1934, as amended, which are subject to the “safe harbor”
created by those sections based on management’s beliefs and assumptions and on information currently available to management and are subject to risks and uncertainties that could cause results to be
materially different than expectations.
Important factors that could cause actual results to differ materially include: global economic and political conditions; NVIDIA’s reliance on third parties to manufacture, assemble, package and test NVIDIA’s
products; the impact of technological development and competition; development of new products and technologies or enhancements to NVIDIA’s existing product and technologies; market acceptance of
NVIDIA’s products or NVIDIA’s partners’ products; design, manufacturing or software defects; changes in consumer preferences or demands; changes in industry standards and interfaces; unexpected loss of
performance of NVIDIA’s products or technologies when integrated into systems; and changes in applicable laws and regulations, as well as other factors detailed from time to time in the most recent reports
NVIDIA files with the Securities and Exchange Commission, or SEC, including, but not limited to, its annual report on Form 10-K and quarterly reports on Form 10-Q. Copies of reports filed with the SEC are
posted on the company’s website and are available from NVIDIA without charge. These forward-looking statements are not guarantees of future performance and speak only as of the date hereof, and, except as
required by law, NVIDIA disclaims any obligation to update these forward-looking statements to reflect future events or circumstances.
Many of the products and features described herein remain in various stages and will be offered on a when-and-if-available basis. The statements within are not intended to be, and should not be interpreted as
a commitment, promise, or legal obligation, and the development, release, and timing of any features or functionalities described for our products is subject to change and remains at the sole discretion of
NVIDIA. NVIDIA will have no liability for failure to deliver or delay in the delivery of any of the products, features or functions set forth herein.
NVIDIA uses certain non-GAAP measures in this presentation including non-GAAP gross margin, non-GAAP gross margin excluding H20 related releases, non-GAAP operating income, non-GAAP net income, and
non-GAAP diluted earnings per share. NVIDIA believes the presentation of its non-GAAP financial measures enhances investors' overall understanding of the company's historical financial performance. The
presentation of the company's non-GAAP financial measures is not meant to be considered in isolation or as a substitute for the company's financial results prepared in accordance with GAAP, and the
company's non-GAAP measures may be different from non-GAAP measures used by other companies. Further information relevant to the interpretation of non-GAAP financial measures, and reconciliations of
these non-GAAP financial measures to the most comparable GAAP measures, may be found in the slide titled “Reconciliation of Non-GAAP to GAAP Financial Measures”.
Visuals: A full-bleed dark photographic background of soft diagonal grey-white light streaks fading into black, with the streaks concentrated in the upper-left and lower-right areas. A small NVIDIA logo at bottom right: a green stylised eye emblem followed by the white wordmark 'NVIDIA' in bold sans-serif. A narrow solid green bar at the right edge of the bottom row, about 0.7% wide. No charts, tables or diagrams.
Slide 3
Content
Q2 FY26 Earnings Summary
Key Announcements This Quarter
Reconciliation of Non-GAAP to GAAP Financial Measures
NVIDIA
Visuals: One photograph/illustration: an abstract 3D render of glossy, curved green ribbons or arcs sweeping from the lower left toward the upper right, forming nested concentric arch shapes. Their surfaces are lit from the upper left with soft specular highlights. The ribbons fade into near-black at the top-left corner and into dark shadowed gaps in the centre-right. Dominant colours are #76B900 green, dark olive greens and black. The image is cropped to a hard vertical edge at x 46.9% and runs full height, boxed to the left panel with no border. No overlay or tint is visible. One logo: the NVIDIA logo at bottom-right, a green stylised eye mark followed by a white NVIDIA wordmark. Two thin horizontal divider rules separate the bullet items. No charts, tables or other graphics.
Slide 4
Q2 FY26 / Earnings Summary
Visuals: Full-bleed photograph of abstract glossy green sculptural waves. Several curved, layered ribbon-like bands sweep from the lower-right corner up and to the left, shaped like nested arches with bright specular edges. The upper-left area is near-black with faint scattered star-like specks. Lighting is directional from the right, with lime-green highlights (about #76B900 to #8DC63F) on the front bands and deep forest-green (about #1F3A08) shadows toward the left. The image covers the whole slide with no border, crop-shape or frame. A dark overlay (solid black fill) lies beneath the photo, making the upper-left darker. A small raster image of the NVIDIA logo wordmark is placed in the bottom-right corner at about 93% from the left and 94.7% from the top, and is boxed by its own rectangle, not cropped.
Slide 5
Highlights
Record quarter exceeded our outlook in what continues to be a dynamic external environment
•
Total revenue up 56% Y/Y to $46.7B, above outlook of $45.0B +/- 2%
•
Data Center up 56% Y/Y to $41.1B
•
Gaming up 49% Y/Y to $4.3B
Record Data Center revenue driven by continued Blackwell ramp
•
NVIDIA’s Blackwell platform reached record levels with 17% sequential growth
•
Cloud service providers, neo clouds, enterprises and sovereigns are all contributing to growth
•
We’re at the beginning of an industrial revolution; see $3 to $4 trillion in AI infrastructure spend by the end of the decade
Record Gaming revenue due to Blackwell adoption by gamers, creatives, and AI enthusiasts
•
Strong sales continued and we increased supply availability
•
For AI enthusiasts, on-device AI run best on RTX GPUs
•
With the RTX platform stack, Windows developers can create AI applications designed to run on the world's largest AI PC user base
Visuals: Non-text elements: an NVIDIA logo (raster image, 1863 by 641 pixels) in the bottom-right corner, showing the green eye-shaped mark and the white-green NVIDIA wordmark on black; and a solid green (#76B900) vertical bar on the far right edge at the bottom. No charts, photographs or diagrams. Bullets are green dots set as separate text.
Slide 6
Q2 FY26 Financial Summary / Revenue($M) / Non-GAAP GM / $46,743 / $44,062 / $39,331 / $35,082 / $30,040 / 75.7% / 75.0% / 73.5% / 61.0% / 72.7% / 51,500 / 46,500 / 41,500 / 36,500 / 31,500 / 26,500 / 21,500 / 16,500 / 11,500 / 6,500 / 1,500 / 100.0% / 95.0% / 90.0% / 85.0% / 80.0% / 75.0% / 70.0% / 65.0% / 60.0% / 55.0% / Q2 FY25 / Q3 FY25 / Q4 FY25 / Q1 FY26 / Q2 FY26 / GAAP / Non-GAAP / Q2 FY26 / Y/Y / Q/Q / Q2 FY26 / Y/Y / Q/Q / Revenue / $46,743 / +56% / +6% / $46,743 / +56% / +6% / Gross Margin / (GM) / 72.4% / -2.7 pts / +11.9 pts / 72.7% / -3.0 pts / +11.7 pts / GM excluding H20 / related charges/ / releases, net / 72.3% / +1.0 pt / Operating / Income / $28,440 / +53% / +31% / $30,165 / +51% / +30% / Net Income / $26,422 / +59% / +41% / $25,783 / +52% / +30% / Diluted EPS / $1.08 / +61% / +42% / $1.05 / +54% / +30% / Cash Flow / from Ops / $15,365 / +6% / -44% / $15,365 / +6% / -44% / All dollar figures are in millions other than EPS. Refer to Appendix for reconciliation of Non-GAAP measures.
Visuals: Combo chart, left panel. Type: vertical bar chart with a line overlay on a secondary axis. Title: none printed on the chart. Bars: Revenue($M), five columns in order Q2 FY25 $30,040, Q3 FY25 $35,082, Q4 FY25 $39,331, Q1 FY26 $44,062, Q2 FY26 $46,743; the first four bars are grey #8C8C8C and the Q2 FY26 bar is green #76B900 and is highlighted. Left axis: revenue in millions of dollars, labels 1,500 to 51,500 in steps of 5,000 (1,500, 6,500, 11,500, 16,500, 21,500, 26,500, 31,500, 36,500, 41,500, 46,500, 51,500). Right axis: Non-GAAP gross margin in percent, labels 55.0% to 100.0% in steps of 5.0%. Line: Non-GAAP GM, white #FFFFFF stroke about 2 px, with point values Q2 FY25 75.7%, Q3 FY25 75.0%, Q4 FY25 73.5%, Q1 FY26 61.0% (lowest point, highlighted by its label at the bottom of the Q1 bar), Q2 FY26 72.7%. Category axis: Q2 FY25 to Q2 FY26 under a thin grey #8C8C8C baseline. Legend: centred above the plot, grey square swatch then Revenue($M), white line swatch then Non-GAAP GM. Chart frame: thin grey rectangular border around the whole chart. Table, right panel. Columns: row label, GAAP Q2 FY26, GAAP Y/Y, GAAP Q/Q, Non-GAAP Q2 FY26, Non-GAAP Y/Y, Non-GAAP Q/Q. Rows: Revenue $46,743 +56% +6% $46,743 +56% +6%; Gross Margin (GM) 72.4% -2.7 pts +11.9 pts 72.7% -3.0 pts +11.7 pts; GM excluding H20 related charges/ releases, net (italic) blank blank blank 72.3% blank +1.0 pt; Operating Income $28,440 +53% +31% $30,165 +51% +30%; Net Income $26,422 +59% +41% $25,783 +52% +30%; Diluted EPS $1.08 +61% +42% $1.05 +54% +30%; Cash Flow from Ops $15,365 +6% -44% $15,365 +6% -44%. NVIDIA logo: green eye mark with white NVIDIA wordmark, bottom right.
Slide 7
Data Center
Revenue ($M)
$26,272
$30,771
$35,580
$39,112
$41,096
56% Y/Y
and
5% Q/Q
Q2 FY25
Q3 FY25
Q4 FY25
Q1 FY26
Q2 FY26
Highlights
• The GB200 NVL system is seeing widespread adoption with
deployments at CSPs and consumer internet customers
• New Blackwell Ultra platform had a strong quarter, generating tens
of billions in revenue
• Current run rate back at full speed, producing approximately 1,000
racks per week; output expected to accelerate throughout Q3
• Expect widespread market availability of Blackwell Ultra in the
second half of the year
• NVIDIA RTX PRO servers are in full production from the world’s
systems makers; poised to become a multi-billion-dollar product line
• On track to achieve over $20 billion in sovereign AI revenue this year,
more than double that of last year
• Networking was a record, up 46% q/q and 98% y/y, with strong
demand across Spectrum-X Ethernet, InfiniBand, and NVLink
Visuals: Column chart of Data Center revenue in $M across five quarters, with no printed chart title inside the panel (the caption 'Revenue ($M)' sits below the panel). Categories along the horizontal axis: Q2 FY25, Q3 FY25, Q4 FY25, Q1 FY26, Q2 FY26. No vertical axis, tick marks or gridlines are printed; the bars sit on a thin horizontal baseline at about 75.2% of slide height, and bar heights are proportional to the labelled values, so the axis starts at zero (about). Single series with labelled values: Q2 FY25 $26,272; Q3 FY25 $30,771; Q4 FY25 $35,580; Q1 FY26 $39,112; Q2 FY26 $41,096. Legend: none. Highlighted point: the Q2 FY26 bar is filled green #76B900 while the other four are grey #8C8C8C. A green thin up-arrow above the Q2 FY26 bar carries the bold white annotation '56% Y/Y and 5% Q/Q'. Also a logo: the NVIDIA eye mark and wordmark in the bottom-right corner.
Slide 8
Gaming
Revenue ($M)
$4,287 / 49% Y/Y and 14% Q/Q
$3,763
$3,279
$2,880
$2,544
Q2 FY25 / Q3 FY25 / Q4 FY25 / Q1 FY26 / Q2 FY26
Highlights
Record gaming revenue driven by the ramp of Blackwell GeForce GPUs, as strong sales continued and supply availability increased
Shipped GeForce RTX 5060 desktop GPUs this quarter
Blackwell is coming to GeForce Now in September, the most significant upgrade, offering RTX 5080-class performance, minimal latency, and 5K resolution at 120 frames per second
GeForce Now catalog doubling to over 4,500 titles, the largest library of any cloud gaming service
Partnered with OpenAI to optimize their open-source gpt-oss models for high-quality, fast, and efficient inference on millions of RTX-enabled Windows devices
Visuals: Column chart, titled by the axis label Revenue ($M), in the left panel. Five vertical bars on a single series, with values printed above each bar: Q2 FY25 $2,880; Q3 FY25 $3,279; Q4 FY25 $2,544; Q1 FY26 $3,763; Q2 FY26 $4,287. Categories run left to right along a horizontal baseline at about y 75.6 percent, labelled Q2 FY25, Q3 FY25, Q4 FY25, Q1 FY26, Q2 FY26. There is no printed y-axis, no tick marks and no printed range; bar heights are proportional to the printed values (the Q2 FY26 bar is about 1.5 times the height of the Q2 FY25 bar). Bars are mid-grey #8C8C8C except the latest quarter, Q2 FY26, which is highlighted in green #76B900. No legend. An annotation above the last bar reads 49% Y/Y and 14% Q/Q, with a thin green upward arrow (#76B900) to its left pointing up. Right panel contains a bulleted list with no chart. Logo: NVIDIA logo bottom right with green eye mark and white NVIDIA wordmark.
Slide 9
Professional Visualization / $601 / $511 / $509 / $486 / $454 / 32% Y/Y / and / 18% Q/Q / Q2 FY25 / Q3 FY25 / Q4 FY25 / Q1 FY26 / Q2 FY26 / Revenue ($M) / Highlights / • Growth driven by the adoption of high-end RTX workstation / GPUs for AI-powered workloads like design, simulation, and / prototyping / • Key customers are leveraging NVIDIA solutions to accelerate / their operations / • Activision Blizzard uses RTX workstations to enhance creative / workflows, while robotics innovator Figure AI powers its / humanoid robots with RTX embedded GPUs
Visuals: Chart: vertical bar chart, revenue in $M. Five bars, no y-axis, no gridlines, no axis range printed; bar heights are proportional to the labelled values, with a shared baseline at y 74.9 percent. Series values printed above each bar: Q2 FY25 $454 (bar 26.2 percent of slide height, grey), Q3 FY25 $486 (28.0, grey), Q4 FY25 $511 (29.5, grey), Q1 FY26 $509 (29.3, grey), Q2 FY26 $601 (34.6, green). X-axis categories under the baseline: Q2 FY25, Q3 FY25, Q4 FY25, Q1 FY26, Q2 FY26. Highlighted point: the Q2 FY26 bar is green #76B900 and carries a thin green up-arrow with the annotation 32% Y/Y and 18% Q/Q above it. No legend. Other visuals: NVIDIA logo at bottom right and a green vertical strip at the far bottom-right edge.
Slide 10
Automotive / Highlights / • Growth primarily driven by self-driving solutions / • Began shipments of NVIDIA Thor SoC, the successor to Orin / • NVIDIA’s full-stack DRIVE AV software platform is now in / production, opening up billions in new revenue opportunities / for NVIDIA while improving vehicle safety and autonomy / 69% Y/Y / and / 3% Q/Q / $346 / $449 / $570 / $567 / $586 / Q2 FY25 / Q3 FY25 / Q4 FY25 / Q1 FY26 / Q2 FY26 / Revenue ($M)
Visuals: Vertical bar chart titled by the caption Revenue ($M), with no y-axis, no gridlines and no printed axis scale; the horizontal baseline is a thin grey line at about 75% of slide height spanning the chart width. Five bars, left to right, with category labels below and printed values above: Q2 FY25 $346 (grey #8C8C8C), Q3 FY25 $449 (grey), Q4 FY25 $570 (grey), Q1 FY26 $567 (grey), Q2 FY26 $586 (green #76B900, highlighted). Bar heights are proportional to the printed values, with the $346 bar about 23.4% of slide height tall and the $586 bar about 39.7%. Annotation at top right of chart: a thin green upward arrow with the text 69% Y/Y and 3% Q/Q pointing up toward the highlighted Q2 FY26 bar. Single series, no legend. Right panel contains bullet text only, no image.
Slide 11
Sources & Uses of Cash / Highlights / • Y/Y increase reflects growth in revenue, partially offset by an / increase in working capital / • Q/Q decrease was mainly driven by $8.1B in taxes paid in the / quarter / • Returned $10.0B to shareholders in the second quarter through / $9.7B of share repurchases and $244M of cash dividends / • Invested $1.9B in capex (includes principal payments on PP&E) / • Ended the quarter with $56.8B in gross cash and $8.5B in debt; / $48.3B in net cash / Cash Flow from Operations ($M) / $14,489 / $17,629 / $16,628 / $27,414 / $15,365 / Q2 FY25 / Q3 FY25 / Q4 FY25 / Q1 FY26 / Q2 FY26 / 6% Y/Y / 44% Q/Q / Gross cash is defined as cash/cash equivalents & marketable securities. / Net cash is defined as gross cash less debt. / Debt is defined as principal value of debt.
Visuals: Vertical bar chart titled Cash Flow from Operations ($M), with a horizontal baseline (about 6.7% to 46.5% of slide width, at about 75.2% of slide height). Five bars, values printed above each bar, no visible y-axis or gridlines: Q2 FY25 $14,489 (grey #8C8C8C, about height 21.3% of slide), Q3 FY25 $17,629 (grey, about 25.9%), Q4 FY25 $16,628 (grey, about 24.4%), Q1 FY26 $27,414 (grey, about 40.2%), Q2 FY26 $15,365 (green #76B900, about 22.5%, highlighted as the current quarter). Bar heights are proportional to the printed values. Category labels under the baseline in white. No legend. Annotation to the right of the last bar: a small green upward arrow (about x 40.2%, y 40.0% to 43.1%) with the label 6% Y/Y in bold white, and a small red downward arrow (about x 40.2%, y 44.8% to 48.0%) with 44% Q/Q in bold white. Right panel contains no graphics other than the bullets.
Slide 12
Q3 FY26 Outlook / Revenue / $54.0 billion, plus or minus 2% / Does not assume any H20 shipments to China / If geopolitical issues recede, could ship $2 to $5 billion dollars in H20 revenue in Q3 / Gross Margins / 73.3% GAAP and 73.5% non-GAAP, plus or minus 50 basis points / Continue to expect to exit the year with non-GAAP gross margins in the mid-70% range / Operating Expense / Approximately $5.9 billion GAAP and $4.2 billion non-GAAP / Expect full year fiscal 2026 operating expense growth to be in the high-30% range / Other Income & Expense / Income of approximately $500 million for GAAP and non-GAAP / Excluding gains and losses from non-marketable and publicly-held equity securities / Tax Rate / 16.5% GAAP and non-GAAP, plus or minus 1%, excluding discrete items / Refer to Appendix for reconciliation of Non-GAAP measures.
Visuals: None apart from the table structure: a five-row, two-column table with no cell fills. Column 1 (labels): Revenue; Gross Margins; Operating Expense; Other Income & Expense; Tax Rate. Column 2 (values): Revenue row: $54.0 billion, plus or minus 2%; sub-lines 'Does not assume any H20 shipments to China' and 'If geopolitical issues recede, could ship $2 to $5 billion dollars in H20 revenue in Q3'. Gross Margins row: 73.3% GAAP and 73.5% non-GAAP, plus or minus 50 basis points; sub-line 'Continue to expect to exit the year with non-GAAP gross margins in the mid-70% range'. Operating Expense row: Approximately $5.9 billion GAAP and $4.2 billion non-GAAP; sub-line 'Expect full year fiscal 2026 operating expense growth to be in the high-30% range'. Other Income & Expense row: Income of approximately $500 million for GAAP and non-GAAP; sub-line 'Excluding gains and losses from non-marketable and publicly-held equity securities'. Tax Rate row: 16.5% GAAP and non-GAAP, plus or minus 1%, excluding discrete items. Key figures are set in bold green #76B900. The NVIDIA logo: green eye-shaped mark with white 'NVIDIA' wordmark, bottom right.
Slide 13
Key Announcements
This Quarter
Visuals: Full-bleed abstract 3D render covering the whole slide: glossy green curved ribbons or layers sweep diagonally from the lower-left toward the upper-right, with the largest, brightest forms in the lower-right and the layers thinning and darkening toward the upper-left. The upper-left area is near-black with faint specks and small pale blue-white points of light, resembling distant stars. Lighting is directional, with bright green highlights and thin pale rim lines along the ribbon edges. Dominant colours are black #000000 and greens from about #2E5A00 to #76B900. The image is not cropped, boxed or tinted; it runs edge to edge. A small image sits at the bottom right (about x 93%, y 94.7%, 5.9% by 3.6%), probably a logo, but it is not distinguishable against the green ribbon.
Slide 14
Europe Builds Over 3,000 / Exaflops of NVIDIA AI / Infrastructure to Fuel Region’s / Next Industrial Transformation / EU plans to invest 20B Euros to / establish 20 AI factories including 5 / "gigafactories," to increase its AI / compute infrastructure 10x / • NVIDIA is working with European nations, and technology and / industry leaders, to build NVIDIA Blackwell AI infrastructure that / will strengthen digital sovereignty, support economic growth and / position the continent as a leader in the AI industrial revolution / • In France, Mistral AI is building an end-to-end cloud platform / powered by 18K NVIDIA Grace Blackwell systems in the first / phase, with plans to expand across multiple sites in 2026 / • In the U.K., NVIDIA Cloud Partners Nebius and Nscale announced / the first phase of their AI infrastructure development plans to / deploy 14K Blackwell GPUs to power new data centers / • In Germany, NVIDIA and partners are building the world’s first / industrial AI cloud for European manufacturers, powered by DGX / B200 systems and RTX PRO Servers / • These deployments will enable the EU to securely develop, train / and deploy agentic and physical AI applications / 3X+ / 2024 / 2025 / 2026 / GPU Die
Visuals: A bar chart with a Europe map as backdrop. Chart type: three vertical bars on a horizontal baseline, with an optional caption-style title 'GPU Die' under the year labels. X axis: years 2024, 2025, 2026. Y axis: no axis, scale or units are printed; bar heights are relative only. Series: one series in green gradient bars. Values are not printed; relative heights are about 1.0 (2024), about 2.7 (2025) and about 5.9 (2026), so 2025 is about 3X the 2024 bar as annotated by '3X+' and 2026 about 2.2X the 2025 bar. Callout arrows: 2025 bar has an upward beige arrow from the top of the bar to a short beige horizontal cap line labelled 3X+ above it; 2026 bar has a tall upward beige arrow with a short cap line at its top. Legend: none. Highlighted points: the 2026 bar is the tallest. Map: a dark bronze-brown 3D rendering of Europe (UK, Ireland, Iberia, France, Germany, Italy, Scandinavia, Eastern Europe) with small dark grey 3D map pins scattered across it and faint country borders, lit from the upper left, slightly tinted and blended into the charcoal panel, cropped at the right and bottom edges of the slide. Bars: lime green #B5FF2E at top fading to #5E9E00 at bottom with flat tops. Baseline: thin grey line #8C8C8C from about 72% to 94% of width at 78% of height. Arrows and cap lines: beige #C1B485, about 1 px stroke, with arrowheads.
Slide 15
NVIDIA Partners With Europe
Model Builders and Cloud Providers
to Accelerate Region’s Leap Into AI
•
NVIDIA is teaming with model builders and cloud providers across
Europe and the Middle East to optimize sovereign LLMs, helping
to accelerate enterprise AI adoption for the region’s industries
•
Model builders and AI consortiums are using NVIDIA Nemotron,
to maximize model cost efficiency and accuracy for enterprise AI
workloads, including agentic AI
•
Model post-training and inference will run on AI infrastructure in
Europe from NVIDIA Cloud Partners with DGX Cloud Lepton
•
The open, sovereign models will provide a foundation for an
integrated regional AI ecosystem that reflects local languages
and culture
NVIDIA
Visuals: One large visual: a dark, embossed, bronze-brown relief map of Europe (about 55.1% to 100% of width, full height) with country borders and small raised pin markers, partly covered by a #151617 overlay at 85% opacity and a dark gradient fading in from the left edge of the panel. Over the map sit 19 white company logos arranged in a loose 4-column by 5-row grid, listed in the elements. The map is lit from above and fades into black at the right and bottom. No charts, tables, or photographs. The NVIDIA logo bottom-left (green eye mark with white wordmark) is the only other graphic.
Slide 16
NVIDIA Partners With Novo
Nordisk and DCAI to Advance
Drug Discovery
NVIDIA and Novo Nordisk are collaborating to accelerate drug
discovery through innovative AI use cases
Novo Nordisk will use the Gefion sovereign AI supercomputer –
powered by NVIDIA DGX SuperPOD – for running drug discovery
and agentic AI workloads
And also:
NVIDIA BioNeMo for generative AI-powered drug discovery
NVIDIA NIM and NeMo for building customized agentic workflows
NVIDIA Omniverse to create physically accurate simulation
environments for developing physical AI applications
Will use NVIDIA BioNeMo, NIM, and NeMo to create customized
generative AI models and AI agents that can be used for early
research and clinical development
NVIDIA Omniverse will be used to apply advanced simulation and
physical AI technologies
GEFION
Specifications
Powered by NVIDIA DGX Technology
191 NVIDIA DGX H100
1,528 NVIDIA H100 Tensor Core GPUs
DCAI
NVIDIA
Visuals: One photograph in the right column, from x 55.1% to 100% and full height (0 to 100%), full-bleed to the top, bottom and right edges, with a dark tint over it. Subject: an indoor AI supercomputer installation. Overhead, a yellow cable tray or cooling duct runs diagonally across the top of the frame with cables and yellow fixtures hanging from it. In the middle left, two tall black server cabinets with glass doors sit side by side; the left door shows a small NVIDIA logo near its base and the right door shows the word EVIDEN near its base; the glass shows grey shelving with server units. In the foreground right, a tall black cabinet with a large white bold sans-serif GEFION wordmark at its top carries an orange rectangular panel with a black silhouette of a charging bull, head and horns raised, seen from the front. Below the panel, white small text reads Specifications / Powered by NVIDIA DGX Technology / 191 NVIDIA DGX H100 / 1,528 NVIDIA H100 Tensor Core GPUs. Composition: a three-quarter angled view from the left, camera at about shoulder height, the cabinets filling the frame and cropped at the top and right edge. Lighting: bright, even indoor lighting with soft reflections on the glass; the floor is pale grey-white. Dominant colours: saffron yellow at the top, black cabinets, orange panel, pale grey-white floor and walls. The photo is cropped by the slide edges, not boxed. A dark tint (#151617 at 85% opacity) covers the photo region, slightly dimming it. The DCAI caption sits on the lower left of the photo in dark text. A placed 1863 by 641 pixel image sits at x 93.0%, y 94.7%, and a logo at bottom-left x 0.8%, y 94.7%; the bottom-right image is not discernible in the render. Logo: the NVIDIA eye mark with NVIDIA wordmark in white at the bottom-left corner.
Slide 17
Siemens and NVIDIA Expand Partnership to Accelerate AI Capabilities in Manufacturing
Siemens and NVIDIA announced an expansion of their partnership to accelerate the next era of industrial AI and digitalization and enable the factory of the future
The partnership empowers industrial companies to leverage AI-powered technologies for next-gen factory automation
Advanced AI agents will work seamlessly across the Siemens Industrial Copilot portfolio, executing entire AI-powered processes without human intervention
Siemens’ Operations Copilot brings generative AI to shopfloor operators; optimized to run on premises with NVIDIA RTX PRO 6000 Blackwell Server Edition GPUs
Siemens is also integrating NVIDIA BlueField DPUs for AI-driven cybersecurity
BMW GROUP
Product Design and Engineering
Secure Edge Industrial AI
SCHAEFFLER
Operational Planning and Optimization
foxconn
Comprehensive Product and Factory Digital Twin
Production Optimization
SIEMENS
NVIDIA
Visuals: One isometric digital-twin diagram in the right column, about 55.1% to 100% of width and 38.6% to 84.4% of height, rendered on black with thin white and grey line paths. It shows a factory floor plan with a glowing teal-lit building, conveyor-like route lines and dotted paths connecting five labelled photo cards: (1) BMW GROUP label tag above a photo of a light silver-blue car in a design studio, captioned Product Design and Engineering, placed upper left; (2) SCHAEFFLER label tag above a photo of an industrial workstation with green-lit robots and workers, captioned Operational Planning and Optimization, placed lower left; (3) foxconn label tag above a photo of a factory production line with a worker, captioned Comprehensive Product and Factory Digital Twin, placed bottom centre; (4) a photo of server hardware (GPU cards and stacked rack units) captioned Secure Edge Industrial AI, placed upper right; (5) a photo of a worker at a monitor on a production line, captioned Production Optimization, placed lower right. Thin grey connector lines link the cards to the factory. Two logos: the Siemens wordmark in teal and the NVIDIA logo in green and white. Photos are small rectangular cards with thin light-grey borders, dark and moody lighting with cool blue-white and green accents.
Slide 18
NVIDIA DGX Cloud Lepton / Connects Europe’s Developers to / Global NVIDIA Compute Ecosystem / NVIDIA is expanding NVIDIA DGX Cloud Lepton — an AI platform / featuring a global compute marketplace that connects / developers building agentic and physical AI applications — with / GPUs now available from a growing network of cloud providers / Mistral AI, Nebius, Nscale, Firebird, Fluidstack, Hydra Host, / Scaleway and Together AI are now contributing NVIDIA Blackwell / and other NVIDIA architecture GPUs to the marketplace / AWS and Microsoft Azure will be the first large-scale cloud / providers to participate in DGX Cloud Lepton, joining CoreWeave, / Crusoe, Firmus, Foxconn, GMI Cloud, Lambda and Yotta Data / Services / Hugging Face is introducing Training Cluster as a Service, / seamlessly connecting AI researchers and developers building / foundation models with the NVIDIA compute ecosystem
Visuals: One photograph, a dark, gold-tinted render of planet Earth seen from space, placed at x 55.1 percent, y 0, w 44.9 percent, h 100 percent (788 by 988 pixels), cropped by the slide edges at the right and bottom and running full height as a panel. The globe's limb curves across the upper-left of the panel; the sunlit continents of Europe, Africa and Asia glow pale gold on the upper-middle and left, while the lower half fades into near-black. Many thin glowing gold and white arcs, like flight paths or data links, radiate from the lower-left across the globe, with small bright points of light scattered over the surface, especially in the centre. Lighting is a single warm key light from upper left; the composition is off-centre with the planet filling most of the panel. A dark gradient strip (722 by 4500 pixels) covers the left 9 percent of the panel, fading from black at the left edge into the globe image. A dark #151617 layer at 85 percent opacity lies over the photograph. The NVIDIA logo, green and white, sits bottom-left at x 0.8 percent, y 94.7 percent, w 5.9 percent, h 3.6 percent. A second logo image is placed at x 93.0 percent, y 94.7 percent inside a black block and is not visible. A thin vertical green bar sits at the bottom-left edge, about x 0 to 0.4 percent, y 95 to 100 percent, colour #76B900. A thin light-grey horizontal rule at about y 27.6 percent, colour #8A8A8A, about 1 pixel thick.
Slide 19
NVIDIA Blackwell Delivers / Breakthrough Performance in / Latest MLPerf Training Results / • NVIDIA AI platform delivered the highest performance at scale on / every benchmark and powered every result submitted on the / benchmark’s toughest large language model (LLM)-focused test: / Llama 3.1 405B pretraining – first MLPerf training submissions / using NVIDIA GB200 NVL72 systems / • NVIDIA was the only platform to submit results on every MLPerf / Training v5.0 benchmark – underscoring its exceptional / performance and versatility / • These performance leaps highlight advancements in Blackwell / that enable faster and more cost-effective training / • NVIDIA is working with companies worldwide to build out AI / factories – speeding the training and deployment of next-gen / agentic AI applications that produce tokens and intelligence that / can be applied to almost every industry and academic domain / NVIDIA
Visuals: One isometric 3D illustration on the right: a rack-scale system of black server cabinets. A tall rear cabinet stands at the back and a long, lower cabinet row with lit green and cyan-blue module panels sits in front of it. At the left front, a small black cooling or power unit stands on the floor, and silver-grey coolant pipes loop across the base and run to the right. The render has no outline or box and blends into the black background. Lighting is a soft top key with thin specular edge highlights on the cabinet edges and pipes. Dominant colours are black, dark charcoal, lime green and cyan LED accents, and silver-grey pipes. The image is not cropped, is not full-bleed, and carries no overlay or tint. A vertical gradient strip, slightly lighter at its left edge and fading to black, lies along the left edge of the right panel. No charts, tables or photographs appear on the slide.
Slide 20
OpenAI and NVIDIA Propel AI
Innovation With New Open Models
Optimized for the World’s Largest
AI Inference Infrastructure
• OpenAI’s two new open-weight AI reasoning models, oss-120b
and gpt-oss-20b, bring cutting-edge AI development to
developers, enthusiasts, enterprises, startups and governments
everywhere
• This collaboration highlights the power of community-driven
innovation and NVIDIA’s foundational role in making AI accessible
worldwide
• The models were trained on NVIDIA H100 GPUs and run inference
best on the hundreds of millions of GPUs running the NVIDIA
CUDA platform
• With software optimizations, the models offer optimal inference
on NVIDIA GB200 NVL72 systems, achieving industry leading
1.5M tokens per second, driving massive efficiency for inference
Visuals: Four visual elements. (1) OpenAI wordmark: white bold geometric sans lowercase-style wordmark reading OpenAI, placed in the right panel at about x 65.6%, y 24.4%, w 25.8%, h 12.5%, on the charcoal panel, not cropped. (2) Thin horizontal divider in the right panel at about y 50.9%, spanning about x 63.5% to 94%, a light grey line that fades to transparent at both ends and is brightest at centre. (3) NVIDIA logo lockup in the right panel at about x 64.3%, y 64.8%, w 28.4%, h 9.6%: green (#76B900) square-framed eye emblem on the left with a white NVIDIA wordmark on the right, not cropped. (4) Small NVIDIA logo in the bottom-left corner at about x 0.8%, y 94.7%, w 5.9%, h 3.6%: the same green eye emblem with white NVIDIA wordmark on black. Also a thin light grey horizontal rule under the title at about y 27.6%, x 0 to 47%, with no visible boxes or photographs.
Slide 21
NVIDIA RTX PRO Servers are in
Full Production From the World’s
Systems Makers
Cisco
DELL Technologies
HPE
Lenovo
SUPERMICR
Multi Workload Acceleration
vs. NVIDIA L40S
4X
FPS Real-Time
Rendering
6X
Throughput LLM
Inference
4X
Faster Synthetic
Data gen
Data Center Consolidation
vs. CPU
45X
Performance Enterprise Workloads
• Powered by NVIDIA RTX PRO 6000 Blackwell Server Edition GPUs,
these servers speed the shift from traditional CPU systems to
accelerated computing platforms
• These air-cooled, PCIe-based systems integrate seamlessly into
standard IT environments
• They run traditional enterprise IT applications as well as the most
advanced agentic and physical AI applications
• Enterprises can achieve up to 45x better performance and 18x
higher energy efficiency when running enterprise workloads
• Nearly 90 companies including many global leaders are already
adopting RTX PRO servers
• Hitachi for real-time simulation and digital twins
• Lilly for drug discovery
• Hyundai for factory design and AV validation
• Disney for immersive storytelling
Projected Performance. Subject to Change
• Omniverse; Debrecen; Real Time Rendering – FPS. RTX PRO 6000 vs L40S, RT2+DLSS4 On vs DLSS3
• Llama3 70B Inference; 8K/256, 20 t/s/usr; RTX PRO 6000 FP4 vs L40S FP8
• NVIDIA Cosmos 7B; Text-Video Generation, 2.5s 720p Video; RTX PRO 6000 FP4 vs L40S FP8
• NVIDIA RTX PRO Server (2U Chassis, 2x RTX PRO 6000 Blackwell Server Edition GPU, 2x x86 CPU, 3kW) vs. 2x x86 CPU (2U Chassis,
1.1kW); Multi-Workload Relative Performance; Geomean of measured performance speedups for HPC Applications (FP32), Rendering
(V-Ray), Spark RAPIDS, Encode Streams (1080p30, HEVC). Shown for representation only. Please contact partners for pricing.
Visuals: 1) Photograph of an NVIDIA RTX PRO server (2U chassis) shown at an oblique three-quarter angle from above and to the left; two gold-coloured, finned, double-width GPU cards are seated at the top rear of the chassis, one near the centre-top and one at the right; the chassis body is dark grey metal with a silver-grey sheet-metal lid, cooling fans and vents visible toward the centre, and drive bays and hot-swap modules visible along the front-right edge. Lighting is soft studio light from above on a black background; composition is a centred, unboxed product shot with the object cropped to its own silhouette and placed on a black field. No overlay or tint. 2) Five partner logos in white on black, stacked vertically at the right: Cisco (wordmark with bar icon), Dell Technologies (wordmark), HPE (wordmark), Lenovo (white wordmark on a white rectangle, black text), Supermicro (wordmark in a white oval outline). 3) Three-metric block: '4X' FPS Real-Time Rendering, '6X' Throughput LLM Inference, '4X' Faster Synthetic Data gen, all in green large numerals with white captions, under the heading Multi Workload Acceleration with subheading vs. NVIDIA L40S. 4) Single metric: '45X' Performance Enterprise Workloads, under the heading Data Center Consolidation with subheading vs. CPU. 5) Horizontal grey rule across the left column at about 27.6% from top, from the left edge to about 47% of slide width. 6) Green vertical accent bar at bottom-left corner. 7) NVIDIA logo bottom-left (green and white). 8) A second NVIDIA logo image at bottom-right, which is not visibly rendered against the black background.
Slide 22
NVIDIA Opens Portals to World of / Robotics With New Omniverse / Libraries, Cosmos Physical AI Models / and AI Computing Infrastructure / New NVIDIA Omniverse libraries and Cosmos world foundation / models (WFMs) accelerate the development and deployment of / physical AI and robotics solutions / Boston Dynamics, Disney Research, Figure AI, Hexagon, RAI / Institute, Lightwheel and Skild AI are adopting Omniverse / libraries, Isaac Sim and Isaac Lab to accelerate their AI robotics / development, while Amazon Devices & Services is using them to / power a new manufacturing solution / Cosmos Reason is being used by Magna, and adopted by VAST / Data, Milestone Systems and Linker Vision for autonomous / delivery vehicles, automated traffic monitoring, visual inspection / Lightwheel, Moon Surgical and Skild AI are using Cosmos / Transfer to accelerate physical AI training / Images | Video | Lidar / Robot Model / CAD, UDRF, MJCF / NVIDIA Isaac Sim
Visuals: Diagram on the right panel. (1) Top-left: a stack of three overlapping rounded-corner photo cards of a kitchen counter with groceries, bowls, a kettle and packaged food, captioned Images | Video | Lidar. (2) Top-right: a rounded-corner dark grey box showing a grey 3D CAD-style render of a six-axis robot arm on a thin perspective grid, captioned Robot Model / CAD, UDRF, MJCF. (3) A thin grey elbow connector: two vertical arrows rise from a horizontal bracket line, one up to the bottom of the image stack and one up to the bottom of the robot box; a single vertical arrow runs down from the bracket centre to the top edge of the Isaac Sim photo. (4) Bottom-right: a full-width rounded photograph, a real kitchen counter with a white six-jointed robot arm reaching over a wooden bowl of mango and oranges, a yellow snack bag, a stainless bowl, a plate and a plant; the photo is full-colour warm beige and brown lit by soft daylight, framed inside a thin grey border, not cropped, with a simulated render look. Caption NVIDIA Isaac Sim is centred below it.
Slide 23
NVIDIA Blackwell-Powered Jetson
Thor Now Available, the Ultimate
Platform for Physical AI & Robotics
7.5x Orin
AI Compute
3.5x Orin
Energy Efficiency
3.1x Orin
CPU Performance
10x Orin
I/O Throughput
• These powerful new robotics computers are built for generative
reasoning and designed to power millions of robots across
diverse industries including manufacturing, logistics, agriculture,
transportation, healthcare, and retail
• With over 2,000 teraflops of AI compute, it unlocks new
capabilities such as simultaneous processing of multiple AI
workstreams and real-time inference.
• Agility Robotics, Amazon Robotics, Boston Dynamics, Caterpillar,
Figure, Hexagon, Medtronic and Meta are among the early Jetson
Thor adopters
• Also available is the new NVIDIA DRIVE AGX Thor developer kit for
safe, secure AV development
• Runs increasingly complex AV systems equipped with reasoning
vision language models, generative AI, and advanced sensor
technologies
• Leading automotive and AV companies are embracing Thor including
Aurora, BYD, Continental, Desay SV, Nuro, PlusAI, Volvo Cars, Waabi,
Wayve, and WeRide
Visuals: Four outlined feature cards in a 2x2 grid on the dark right panel, each with a green line icon and two lines of white text. Top-left card: green neural-network node icon with text 7.5x Orin / AI Compute. Top-right card: green browser-window icon with a lightning bolt, text 3.5x Orin / Energy Efficiency. Bottom-left card: green square chip/grid icon, text 3.1x Orin / CPU Performance. Bottom-right card: green icon of a box with left and right arrows through it, text 10x Orin / I/O Throughput. Below the cards is a product photograph of the NVIDIA Jetson Thor developer module: a brushed silver, rectangular metal enclosure with a black perforated heatsink on its top, standing at a slight angle on a dark reflective surface, with a separate black circuit-board module tilted in front of it that carries a square chip with a green-tinted die and rows of components along its edge. The enclosure shows rear ports (USB, HDMI-type and Ethernet-type connectors) on its left end. Lighting is soft studio light from above, the background is near-black, and the scene is dominant in silver, black and grey with green-tinted chip highlights. The photograph is not cropped and is placed directly on the dark panel with no border.
Slide 24
Reconciliation of Non-GAAP to / GAAP Financial Measures
Visuals: Photograph-style abstract 3D render: dark black background at upper left with faint star-like specks, and sweeping glossy bright green curved ribbon or arch forms rising from the bottom and sweeping toward the upper right. Composition is diagonal, the green forms fill the lower-right two-thirds of the frame and are full-bleed, cropped at the bottom and right edges. Lighting is soft specular highlights along the edges of the green forms; dominant colours are NVIDIA green #76B900 and near-black #000000 with dark green shadows. No overlay other than the black base fill. Bottom-right image is a small NVIDIA logo (green eye mark with wordmark), placed as a logo, not a photograph.
Slide 25
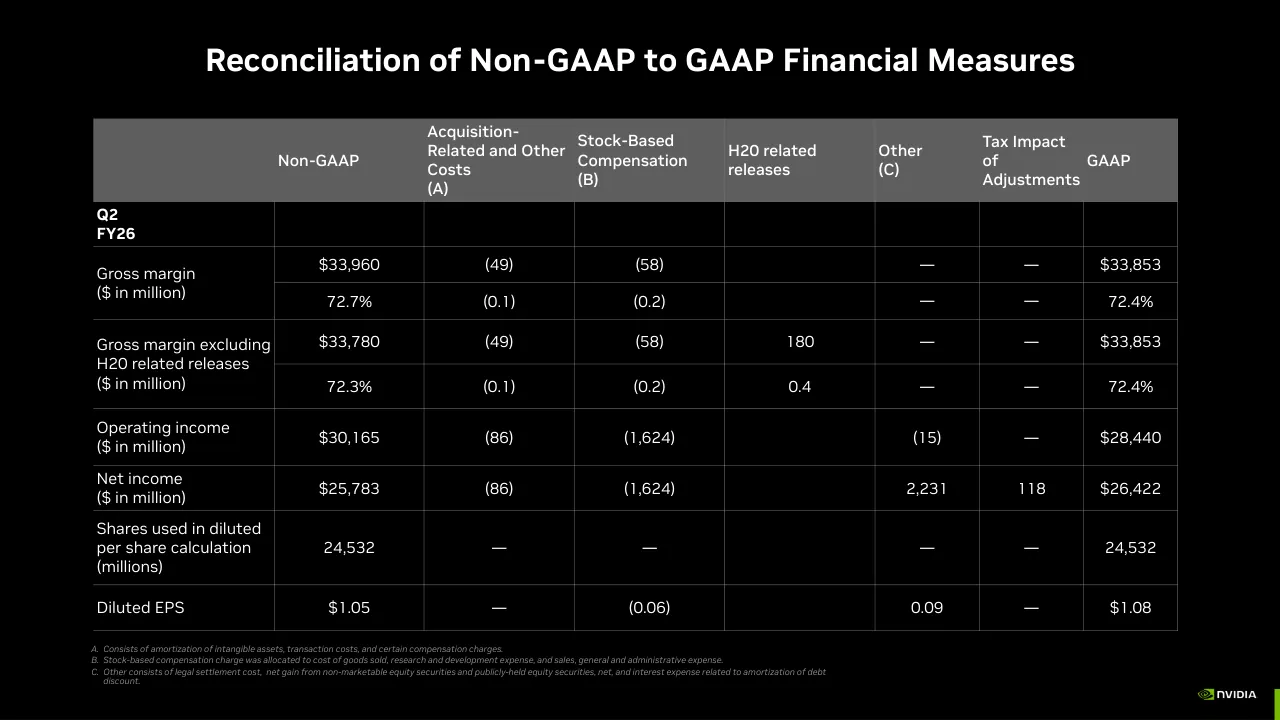
Reconciliation of Non-GAAP to GAAP Financial Measures / Non-GAAP / Acquisition-Related and Other Costs (A) / Stock-Based Compensation (B) / H20 related releases / Other (C) / Tax Impact of Adjustments / GAAP / Q2 FY26 / Gross margin ($ in million) / $33,960 / (49) / (58) / — / — / $33,853 / 72.7% / (0.1) / (0.2) / — / — / 72.4% / Gross margin excluding H20 related releases ($ in million) / $33,780 / (49) / (58) / 180 / — / — / $33,853 / 72.3% / (0.1) / (0.2) / 0.4 / — / — / 72.4% / Operating income ($ in million) / $30,165 / (86) / (1,624) / (15) / — / $28,440 / Net income ($ in million) / $25,783 / (86) / (1,624) / 2,231 / 118 / $26,422 / Shares used in diluted per share calculation (millions) / 24,532 / — / — / — / — / 24,532 / Diluted EPS / $1.05 / — / (0.06) / 0.09 / — / $1.08 / A. Consists of amortization of intangible assets, transaction costs, and certain compensation charges. / B. Stock-based compensation charge was allocated to cost of goods sold, research and development expense, and sales, general and administrative expense. / C. Other consists of legal settlement cost, net gain from non-marketable equity securities and publicly-held equity securities, net, and interest expense related to amortization of debt / discount.
Visuals: Table with 8 columns and 9 rows. Columns: an unlabelled row-label column, Non-GAAP, Acquisition-Related and Other Costs (A), Stock-Based Compensation (B), H20 related releases, Other (C), Tax Impact of Adjustments, and GAAP. Rows: Q2 FY26 section label (no values); Gross margin ($ in million) with $33,960 / (49) / (58) / blank / — / — / $33,853, and its percentage row 72.7% / (0.1) / (0.2) / blank / — / — / 72.4%; Gross margin excluding H20 related releases ($ in million) with $33,780 / (49) / (58) / 180 / — / — / $33,853, and its percentage row 72.3% / (0.1) / (0.2) / 0.4 / — / — / 72.4%; Operating income ($ in million) with $30,165 / (86) / (1,624) / blank / (15) / — / $28,440; Net income ($ in million) with $25,783 / (86) / (1,624) / blank / 2,231 / 118 / $26,422; Shares used in diluted per share calculation (millions) with 24,532 / — / — / blank / — / — / 24,532; Diluted EPS with $1.05 / — / (0.06) / blank / 0.09 / — / $1.08. Negative values are in parentheses and dashes mark nil values. No highlighted points. Header row is filled with a mid-grey block and the body is black with thin grey rules. Also a small bright green vertical bar at the far right edge, bottom area, and the NVIDIA logo (green eye mark with white wordmark) in the bottom-right corner. No photographs or charts.
Slide 26
Reconciliation of Non-GAAP to GAAP Financial Measures (contd.)
Gross Margin
Non-GAAP
Acquisition-Related and
Other Costs
(A)
Stock-Based
Compensation
(B)
GAAP
Q2 FY 2025
75.7%
(0.4)
(0.2)
75.1%
Q3 FY 2025
75.0%
(0.3)
(0.1)
74.6%
Q4 FY 2025
73.5%
(0.3)
(0.2)
73.0%
Q1 FY 2026
61.0%
(0.3)
(0.2)
60.5%
A. Consists of amortization of intangible assets.
B. Stock-based compensation charge was allocated to cost of goods sold.
Visuals: Table: columns are Gross Margin, Non-GAAP, Acquisition-Related and Other Costs (A), Stock-Based Compensation (B), and GAAP. Rows: Q2 FY 2025 | 75.7% | (0.4) | (0.2) | 75.1%; Q3 FY 2025 | 75.0% | (0.3) | (0.1) | 74.6%; Q4 FY 2025 | 73.5% | (0.3) | (0.2) | 73.0%; Q1 FY 2026 | 61.0% | (0.3) | (0.2) | 60.5%. Header row is filled #5E5E5E with white text; body cells are black with white text; thin mid-grey vertical and horizontal rules separate cells. Logo: NVIDIA logo (green eye mark with the white NVIDIA wordmark) at bottom right.
Slide 27
Reconciliation of Non-GAAP to GAAP Financial Measures (contd.) / ($ in Millions) / Q3 FY26 Outlook / Non-GAAP gross margin / 73.5% / Impact of stock-based compensation expense, acquisition-related costs, and other costs / 0.2% / GAAP gross margin / 73.3% / Non-GAAP operating expenses / $4,200 / Stock-based compensation expense, acquisition-related costs, and other costs / (1,700) / GAAP operating expenses / $5,900
Visuals: Table with two columns and a header row. Header row (grey #5E5E5E band, white text): column 1 '($ in Millions)', column 2 'Q3 FY26 Outlook'. Rows in order: 1) 'Non-GAAP gross margin' | 73.5%; 2) indented 'Impact of stock-based compensation expense, acquisition-related costs, and other costs' | 0.2%; 3) 'GAAP gross margin' | 73.3%; 4) an empty spacer row with no text, about 9 percent of the height; 5) 'Non-GAAP operating expenses' | $4,200; 6) indented 'Stock-based compensation expense, acquisition-related costs, and other costs' | (1,700); 7) 'GAAP operating expenses' | $5,900. Thin grey horizontal rules separate rows, and a thin grey vertical rule divides the columns. No chart, photograph or icon other than the NVIDIA logo at bottom right. No highlighted cells.
Slide 28
NVIDIA®
Visuals: Full-bleed 3D illustration of glossy green concentric arcs (rings) sweeping from the bottom-left corner up and across to the right, curving around a dark hollow opening at the lower right. The rings are lit from the upper left with specular highlights along their top edges, shaded to deeper green in the recesses, and the thin background lines and faint star specks fade into black at the top-left. A small NVIDIA logo (green eye-emblem square with white wordmark and ® mark) sits at the top-left. A second placed image lies at the bottom-right corner and is not visibly rendered on the page.
Download this deck
The hosted PDF of every library deck is free for readers of the SlideDeck Co newsletter. Join with your email and the viewer and download appear here.
Preparing a results presentation or business update of your own? The SlideDeck Co Standard Deck is a slide library for business reviews, updates and plans.







