
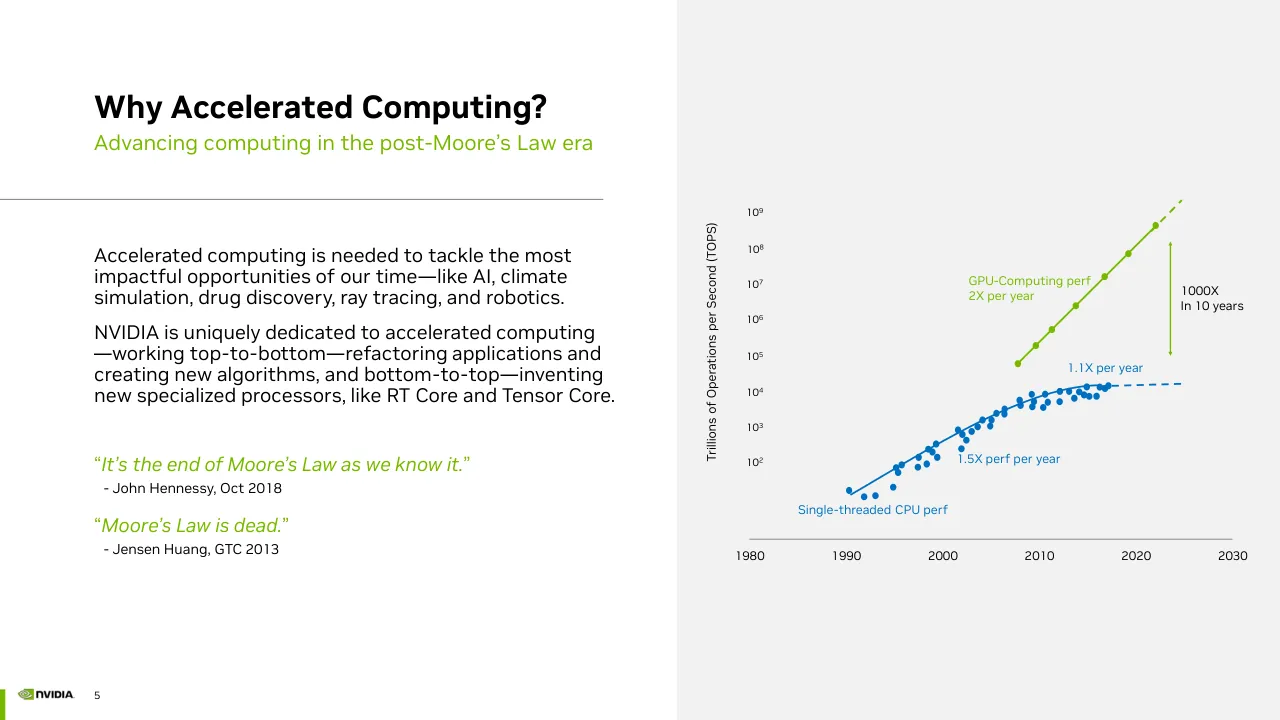
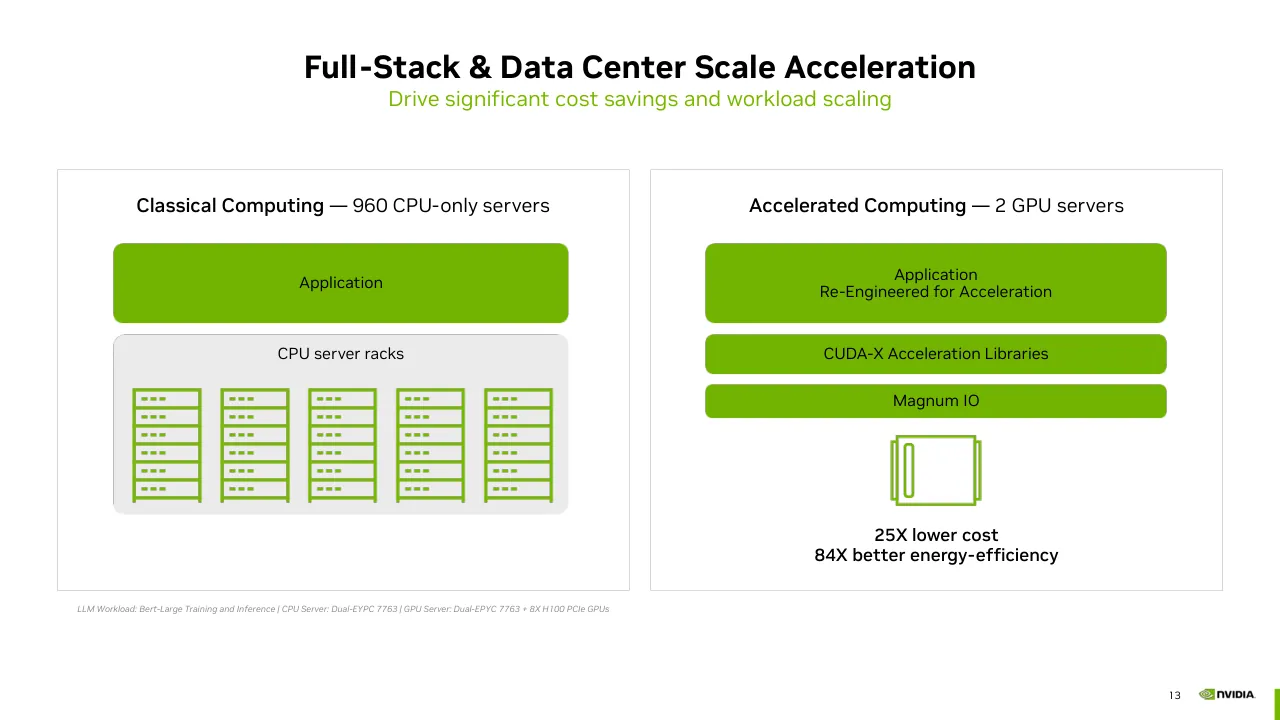
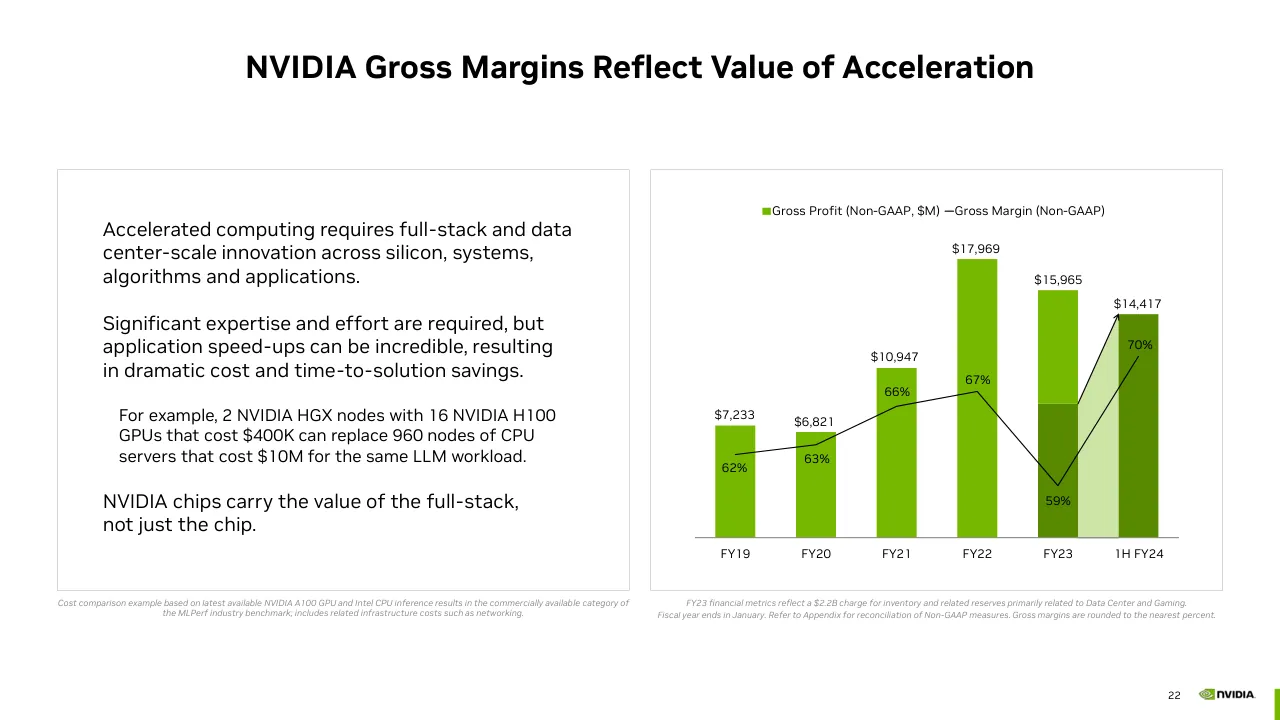
The deck opens with a forward-looking statements disclaimer and a short company overview covering NVIDIA's accelerated computing platform, its installed base and developer ecosystem. It then makes the case for accelerated computing as the answer to the end of Moore's law, moving through the waves of adoption (cloud, enterprise, autonomous machines, industrial digitalization), the generative AI opportunity, data center scale workloads and return on investment. Product and go-to-market sections follow, covering DGX Cloud, NVIDIA AI Enterprise, the Grace Hopper superchip and the one-year product rhythm. Financial sections then review revenue, gross and operating margins, cash flow and capital allocation by market platform (Data Center, Gaming, Professional Visualization, Automotive), and the deck closes with a summary slide, a roughly one trillion dollar market opportunity, and appendix reconciliations of non-GAAP to GAAP figures. Slides worth studying include the platform overview on slide 4, the Moore's law chart on slide 5, the cost comparison on slide 13 and the margin chart on slide 22, where charts and single-claim headlines carry the argument.
Slides worth studying
Questions about this deck
How many slides are in the NVIDIA investor presentation deck from October 2023?
The deck has 39 pages in total. Slide 1 is the title slide, reading NVIDIA Investor Presentation October 2023.
What does the NVIDIA investor presentation say about the size of the installed base and developer community?
On slide 3, NVIDIA says its platform is installed in several hundred million computers, is available in every cloud and from every server maker, powers 74% of the TOP500 supercomputers, and boasts over 4 million developers.
What does the NVIDIA investor presentation say about the data center infrastructure opportunity?
Slide 6 states that the trillion dollars of installed global data center infrastructure will transition to accelerated computing to achieve an order of magnitude better performance, energy-efficiency and cost. It also says AI is driving a platform shift from general purpose to accelerated computing.
How does NVIDIA AI Enterprise pricing work according to the NVIDIA deck?
Slide 19 lists consumption pricing per GPU-hour and subscription pricing per GPU/year, with the subscription included with H100 PCIe and DGX. The slide describes NVIDIA AI Enterprise as the operating system for enterprise AI.
Details
- Company: NVIDIA
- Year: 2023
- Type: Investor presentation
- Industry: Semiconductors
- Pages: 39
More from NVIDIA
- NVIDIA investor presentation, September 2026 NDR
- NVIDIA investor presentation, Annual Stockholder Meeting June 2026
- NVIDIA investor presentation, Q2 FY27 quarterly presentation
- NVIDIA keynote, GTC Europe 2026
- NVIDIA presentation, 2026
- NVIDIA keynote, GTC 2026 Keynote
All NVIDIA decks in the library
Review score: 6 out of 10, Needs substantial work
Presentation quality, judged with the SlideDeck Co review heuristic. Ask, evidence and idea merit are not rated here.
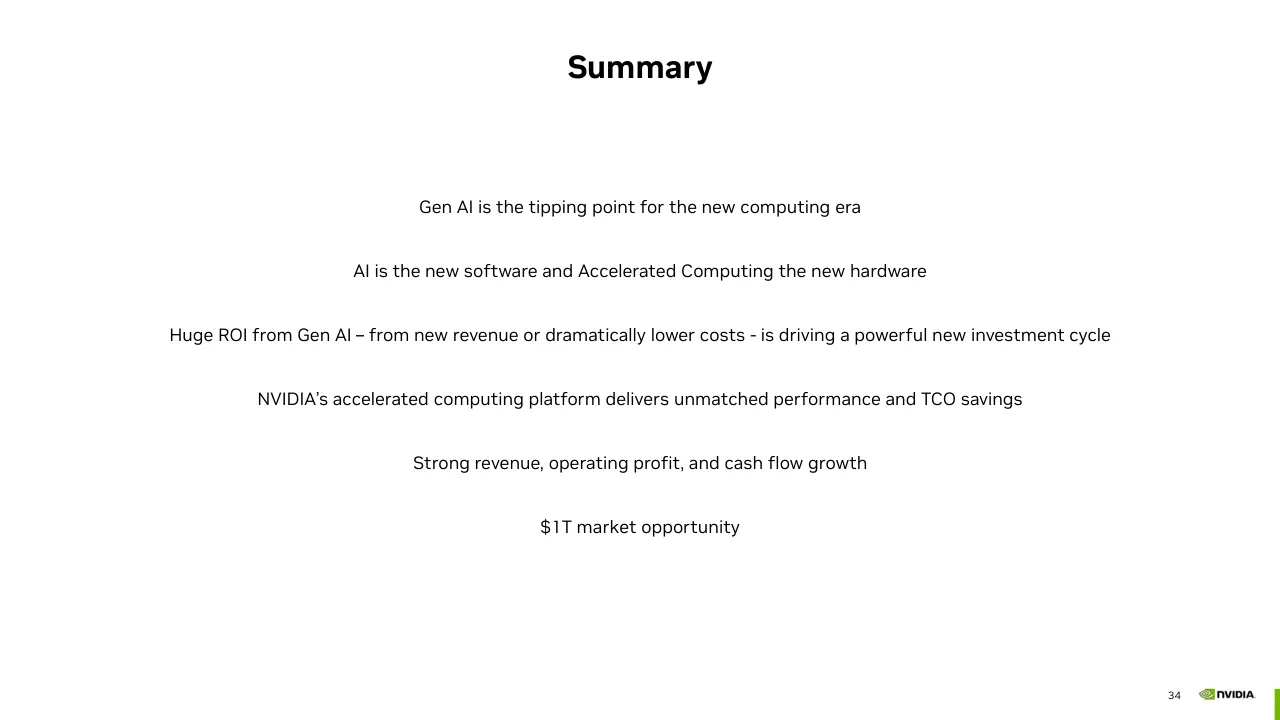
The deck has a clear route from why accelerated computing, to the generative AI opportunity, products, financials and a market size, and slides 5, 13 and 22 show real craft with a labelled log chart, a plain two-column comparison and a chart paired with a takeaway. Execution is uneven, though. Slides 6, 7 and 33 use a stair-step diagram whose labels are tiny and scattered, and slides 4, 14, 16, 18, 19 and 20 carry diagrams or logos at sizes an audience cannot read. Many headlines are topic labels rather than claims, and the summary on slide 34 is six small lines with no visual structure, so the case has to be recovered by the reader.
Worth keeping: Keep the log-scale chart with direct labels and the 1000X callout on slide 5, the 960 versus 2 server comparison on slide 13, and the consistent green identity and chart styling across the financial slides 21 to 32.
Most useful repair: Rebuild the stair-step graphics on slides 6, 7 and 33 with readable labels and sizes, and enlarge or cut the detail on slides 4, 14, 17, 19 and 20 so each diagram has one point that can be read.
What would change the score: I would replace topic headlines such as 'Gaming' and 'Data Center' with claim headlines, and make slide 34 a stronger closing page with the key figures visible.
Confidence medium. 39 of 39 pages inspected on contact sheets, 4 at readable size. Reviewed 2026-11-08. Model-assisted review (claude-sonnet-5-5).
Full text of the slides (39 slides)
Every slide's words and a description of its charts and images, so the deck can be searched and rebuilt. Also available as Markdown.
Slide 1
NVIDIA
Investor Presentation
October 2023
1
Visuals: Full-bleed abstract 3D illustration of stacked, rounded, glossy green layers curving in concentric arcs from the lower right toward the upper left, resembling the NVIDIA eye motif. The inner recesses are dark green shadows fading to near black at the centre-right; the outer layers are bright lime green (about #76B900 to #8CD000) with white specular highlights along their edges. Light fades to white at the upper left, where thin pale green lines radiate diagonally. Composition is cropped at the right and bottom edges. Logo: NVIDIA wordmark with the green eye emblem in #76B900 and the wordmark in black #000000 with registered mark.
Slide 2
Except for the historical information contained herein, certain matters in this presentation including, but not limited to, statements as to: our financial position; our markets, market opportunity, demand and
growth drivers; the benefits, impact, performance, features and availability of our products and technologies; the benefits, impact, features and timing of our collaborations or partnerships; NVIDIA accelerated
computing being broadly recognized as the way to advance computing as Moore’s law ends; data centers making a platform shift from general purpose to accelerated computing; trillion dollars of installed global
data center infrastructure transitioning to accelerated computing; AI driving a platform shift in computing and enabling new, never-before-possible applications; broader enterprises driving the next wave of
computing, followed by autonomous machines and industrial digitalization; accelerated computing being needed to tackle the most impactful opportunities of our time; NVIDIA’s value to every stakeholder in the
ecosystem; the ROI of high compute performance; enterprise as the next big generative AI opportunity; NVIDIA’s expanding accelerated computing ecosystem; AI as the greatest technology force of our time; data
centers becoming AI factories; generative AI unlocking new opportunities; the next wave of AI being robotics and industrial digitalization; NVIDIA’s acceleration stacks and ecosystems helping to bring AI to the
world’s largest industries; NVIDIA’s AI expertise and scale helping to revolutionize businesses; generative AI being the most important computing platform of our generation; full-stack and data center scale
acceleration driving significant cost savings and workload scaling; our dividend program plan; and our Automotive design win pipeline and ramp expectations are forward-looking statements.
These forward-looking statements and any other forward-looking statements that go beyond historical facts that are made in this presentation are subject to risks and uncertainties that may cause actual results
to differ materially. Important factors that could cause actual results to differ materially include: global economic conditions; our reliance on third parties to manufacture, assemble, package and test our products;
the impact of technological development and competition; development of new products and technologies or enhancements to our existing product and technologies; market acceptance of our products or our
partners' products; design, manufacturing or software defects; changes in consumer preferences and demands; changes in industry standards and interfaces; unexpected loss of performance of our products or
technologies when integrated into systems and other factors.
NVIDIA has based these forward-looking statements largely on its current expectations and projections about future events and trends that it believes may affect its financial condition, results of operations,
business strategy, short-term and long-term business operations and objectives, and financial needs. These forward-looking statements are subject to a number of risks and uncertainties, and you should not rely
upon the forward-looking statements as predictions of future events. The future events and trends discussed in this presentation may not occur and actual results could differ materially and adversely from those
anticipated or implied in the forward-looking statements. Although NVIDIA believes that the expectations reflected in the forward-looking statements are reasonable, the company cannot guarantee that future
results, levels of activity, performance, achievements or events and circumstances reflected in the forward-looking statements will occur. Except as required by law, NVIDIA disclaims any obligation to update these
forward-looking statements to reflect future events or circumstances. For a complete discussion of factors that could materially affect our financial results and operations, please refer to the reports we file from
time to time with the SEC, including our most recent Annual Report on Form 10-K, Quarterly Reports on Form 10-Q, and Current Reports on Form 8-K. Copies of reports we file with the SEC are posted on our
website and are available from NVIDIA without charge.
Many of the products and features described herein remain in various stages and will be offered on a when-and-if-available basis. The statements within are not intended to be, and should not be interpreted as a
commitment, promise, or legal obligation, and the development, release, and timing of any features or functionalities described for our products is subject to change and remains at the sole discretion of NVIDIA.
NVIDIA will have no liability for failure to deliver or delay in the delivery of any of the products, features or functions set forth herein.
NVIDIA uses certain non-GAAP measures in this presentation including non-GAAP gross profit, non-GAAP gross margin, non-GAAP operating income, non-GAAP operating margin, and free cash flow. NVIDIA
believes the presentation of its non-GAAP financial measures enhances investors' overall understanding of the company's historical financial performance. The presentation of the company's non-GAAP financial
measures is not meant to be considered in isolation or as a substitute for the company's financial results prepared in accordance with GAAP, and the company's non-GAAP measures may be different from non-
GAAP measures used by other companies. Further information relevant to the interpretation of non-GAAP financial measures, and reconciliations of these non-GAAP financial measures to the most comparable
GAAP measures, may be found in the slide titled “Reconciliation of Non-GAAP to GAAP Financial Measures”.
2
Visuals: Full-bleed photographic-style illustration of pale yellow-green to lime green light streaks sweeping diagonally across the lower and right part of the slide, behind all text. The streaks are soft, glowing white-to-lime curves, lightest near the upper left of the green area and most saturated at the bottom right. Not cropped. A small placed raster image (1829 by 630 px, appears to be the NVIDIA wordmark) sits at the bottom right corner, low contrast against the green and not clearly legible in the render.
Slide 3
Headquarters: Santa Clara, CA
NVIDIA pioneered accelerated computing to help solve impactful
challenges classical computers cannot. A quarter of a century in the
making, NVIDIA accelerated computing is broadly recognized as the
way to advance computing as Moore’s law ends and AI lifts off.
NVIDIA’s platform is installed in several hundred million computers,
is available in every cloud and from every server maker, powers 74%
of the TOP500 supercomputers, and boasts over 4 million developers.
3
NVIDIA
Visuals: One full-bleed photograph of the NVIDIA Santa Clara headquarters at golden hour. Subject: a large white-grey steel space-frame canopy with a triangular lattice roof, supported by tree-like columns, over a walkway and planters; behind it on the right is a dark glass-and-steel office building with a curved roof edge, and bare deciduous trees stand on the left and right. A low sun flares just left of centre behind the canopy, producing a bright starburst. In the foreground, a grey concrete retaining wall runs across the slide, with a strip of grass and ornamental grasses lit gold in front of it, and blurred moving cars on a road at the bottom. Composition: wide landscape framing, the canopy spanning the middle band from left edge to right of centre, the building cropped at the right edge, sky occupying the upper half. Lighting: warm low-angle sunlight with lens flare; sky is pale blue-grey fading to near white toward the horizon. Dominant colours: pale blue-grey sky, white steel, warm gold and ochre grass and light, dark charcoal glass and concrete. Not cropped except at the frame edges; full-bleed with no border and no tint or overlay on the photo itself. Also a small NVIDIA logo (green and black eye mark with NVIDIA wordmark) at bottom right, boxed by nothing, over the grass area.
Slide 4
NVIDIA’s Accelerated Computing Platform
Full-stack innovation across silicon, systems and software
AI APPLICATION FRAMEWORK
MODULUS
MONAI
RIVA
MAXINE
NEMO
MERLIN
CUOPT
MORPHEUS
TOKKIO
AVATAR
DRIVE
ISAAC
METROPOLIS
HOLOSCAN
PLATFORMS
NVIDIA HPC
NVIDIA AI
NVIDIA Omniverse
ACCELERATION LIBRARIES
cuNumeric CV-CUDA cuQuantum Parabricks Sionna Jetpack
RAPIDS Spark cuDNN cuGraph TensorRT Triton Deepstream Flare
DOCA Mag IO Aerial
CLOUD-TO-EDGE
DATACENTER-TO-ROBOTIC SYSTEMS
RTX DGX HGX EGX OVX Super POD AGX IGX
3-CHIPS
GPU CPU DPU
With nearly three decades of a singular focus, NVIDIA is expert at accelerating software and scaling compute by a Million-X, going well beyond Moore’s law.
Accelerated computing requires full-stack innovation – optimizing across every layer of computing – from silicon and systems to software and algorithms, demanding deep understanding of the problem domain.
Our full-stack platforms – NVIDIA HPC, NVIDIA AI, and NVIDIA Omniverse – accelerate high performance computing, AI, and industrial digitalization workloads.
We accelerate workloads at data center scale, across thousands of compute nodes, treating the network and storage as part of the computing fabric.
Our platform extends from the cloud and enterprise data centers to supercomputing centers, edge computing and PCs.
4
Visuals: Diagram. (1) AI application framework: 14 square tiles in one horizontal row, each about 4.0% wide and 7.1% high, spaced about 4.3% apart, each a small framework render with its name in white capitals at the bottom: MODULUS (colourful heat-map grid on dark navy), MONAI (dark green rendered sphere), RIVA (figure with a cyan glowing shape), MAXINE (video call window with a face), NEMO (blue droplet character with eyes), MERLIN (white and blue device rendering), CUOPT (street scene with a wheeled robot), MORPHEUS (dark hexagon grid with orange dots), TOKKIO (purple-haired digital human on dark background), AVATAR (digital human figure with raised hand), DRIVE (street view with a car on a road), ISAAC (white robotic arm on grey), METROPOLIS (red and dark city-scale rendering with coloured labels), HOLOSCAN (blue-brown dotted terrain rendering). (2) Three bright green #76B900 filled circles, each about 4.0% wide, with a white line icon: an atom-like orbit icon for NVIDIA HPC at left, a network-of-nodes icon for NVIDIA AI in the centre, and concentric swirl rings for NVIDIA Omniverse at right; each has its label to the right. Thin grey straight lines fan from the bottom edge of the framework tiles down to the three circles. (3) Acceleration libraries panel: a light grey rounded rectangle holding 17 pill-shaped light grey chips in three rows, row one with 6 chips (cuNumeric, CV-CUDA, cuQuantum, Parabricks, Sionna, Jetpack), row two with 8 chips (RAPIDS, Spark, cuDNN, cuGraph, TensorRT, Triton, Deepstream, Flare), row three with 3 centred chips (DOCA, Mag IO, Aerial). (4) Cloud-to-edge panel: a light grey rounded rectangle holding a row of 8 round-cornered grey chips (RTX, DGX, HGX, EGX, OVX, SuperPOD with the label on two lines, AGX, IGX). Thin grey lines run from the bottom of each chip down to three green circles below, each with a white line icon: a grid of squares for GPU at left, a four-square grid for CPU in the centre, and a dense dot matrix for DPU at right, labelled GPU, CPU and DPU beneath. (5) Small NVIDIA logo, green wordmark with eye symbol, bottom right.
Slide 5
Why Accelerated Computing?
Advancing computing in the post-Moore’s Law era
Accelerated computing is needed to tackle the most
impactful opportunities of our time—like AI, climate
simulation, drug discovery, ray tracing, and robotics.
NVIDIA is uniquely dedicated to accelerated computing
—working top-to-bottom—refactoring applications and
creating new algorithms, and bottom-to-top—inventing
new specialized processors, like RT Core and Tensor Core.
“It’s the end of Moore’s Law as we know it.”
- John Hennessy, Oct 2018
“Moore’s Law is dead.”
- Jensen Huang, GTC 2013
Trillions of Operations per Second (TOPS)
10^9
10^8
10^7
10^6
10^5
10^4
10^3
10^2
GPU-Computing perf
2X per year
1000X
In 10 years
1.1X per year
1.5X perf per year
Single-threaded CPU perf
1980
1990
2000
2010
2020
2030
5
5
Visuals: Chart: a scatter-and-line chart with a logarithmic vertical axis titled Trillions of Operations per Second (TOPS), with tick labels 10^2, 10^3, 10^4, 10^5, 10^6, 10^7, 10^8 and 10^9 (no units beyond TOPS printed). The horizontal axis shows years 1980, 1990, 2000, 2010, 2020 and 2030 with no axis title; the baseline is a thin grey line running from about 1980 to 2030. Series 1, GPU-Computing perf (green #76B900): a straight line with about 9 markers from about 2008 (about 10^5.2) to about 2022 (about 10^8.7), with a dashed continuation to about 2024 (about 10^9); labelled 2X per year. Series 2, Single-threaded CPU perf (blue #0070C0): about 60 scattered dots from about 1990 (about 10^2.2) to about 2017 (about 10^4.2), with a solid blue trend line rising from about 1990 to about 2017 and a flattening dashed blue continuation to about 2025 near 10^4.2; labelled 1.1X per year at the flattened end and 1.5X perf per year on the middle slope. Annotation: a vertical double-headed thin black arrow at about 2024 spanning about 10^5 to about 10^8, labelled 1000X / In 10 years. No legend. Highlighted points: none beyond the green end markers.
Slide 6
Waves of Adoption of Accelerated Computing
A generational computing platform shift
Industrial Digitalization
Autonomous Vehicles & Robotics
Enterprise
Cloud Service Providers & Consumer Internet
A new computing era has begun.
Accelerated computing enabled the rise of AI, which is driving a platform shift from general purpose to accelerated computing, and enabling new, never-before-possible applications.
The trillion dollars of installed global data center infrastructure will transition to accelerated computing to achieve an order of magnitude better performance, energy-efficiency and cost.
Hyperscale cloud service providers and consumer internet companies have been the early adopters of AI and accelerated computing, with broader enterprise adoption now under way.
AI and accelerated computing will also make possible the next big waves – autonomous machines and industrial digitalization.
6
Visuals: Diagram-like arrangement of four bold text labels with no drawn shapes or arrows: Industrial Digitalization (top), Autonomous Vehicles & Robotics, Enterprise, Cloud Service Providers & Consumer Internet (bottom-left). A small green wave-like icon (three curved strokes, approximately ≈ shape) sits at the lower-left near x 6.5%, y 90%. Bottom-right NVIDIA logo in green (#76B900) with black wordmark, and a thin vertical green bar at the far right edge. No photographs or charts.
Slide 7
NVIDIA Accelerated Computing for Every Wave / Industrial Digitalization / NVIDIA Omniverse is a software platform for designing, / building, and operating 3D and virtual world simulations. / It harnesses the power of NVIDIA graphics and AI technologies / and runs on NVIDIA-powered data centers and workstations. / Autonomous Vehicles / & Robotics / NVIDIA DRIVE is a full-stack platform for autonomous vehicles (AV) that / includes hardware for in-car compute, such as the Orin system-on-chip, / and the full AV and AI cockpit software stack. / Enterprise / NVIDIA DGX Cloud is a cloud service that allows enterprises immediate access to / the infrastructure and software needed to train advanced models for generative AI / and other groundbreaking applications. / NVIDIA AI Enterprise is the operating system of AI, with enterprise-grade security, stability, / manageability and support. It is available on all major CSPs and server OEMs and supports / enterprise deployment of AI in production. / Cloud Service Providers / & Consumer Internet / NVIDIA HGX is an AI supercomputing platform purpose-built for AI. It includes 8 NVIDIA GPUs, as well as / interconnect and networking technologies, delivering order-of-magnitude performance speed-ups for AI / over CPU servers. It is broadly available from all major server OEMs/ODMs. NVIDIA DGX, an AI server based / on the same architecture, along with NVIDIA AI software and support, is also available. / 7
Visuals: Three non-photographic graphics only, no charts, tables, or photographs. (1) A small green decorative squiggle icon at lower left, about 1.5 by 2 percent of the slide, roughly two stacked wavy strokes like the letter S pair, in #76B900 with thin stroke. (2) The NVIDIA wordmark logo at bottom right, black text 'NVIDIA' with the green-and-black eye symbol to its left, placed unboxed on the white background. (3) A vertical solid green bar at the far right edge of the bottom of the slide, #76B900, flush to the right edge and bottom, about 0.4 percent wide.
Slide 8
NVIDIA’s Accelerated Computing Ecosystem / The NVIDIA accelerated computing platform has / attracted the largest ecosystem of developers, / supporting a rapidly growing universe of / applications and industry innovation. / Developers can engage with NVIDIA through / CUDA – our parallel computing programming / model introduced in 2006 – or at higher layers / of the stack, including libraries, pre-trained AI / models, SDKs and other development tools. / 300 Libraries / 400 AI Models / 100 Updated in the Last Year / Developers / 1.8M / 4M / 2020 / 2023 / CUDA Downloads* / 20M / 45M / 2020 / 2023 / *Cumulative / AI Startups / 6K / 15K / 2020 / 2023 / GPU-Accelerated Applications / 700 / 3,200 / 2020 / 2023 / 8
Visuals: Four bubble-chart panels in a 2x2 grid, each a grey rounded-free rectangle with a light grey border, containing two green circles sized by value on a shared baseline with year labels beneath. Top-left panel: Developers; circles 1.8M (2020, small) and 4M (2023, large). Top-right panel: CUDA Downloads* (cumulative); circles 20M (2020) and 45M (2023). Bottom-left panel: AI Startups; circles 6K (2020, small) and 15K (2023, large). Bottom-right panel: GPU-Accelerated Applications; circles 700 (2020, smallest) and 3,200 (2023, largest). Each panel has a thin grey baseline across the lower part with years 2020 and 2023 beneath. Circle area is proportional to value. The NVIDIA eye logo with wordmark sits bottom right at about 93% x, 95% y.
Slide 9
NVIDIA’s Multi-Sided Platform and Flywheel
Scale
R&D $
Speed-Up
Installed Base
Developers
End-Users
Cloud & OEMs
The virtuous cycle of NVIDIA’s accelerated computing starts with / an installed base of several hundred million GPUs, all compatible / with the CUDA programming model.
• For developers – NVIDIA’s one architecture and large installed / base give developer’s software the best performance and / greatest reach
• For end users – NVIDIA is offered by virtually every computing / provider and accelerates the most impactful applications from / cloud to edge
• For cloud providers and OEMs – NVIDIA’s rich suite of / Acceleration Platforms lets partners build one offering to / address large markets including media & entertainment, / healthcare, transportation, energy, financial services, / manufacturing, retail, and more
• For NVIDIA – Deep engagement with developers, computing / providers, and customers in diverse industries enables / unmatched expertise, scale, and speed of innovation across / the entire accelerated computing stack – propelling the / flywheel
NVIDIA Accelerated Computing / Virtuous Cycle
9
Visuals: One diagram: a circular virtuous-cycle flywheel drawn with thin black (#000000, about 0.1 percent of slide height) curved arrows with small open arrowheads, no fills. Nodes are plain black text labels with no boxes: Scale (top centre, about x 23 y 27.5), R&D $ (below Scale, about x 23 y 34), Speed-Up (below R&D $, about x 22 y 40.6), Installed Base (left, about x 5 y 37.5), Developers (bottom left, about x 6 y 63), Cloud & OEMs (bottom right, about x 37 y 63), End-Users (bottom centre, about x 22 y 81). Connections: short straight downward arrows link Scale to R&D $ and R&D $ to Speed-Up. A curved arrow runs from Speed-Up down and left to Developers. A curved arrow runs from Installed Base down to Developers. A curved arrow runs from Developers down and right to End-Users. A curved arrow runs from End-Users up and right to Cloud & OEMs. A curved arrow runs from Cloud & OEMs up along the right side to Scale, with its arrowhead pointing left into Scale. A large outer arc runs from Cloud & OEMs up over the top of the diagram and down-left to Installed Base, with its arrowhead at Installed Base. The caption below the diagram is set in NVIDIASans Medium. The NVIDIA logo at bottom right is an icon with a green eye mark (#76B900) and a black NVIDIA wordmark, about 5.5 by 3.3 percent, unboxed, on the white background. No photographs.
Slide 10
Huge ROI from AI Driving a Powerful New Investment Cycle
AI can augment creativity and productivity by orders of magnitude across industries
Knowledge workers will use copilots based on large
language models to generate documents, answer
questions, or summarize missed meetings, emails
and chats – adding hours of productivity per week.
Copilots specialized for fields such as software
development, legal services or education can boost
productivity by as much as 50%.
Social media, search and e-commerce apps are
using deep recommenders to offer more relevant
content and ads to their customers, increasing
engagement and monetization.
Creators can generate stunning, photorealistic
images with a single text prompt – compressing
workflows that take days or weeks into minutes in
industries from advertising to game development.
Call center agents augmented with AI chatbots
can dramatically increase productivity and
customer satisfaction.
Drug discovery, financial services, agriculture and
food services and climate forecasting are seeing
order-of-magnitude workflow acceleration from AI.
Office AI Copilots
Over 1B knowledge workers
Search & Social Media
$700B in digital advertising annually
AI Content Creation
50M creators globally
Legal Services, Education …
1M legal professionals in the US
9M educators in the US
AI Software Development
30M software developers globally
Financial Services
678B annual credit card transactions
Customer Service with AI
15M call center agents globally
Drug Discovery
10¹⁸ molecules in chemical space
40 exabytes of genome data
Agri-Food | Climate
1B people in agri-food worldwide
Earth-2 for km-scale simulation
10
Source: Goldman Sachs, Cowen, Statista, Capital One, Wall Street Journal, Resource Watch, NVIDIA internal analysis
Visuals: Nine photographic or illustrative tiles arranged in a 3x3 grid, each boxed as a flat rectangle with square corners and no border. Row 1: (a) Office AI Copilots, a dark screenshot of the Windows Start menu showing an app list on the left (Media Player, Microsoft Edge, Microsoft Endpoint Manager, Microsoft Intune Management Ext..., Microsoft Office Tools expanded with Database Compare, Office Language Preferences, Spreadsheet Compare, Telemetry Log for Office) and tiles on the right (Microsoft Edge, Maps, Weather, Play and explore, Xbox Console, Movies & TV) in grey and charcoal. (b) Search & Social Media, a close photograph of a person's hands holding a black tablet showing a shopping website with a pink banner and product images of shoes, warm natural light, shallow depth of field. (c) AI Content Creation, a photograph of a dark car drawn with a wireframe sketch overlay on a desert dusk landscape with orange and grey tones, plus a small white inset card reading 'A beautiful desert sky late in the evening.' and a small desert thumbnail at its upper right. Row 2: (d) Legal Services, Education, a bright classroom or office photograph with a presenter standing at left by a wall screen showing green slides, and seated people with laptops at tables in the foreground, white walls, cool daylight. (e) AI Software Development, a flat dark charcoal #2F2F2F panel with a line diagram of two stacked-block server icons, one on the left and one on the right, grey rectangles inside them, joined by a connecting line with small circular nodes below. (f) Financial Services, a dark photograph of stock market screens with red and green numbers and tickers over glowing green upward arrows. Row 3: (g) Customer Service with AI, a photograph of a woman wearing a headset looking at a wall-mounted monitor displaying three panels of interface windows with green buttons, cool grey tones. (h) Drug Discovery, a dark grid of chemical structure diagrams (molecular skeletons with coloured atoms) on black, some cells dimmed. (i) Agri-Food | Climate, a close photograph of young green maize seedlings in brown soil with a fine water spray and a red-and-grey device at the top, warm earth tones. Also an NVIDIA logo in green at bottom right and a thin vertical green bar at the far right edge.
Slide 11
Generative AI / The most important computing platform of our generation / The era of generative AI has arrived, / unlocking new opportunities for AI across / many different applications. / Generative AI is trained on large amounts / of data to find patterns and relationships, / learning the representation of almost / anything with structure. / It can then be prompted to generate text, / images, video, code, or even proteins. / For the very first time, computers can / augment the human ability to generate / information and create. / 1,600+ Generative AI companies are / building on NVIDIA. / TEXT / AUDIO / IMAGE / 3D / VIDEO / DNA / PROTEIN / MOLECULE / ANIMATION / ANIMATION / MOLECULE / PROTEIN / DNA / VIDEO / 3D / IMAGE / AUDIO / TEXT / 11
Visuals: Diagram: a symmetrical flow. Ten-row left column of thumbnails (TEXT, AUDIO, IMAGE, 3D, VIDEO, DNA, PROTEIN, MOLECULE, ANIMATION, top to bottom) and a mirrored right column (ANIMATION, MOLECULE, PROTEIN, DNA, VIDEO, 3D, IMAGE, AUDIO, TEXT, top to bottom). Each thumbnail is a small landscape rectangle, about 5 percent of slide width, with a thin grey-blue border. Thin grey curved lines run from each left thumbnail to a single convergence point at about x 41 y 52 on the left side of a central icon, and from the same point to each right thumbnail. Left thumbnails: TEXT shows a white card with a green ChatGPT-style logo and the text 'Quantum co' / 'mechanics to' cut off at the right edge; AUDIO shows a black field with a bright green audio waveform; IMAGE shows a red, green and blue macaw parrot on a pale blue background; 3D shows a black-background wireframe colosseum model with green glow; VIDEO shows a purple jellyfish on a dark blue background; DNA shows a green double helix on black; PROTEIN shows pink and yellow ribbon protein structure on black; MOLECULE shows a grey and green ball-and-stick molecule on dark blue; ANIMATION shows a cartoon girl at a desk with glowing green and yellow screens, warm tones. Right thumbnails repeat the same images in mirrored order. Central icon: two grey-blue (#6B7394) stacked-block neural network symbols, an upper row of vertical bars, trapezoid encoder and decoder shapes, and a lower row of stacked rectangles connected by a grey elbow line with small circle nodes at the bottom. Lighting is flat and the thumbnails are not cropped.
Slide 12
Modern AI is a Data Center Scale Computing Workload
Data centers are becoming AI factories: Data as input, intelligence as output
Before Transformers = 8x / 2yrs
Transformers = 215x / 2yrs
10 10 9 10 8 10 7 10 6 10 5 10 4 10 3 10 2
Training Compute (petaFLOPs)
PaLM
MT NLG 530B
Chinchilla
BLOOM
GPT-3
Microsoft T-NLG
GPT-2
Megatron-NLG
XLNet
Wav2Vec 2.0
MoCo ResNet50
Xception
BERT Large
InceptionV3
GPT-1
Seq2Seq Resnet
Transformer
ResNeXt
VGG-19
ELMo
DenseNet201
AlexNet
2011 2012 2013 2014 2015 2016 2017 2018 2019 2020 2021 2022 2023
AI Training Computational Requirements
Fueling Giant-Scale AI Infrastructure
NVIDIA compute & networking GPU | DPU | CPU
Large Language Models, based on the Transformer architecture,
are one of today’s most important advanced AI technologies,
involving up to trillions of parameters that learn from text.
Developing them is an expensive, time-consuming process that
demands deep technical expertise, distributed data center-scale
infrastructure, and a full-stack accelerated computing approach.
12
Visuals: Chart (left panel): log-scale scatter chart with two straight trend lines, titled AI Training Computational Requirements. Y axis: 'Training Compute (petaFLOPs)', logarithmic from 10^2 at bottom to 10^10 at top, decade gridlines labelled 10^2, 10^3, 10^4, 10^5, 10^6, 10^7, 10^8, 10^9, 10^10. X axis: years 2011 to 2023 labelled at integer years, no unit, axis line dark grey. Series 1 (blue #4472C4 dots and straight line): labelled points about AlexNet 2012 near 10^2.6, Seq2Seq and Resnet about 2014 near 10^4.2, VGG-19 about 2014 near 10^4.1, ResNeXt about 2016.4 near 10^4.1, DenseNet201 about 2016.4 near 10^3.4, Xception about 2015.5 near 10^5.7, InceptionV3 about 2015.4 near 10^5.2, ELMo about 2017.9 near 10^3.6, MoCo ResNet50 about 2019.6 near 10^6.0, Wav2Vec 2.0 about 2019.7 near 10^6.2; blue line runs from about 2011.6 at 10^2.6 to about 2019.8 at 10^6.1. Series 2 (green #70AD47 dots and straight line): Transformer about 2017.5 near 10^4.4, GPT-1 about 2018.0 near 10^5.0, BERT Large about 2018.4 near 10^5.6, XLNet about 2018.9 near 10^6.6, Megatron-NLG about 2019.0 near 10^7.0, GPT-2 about 2018.9 near 10^7.2, Microsoft T-NLG about 2019.9 near 10^7.5, GPT-3 about 2020.0 near 10^8.8, BLOOM about 2022.3 near 10^8.9, Chinchilla about 2022.3 near 10^9.0, MT NLG 530B about 2021.4 near 10^9.1, PaLM about 2021.8 near 10^9.5; green line runs from about 2017.5 at 10^4.4 to about 2021.8 at 10^9.5. Values are estimates read from the plot positions, not printed on the slide. Legend: none; instead two coloured annotation lines at top left: blue text Before Transformers = 8x / 2yrs and green text Transformers = 215x / 2yrs. Highlighted points: none. Right panel: photograph of a dark data centre hall (see elements).
Slide 13
Full-Stack & Data Center Scale Acceleration
Drive significant cost savings and workload scaling
Classical Computing — 960 CPU-only servers
Application
CPU server racks
Accelerated Computing — 2 GPU servers
Application
Re-Engineered for Acceleration
CUDA-X Acceleration Libraries
Magnum IO
25X lower cost
84X better energy-efficiency
LLM Workload: Bert-Large Training and Inference | CPU Server: Dual-EYPC 7763 | GPU Server: Dual-EPYC 7763 + 8X H100 PCIe GPUs
13
Visuals: Two-panel comparison diagram built from rectangles and icons. Left panel: a full-width green rounded rectangle labelled 'Application' stacked above a light grey rounded rectangle labelled 'CPU server racks' that contains five identical line-art server rack icons in a row, each drawn in green #76B900 outline with small dash marks on each shelf. Right panel: three stacked green rounded rectangles labelled 'Application / Re-Engineered for Acceleration', 'CUDA-X Acceleration Libraries' and 'Magnum IO', followed by one green outline icon of a GPU card centred below them, and below the icon the bold text '25X lower cost' and '84X better energy-efficiency'. No chart, table or photograph. Connections: none; the stacks are vertical with no arrows.
Slide 14
The High ROI of High Compute Performance
4-Year Rental Opportunity
@$4 per GPU-HR
~$2.5B
4-Year Cost of AI Infrastructure
~$1B
16K GPU
DC Facility Build
& Operate
GPU Compute
Networking
15% Utilization
Increase Worth
$350M+
25%
Performance
Increase Worth
$600M+
14
Rental (white, hidden)
Cost (white, hidden)
Visuals: Two pie charts linked by a translucent connector wedge. Left pie titled 4-Year Cost of AI Infrastructure, ~$1B, with the subtitle 16K GPU above it: a circle cut vertically so only the right half is a full slice set; slices are DC Facility Build and Operate (light grey #CDCDCD, about 50 percent, left half), GPU Compute (green #76B900, about 40 percent, upper right), and Networking (teal #008564, about 10 percent, lower right). Right pie titled 4-Year Rental Opportunity, @$4 per GPU-HR, ~$2.5B, a full circle with slices 25 percent Performance Increase Worth $600M+ (light grey #B8B8B8, lower right quarter), 15% Utilization Increase Worth $350M+ (dark grey #8C8C8C, lower left about 15 percent), and the large remaining blue #0071C5 slice (about 60 percent, upper and left) with no printed value. Two curved double-headed black arrows, one on the blue slice upper right near the boundary with the light grey slice and one at the lower left boundary between blue and dark grey. Thin black leader lines with small filled black dots end at each slice label. Connector: a faint light grey #CDCDCD translucent area with dashed hairline edges runs from the top of the left pie's green/grey boundary to the top-left of the blue slice and from the bottom of the left pie to the bottom of the dark grey slice. No legend; labels sit beside the slices.
Slide 15
NVIDIA Go-to-Market Across Cloud and On-Premises / Reaching customers everywhere / CLOUD / ON-PREM / DGX Cloud / Google Cloud / Microsoft Azure / ORACLE CLOUD Infrastructure / NVIDIA AI Foundations / DGX / PARTNERS / aws / Google Cloud / Microsoft Azure / ORACLE CLOUD Infrastructure / DELL Technologies / Hewlett Packard Enterprise / Lenovo / HGX / INFERENCE / MGX / AGX / IGX / 15
Visuals: Two rectangular diagrams-in-panels, no charts. Left CLOUD panel contains: a black-outlined cloud icon labelled DGX Cloud with the logos Google Cloud, Microsoft Azure and ORACLE CLOUD Infrastructure inside it, captioned NVIDIA AI Foundations; a row of four partner logos (aws, Google Cloud, Microsoft Azure, ORACLE CLOUD Infrastructure); and two black line icons labelled HGX (a rack server unit with vents and horizontal slots) and INFERENCE (a stacked tapered cone of layered slabs with a vertical grid edge). Right ON-PREM panel contains: a black line icon of a DGX box labelled DGX; a row of three partner logos (DELL Technologies, Hewlett Packard Enterprise, Lenovo); and three black line icons labelled MGX (a flat rectangle with rounded inner slot), AGX (a rounded-corner square module with a small circle at bottom right) and IGX (a rectangle filled with diagonal hatching). Icons are monochrome black outline drawings with no shading.
Slide 16
Training & Inference — One Architecture
Cloud | On-Prem | Edge
TRAINING
NVIDIA DGX | HGX H100
NVIDIA L40S
INFERENCE
IN THE DATA CENTER
NVIDIA L40
Image Generation
NVIDIA L4
AI Video
NVIDIA H100 | L40S
Universal GPUs
NVIDIA Grace Hopper
RecSys, Gen AI
AT THE EDGE
IGX
Industrial-Grade System
for Healthcare, Logistics,
Manufacturing
AGX
Functionally-Safe System
for Autonomous Vehicles
16
Visuals: Left: a photograph of NVIDIA DGX H100 server racks, full colour rectangle, not cropped, boxed with hard edges. Subject: about nine tall black server racks in a row receding in perspective, the front racks with beige-gold panels, the rightmost racks darker with mesh vents. Composition: landscape, slightly low three-quarter view, racks fill the lower two-thirds of the frame over a glossy black reflective floor. Lighting: studio spotlight on the racks against a black backdrop. Dominant colours: black, charcoal and tan/gold. White label text overlaid at the top centre of the photo. Centre: a line illustration of two circular arrows, one arc over the top with arrowhead at lower left and one arc below with arrowhead at upper right, in dark grey #4D4D4D, about 2px stroke, enclosing a diagram of two server-like stacks: a smaller rectangular outline at left (stacked horizontal bars with two small circles and a dial symbol at its base) and a taller rectangular outline at right (stacked horizontal bars with two circles and dial symbols at its base), joined by an orthogonal line that runs from the top of the left stack, across and down to the middle of the right stack. Right: two light grey panels (#EBEBEB) with no border and square corners, each containing centred black text; no icons or logos inside them.
Slide 17
NVIDIA AI Enterprise / Enterprise is the Next Big Generative AI Opportunity / NVIDIA / AI / Playground / DGX Cloud / Microsoft Azure / Google Cloud / ORACLE CLOUD Infrastructure / Enterprise On-Prem / DELL / Hewlett Packard Enterprise / Lenovo / vmware / AI Chatbot / “RAG” / Vector DB / Cloud AI / APIs / NVIDIA / AI / Foundations / NVIDIA / AI / Enterprise / LLM Model / Container / Enterprise SaaS / & AI Platforms / Adobe / databricks / gettyimages / Hugging Face / servicenow / snowflake / WPP / DGX Cloud / Microsoft Azure / Google Cloud / ORACLE CLOUD Infrastructure / Cloud AI / APIs / 17 / Enterprise AI Chatbots are built as Retrieval Augmented Generation (RAG) workflows, which augment the knowledge in the / LLM with vectorized Enterprise data. These Chatbots serve as apprentices, improving the productivity of every employee in / every Enterprise company. / NVIDIA delivers this capability to Enterprises by packaging LLMs with NVIDIA AI Enterprise, the runtime for hosting the / LLMs, into containers that can be deployed anywhere – on any cloud, on premises, or within Enterprise SaaS applications.
Visuals: Diagram. Shapes and connections: (1) NVIDIA AI Playground rounded light grey box, with a two-way grey arrow down to (2) NVIDIA AI Foundations rounded light grey box, which has a two-way grey arrow down to (3) a DGX Cloud cloud outline at bottom left, containing Microsoft Azure, Google Cloud and ORACLE CLOUD Infrastructure logos. (2) has a green arrow pointing right to (4) a dashed grey rounded rectangle labelled LLM Model Container, containing a neural-network icon (nodes and edges, black line art) above a solid green box labelled NVIDIA AI Enterprise. A green arrow runs right from the container to a vertical green bus line at about x 42.5% of slide width, from about y 30% to 64%, with green arrowheads pointing right into three targets: (5) a DGX Cloud cloud outline at top with Microsoft Azure, Google Cloud and ORACLE CLOUD Infrastructure logos; (6) the middle label Enterprise On-Prem with DELL, Hewlett Packard Enterprise, Lenovo and vmware logos in a 2 by 2 grid; (7) the label Enterprise SaaS and AI Platforms with Adobe, databricks, gettyimages, Hugging Face, servicenow, snowflake and WPP logos. Grey double-headed arrows join the top DGX Cloud and Enterprise On-Prem and Enterprise SaaS targets to the AI Chatbot box: the top one is an elbow arrow, the middle one a straight horizontal double arrow, and the bottom one an elbow arrow. The AI Chatbot 'RAG' box (light grey rounded rectangle) has a grey double arrow above it to a black line-art person icon (head circle and trapezoid body, no fill), a grey double arrow below it to a black line-art database cylinder icon labelled Vector DB, and a horizontal grey double arrow to the right to a Cloud AI APIs cloud outline. Logos are shown in their own colours: Microsoft Azure four-colour squares, Google Cloud grey wordmark, ORACLE CLOUD red and grey, DELL blue, Hewlett Packard Enterprise green-outline mark with dark grey text, Lenovo red box with white text, vmware grey wordmark, Adobe red, databricks red and grey, gettyimages black, Hugging Face yellow emoji with dark text, servicenow dark grey, snowflake blue, WPP grey-lilac wordmark. NVIDIA logo bottom right in green and black.
Slide 18
NVIDIA DGX Cloud / AI-training-as-a-service platform for the era of generative AI / NVIDIA AI FOUNDATIONS / NeMo | Picasso / DGX CLOUD / NVIDIA DGX Cloud is a cloud service that allows enterprises immediate access to the infrastructure and software needed to train advanced models for generative AI and other groundbreaking applications. / DGX Cloud provides dedicated clusters of NVIDIA DGX AI supercomputing, paired with NVIDIA AI software. / Enterprise customers can also use the NVIDIA AI Foundations model making service, which includes NVIDIA NeMo for training custom LLMs and NVIDIA Picasso for custom generative AI models for visual design. / The service is equipped with models, tools, and accelerated computing for training, customizing, optimizing, and deploying AI. / 18
Visuals: Three stacked rectangular panels in light grey #F2F2F2 with hairline edges, forming a layered stack diagram. Top panel: text label NVIDIA AI FOUNDATIONS with subline NeMo | Picasso, centred. Middle panel: green outline cloud icon (#76B900, line stroke, no fill) above the label DGX CLOUD, centred. Bottom panel: three cloud provider logos in a row, centred: Microsoft Azure (four-square Microsoft mark in red #F25022, green #7FBA00, blue #00A4EF and yellow #FFB900, followed by grey #737373 wordmark Microsoft over Azure), Google Cloud (multicolour wordmark in blue, red, yellow and green, with the word Cloud in grey), and ORACLE CLOUD Infrastructure (red #C74634 stacked wordmark with Infrastructure beneath). Small NVIDIA logo at bottom right in green #76B900 with black wordmark. No photographs or charts.
Slide 19
NVIDIA AI Enterprise
The operating system for enterprise AI
NVIDIA AI Enterprise
NVIDIA AI Enterprise is software for deploying and running AI with enterprise-grade security, API stability, manageability and support.
Cloud-native and available in every major cloud marketplace — AWS, Microsoft Azure, Google Cloud Platform and Oracle Cloud.
Certified to run on servers and workstations from all major OEMs.
AI Use Cases and Workflows
LLM
Speech AI
Recommenders
Cybersecurity
Medical Imaging
Video Analytics
Route Optimization
More
Run Anywhere
NVIDIA AI Enterprise
Cloud
Azure | GCP | OCI | AWS
NVIDIA Certified Server
Dell | HPE | Lenovo
Consumption pricing
per GPU-hour
Subscription pricing
per GPU/year
(included with H100 PCIe/DGX)
19
Visuals: Left panel: a grid of eight outline icons in NVIDIA green (#76B900) in two rows of four. Row 1: LLM (a waveform above the word 'Hello' with a downward arrow), Speech AI (a waveform square linked by arrows to a molecule-like atom square), Recommenders (a pair of pants, a shirt and a sock linked by arrows), Cybersecurity (a shield with an atom-like node network). Row 2: Medical Imaging (a rectangular scan frame with a spine-like graphic and a small device), Video Analytics (a human figure in a bounding-box frame), Route Optimization (a map sheet with a location pin), and a 'More' cell with three black ellipsis dots. Right panel: a dark grey-to-silver metallic sphere (about #4A4F57 with lighter highlights) containing a white-blue network of nodes, labelled NVIDIA AI Enterprise to its right; a black 1px line runs down from the sphere bottom to a horizontal bracket line with two short downward ticks, feeding a green outline cloud icon labelled 'Cloud' (#76B900 outline, no fill) and a green outline server-box icon (rectangle with inner rounded rectangle and side brackets, #76B900 outline). No photographs. The NVIDIA logo (green and black) sits bottom-right.
Slide 20
NVIDIA AI Enterprise / Broad and deep ecosystem and distribution to reach every enterprise / GSI & Service Delivery / accenture / Booz | Allen | Hamilton / Capgemini / Deloitte. / Infosys / TCS TATA CONSULTANCY SERVICES / wipro / AI Platforms / databricks / Hugging Face / snowflake / Software Platforms / gettyimages / servicenow / shutterstock / Adobe / WPP / Public Cloud Marketplaces / aws / Google Cloud / ORACLE Cloud Infrastructure / Microsoft Azure / Private Cloud / vmware / Server OEMs / BOXX / CISCO / DELL Technologies / HPE GreenLake / hp / Lenovo / SUPERMICRO / 20
Visuals: Six white line-art icons on the green band, left to right: (1) a hospital/medical scanner: a patient table with a bed and a tall medical scanner unit with a plus sign; (2) a factory building with two smokestacks and a sawtooth roof; (3) a telecom tower with radiating signal arcs; (4) an industrial robotic arm on a base; (5) a server rack/data-centre cabinet with stacked units; (6) an outline of a car. Logos are white on dark grey panels: GSI column accenture, Booz Allen Hamilton, Capgemini, Deloitte., Infosys, TCS (Tata Consultancy Services), wipro; AI Platforms databricks, Hugging Face (emoji logo plus wordmark), snowflake; Software Platforms gettyimages, servicenow, shutterstock, Adobe, WPP; Public Cloud aws, Google Cloud, Oracle Cloud Infrastructure, Microsoft Azure; Private Cloud vmware; Server OEMs BOXX, Cisco, Dell Technologies, HPE GreenLake, HP, Lenovo, Supermicro. No charts, photographs or tables.
Slide 21
Driving Strong & Profitable Growth / Revenue ($M) / $26,914 / $26,974 / $11,716 / $10,918 / $16,675 / $20,699 / FY19 / FY20 / FY21 / FY22 / FY23 / 1H FY24 / Operating Income (Non-GAAP, $M) / Operating Margin (Non-GAAP) / $15,000 / $12,000 / $9,000 / $6,000 / $3,000 / $0 / 70% / 60% / 50% / 40% / 30% / $12,690 / $10,828 / $9,040 / $6,803 / $4,407 / $3,735 / 52% / 47% / 41% / 38% / 34% / 34% / FY19 / FY20 / FY21 / FY22 / FY23 / 1H FY24 / 1H FY21 / 1H FY24 / 43 / 42 / 7 / 4 / 4 / 3 / 3 / 1 / 23 / 70 / Gaming / Data Center / ProViz / Auto / OEM & Other / Fiscal year ends in January. Refer to Appendix for reconciliation of Non-GAAP measures. Operating margins rounded to the nearest percent. / FY23 financial metrics reflect a $2.2B charge for inventory and related reserves primarily related to Data Center and Gaming. / 21
Visuals: Three charts. (1) Column chart titled 'Revenue ($M)' with six columns, no visible axes or gridlines; value labels above each column: FY19 $11,716; FY20 $10,918; FY21 $16,675; FY22 $26,914; FY23 $26,974; 1H FY24 $20,699. FY23 column is two-tone: bottom segment dark green #598B00 up to about 60% of its height, top segment bright green #76B900; a pale green #CDE5A0 wedge with a black arrow rises from the FY23 column to the 1H FY24 column, which is dark green #598B00. Columns are plain flat bars, bright green #76B900, bottom-aligned on a thin grey baseline. (2) Combo chart with legend at top: green square 'Operating Income (Non-GAAP, $M)' and black line 'Operating Margin (Non-GAAP)'. Left axis $0 to $15,000 in $3,000 steps (USD millions); right axis 30% to 70% in 10% steps. Columns with labels: FY19 $4,407; FY20 $3,735; FY21 $6,803; FY22 $12,690; FY23 $9,040; 1H FY24 $10,828. Margin line with point labels: FY19 38%; FY20 34%; FY21 41%; FY22 47%; FY23 34%; 1H FY24 52%; the line is black, thin, with a black arrow from the FY23 column top to the 1H FY24 column top. Columns are bright green #76B900 with the FY23 and 1H FY24 segments shaded darker #598B00 and pale #CDE5A0. (3) Two donut charts side by side, titled '1H FY21' and '1H FY24', with a shared legend at right: Gaming (bright green #76B900), Data Center (teal #008564), ProViz (purple), Auto (blue), OEM & Other (magenta). 1H FY21 values: Gaming 43, Data Center 42, ProViz 7, Auto 4, OEM & Other 4 (white labels on segments). 1H FY24 values: Gaming 23, Data Center 70, ProViz 3, Auto 3, OEM & Other 1 (white labels). Donut holes are white, segments flat with no outline.
Slide 22
NVIDIA Gross Margins Reflect Value of Acceleration / Accelerated computing requires full-stack and data / center-scale innovation across silicon, systems, / algorithms and applications. / Significant expertise and effort are required, but / application speed-ups can be incredible, resulting / in dramatic cost and time-to-solution savings. / For example, 2 NVIDIA HGX nodes with 16 NVIDIA H100 / GPUs that cost $400K can replace 960 nodes of CPU / servers that cost $10M for the same LLM workload. / NVIDIA chips carry the value of the full-stack, / not just the chip. / Gross Profit (Non-GAAP, $M) Gross Margin (Non-GAAP) / $17,969 / $15,965 / $14,417 / $10,947 / 70% / 67% / 66% / $7,233 / $6,821 / 63% / 62% / 59% / FY19 / FY20 / FY21 / FY22 / FY23 / 1H FY24 / 22 / Cost comparison example based on latest available NVIDIA A100 GPU and Intel CPU inference results in the commercially available category of the MLPerf industry benchmark; includes related infrastructure costs such as networking. / FY23 financial metrics reflect a $2.2B charge for inventory and related reserves primarily related to Data Center and Gaming. / Fiscal year ends in January. Refer to Appendix for reconciliation of Non-GAAP measures. Gross margins are rounded to the nearest percent.
Visuals: Chart on the right panel: a combined bar and line chart. Legend across the top of the panel: a small green square followed by 'Gross Profit (Non-GAAP, $M)', then a black line marker followed by 'Gross Margin (Non-GAAP)'. Bars (gross profit, $M, no printed axis values visible because the axis labels are white on white): FY19 $7,233 in #76B900; FY20 $6,821 in #76B900; FY21 $10,947 in #76B900; FY22 $17,969 in #76B900; FY23 $15,965 drawn as two stacked segments, a dark green #598B00 lower section up to about 59 percent height and a bright green #76B900 upper section; 1H FY24 $14,417 in dark green #598B00. Between the FY23 and 1H FY24 bars a pale green #CFE8A0 wedge with a black arrow runs from the top of FY23 to the top of 1H FY24. Margin line (black, thin, about 1 px, with no markers) with printed labels: FY19 62%, FY20 63%, FY21 66%, FY22 67%, FY23 59%, 1H FY24 70%. Category axis labels beneath the baseline: FY19, FY20, FY21, FY22, FY23, 1H FY24. A thin grey horizontal baseline runs under the bars. Hidden white axis labels (invisible on the white background): $0, $6,000, $12,000, $18,000 on the left scale and 55%, 60%, 65%, 70%, 75%, 80% on the right scale. A white '80%' label sits at the top right, outside the visible area. No gridlines. Left panel: text only, no images or illustrations.
Slide 23
Strong Cash Flow Generation
Free Cash Flow (Non-GAAP)
$8.7B
$8.0B
$4.7B
$4.3B
$3.8B
$3.1B
FY19
FY20
FY21
FY22
FY23
1H FY24
Capital Allocation
Share Repurchase
$10B repurchased in FY23
Additional $25B in stock repurchases authorized,
adding to $4B which remained as of end of Q2
Dividend
$398M in FY 2023
Plan to Maintain1
Strategic Investments
Growing Our Talent
Platform Reach & Ecosystem
Fiscal year ends in January. Refer to Appendix for reconciliation of Non-GAAP measures.
1 Subject to continuing determination by our Board of Directors.
23
Visuals: Bar chart titled Free Cash Flow (Non-GAAP), vertical bars, no y-axis, no numeric axis scale or units printed beyond the $ values, horizontal baseline in grey about #8C8C8C running from about 7.9 to 45.8 percent of width at about 74.7 percent of height. Categories left to right: FY19 $3.1B (bar about #76B900), FY20 $4.3B (about #76B900), FY21 $4.7B (about #76B900), FY22 $8.0B (about #76B900), FY23 $3.8B (stacked: upper segment about #76B900 and lower segment about #598B00, the lower segment reaching the baseline), 1H FY24 $8.7B (bar about #598B00, dark olive green). Between the FY23 bar and the 1H FY24 bar is a pale green wedge about #CDE6A0 that tapers from the top of the dark FY23 segment up to the top of the 1H FY24 bar. A thin black arrow runs from the top of the dark FY23 segment diagonally up to the top of the 1H FY24 bar, with its arrowhead at the top of that bar. No legend. Values are printed for every bar, so no estimates. Right panel contains no chart, only centred text. Logo: NVIDIA wordmark with stylised green eye mark, green about #76B900 and black about #000000.
Slide 24
Our Market Platforms at a Glance
Data Center
56% of FY23 revenue
FY23 Revenue $15.0B
5-yr CAGR 51%
DGX/HGX/MGX/IGX systems
GPU | CPU | DPU | Networking
NVIDIA AI software
Gaming
33% of FY23 revenue
FY23 Revenue $9.1B
5-yr CAGR 10%
GeForce GPUs for PC gaming
GeForce NOW cloud gaming
Professional Visualization
6% of FY23 revenue
FY23 Revenue $1.5B
5-yr CAGR 11%
NVIDIA RTX GPUs
for workstations
Omniverse software
Automotive
3% of FY23 revenue
FY23 Revenue $0.9B
5-yr CAGR 10%
DRIVE Hyperion sensor architecture
with AGX compute
DRIVE AV & IX full stack software
for ADAS, AV & AI cockpit
24
Visuals: Four rectangular photographs in a row, each sharp-edged and boxed (not full-bleed), same size and aligned on top edge. Column 1, Data Center: a black server rack with stacked gold-grey NVIDIA GPU modules and blue-lit networking cables, shown frontal and filling the frame, lit by even cool studio light, dominant colours black, gold-grey and blue. Column 2, Gaming: a grid of video game key art tiles (Returnal, Sackboy, Dying Light 2, The Witcher 3, Cyberpunk-style yellow art, Minecraft, Fortnite, Plague Tale Requiem) with a laptop in front showing the Portal with RTX logo, and an NVIDIA GeForce RTX 3090-style graphics card standing to its right; dominant colours dark grey, blue, yellow and green. Column 3, Professional Visualization: a red-and-chrome radio-controlled buggy on a reflective surface with blue and pink light tubes and purple bokeh, shallow depth of field, dominant colours purple, magenta and blue. Column 4, Automotive: a silver Mercedes-Benz concept electric sedan seen front three-quarter, its grille lit with blue LED points and a Mercedes star, set outdoors with trees and a glass building behind, daylight, dominant colours silver grey and green. The photos carry a dark #151617 fill at 61% opacity layered with them per the file measurements. Small NVIDIA logo bottom right at x 93.1%, y 94.8%.
Slide 25
Data Center / The leading computing platform for AI, HPC & graphics / Revenue ($M) / 51% 5-YR CAGR / Through FY23 / $15,005 / $14,607 / $10,613 / $6,696 / $2,932 / $2,983 / FY19 / FY20 / FY21 / FY22 / FY23 / 1H FY24 / Leader in AI & HPC / #1 in AI training and inference / Used by all hyperscale & major cloud computing / providers and 40,000 enterprises / Powers 74% of the TOP500 supercomputers / Growth Drivers / Rapid AI adoption across industries / Full-stack AI | Software / Three chip strategy — GPU | CPU | DPU / Rising computation requirements for modern AI / Data-center scale innovation / Omniverse / 25
Visuals: Vertical bar chart titled 'Revenue ($M)', centred at the top of the left panel. Type: column chart with six categories on the x-axis (FY19, FY20, FY21, FY22, FY23, 1H FY24) and no printed y-axis scale or gridlines. Series values labelled above each bar: FY19 $2,932; FY20 $2,983; FY21 $6,696; FY22 $10,613; FY23 $15,005; 1H FY24 $14,607. Units are $M as stated in the title. Bars FY19 to FY22 are solid #76B900. The FY23 bar is stacked: a lower dark green #598B00 segment up to about the level of $10,613 and an upper #76B900 segment to $15,005. Between FY23 and 1H FY24 a pale green #CFE6A2 wedge tapers from the FY23 top-of-dark level up to the top of the 1H FY24 bar, with a thin black arrow line running from the FY23 dark-segment top corner up to the top of the 1H FY24 bar. The 1H FY24 bar is solid #598B00. Callout text at top left of the chart reads '51% 5-YR CAGR / Through FY23'. A thin grey #8C8C8C horizontal baseline runs under all bars. No legend. The right panel is text only, no imagery.
Slides 26 to 39 continue in the full text file.
Download this deck
The hosted PDF of every library deck is free for readers of the SlideDeck Co newsletter. Join with your email and the viewer and download appear here.
Preparing a results presentation or business update of your own? The SlideDeck Co Standard Deck is a slide library for business reviews, updates and plans.







