
The deck opens with a forward-looking statements and non-GAAP disclaimer, then a company overview stating NVIDIA's accelerated computing approach and scale. It moves through the case for accelerated computing, including an Amdahl's law example and the end of Moore's law, then covers AI demand, the Omniverse metaverse platform, the full-stack platform and developer flywheel, and the new software and services. Financial sections follow, showing revenue, operating profit, gross margin and cash flow from FY2018 to 1H FY23, alongside a breakdown by market platform: Data Center, Gaming, Professional Visualization and Automotive. Each platform gets its own slide with growth drivers. The deck closes with a summary and a $1 trillion market opportunity framing, followed by appendix reconciliations of non-GAAP to GAAP measures. Slides worth studying include the Amdahl's law illustration, the market opportunity slide with its segment sizing, and the financial charts that pair bars with margin lines.
Slides worth studying
Questions about this deck
How many slides does the NVIDIA Investor Presentation from October 2022 have?
The NVIDIA investor presentation has 31 pages. Slide 1 is the title slide, reading NVIDIA Investor Presentation, October 2022.
What does the NVIDIA deck say about Data Center revenue growth?
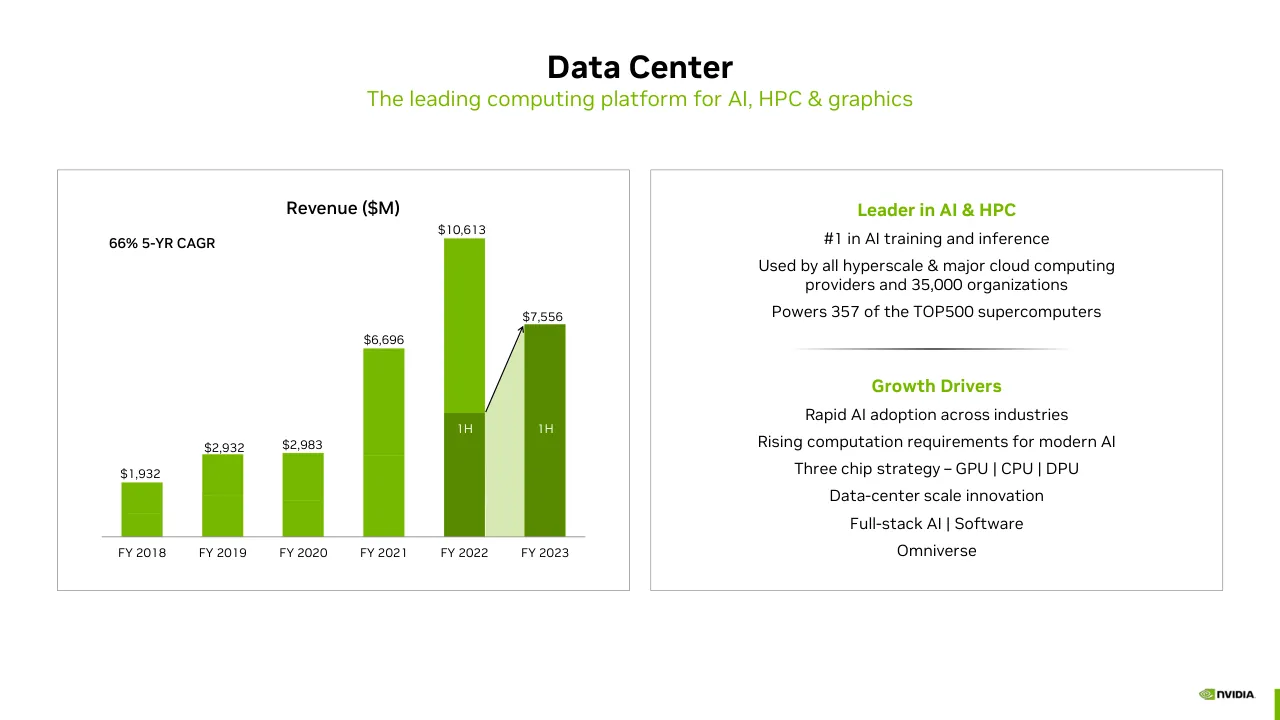
Slide 17 shows Data Center revenue with a 66% 5-YR CAGR. The bar chart on that slide lists FY 2022 revenue at $10,613 and 1H FY 2023 revenue at $7,556, in millions.
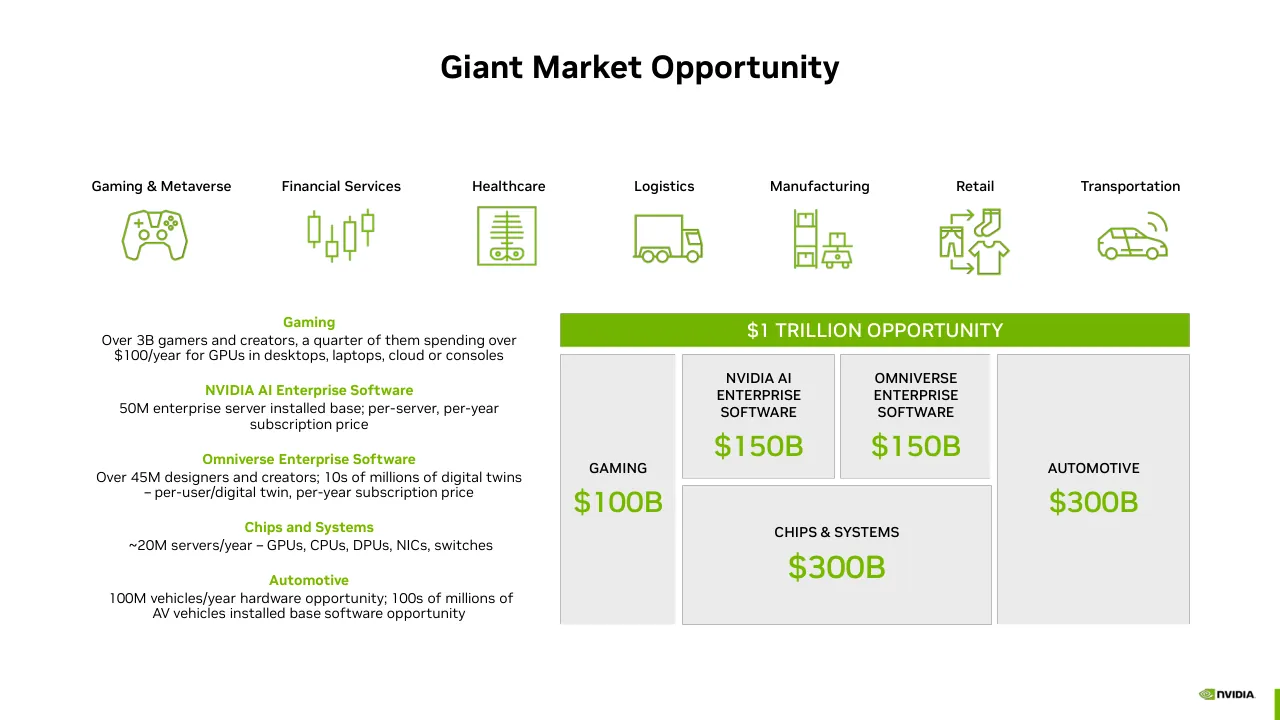
What market opportunity does the NVIDIA deck describe?
Slide 12 is titled Giant Market Opportunity and labels it a $1 TRILLION OPPORTUNITY. The segment figures on that slide are $150B for NVIDIA AI Enterprise Software, $150B for Omniverse Enterprise Software, $100B for Gaming, $300B for Chips & Systems and $300B for Automotive.
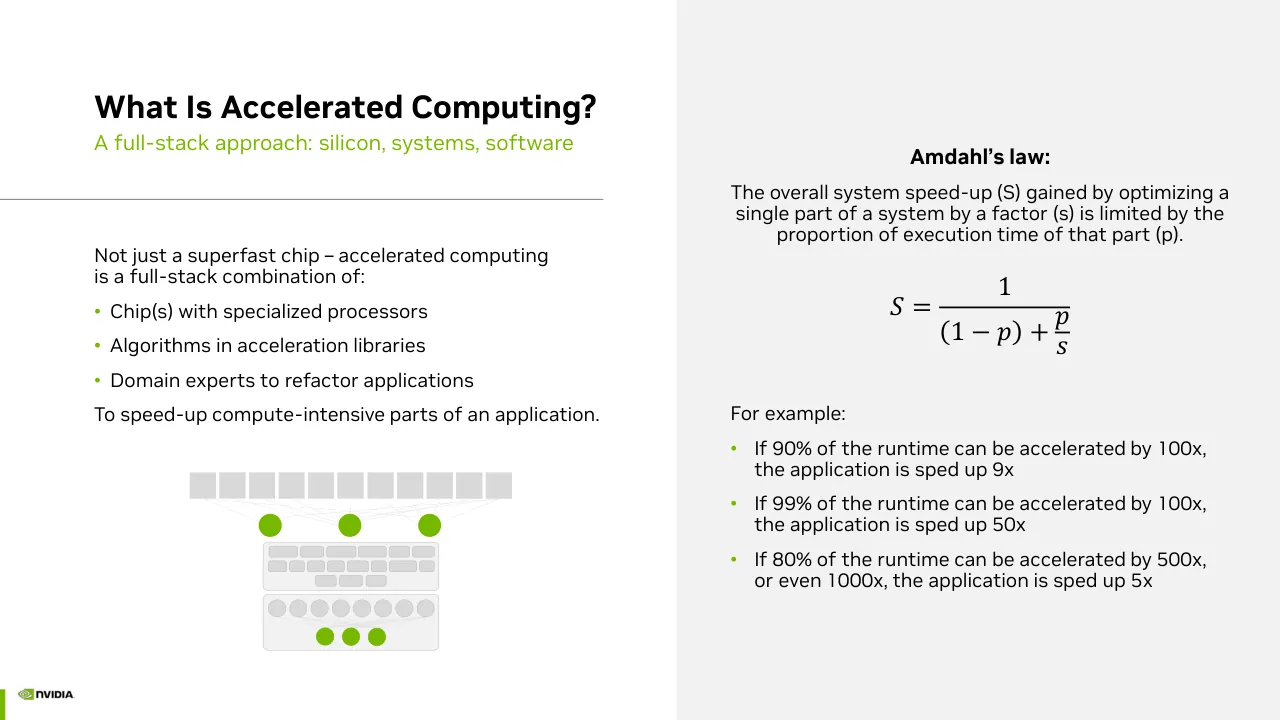
What example does the NVIDIA deck use to illustrate Amdahl's law?
Slide 4 explains Amdahl's law and gives three examples. It states that if 90% of the runtime can be accelerated by 100x, the application is sped up 9x, and if 99% of the runtime can be accelerated by 100x, the application is sped up 50x.
Details
- Company: NVIDIA
- Year: 2022
- Type: Investor presentation
- Industry: Semiconductors
- Pages: 31
More from NVIDIA
- NVIDIA investor presentation, September 2026 NDR
- NVIDIA investor presentation, Annual Stockholder Meeting June 2026
- NVIDIA investor presentation, Q2 FY27 quarterly presentation
- NVIDIA keynote, GTC Europe 2026
- NVIDIA presentation, 2026
- NVIDIA keynote, GTC 2026 Keynote
All NVIDIA decks in the library
Review score: 7 out of 10, Effective
Presentation quality, judged with the SlideDeck Co review heuristic. Ask, evidence and idea merit are not rated here.
The deck has a clear route from accelerated computing and the end of Moore's law, through AI, platform and software, to financials, per-market slides, a summary and the appendix, and its visual identity is consistent (green accent, grey panels, repeated chart styles). Slides 4, 12 and 13 are legible with clear hierarchy, and the market opportunity grid on slide 12 shows the $1T split quickly. The weaknesses are consequential: slide 2 is a dense wall of small legal text, many panels on slides 8, 11, 14 and 20 use very small text and low-contrast detail, and several titles are topic labels rather than takeaways. Slide 13 has overlapping labels in the operating profit chart, an unexplained shaded 1H bar, and donut charts with small, hard-to-compare slices.
Worth keeping: Keep the consistent green and grey system, the bar-plus-margin-line financial charts, and the slide 12 market grid with large dollar figures.
Most useful repair: Shrink or move the slide 2 disclaimer and enlarge the tiny text and footnotes on slides 8, 11, 13, 14 and 20, and fix the overlapping data labels on slide 13.
What would change the score: I would rewrite topic titles such as 'Gaming' and 'Data Center' as takeaway statements and reduce the near-identical chart-plus-bullets layout that repeats across slides 17 to 25.
Confidence medium. 31 of 31 pages inspected on contact sheets, 4 at readable size. Reviewed 2026-11-08. Model-assisted review (claude-sonnet-5-5).
Full text of the slides (31 slides)
Every slide's words and a description of its charts and images, so the deck can be searched and rebuilt. Also available as Markdown.
Slide 1
NVIDIA Investor Presentation / October 2022
Visuals: Full-bleed photograph-style 3D render on a black background. Subject: a glossy, translucent green NVIDIA eye-shaped emblem, seen in perspective, with concentric layered rings that recede toward the centre-right of the frame. Fine flowing light streaks in white and green sweep from the left and lower-left across the slide, and wisps curl over the upper right. Lighting is a directional green glow on the emblem edges against a near-black field. Dominant colours are black, bright green (about #76B900) and light grey-white. The image is full-bleed and not boxed, with no overlay or tint beyond the dark background. A green NVIDIA eye logo with the white wordmark sits at upper left.
Slide 2
Except for the historical information contained herein, certain matters in this presentation including, but not limited to, statements as to: our growth and growth
drivers; trends and our opportunities in existing and new markets; AI-fueled applications supercharging the exponential growth in demand for computation; AI
computational intensity growing super-exponentially; the next wave of AI and data centers; our cash dividend and repurchase program; our strategies; the rising
adoption of NVIDIA RTX; the performance, specifications, benefits, impact and availability of our products and technologies, including NVIDIA HPC, NVIDIA AI, NVIDIA
Omniverse, NVIDIA cuNumeric, NVIDIA CV-CUDA, NVIDIA cuQuantum, NVIDIA Parabricks, NVIDIA Sionna, NVIDIA JetPack, NVIDIA RAPIDS, NVIDIA Spark, NVIDIA
cuDNN, NVIDIA cuGraph, NVIDIA TensorRT, NVIDIA Triton, NVIDIA DeepStream, NVIDIA Flare, NVIDIA DOCA, NVIDIA Mag IO, NVIDIA Aerial, NVIDIA RTX, NVIDIA DGX,
NVIDIA HGX, NVIDIA EGX, NVIDIA OVX, NVIDIA Super POD, NVIDIA AGX, NVIDIA GPUs, NVIDIA CPUs, NVIDIA DPUs, GeForce GPU, GeForce NOW, Quadro, Ada Lovelace,
Hopper GPU, Grace CPU, Bluefield DPU, Omniverse Enterprise SW, Orin SOC, Base Command, Fleet Command, TAO, Enterprise TensorFlow/PyTorch, Triton Inference
Server, NVIDIA IGX, MLPerf, H100 GPU, NVIDIA Turing, NVIDIA Ampere Architecture, NVIDIA DRIVE products including the AI Cockpit and Autonomous Vehicles
platform, Thor Superchip, RT Core, Tensor Core, NVIDIA AI Enterprise Software, NVIDIA One Architecture, NVIDIA Nemo LLM, NVIDIA BioNemo and Transformer
architecture; optimizing across the entire stack allowing NVIDIA to advance computing in the post-Moore’s law era; our partnerships, collaborations, and customers;
upcoming launches of our products and architectures; and Ada Lovelace paving the way for fully simulated worlds are forward-looking statements.
These forward-looking statements and any other forward-looking statements that go beyond historical facts that are made in this presentation are subject to risks
and uncertainties that may cause actual results to differ materially. Important factors that could cause actual results to differ materially include: global economic
conditions; our reliance on third parties to manufacture, assemble, package and test our products; the impact of technological development and competition;
development of new products and technologies or enhancements to our existing product and technologies; market acceptance of our products or our partners'
products; design, manufacturing or software defects; changes in consumer preferences and demands; changes in industry standards and interfaces; unexpected loss
of performance of our products or technologies when integrated into systems and other factors.
NVIDIA has based these forward-looking statements largely on its current expectations and projections about future events and trends that it believes may affect its
financial condition, results of operations, business strategy, short-term and long-term business operations and objectives, and financial needs. These forward-looking
statements are subject to a number of risks and uncertainties, and you should not rely upon the forward-looking statements as predictions of future events. The
future events and trends discussed in this presentation may not occur and actual results could differ materially and adversely from those anticipated or implied in
the forward-looking statements. Although NVIDIA believes that the expectations reflected in the forward-looking statements are reasonable, the company cannot
guarantee that future results, levels of activity, performance, achievements or events and circumstances reflected in the forward-looking statements will occur.
Except as required by law, NVIDIA disclaims any obligation to update these forward-looking statements to reflect future events or circumstances. For a complete
discussion of factors that could materially affect our financial results and operations, please refer to the reports we file from time to time with the SEC, including our
most recent Annual Report on Form 10-K, Quarterly Reports on Form 10-Q, and Current Reports on Form 8-K. Copies of reports we file with the SEC are posted on
our website and are available from NVIDIA without charge.
NVIDIA uses certain non-GAAP measures in this presentation including non-GAAP gross profit, non-GAAP gross margin, non-GAAP operating income, non-GAAP
operating margin, and free cash flow. NVIDIA believes the presentation of its non-GAAP financial measures enhances investors' overall understanding of the
company's historical financial performance. The presentation of the company's non-GAAP financial measures is not meant to be considered in isolation or as a
substitute for the company's financial results prepared in accordance with GAAP, and the company's non-GAAP measures may be different from non-GAAP measures
used by other companies. Further information relevant to the interpretation of non-GAAP financial measures, and reconciliations of these non-GAAP financial
measures to the most comparable GAAP measures, may be found in the slide titled “Reconciliation of Non-GAAP to GAAP Financial Measures”.
Visuals: The NVIDIA logo in the bottom-right corner: the green eye-shaped mark followed by the black wordmark 'NVIDIA' with a small trademark dot, placed at x 93.1%, y 94.8%, width 5.5%, height 3.3%. A thin solid green vertical bar at the right edge of the slide, about 0.4% wide and about 4.4% tall, positioned near the bottom right. No photographs, charts, tables or diagrams.
Slide 3
NVIDIA pioneered accelerated computing to help solve impactful / challenges classical computers cannot. A quarter of a century in the / making, NVIDIA accelerated computing is broadly recognized as the / way to advance computing as Moore’s law ends and AI lifts off.
NVIDIA’s platform is installed in several hundred million computers, / is available in every cloud and from every server maker, powers 357 / of the TOP500 supercomputers, and boasts over 3.5 million developers.
Headquarters: Santa Clara, CA | ~25,000 Employees
Visuals: Full-bleed photograph (tilt-shift style aerial view at dusk) of the NVIDIA headquarters campus in Santa Clara. Two large wave-shaped rooftops with white and blue faceted triangular panels and small rectangular skylight openings sit in the centre-lower half, with a smaller white lattice pavilion with illuminated columns and a warm-lit circular base between them. Below is a dark tree-lined road with small cars and street lights; behind is a blurred city of low buildings and trees fading to the horizon. The sky at top right is a purple-to-pink dusk gradient fading to deep blue. Lighting is dusk: cool white light on the roofs, warm amber light in the pavilion and street lamps. Dominant colours are slate blue, white, dusky purple and dark green-grey. Framing is wide and landscape with the buildings in the lower third; the photo is not cropped inside a box and has a blur vignette at the edges. A dark #262626 overlay at 85% opacity sits over the photo's upper-left area behind the text. No other graphics, charts or icons are present except the logo at bottom right.
Slide 4
What Is Accelerated Computing?
A full-stack approach: silicon, systems, software
Not just a superfast chip – accelerated computing
is a full-stack combination of:
• Chip(s) with specialized processors
• Algorithms in acceleration libraries
• Domain experts to refactor applications
To speed-up compute-intensive parts of an application.
Amdahl’s law:
The overall system speed-up (S) gained by optimizing a
single part of a system by a factor (s) is limited by the
proportion of execution time of that part (p).
S = 1 over (1 − p) + p over s
For example:
• If 90% of the runtime can be accelerated by 100x,
the application is sped up 9x
• If 99% of the runtime can be accelerated by 100x,
the application is sped up 50x
• If 80% of the runtime can be accelerated by 500x,
or even 1000x, the application is sped up 5x
Visuals: Diagram (schematic illustration, not a chart or photo) below the bullet text, centred at about x 14.8% to 40%, y 65.6% to 90.3%: an upper row of 11 identical light grey rectangles (#D9D9D9) approximately 3.5% wide and 6% tall with small gaps, faint pale grey connector lines fanning from them down to three green (#76B900) filled circles about 1.8% wide. Below the circles, a light grey (#F2F2F2) rounded rectangle at x 20.6%, y 75.3%, w 13.7%, h 6.7% contains rows of small pale grey keys (about 6, 8 and 3 keys) like a keyboard-style chip block. Beneath it, a second light grey (#F2F2F2) rounded rectangle at x 20.6%, y 82.5%, w 13.7%, h 7.8% holds a row of 8 grey circles (#D9D9D9) with faint connector lines running down to three green circles at its bottom centre. No labels or arrowheads; the lines are thin and very light grey. The only other graphic is the NVIDIA logo in the bottom-left corner.
Slide 5
Why Accelerated Computing?
Advancing computing in the post-Moore’s Law era
Accelerated computing is needed to tackle the most impactful opportunities of our time — like AI, climate simulation, drug discovery, ray tracing, and robotics.
NVIDIA is uniquely dedicated to accelerated computing – working top-to-bottom — refactoring applications and creating new algorithms, and bottom-to-top — inventing new specialized processors, like RT Core and Tensor Core.
“It’s the end of Moore’s Law as we know it.”
- John Hennessy Oct 23, 2018
“Moore’s Law is dead.”
- Jensen Huang, GTC 2013
Chart: Trillions of Operations per Second (TOPS); 10⁹ 10⁸ 10⁷ 10⁶ 10⁵ 10⁴ 10³ 10²; 1980 1990 2000 2010 2020 2030
GPU-Computing perf
2X per year
1000X
In 10 years
1.1X per year
1.5X perf per year
Single-threaded CPU perf
Visuals: One line chart with a logarithmic vertical axis titled Trillions of Operations per Second (TOPS), ticks labelled 10^2 to 10^9 (decade spacing, about 56 px per decade on the slide image), and a horizontal linear time axis from 1980 to 2030 with ticks every 10 years, drawn as a thin grey baseline. Series 1, GPU-Computing perf, green #76B900: scatter markers with a solid line and dashed extension to about 2024; labelled ‘GPU-Computing perf 2X per year’. Markers, about: 2008 ≈ 6×10^4; 2009.6 ≈ 2×10^5; 2011 ≈ 5×10^5; 2012 ≈ 2×10^6; 2014 ≈ 1.6×10^7; 2016 ≈ 7×10^7; 2019 ≈ 2×10^8; 2022 ≈ 4×10^8; dashed extension to about 2024 near 10^9. Series 2, Single-threaded CPU perf, blue #0070C0: scattered dots from 1990 (about 15 TOPS) to about 2017 (about 1.4×10^4), solid trend line through the dots, then dashed flat extension to 2025 at about 1.5×10^4; labelled ‘1.1X per year’ near 2017 and ‘1.5X perf per year’ near 2000–2005 and ‘Single-threaded CPU perf’ below the start of the line. A vertical double-headed arrow in dark grey/black at about x 92% spans from about 10^8 to 10^5 and is labelled 1000X / In 10 years. No legend box; series are identified by direct labels. No points are highlighted beyond the arrow. Also a NVIDIA logo image at bottom-left.
Slide 6
AI Is the Greatest Technology Force of Our Time
Data centers across industries will become AI factories
AI has fundamentally changed what software can make and how you make software.
Companies are processing & refining their data, making AI software – becoming intelligence manufacturers. Their data centers are AI factories.
The first wave of AI learned perception and inference, like recognizing images, understanding speech, recommending a video, or an item to buy.
The next wave of AI is robotics – AI planning actions. Digital robots, avatars, and physical robots will perceive, plan and act.
NVIDIA’s acceleration stacks and ecosystems help bring AI to the world’s largest industries.
NVIDIA’s world-class AI expertise and scale can help revolutionize businesses.
Contact Center AI
500M Calls / Day
Meeting Transcription
3B Meeting Minutes / Day
Public Safety
>1B Smart City Cameras Deployed
Retail Asset Protection
$94.5B Inventory Loss / Year
Medical Imaging
10M Diagnostic Scans / Day
Industrial Inspection
32M Vision Sensors Installed by 2025
Transportation
10T Miles / Year
Credit Card Fraud
1.28B Credit Transactions / Day
Product Recommendations
1B E-Commerce Visitors / Day
Source: Nilson Report, IHS Markit, Similar Web, NRF, WHO, ABI and NVIDIA internal analysis
Visuals: Nine photographs in a 3 by 3 grid, each a sharp rectangular box with no rounded corners and a thin light grey edge, each with a dark #151617 rectangle at 61 percent opacity behind it that is hidden by the photo. Row 1: (1) Contact Center AI: a smiling woman with a headset in the foreground at left, with two men in headsets at computers behind her in a bright office, cool neutral tones, shallow depth of field. (2) Meeting Transcription: a 2 by 2 grid of video-call tiles showing four people: a man in a dark shirt at top left, a woman in a polka-dot blouse gesturing at top centre, a man with a headset at top right, a man at bottom left, a woman at bottom centre and a man in a dark suit at bottom right, with a bright window behind. (3) Public Safety: an aerial view of an old European town square with stone buildings and a clock tower, overlaid with colourful detection tags reading BUS, VAN, MOTORBIKE, PEDESTRIAN, CYCLIST and CAR in red, cyan, green, yellow and magenta boxes over the vehicles and people. Row 2: (4) Retail Asset Protection: a checkout counter with a blond male cashier at right and a customer, with a red circle drawn around a tray of meat and bananas, warm red and green tones. (5) Medical Imaging: a patient lying on a white MRI or CT table at left with a monitor at right showing a blue-tinted cross-section scan of a skull and brain, dark blue and white. (6) Industrial Inspection: a factory cell with yellow walls and blue robotic arms working on a blue and silver machine, bright overhead lighting. Row 3: (7) Transportation: a teal and white autonomous delivery pod with four black wheels on an urban street at dusk with a city skyline behind, cool grey and teal tones. (8) Credit Card Fraud: a hand holding a dark credit card over a keyboard, with a blue-lit screen showing a grid of round icons, dark blue and black tones. (9) Product Recommendations: a person viewed from behind holding a tablet showing an e-commerce site with shoe images and pink accents, warm beige background. Logo: NVIDIA logo (green eye mark with black NVIDIA wordmark) at bottom right, about 5.5 percent wide. A thin vertical green bar sits at the right edge near the bottom.
Slide 7
Building and Operating Metaverse Applications Is the Next Wave
NVIDIA Omniverse — Runs on NVIDIA OVX servers | RTX workstations | Enterprise software | Cloud services
NVIDIA Omniverse is a software platform for
building and operating metaverse applications.
Our initial focus is on industrial metaverses,
such as digital twins used to emulate the
behavior of products or factories in the physical
world.
Omniverse uses a real-time, large-scale 3D
database that connects to 3D worlds via the
USD (Universal Scene Descriptor) framework.
Just as the internet connects websites over
HTML, Omniverse connects 3D worlds over USD.
Omniverse is essential for the next wave of
AI -- robotics -- where AI interacts with the
physical world.
Applications built to run on Omniverse are like
portals into the Omniverse virtual world.
Factory Digital Twin
Factory Planning
Factory CAD
Digital Human Training
Robot CAD
Robot Gym
Physics
AI
Path
Tracing
MDL
Product Development
Connecting 3D Creators &
AI Assistants in Virtual Worlds
Operate Digital Twin
Connecting Robots
in a Virtual World
Visuals: One photograph-style digital illustration in a boxed rectangle at x 41.6%, y 24.1%, w 51.3%, h 51.5% (2732 by 1547 pixels), with a flat black background. Centre: a large circular, glowing, semi-transparent sphere (about x 52 to 75%, y 35 to 63%) containing a photograph of a factory assembly line with blue-uniformed workers and robotic arms, labelled 'Factory Digital Twin' above it. Satellite circles connected by glowing lines: top-left circle (about x 31 to 40%, y 29 to 42%) showing a grey isometric CAD factory floor, labelled 'Factory CAD'; top-right circle (about x 81 to 87%, y 27 to 38%) showing an aerial view of a factory floor, labelled 'Factory Planning'; middle-right circle (about x 84 to 92%, y 43 to 54%) showing a digital human walking on a grid, labelled 'Digital Human Training'; bottom-right circle (about x 81 to 87%, y 59 to 70%) showing a robot gym, labelled 'Robot Gym'; bottom-left circle (about x 42 to 51%, y 53 to 68%) showing a CAD robot cell, labelled 'Robot CAD'. Five blue circular badges with white 'USD' lettering sit on the connecting lines, at about x 56%/y 39%, x 80%/y 36%, x 55%/y 56%, x 80%/y 58%, and x 83%/y 49%. Three small round icons along the bottom centre of the sphere (about x 60 to 70%, y 62 to 72%) are labelled 'Path Tracing', 'AI' and 'MDL' (a sphere of coloured particles, a blue globe, and a group of figures) and a fourth round icon labelled 'Physics' (orange fire/particle sphere) sits to their right at about x 70%, y 63%. Lighting: dark background with warm white glow around the sphere and blue glow on connectors. Dominant colours: black, grey, white, blue (#0A5CD6 approx.) and warm amber. Not cropped; the image is a boxed rectangle with no border and no overlay. Below the image: a horizontal black arrow from about x 56% to 72% at y 79%, pointing right, joining 'Product Development' on the left and 'Operate Digital Twin' on the right. A small NVIDIA eye-and-wordmark logo in green and black at bottom right.
Slide 8
NVIDIA’s Accelerated Computing Platform
Full-stack innovation across silicon, systems and software
AI APPLICATION FRAMEWORK
MODULUS MONAI RIVA MAXINE NEMO MERLIN CUOPT MORPHEUS TOKKIO AVATAR DRIVE ISAAC METROPOLIS HOLOSCAN
PLATFORMS
NVIDIA HPC
NVIDIA AI
NVIDIA Omniverse
ACCELERATION
LIBRARIES
cuNumeric CV-CUDA cuQuantum Parabricks Sionna Jetpack
RAPIDS Spark cuDNN cuGraph TensorRT Triton Deepstream Flare
DOCA Mag IO Aerial
CLOUD-TO-EDGE
RTX DGX HGX EGX OVX Super POD AGX IGX
DATACENTER-TO-
ROBOTIC SYSTEMS
3-CHIPS
GPU CPU DPU
With nearly three decades of a singular
focus, NVIDIA is expert at accelerating
software and scaling compute by a
Million-X, going well beyond Moore’s law.
Accelerated computing is a full-stack
challenge, demanding deep understanding
of the problem domain, optimizing across
every layer of computing, and all three chips
– GPU, CPU, and DPU.
Scaling across multi-GPUs and multi-nodes
is a datacenter-scale challenge and requires
treating the network and storage as part of
the computing fabric.
Our platform extends from PCs to
supercomputing centers, enterprise data
centers, cloud and edge environments.
Visuals: Diagram of an accelerated computing stack with four tiers. Tier 1, AI APPLICATION FRAMEWORK: 14 square thumbnail images in one row, each labelled in white uppercase on a dark band: MODULUS (colourful heat-map style plot on dark background), MONAI (green organ-like shape on dark), RIVA (figure in a lab setting), MAXINE (person in a video frame), NEMO (blue water-drop character), MERLIN (white robotic-looking devices on a grey table), CUOPT (small grey autonomous vehicle on a street), MORPHEUS (dark field of orange dots), TOKKIO (purple-haired digital human on dark background), AVATAR (digital human face), DRIVE (street scene with cars), ISAAC (white robotic arm), METROPOLIS (dark city map with red and teal markers), HOLOSCAN (orange and blue particle cloud). Thin light-grey lines run from the framework tiles down to the platform circles. Tier 2, PLATFORMS: three solid green circles (#76B900) each about 7 percent of slide height, with white line icons: a three-orbit atom symbol (NVIDIA HPC) at x 20.4, a network-node cluster (NVIDIA AI) at x 33.1, and a concentric swirl (NVIDIA Omniverse) at x 45.8, each followed by its black label. Tier 3, ACCELERATION LIBRARIES: a light-grey rounded panel containing three rows of grey pill-shaped labels: row one cuNumeric, CV-CUDA, cuQuantum, Parabricks, Sionna, Jetpack; row two RAPIDS, Spark, cuDNN, cuGraph, TensorRT, Triton, Deepstream, Flare; row three DOCA, Mag IO, Aerial (centred). Tier 4, CLOUD-TO-EDGE / DATACENTER-TO-ROBOTIC SYSTEMS / 3-CHIPS: a second light-grey rounded panel with eight grey-outlined circles in one row: RTX, DGX, HGX, EGX, OVX, Super POD, AGX, IGX; faint grey connector lines fan from these circles down to three green chip icons below, labelled GPU (grid-of-cells chip icon), CPU (four-square chip icon) and DPU (dense grid chip icon). Connectors are thin light grey lines running from each upper circle to the chips. No photographs other than the 14 framework thumbnails; the NVIDIA wordmark logo bottom right in green and black.
Slide 9
NVIDIA’s Multi-Sided Platform and Flywheel
NVIDIA is valued by every stakeholder in the ecosystem:
• For developers – NVIDIA’s One Architecture and large
installed base give developer’s software the best
performance and greatest reach
• For computer makers and CSPs – NVIDIA’s rich suite
of Acceleration Platforms lets partners build one
offering to address large markets including media
& entertainment, healthcare, transportation, energy,
financial services, manufacturing, retail, and more
• For customers – NVIDIA is offered by virtually every
computing provider and accelerates the most
impactful applications from cloud to edge
• For NVIDIA – Deep engagement with developers,
computing providers, and customers in diverse
industries enables unmatched expertise, scale,
and speed of innovation across the entire accelerated
computing stack – propelling the flywheel
Full-Stack
Expertise and Scale
CUDA
Installed Base
3.5 Million
Developers
Wealth of
Accelerated
Apps
NVIDIA
Accelerated
Computing
Global Computer
Makers and CSPs
100’s of Systems
CSPs Worldwide
Full-Stack
Acceleration for
Largest Industries
35,000
Organizations
Across Industries
Demand and
New
Opportunities
Visuals: Right panel: a flywheel diagram of four green rounded rectangles arranged in a diamond, with curved black arrows running clockwise between them. Top box (about 67 to 79 percent x, 27 to 41 percent y) reads 3.5 Million Developers. Right box (about 80 to 92 percent x, 50 to 64 percent y) reads Global Computer Makers and CSPs. Bottom box (about 67 to 79 percent x, 73 to 87 percent y) reads 35,000 Organizations Across Industries. Left box (about 54 to 66 percent x, 50 to 64 percent y) reads NVIDIA Accelerated Computing. Arrow 1 runs from the top box down-right to the right box, labelled Wealth of Accelerated Apps on its right. Arrow 2 runs from the right box down-left to the bottom box, labelled 100’s of Systems CSPs Worldwide and Full-Stack Acceleration for Largest Industries below. Arrow 3 runs from the bottom box up-left to the left box, labelled Demand and New Opportunities on its left. Arrow 4 runs from the left box up-right to the top box, labelled Full-Stack Expertise and Scale and CUDA Installed Base on its left. Arrowheads are small and open. Bottom right: NVIDIA logo, a green eye-mark with black NVIDIA wordmark, at about 93 to 98.6 percent x, 94.8 to 98 percent y. The green bar is a solid vertical rectangle at the right edge.
Slide 10
Full-Stack & Data Center Scale Acceleration
Drive Significant Cost Savings and Workload Scaling
Classical Computing – 92 CPU-only servers
$3.3M (including, switches, cables, racks)
Application
CPU server racks
Accelerated Computing – 1 NVIDIA DGX A100
$220,000 DGX and $100,000 NVIDIA AI software
Application
Re-Engineered for Acceleration
CUDA-X Acceleration Libraries
Magnum IO
DGX
10X lower cost
14X better energy-efficiency
Cost comparison example based on latest available NVIDIA A100 GPU and Intel CPU inference results in the commercially available category of
the MLPerf industry benchmark; includes related infrastructure costs such as networking.
Visuals: Two diagram panels. Left panel: a stack of a green rounded box labelled Application, a light grey rounded box labelled CPU server racks containing five identical server-rack icons in a row (each a stack of six white rectangles outlined in green with small green dash markers). Right panel: a stack of three green rounded boxes labelled Application over Re-Engineered for Acceleration, CUDA-X Acceleration Libraries and Magnum IO, followed by a green outlined icon of a DGX server box with the label DGX to its right. Below the right stack are the bold lines 10X lower cost and 14X better energy-efficiency. Icons are flat line drawings in NVIDIA green #76B900 with white fill. The NVIDIA logo is the green and black wordmark in the bottom right corner. The slide has no photographs.
Slide 11
New NVIDIA Software and Services / Enabling the World’s Enterprises to Revolutionize Industries with AI / NVIDIA AI Enterprise / The operating engine of AI for / end-to-end data-driven software / development. / One engine license accelerates end- / to-end modern AI and data science. / One engine license unlocks wealth / of data processing, AI, and robotics / frameworks and applications – / e.g., RAPIDS, Spark, Merlin, Monai, / Metropolis, cuOpt, Morpheus, Tokkio. / Per GPU On-Prem Subscription / Per GPU-HR Cloud Consumption / NVIDIA Omniverse / A platform for designing, building, / and operating 3D and virtual world / simulations. / Consists of a virtual world engine, / USD connectors, and portals browsing / the virtual world simulation. / Omniverse is an enterprise application / that connects architects, designers, / hardware and software engineers, / marketers, to supply-chain and / factory planners. / Per Connection On-Prem Subscription / Per GPU-HR Cloud Consumption / NVIDIA Nemo LLM / NVIDIA-hosted cloud service for / training Large Language Models / to perform specific tasks – / e.g., summarize legal documents, / write marketing copy, analyze market / sentiment, chatbot to support / customers, search documents, write / and document code, paraphrase / Nemo can help thousands of / companies, train language AI’s to / do hundreds of tasks, in 10’s of / languages. / Per GPU On-Prem Subscription / Per GPU-HR Cloud Consumption / NVIDIA BioNemo / NVIDIA-hosted cloud service for / training and deploying large / biomolecular models that / understand the language of / chemistry, proteins, RNA, and DNA. / BioNemo can help researchers, / biotech, and pharma companies / to process chemical and biological / datasets to accelerate drug / discovery. / Per GPU On-Prem Subscription / Per GPU-HR Cloud Consumption
Visuals: Four rectangular cards, each a thin grey outline box with a light grey footer band, and a small NVIDIA logo at bottom right. No charts, photographs or illustrations. The footer bands are measured as four equal grey rectangles (#F2F2F2 with a thin grey #A6A6A6 border) at the bottom of each card, and the cards themselves are white boxes with thin grey #A6A6A6 outlines.
Slide 12
Giant Market Opportunity
Gaming & Metaverse
Financial Services
Healthcare
Logistics
Manufacturing
Retail
Transportation
Gaming
Over 3B gamers and creators, a quarter of them spending over
$100/year for GPUs in desktops, laptops, cloud or consoles
NVIDIA AI Enterprise Software
50M enterprise server installed base; per-server, per-year
subscription price
Omniverse Enterprise Software
Over 45M designers and creators; 10s of millions of digital twins
– per-user/digital twin, per-year subscription price
Chips and Systems
~20M servers/year – GPUs, CPUs, DPUs, NICs, switches
Automotive
100M vehicles/year hardware opportunity; 100s of millions of
AV vehicles installed base software opportunity
$1 TRILLION OPPORTUNITY
NVIDIA AI
ENTERPRISE
SOFTWARE
$150B
OMNIVERSE
ENTERPRISE
SOFTWARE
$150B
GAMING
$100B
CHIPS & SYSTEMS
$300B
AUTOMOTIVE
$300B
Visuals: Seven single-colour line icons in NVIDIA green #76B900 with labels above each. (1) Gaming & Metaverse: game controller outline with plus sign, two circular buttons and a small button cluster on the right. (2) Financial Services: three candlestick-chart glyphs with rectangular bodies and vertical wicks, of varying heights. (3) Healthcare: a boxed rack-like server or medical-scanner glyph with horizontal lines and a small round element at the bottom. (4) Logistics: delivery truck outline with a box body, cab and two wheels. (5) Manufacturing: stacked boxes on a shelf beside a small cart carrying a box. (6) Retail: a sock, shorts and a T-shirt with two bent arrows connecting them. (7) Transportation: side-view car outline with two wheels and three curved signal arcs above the roof. Icons are about 6.6% wide and 11.8% tall, line weight thin and uniform. Right-hand panel: a solid green banner #76B900 with white uppercase text; below, grey rectangles #EBEBEB with thin light grey #C8C8C8 borders and no shadows or rounding. Values printed: Gaming $100B; NVIDIA AI Enterprise Software $150B; Omniverse Enterprise Software $150B; Chips & Systems $300B; Automotive $300B. No chart, table or photograph.
Slide 13
Driving Strong & Profitable Growth
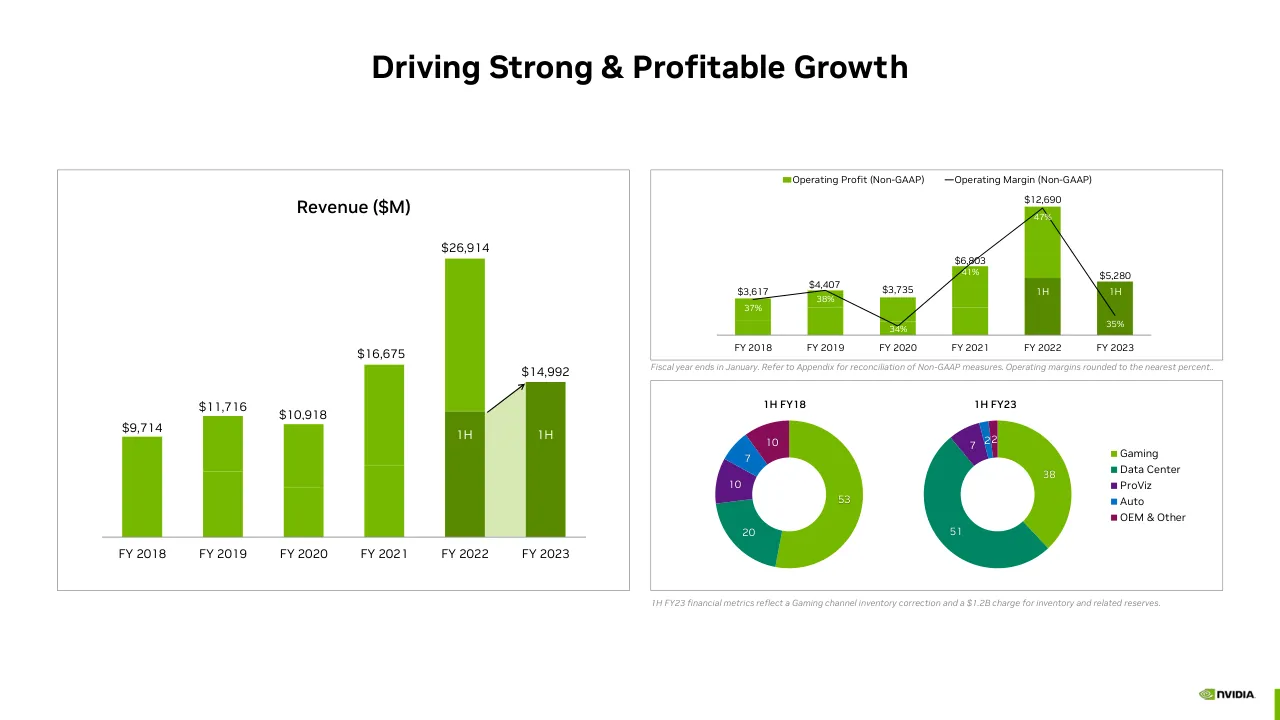
Revenue ($M)
$9,714
$11,716
$10,918
$16,675
$26,914
$14,992
$3,617
$4,407
$3,735
$6,803
$12,690
$5,280
1H
1H
1H
1H
49%
47%
45%
43%
41%
39%
38%
37%
35%
34%
33%
$12,000
$6,000
$0
FY 2018
FY 2019
FY 2020
FY 2021
FY 2022
FY 2023
Operating Profit (Non-GAAP)
Operating Margin (Non-GAAP)
Fiscal year ends in January. Refer to Appendix for reconciliation of Non-GAAP measures. Operating margins rounded to the nearest percent..
1H FY18
1H FY23
53
20
10
7
10
7
2
2
38
51
Gaming
Data Center
ProViz
Auto
OEM & Other
1H FY23 financial metrics reflect a Gaming channel inventory correction and a $1.2B charge for inventory and related reserves.
Visuals: Chart 1, column chart titled Revenue ($M), value axis not printed, categories FY 2018 to FY 2023 on a baseline. Values: FY 2018 $9,714; FY 2019 $11,716; FY 2020 $10,918; FY 2021 $16,675; FY 2022 $26,914; FY 2023 $14,992. Bars are two-tone stacks in #76B900 with darker #598B00 segments labelled 1H for FY 2022 and FY 2023; a translucent pale green #76B900 at 30 percent opacity bar sits between FY 2022 and FY 2023 with a black arrow from the FY 2022 1H segment top to the FY 2023 bar. Chart 2, combo chart with bars labelled Operating Profit (Non-GAAP) in #76B900 and a black line labelled Operating Margin (Non-GAAP). Bar values: FY 2018 $3,617 (margin 37%); FY 2019 $4,407 (38%); FY 2020 $3,735 (34%); FY 2021 $6,803 (41%); FY 2022 $12,690 (47%); FY 2023 $5,280 (35%). FY 2022 and FY 2023 bars have darker #598B00 1H segments. Margin line in black about 1 pt; no separate value axis printed; margin values in white inside bars. Chart 3, two donut charts with no axes. 1H FY18 donut: Gaming 53 in #76B900, Data Center 20 in #008564, ProViz 10 in #6A1B9A-like purple, Auto 7 in #0076C0-like blue, OEM & Other 10 in #8C0A5A-like magenta, segments clockwise from top. 1H FY23 donut: Gaming 38 in #76B900, Data Center 51 in #008564, ProViz 7 in purple, Auto 2 in blue, OEM & Other 2 in magenta, with a legend to the right listing Gaming, Data Center, ProViz, Auto, OEM & Other in their series colours. Logo: NVIDIA wordmark with eye symbol in #76B900 and black text, bottom right.
Slide 14
NVIDIA Gross Margins Reflect Value of Acceleration / Accelerated computing requires full-stack and data / center-scale innovation across silicon, systems, / algorithms and applications. / Significant expertise and effort are required, but / application speed-ups can be incredible, resulting in / dramatic cost and time-to-solution savings. / For example, 10 NVIDIA HGX nodes with 80 NVIDIA A100 / GPUs that cost $4M can replace 920 nodes of CPU servers / that cost over $50M for AI inference. / NVIDIA chips carry the value of the full-stack, not just / the chip. / Gross Profit (Non-GAAP) / Gross Margin (Non-GAAP) / 60% / $5,844 / 62% / $7,233 / 63% / $6,821 / 66% / $10,947 / $17,969 / 67% / 1H / $8,636 / 1H / 58% / FY 2018 / FY 2019 / FY 2020 / FY 2021 / FY 2022 / FY 2023 / Cost comparison example based on latest available NVIDIA A100 GPU and Intel CPU inference results in the commercially available category of / the MLPerf industry benchmark; includes related infrastructure costs such as networking. / 1H FY23 financial metrics reflect a Gaming channel inventory correction and a $1.2B charge for inventory and related reserves. / Fiscal year ends in January. Refer to Appendix for reconciliation of Non-GAAP measures. Gross margins are rounded to the nearest percent.
Visuals: One combination chart in the right panel. Type: stacked column chart with a line overlay on the same panel. Title: none printed as a chart title; the legend reads Gross Profit (Non-GAAP) and Gross Margin (Non-GAAP). Axes: no visible value axis or tick labels (the file contains white-on-white tick text $0, $6,000, $12,000 and $18,000 at the left and 55% to 69% at the right, which is not visible on the rendered slide); category axis shows FY 2018 to FY 2023 along a thin black baseline. Series 1, Gross Profit (Non-GAAP), green columns #76B900 with labelled values: FY 2018 $5,844; FY 2019 $7,233; FY 2020 $6,821; FY 2021 $10,947; FY 2022 $17,969 (top segment #76B900 with 67% printed in white and a lower segment #598B00 labelled 1H); FY 2023 $8,636 (fully #598B00 with 1H and 58% in white). Series 2, Gross Margin (Non-GAAP), thin black line with labelled points: 60% at FY 2018, 62% at FY 2019, 63% at FY 2020, 66% at FY 2021, 67% at FY 2022, and the line ends at FY 2023 at about 58% with no printed label outside the bar. Legend: small green square #76B900 before Gross Profit (Non-GAAP) and a short black dash before Gross Margin (Non-GAAP), at the top of the panel. Highlighted points: the FY 2022 column is split into two tones at about the midpoint, and FY 2023 is the darker shade throughout. No photographs, icons or logos other than the NVIDIA logo bottom right.
Slide 15
Strong Cash Flow Generation
Free Cash Flow (Non-GAAP)
Capital Allocation
Share Repurchase
Resumed Buybacks in Q1 FY 2023
$5.3B repurchased in 1H FY23; ~$12B Remaining
Authorization Through Jan 2024 as of Aug 2023
$8.0B
$4.7B
$4.3B
$3.1B
$2.9B
$2.2B
1H
1H
FY 2018
FY 2019
FY 2020
FY 2021
FY 2022
FY 2023
Dividend
$400M in FY 2022
Plan to Maintain
Strategic Investments
Growing Our Talent,
Platform Reach & Ecosystem
Fiscal year ends in January. Refer to Appendix for reconciliation of Non-GAAP measures.
Visuals: Vertical bar chart titled Free Cash Flow (Non-GAAP), with no printed y-axis or gridlines, a horizontal baseline, and six categories along the x-axis labelled FY 2018, FY 2019, FY 2020, FY 2021, FY 2022 and FY 2023. Each bar has its value printed above it: FY 2018 $2.9B, FY 2019 $3.1B, FY 2020 $4.3B, FY 2021 $4.7B, FY 2022 $8.0B, FY 2023 $2.2B. The bars are light green #76B900 for full-year values. FY 2022 is a stacked bar: its lower segment is dark green #598B00 and labelled 1H, and its upper segment is light green. FY 2023 is dark green #598B00 and labelled 1H, indicating a first-half figure. Bars are drawn with flat fills and no outlines. Approximate bar heights are proportional to the printed values, with no axis units shown. Two thin grey divider lines with fading ends separate the Capital Allocation sections. The NVIDIA logo (green and black wordmark) sits at bottom right.
Slide 16
Our Market Platforms at a Glance
Gaming
46% of FY22 revenue
FY22 Revenue $12.5B / 5-yr CAGR 25%
GeForce GPUs for PC gaming / GeForce NOW cloud gaming
Data Center
40% of FY22 revenue
FY22 Revenue $10.6B / 5-yr CAGR 66%
DGX/HGX/EGX/IGX systems / GPU | CPU | DPU | Networking / NVIDIA AI software
Professional Visualization
8% of FY22 revenue
FY22 Revenue $2.1B / 5-yr CAGR 20%
Quadro/NVIDIA RTX GPUs / for workstations / Omniverse software
Automotive
2% of FY22 revenue
FY22 Revenue $0.6B / 5-yr CAGR 3%
DRIVE Hyperion sensor architecture with / AGX compute, DRIVE AV & IX full stack / software for ADAS, AV & AI cockpit
Visuals: Four rectangular photographs, one per column, all the same size (about 21.8% by 36.0% of the slide), set in a horizontal row with equal gaps. Column 1 (Gaming): a blocky, Minecraft-style voxel cave scene with brown and grey stone walls, green vines hanging down, light shafts entering from the upper right, and a wooden railing and planks in the foreground; warm, muted brown and green tones; full frame, not cropped to a shape, square corners. Column 2 (Data Center): a dark server rack seen head-on, with three large beige-grey GPU/system modules on the left, black chassis, rows of small blue-lit networking units in the centre and a small NVIDIA logo on the module edges; black and beige palette with blue accent lights; full frame. Column 3 (Professional Visualization): an architectural interior render with a curved pale ceiling dome at top, a glass wall with dark wooden mullions on the right, sunlight streaking across a cream wall on the left, a red accent panel at upper left, and grey chairs, small tables and potted plants on a wooden floor; warm beige, cream and blue-grey tones; full frame. Column 4 (Automotive): a silver-grey concept sedan viewed front three-quarter, with a illuminated blue LED grille bearing a Mercedes-Benz star, blue headlight strips, and five-spoke dark wheel; behind it a glass-walled building, green trees, a white fire hydrant on the left and a grey paved road; silver, green and blue tones; full frame. Each photo has a dark #151617 rectangle directly behind it at 61% opacity, which is hidden by the opaque photo. Four thin grey gradient divider lines (fading at both ends) sit under the category headings. The NVIDIA logo (green and black wordmark) is at bottom right.
Slide 17
Data Center
The leading computing platform for AI, HPC & graphics
Revenue ($M)
66% 5-YR CAGR
$10,613
$7,556
$6,696
$2,983
$2,932
$1,932
1H
1H
FY 2018
FY 2019
FY 2020
FY 2021
FY 2022
FY 2023
Leader in AI & HPC
#1 in AI training and inference
Used by all hyperscale & major cloud computing
providers and 35,000 organizations
Powers 357 of the TOP500 supercomputers
Growth Drivers
Rapid AI adoption across industries
Rising computation requirements for modern AI
Three chip strategy – GPU | CPU | DPU
Data-center scale innovation
Full-stack AI | Software
Omniverse
Visuals: Bar chart titled 'Revenue ($M)' with a subtitle '66% 5-YR CAGR' at upper left of the plot. Vertical bars for six fiscal years, left to right: FY 2018 $1,932; FY 2019 $2,932; FY 2020 $2,983; FY 2021 $6,696; FY 2022 $10,613; FY 2023 $7,556 (values printed above each bar; no axis, axis labels or gridlines are printed). Bars FY 2018 to FY 2021 are solid bright green #76B900 with no visible stacking. FY 2022 is a tall bright green bar with its bottom segment (about 0 to 17 percent of its height) dark olive #598B00 labelled '1H' in white. FY 2023 is a dark olive #598B00 bar labelled '1H' in white at its upper segment. Between the FY 2022 and FY 2023 bars a light green (#76B900 at 30% opacity, about #D6E9AE) wedge rises from the FY 2022 dark segment top to the FY 2023 bar top, with a thin black arrow pointing up-right from the FY 2022 segment to the top of the FY 2023 bar. Baseline is a thin grey horizontal line under the bars. No legend. Highlighted points: the FY 2022 and FY 2023 bars and the arrow. Right panel contains no graphics other than a thin grey horizontal divider line that fades at both ends, centred between the two text groups at about y 48.4%. NVIDIA logo: green eye-like mark with black wordmark 'NVIDIA' at bottom right.
Slide 18
Data Center / Strong growth fueled by AI performance leadership and huge developer ecosystem / Hyperscale Revenue / P100 / V100 / A100 / 3x / Note: Cumulative Revenue 8Q After Launch / 90,000x / 2015 / K80 / 36,000 Mins / (25 Days) / 2017 / V100 / 480 Mins / (8 Hours) / 2021 / A100 / 24 Seconds / MLPerf / CUDA Downloads – 4.5X in 4 Yrs / 37M / # of Developers – 3.5X in 4 Yrs / 3.5M / Accelerated Applications – 5X in 4 Yrs / 3K / Accelerating Adoption with / Every Architecture / #1 in AI Training & / Inference Performance / The Largest Accelerated / Computing Ecosystem / NVIDIA
Visuals: Three panels. Left: a green vertical bar chart titled by its caption Accelerating Adoption with Every Architecture, y-axis labelled Hyperscale Revenue with no printed scale or values; three bars labelled P100 (short, about 20 percent of the plot height), V100 (about 50 percent) and A100 (tallest, about 90 percent); a black vertical double-headed-style arrow at the centre of the plot labelled 3x runs from the top of the V100 bar to the top of the P100 bar with an arrowhead pointing up; a grey baseline runs under the bars; the note Note: Cumulative Revenue 8Q After Launch sits bottom right. Middle: a horizontal green bar chart titled #1 in AI Training & Inference Performance with a grey vertical axis line; three bars: 2015 K80 at 36,000 Mins (25 Days) (longest bar), 2017 V100 at 480 Mins (8 Hours) (about 13 percent of the longest bar), 2021 A100 at 24 Seconds (a sliver, about 1 percent of the longest bar); a black horizontal arrow labelled 90,000x spans above the bars from the axis toward the right; the MLPerf logo (a grey and blue speedometer gauge icon above the grey word MLPerf) sits below the bars. Right: three infographic rows, each a heading over two green circles sitting on a grey horizontal line: CUDA Downloads – 4.5X in 4 Yrs with a small circle (about 1/4 the diameter of the large circle) and a large circle reading 37M; # of Developers – 3.5X in 4 Yrs with a slightly smaller small circle (about 3/4 of the large circle diameter) and a large circle reading 3.5M; Accelerated Applications – 5X in 4 Yrs with a small circle and a large circle reading 3K. The NVIDIA logo (green and black eye mark with the word NVIDIA) sits bottom right.
Slide 19
Modern AI is a Data Center Scale Computing Workload / Data centers are becoming AI factories: data as input, intelligence as output / AI Training Computational Requirements / All AI Models Excluding Transformers: 8x / 2yrs / Transformer AI Models: 275x / 2yrs / Megatron-Turing / NLG 530B / GPT-3 / Microsoft T-NLG / GPT-2 / Megatron / XLNet / Wav2Vec 2.0 / MoCo ResNet50 / Xception / InceptionV3 / BERT Large / GPT-1 / Resnet / Seq2Seq / Transformer / ResNeXt / VGG-19 / ELMo / DenseNet201 / AlexNet / Training Compute (petaFLOPS) / 10¹⁰ / 10⁹ / 10⁸ / 10⁷ / 10⁶ / 10⁵ / 10⁴ / 10³ / 10² / 2012 / 2013 / 2014 / 2015 / 2016 / 2017 / 2018 / 2019 / 2020 / 2021 / 2022 / Fueling Giant-Scale AI Infrastructure / NVIDIA compute & networking GPU | DPU | CPU / Large Language Models, based on the Transformer architecture, are one of / today’s most important advanced AI technologies, involving up to trillions of / parameters that learn from text. / Developing them is an expensive, time-consuming process that demands deep / technical expertise, distributed data center-scale infrastructure, and a full-stack / accelerated computing approach.
Visuals: Left: a scatter chart titled 'AI Training Computational Requirements' with a log y-axis labelled 'Training Compute (petaFLOPS)' running from 10² to 10¹⁰ (one decade per gridline) and a linear x-axis from 2012 to 2022 in yearly ticks. Two series: blue points (#0071C5) for non-Transformer models, labelled AlexNet about 6×10² in 2012, Seq2Seq and Resnet about 1.5×10⁴ in 2014 to 2015, VGG-19 about 1.5×10⁴ in 2015, InceptionV3 about 1.5×10⁵ in 2016, Xception about 7×10⁵ in 2016.5, ResNeXt about 2×10⁴ in 2016.7, DenseNet201 about 4×10³ in 2016.8, ELMo about 5×10³ in 2018, Wav2Vec 2.0 about 3×10⁶ in 2019.9, MoCo ResNet50 about 8×10⁵ in 2021, each blue point with its labelled value estimated where none is printed. A straight blue trend line runs from about 2013.9 at 8×10² up to about 2020 at 3×10⁶. Green points (#76B900) for Transformer models, labelled Transformer about 3.5×10⁴ in 2017.6, GPT-1 about 9×10⁴ in 2018.2, BERT Large about 4×10⁵ in 2018.5, XLNet about 3×10⁶ in 2019.1, Megatron about 1.5×10⁷ in 2019.4, MoCo-like point about 1.5×10⁶ in 2019.5, GPT-2 about 3×10⁷ in 2019, Microsoft T-NLG about 5×10⁷ in 2020, GPT-3 about 5×10⁸ in 2020.1, Megatron-Turing NLG 530B about 3×10⁹ in 2021.6, all values estimated. A green straight trend line runs from about 2018.3 at 4×10⁴ up to about 2021.6 at 3×10⁹. Two-line key at top-left of plot: blue 'All AI Models Excluding Transformers: 8x / 2yrs' and green 'Transformer AI Models: 275x / 2yrs'. No legend box; no highlighted points. Chart is on a white plot area with no gridlines, thin grey x-axis line at the bottom. Right: a full-width photograph of a dark data-centre hall, boxed in the upper part of the right panel and not cropped. Subject: rows of black server racks along the back wall with beige-and-black GPU compute trays and networking switch units on a glossy black floor, with a few smaller boards in the foreground. Composition: wide, one-point perspective, horizon near the middle, subjects centred. Lighting: soft studio spotlight from above, dark ambient, highlights on the trays. Dominant colours: near-black #151617, warm tan #8C7B5E and grey. A dark overlay of #151617 at 61% opacity covers the image, with the white heading and subheading placed on top at the upper centre. Bottom-right: NVIDIA logo, black wordmark with green eye symbol (#76B900).
Slide 20
Wave of New Data Center Products
Ramping new architectures for GPU, CPU and DPU
H100 GPU
World’s Most Advanced Chip
80B Transistors
Transformer Engine – 6X Perf
Confidential Computing
4th Gen NVLink – 7X PCIe Gen5
2H FY23
Bluefield-3 DPU
First 400 Gb/s DPU
Line-rate processing of software-defined networking, storage, and cybersecurity
VMware vSphere 8 integration
Zero-trust security
~600 infrastructure software partners
1H FY23
Grace CPU Superchip
High Performance CPU for HPC and AI
144 Cores | 740 SPECrate®2017_int_base est.
1TB/s Memory Bandwidth
2X Perf/Watt Over Traditional Servers
Runs NVIDIA Computing Stacks
1H FY24
NVIDIA
Visuals: Three product photographs and one logo. (1) H100 GPU: a top-down, square-on render of a black-framed GPU package with a central die showing green, yellow-green and gold tinted circuit blocks and dark heat-spreader frame at the corners; boxed on a flat light grey card with no overlay, centred in its card, fully visible and not cropped. (2) Bluefield-3 DPU: a slightly angled render of a rectangular chip die with a rainbow gradient of gold, orange, green, teal, blue and magenta circuit blocks on a black edge, fully visible, centred in its card. (3) Grace CPU Superchip: a front-on render of a long black module board with two rectangular CPU dies showing small multicolour glowing cores, a black heatsink-like border with copper-coloured mounting dots and a small NVIDIA mark on the left edge; fully visible, centred in its card. (4) NVIDIA logo: small green-and-black wordmark at the bottom right, no boxing. No charts, tables or diagrams.
Slide 21
Gaming / GeForce — the world’s largest gaming platform / Revenue ($M) / 25% 5-YR CAGR / $12,462 / $7,759 / $6,246 / $5,513 / $5,518 / $5,662 / 1H / 1H / FY 2018 / FY 2019 / FY 2020 / FY 2021 / FY 2022 / FY 2023 / Leader in PC Gaming / Strong #1 market position with over 80% share / 15 of the Top 15 most popular GPUs on Steam / Leading performance & innovation / 200M+ gamers on GeForce / Growth Drivers / Rising adoption of NVIDIA RTX / Expanding universe of gamers & creators / Gaming laptops & game consoles / GeForce NOW Cloud gaming
Visuals: Column chart in the left panel. Title: Revenue ($M), centred above the plot. Subtitle label inside plot top-left: 25% 5-YR CAGR. X axis: fiscal years FY 2018, FY 2019, FY 2020, FY 2021, FY 2022, FY 2023 (categorical, no units); thin dark grey baseline. Y axis: no axis labels or scale printed; bar heights are about proportional to the printed values. Series, all printed above each bar: FY 2018 $5,513; FY 2019 $6,246; FY 2020 $5,518; FY 2021 $7,759; FY 2022 $12,462, a stacked bar whose lower segment (about the bottom 40 percent of the bar, labelled 1H) is dark green and whose upper segment is bright green; FY 2023 $5,662, a bar in dark green labelled 1H. Between FY 2022 and FY 2023 a light green (about 30 percent opacity #76B900 over white) column sits at the 1H level, with a thin black arrow pointing from the FY 2022 1H segment to the FY 2023 bar. No legend. Highlighted points: the FY 2022 total and the 1H segments are the emphasised values. Right panel: four-line centred list of statements, no bullet markers, then a thin grey gradient divider line, then a second centred list. No photographs or icons apart from the NVIDIA logo.
Slide 22
Strong Gaming Fundamentals
340+ RTX Games and Applications
81%
2021
77%
2017
60%
3.1B
2.3B
#1
#1
#1
#1
42%
Video App
Photo App
3D App
Broadcast App
New generation, more gamers
Expanding universe of gamers and creators
Robust NVIDIA ecosystem
PC Gamers
Total Gamers
Boomers
Gen X
Millennials
Gen Z
Expanding reach to
110M Creators & Broadcasters
2:30
4:25
6:50
7:20
Hrs/Wk
Hrs/Wk
Hrs/Wk
Hrs/Wk
Source: NewZoo and NVIDIA internal analysis
Visuals: Panel 1 (left): bar chart titled by its caption 'New generation, more gamers'. Vertical green bars (#76B900) with no axis titles, a thin grey horizontal baseline under the bars, category labels Boomers, Gen X, Millennials, Gen Z beneath the baseline, and value labels above each bar: Boomers 42%, Gen X 60%, Millennials 77%, Gen Z 81%. Below the category labels, each bar has a second label: Boomers 2:30 Hrs/Wk, Gen X 4:25 Hrs/Wk, Millennials 6:50 Hrs/Wk, Gen Z 7:20 Hrs/Wk. No legend, no y-axis, no gridlines; bar heights are proportional to the printed percentages on a zero baseline. Panel 2 (centre): two grey-and-green donut charts with white centre holes. Left donut labelled 2017 with centre text 2.3B; green segment PC Gamers is about 27 percent of the ring, starting at 12 o'clock and running clockwise to about 3:30, grey segment Total Gamers is the remainder. Right donut labelled 2021 with centre text 3.1B; green segment is about 25 percent of the ring, from 12 o'clock to 3 o'clock, grey Total Gamers is the remainder. Legend beneath with a green square PC Gamers and a grey square Total Gamers. No axes, no units printed beyond B. Below, centred text reads Expanding reach to / 110M Creators & Broadcasters. Panel 3 (right): heading 340+ RTX Games and Applications in bold green; a row of four app icons, each a rounded-square or circular logo: Adobe Premiere Pro (dark navy square with Pr), Adobe Photoshop (dark blue square with Ps), Blender (orange and dark blue three-dimensional mark), OBS Studio (black circle with white ring). Under each icon, #1 in bold over Video App, Photo App, 3D App, Broadcast App. Below, a grid of about 32 game and application tiles in 8 columns by 4 rows, each tile a square cover image with small gaps; the visible tiles include Forza Horizon, Pandemic, Doom, Red Dead Redemption 2, Metro, Control, Unity, Streaming-style title in row 1; Premiere Pro, a dark title, OBS, Dying Light 2, Lightroom, Horizon, Darktide in row 2; Subnautica, Maya, Nioh-style title, a yellow tile, Fortnite Chapter 3, God of War, Evil Dead, Blender in row 3; a fantasy title, Icarus, a dark tile with red text, Photoshop, Minecraft Dungeons-style title, Ghostwire, a red-lettered title, and a teal tile in row 4. Tile titles that are not legible are not transcribed. The NVIDIA logo appears bottom-right, a green-and-black wordmark.
Slide 23
The Next Generation: Ada Lovelace / A quantum leap for gamers | Paves the way for fully simulated worlds / NVIDIA Architecture / 90 Shader / 200 RT / 300 OFA / 1,400 Tensor / 40 Shader / 78 RT / 126 OFA / 320 Tensor / 16 Shader / 49 RT / 130 Tensor / TOPs / Turing / Ampere / Ada / A Giant Leap in Processing / Throughput and Energy / Efficiency – up to 4x faster, / and over 2x the performance / at the same power / Shipping in October / NVIDIA
Visuals: Bar chart titled 'NVIDIA Architecture' with y-axis label 'TOPs' (no axis numbers printed, no range shown). Three stacked bars on a baseline: Turing (dark grey #5E5E5E segments, smallest bar, about 0 to 0.1 of height), Ampere (light grey #9A9A9A segments, about 0.35 of the Ada height), Ada (solid green #76B900, tallest). Ada segments labelled from top: 90 Shader, 200 RT, 300 OFA, 1,400 Tensor; Ampere segments labelled from top: 40 Shader, 78 RT, 126 OFA, 320 Tensor; Turing segments labelled from top: 16 Shader, 49 RT, 130 Tensor. No legend; no highlighted points beyond the green Ada bar. Photograph on right: three to four NVIDIA GeForce RTX graphics cards arranged in a diagonal row with the largest card in front labelled RTX 4090 and the others labelled RTX 4080 and RTX 3080 (smaller card at left, partly hidden). Cards are black with silver-grey trim and fans, shown on a black reflective floor with thin green grid lines receding to the back. Lighting is a soft spotlight from above, dominant colours black, silver and green. Full-bleed within a boxed rectangle, not cropped by a frame, with black background behind the text. Text overlaid on the left of the photo in white with green highlight.
Slide 24
Professional Visualization / Workstation graphics / Revenue ($M) / 20% 5-YR CAGR / $2,111 / $1,212 / $1,130 / $1,118 / $1,053 / $934 / 1H / 1H / FY 2018 / FY 2019 / FY 2020 / FY 2021 / FY 2022 / FY 2023 / Leader in Workstation Graphics / 90%+ market share in graphics / for workstations / 45M Designers and Creators / Strong software ecosystem with over 70 / supported applications / Growth Drivers / Ray Tracing and AI revolutionizing design / Expanding universe of designers and creators / Collaborative 3D design / Omniverse / Hybrid work environments
Visuals: Vertical bar chart titled 'Revenue ($M)' with the note '20% 5-YR CAGR' at its upper left. Categories along the x-axis: FY 2018, FY 2019, FY 2020, FY 2021, FY 2022, FY 2023. Values printed above each bar: FY 2018 $934; FY 2019 $1,130; FY 2020 $1,212; FY 2021 $1,053; FY 2022 $2,111; FY 2023 $1,118. No y-axis, gridlines or axis units are shown beyond the ($M) title; bar heights are proportional to the printed values. FY 2022 is a stacked bar: a lower dark green segment labelled 1H (about $1,000M of the total, estimated from its height) and an upper bright green segment. FY 2023 is a dark green bar labelled 1H, with a lighter translucent green wedge (about 30% opacity #76B900 over white, showing as #D6EAB3) rising from the FY 2022 1H top to the FY 2023 bar top with a thin black arrow pointing to the FY 2023 bar. The horizontal baseline is a thin grey line under the bars. Right panel contains no chart; a short horizontal gradient divider line (dark grey at centre, fading to white at both ends) separates the two text groups.
Slides 25 to 31 continue in the full text file.
Download this deck
The hosted PDF of every library deck is free for readers of the SlideDeck Co newsletter. Join with your email and the viewer and download appear here.
Preparing a results presentation or business update of your own? The SlideDeck Co Standard Deck is a slide library for business reviews, updates and plans.







