
Internet Trends 2019 is a data-heavy talk by Mary Meeker of Bond, presented at Code 2019 on June 11. It opens with a title slide, a Bond branded cover, an agenda listing eleven sections, and a thanks slide crediting contributors, including Hillhouse Capital for the China section. A context section then frames the report around data, consumer and regulator concerns, and the roles of commerce, advertising and usage. The main body moves through users and smartphone shipments, then e-commerce and online advertising, followed by usage topics such as gaming, video, voice, images and on-demand services. Later sections cover non-US internet businesses, data-driven fulfillment and financial services. The deck relies on large single-metric charts with headline-style titles, each stating the takeaway with a directional word such as solid, slowing or accelerating. Slides with bar and line combinations and short quoted executive comments give the sections their rhythm. It closes with the China section and the remaining sections, and the final slides point to specific companies as examples.
Slides worth studying
Questions about this deck
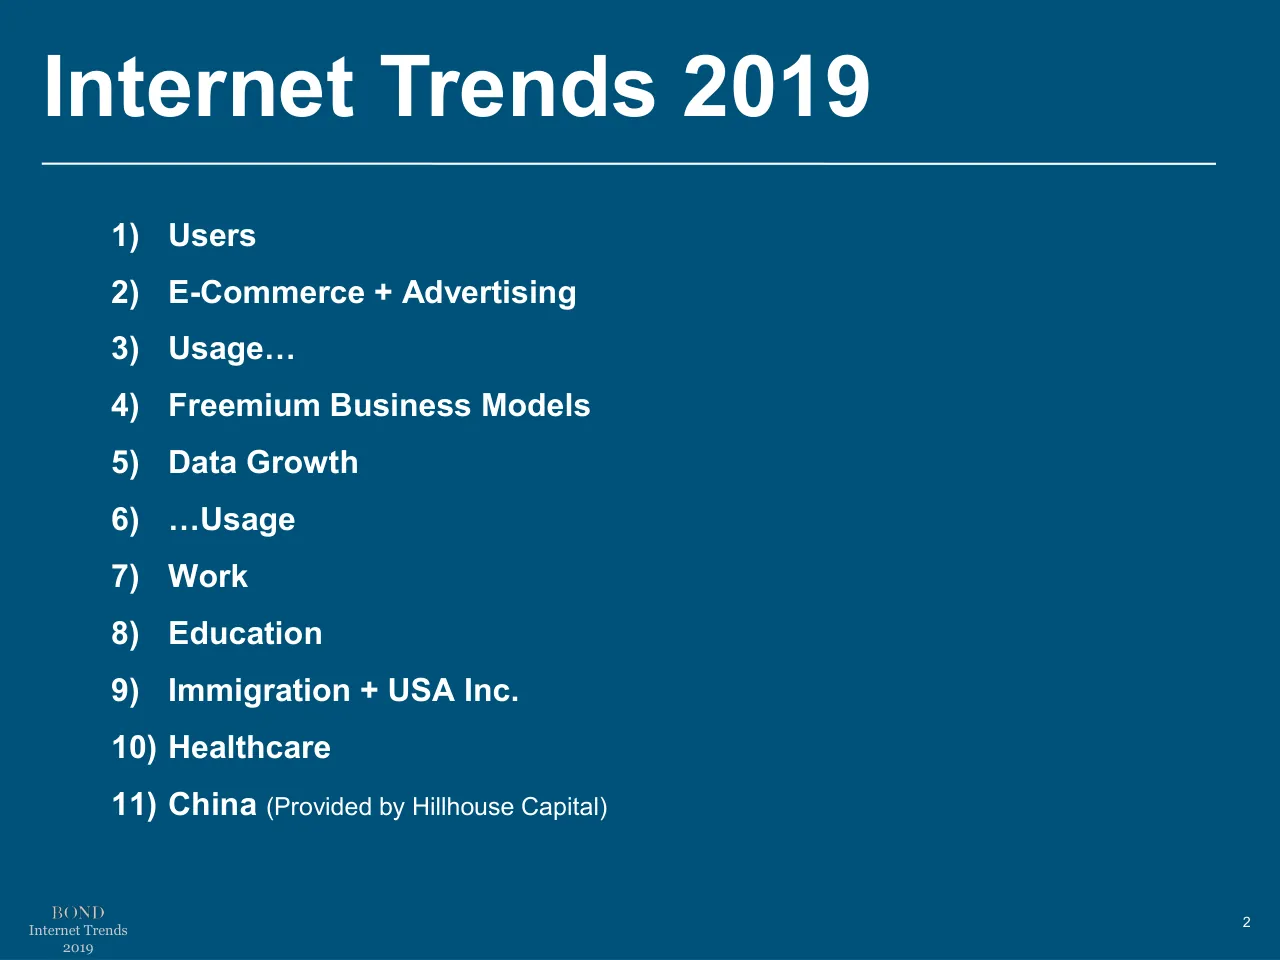
What does the Bond Internet Trends 2019 deck say about the structure of the deck and its agenda?
Slide 3 is the agenda, listing eleven sections from 1) Users through 11) China (Provided by Hillhouse Capital). The deck opens with a title slide on Slide 1 and closes with the China section and the remaining sections, according to its summary.
What does Mary Meeker's Bond Internet Trends 2019 deck say about e-commerce growth?
Slide 19, titled E-Commerce Growth, reads Solid +12.4% vs. +12.1% (Y/Y, Q1 vs. Q4). The chart on that slide shows E-Commerce Sales vs. Y/Y Growth, USA.
What does the Bond Internet Trends 2019 deck say about internet advertising spending?
Slide 24, titled Internet Ad Spending (Annual), is headlined Accelerated +22% vs. +21% Y/Y. The chart on that slide shows Internet Advertising Spend, USA, with a Y/Y Growth line, and cites IAB / PwC data.
What does the Bond Internet Trends 2019 deck say about market capitalization leaders?
Slide 13, titled Global Internet Market Capitalization Leaders, is headlined USA Stable @ 18 of 30 and China Stable @ 7 of 30. The slide's table ranks companies by market cap value on 6/7/19 and 6/7/16 with a % Change column.
Details
- Company: Mary Meeker, Bond
- Year: 2019
- Type: Conference talk
- Industry: Venture Capital
- Pages: 334
More from Mary Meeker
- Mary Meeker, Kleiner Perkins conference talk, 2018
- Mary Meeker, Kleiner Perkins conference talk, 2017
- Mary Meeker, Kleiner Perkins conference talk, 2016
- Mary Meeker, Kleiner Perkins conference talk, 2015
All Mary Meeker decks in the library
Review score: 7 out of 10, Effective
Presentation quality, judged with the SlideDeck Co review heuristic. Ask, evidence and idea merit are not rated here.
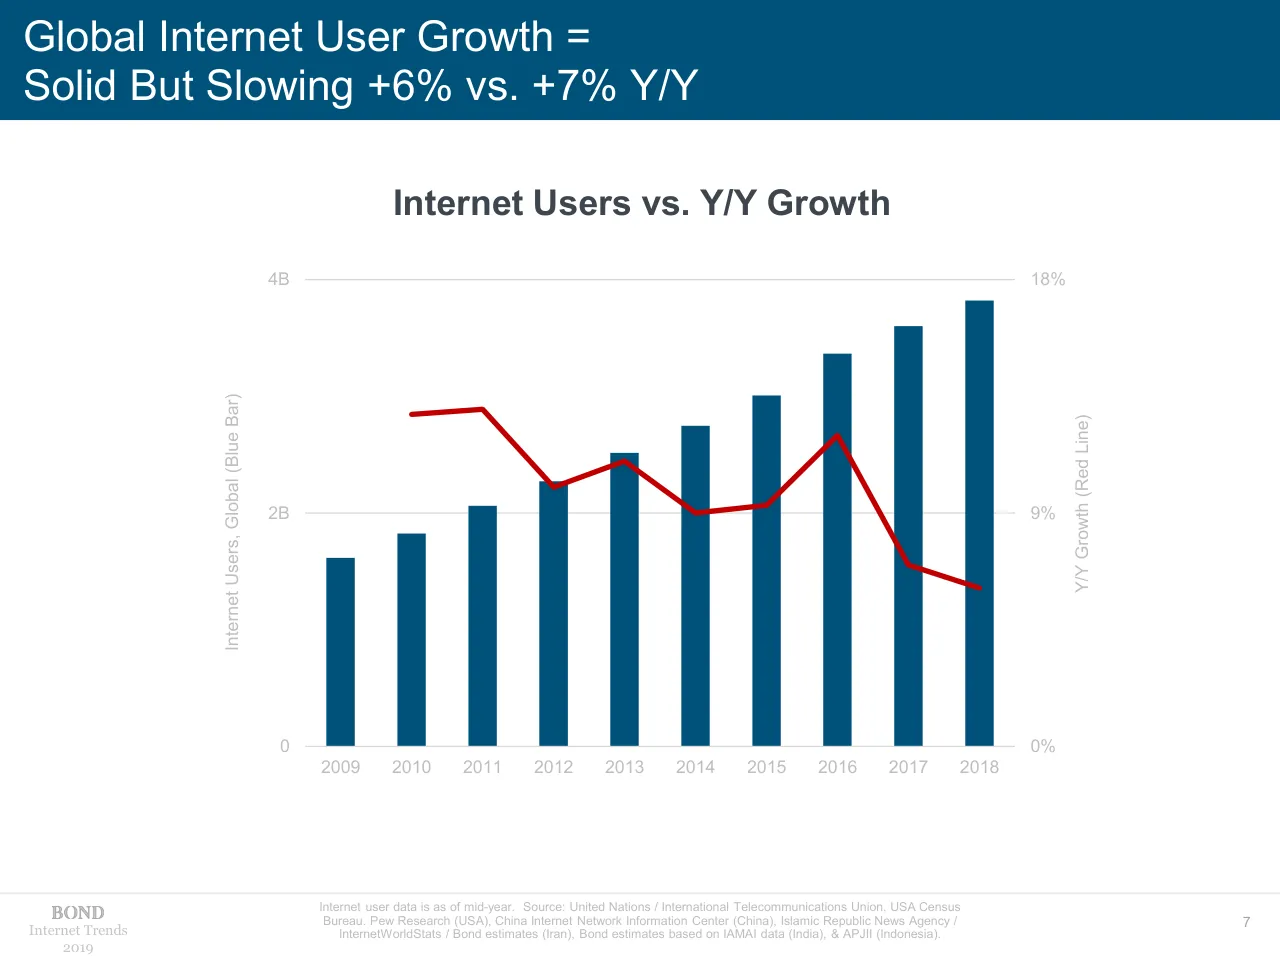
Each content slide has a headline in the blue band that states the takeaway with a directional word (slide 8, 'Solid But Slowing +6% vs. +7% Y/Y'), followed by one large chart in a consistent template. Sections are signposted by divider slides (7, 18, 22, 37, 41), so the route through the 72 pages I saw is easy to follow, and the later paired image and chart slides (58 to 71) use an effective repeated pattern. Weaknesses are consequential: axis labels, tick values and footnotes are pale grey and tiny (slide 8), several slides are dense or small (the tables on 14 and 15, the 6-paragraph text on 5 and 6), and about a dozen section dividers and empty blue-band slides add low-content pages. The deck reads well as a report but is hard to present on a screen, which holds it at competent.
Worth keeping: Keep the takeaway headline in the blue band over a single large chart, the consistent colour coding and the repeating image plus chart plus quote layout on slides 58 to 71.
Most useful repair: Raise the contrast and size of axis labels and tick values (slide 8), and break the text-only context slides 5 and 6 into short statements.
What would change the score: Cut or merge the stand-alone divider slides (18, 22, 37, 41, 43, 44, 46) and replace the dense market-cap tables on 14 and 15 with a simpler ranked chart.
Confidence medium. 72 of 334 pages inspected on contact sheets, 4 at readable size. Reviewed 2026-11-08. Model-assisted review (claude-sonnet-5-5).
Full text of the slides (334 slides)
Every slide's words and a description of its charts and images, so the deck can be searched and rebuilt. Also available as Markdown.
Slide 1
Internet Trends
2019
Mary Meeker
June 11 @ Code 2019
Slide 2
BOND
INTERNET TRENDS 2019
Mary Meeker
June 11 @ Code 2019
bondcap.com/report/it19
Visuals: One logo: the BOND wordmark, a high-contrast serif in all capitals, dark charcoal (#222622), centred at about 34.9% to 65.0% of slide width and 23% to 32.8% of slide height, on white. Thin horizontal lavender rule (#C9B6E4, about 0.1% of slide height) spanning about 11.9% to 88.1% of slide width at about 41.4% height. Two decorative bands: a navy top band and navy bottom band (#00517A), each 3.6% of slide height, each with a thin lavender edge stripe on its inner side. No photographs, charts or icons.
Slide 3
Internet Trends 2019
1) Users
2) E-Commerce + Advertising
3) Usage…
4) Freemium Business Models
5) Data Growth
6) …Usage
7) Work
8) Education
9) Immigration + USA Inc.
10) Healthcare
11) China (Provided by Hillhouse Capital)
2
BOND
Internet Trends
2019
Slide 4
Thanks / Bond Partners / Michael Brogan & Ansel Parikh helped steer ideas & did a lot of heavy lifting. Noah Knauf, / Collin Ebert, Jesse Ellingworth, Everett Randle, Nancy Xiao, Daegwon Chae, Paul Vronsky & / Juliet de Baubigny also dug in & were more than on call with help. / Hillhouse Capital / Liang Wu & colleagues’ contribution of the China section provides an overview of the world’s / largest market of Internet users. / Participants in Evolution of Internet Connectivity / From creators to consumers who keep us on our toes 24x7 & the people who directly help us / prepare the report. And, Kara & team, thanks for continuing to do what you do so well. / 3 / BOND / Internet Trends / 2019
Visuals: none apart from a small BOND wordmark logo in the bottom-left footer: a bold serif grey wordmark reading BOND in a 60 by 15 pixel image, rendered in light grey roughly #B4B4B4. No photographs, charts, tables or diagrams.
Slide 5
Context…
We use data to tell stories of business-related trends we focus on. We hope others take the ideas, build
on them & make them better.
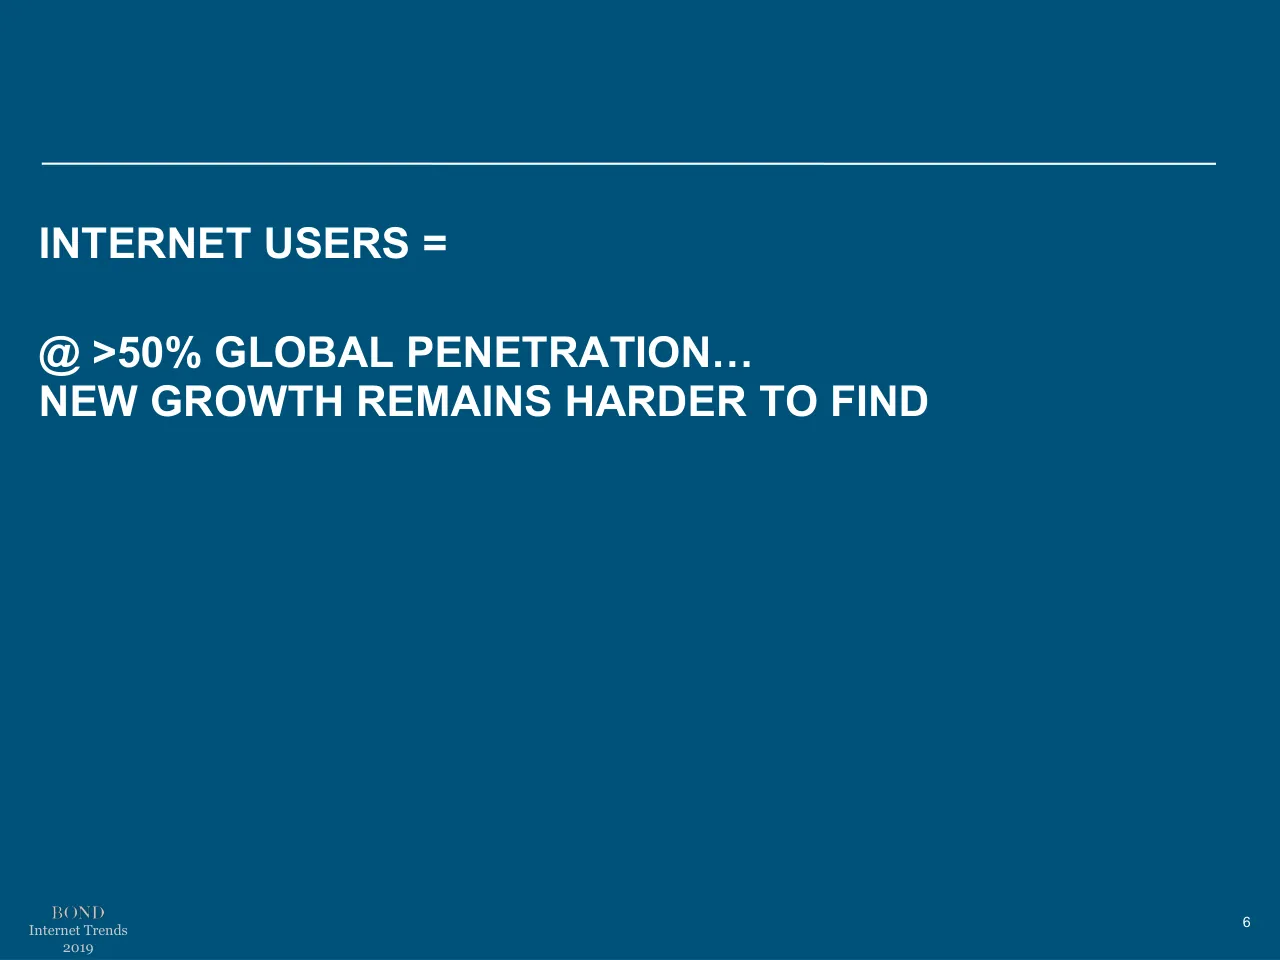
At 3.8B, the number of Internet users comprises more than half the world’s population. When markets
reach mainstream, new growth is harder to find as evinced by declining new smartphone shipments in
2018. While E-Commerce continues to gain share vs. physical retail, growth rates are slowing. While
Internet advertising growth is solid & innovation is healthy, there are areas where customer acquisition
costs may be rising to unsustainable levels.
While Internet user growth is slowing, global innovation & competition continue to drive product
improvements, new types of usage & monetization – especially in areas of digital video, voice,
wearables, on-demand + local services & traditionally underserved markets. Outside of USA, we focus
on especially high growth & innovation in data-driven / direct fulfillment & financial services. We highlight
massive global usage changes related to the evolution of images & interactive gaming as
communications tools & the broad emergence of freemium businesses at scale.
The rapid rise of gathered / analyzed digital data is often core to the holistic success of the fastest
growing & most successful companies of our time around the world. Context-rich data can help
businesses provide consumers with increasingly personalized products & services that can often be
obtained at lower prices & delivered more efficiently. This, in turn, can drive higher customer satisfaction.
Better data-driven tools can improve the ability for consumers to communicate directly & indirectly with
businesses & regulators.
Core constituents (consumers / businesses / regulators) are increasingly drinking from a data firehose &
management challenges continue to rise for all parties. Broad awareness of challenges (& related
vigorous / heated debates) can be the first step in driving change.
BOND
Internet Trends
2019
4
Visuals: Only one non-text element: a small grey serif wordmark logo reading 'BOND' (placed image, 60 by 15 pixels) at the bottom left of the footer, above the words 'Internet Trends' and '2019'. There is no chart, photograph, diagram or icon. A thin light grey horizontal rule runs across the full width just above the footer at about 93% of the slide height (estimated).
Slide 6
...Context
Consumers are aware of concerns about Internet usage overload & are taking steps to reduce usage –
leading USA-based Internet platforms have rolled out tools to help monitor usage & social media usage
growth appears to be decelerating following a period of strong growth. Privacy & problematic content
concerns are also top-of-mind & are following similar patterns.
Owing to social media amplification, reveals / actions / reactions about events can occur quickly –
resulting in both good & bad outcomes. In markets where online real-time rating systems exist,
accountability can be improved vs. offline options as consumers & businesses interact directly while
regulators can also benefit.
Rapidly expanding connectivity has helped amplify voices of good & bad actors. This has brought new
focus to an age-old challenge for regulators around the world – finding the most effective ways to amplify
good & minimize bad, often resulting in different regional interpretations & strategies.
As Internet systems become increasingly sophisticated, data-rich & mission critical, so has the opportunity
for cyber attacks. We are in a new era of cyber security where technology issues are increasingly
intermixed with international diplomacy & defense.
We focus on the impact of the Internet on work (via on-demand services & remote options), education &
healthcare – the materiality of current trends imply inflections are occurring. We update USA trending
around government finances & the importance of immigration to the technology sector.
The Hillhouse Capital team provides insights into China – the largest market of Internet users & a leader
in innovation / scale.
5
Internet Trends
2019
BOND
Visuals: none apart from the small BOND wordmark logo in the footer (raster image, 60 by 15 pixels, grey serif wordmark reading BOND, placed at about x 4.1%, y 94.4%, w 4.0%, h 1.3%).
Slide 7
INTERNET USERS =
@ >50% GLOBAL PENETRATION…
NEW GROWTH REMAINS HARDER TO FIND
BOND
Internet Trends
2019
6
Visuals: A thin white horizontal rule spanning from about x 3.3% to x 96.7% at about y 17% of the slide height, roughly 0.3% of the slide height thick. A small BOND logo image (60 by 15 pixels, a light grey wordmark) sits at the bottom-left above the footer text. No photographs, charts, or diagrams.
Slide 8
Global Internet User Growth = / Solid But Slowing +6% vs. +7% Y/Y / Internet Users vs. Y/Y Growth / 4B / 18% / Y/Y Growth (Red Line) / 2B / 9% / Internet Users, Global (Blue Bar) / 0 / 0% / 2009 / 2010 / 2011 / 2012 / 2013 / 2014 / 2015 / 2016 / 2017 / 2018 / 7 / Internet Trends / 2019 / Internet user data is as of mid-year. Source: United Nations / International Telecommunications Union, USA Census Bureau. Pew Research (USA), China Internet Network Information Center (China), Islamic Republic News Agency / InternetWorldStats / Bond estimates (Iran), Bond estimates based on IAMAI data (India), & APJII (Indonesia).
Visuals: Combo chart titled Internet Users vs. Y/Y Growth. Left axis labelled Internet Users, Global (Blue Bar) with ticks 0, 2B and 4B (billions of users). Right axis labelled Y/Y Growth (Red Line) with ticks 0%, 9% and 18%. Horizontal category axis labelled by year 2009 to 2018 with no axis title. Blue bars (#00517A) show internet users, about 1.6B in 2009, 1.8B in 2010, 2.05B in 2011, 2.3B in 2012, 2.5B in 2013, 2.75B in 2014, 3.0B in 2015, 3.35B in 2016, 3.6B in 2017 and 3.8B in 2018; these values are about estimates because the slide prints no bar values. Red line (#C00000, about 3 pt) shows Y/Y growth from 2010 to 2018, about 13% in 2010, about 13% in 2011, about 10% in 2012, about 11% in 2013, about 9% in 2014, about 9.3% in 2015, about 12% in 2016, about 7% in 2017 and about 6% in 2018; the line has no marker. Light grey horizontal gridlines at 4B, 2B and 0. No legend and no highlighted points; the axis titles act as the legend.
Slide 9
Global New Smartphone Unit Shipments =
Declining -4% vs. 0% Y/Y
New Smartphone Unit Shipments vs. Y/Y Growth
1.6B
75%
1.2B
50%
0.8B
25%
New Smartphone Shipments, Global
Y/Y Growth (Red Line)
0.4B
0%
Android iOS Other
0
-25%
2009
2010
2011
2012
2013
2014
2015
2016
2017
2018
8
BOND
Internet Trends
2019
Source: Katy Huberty @ Morgan Stanley (3/19), IDC.
Visuals: Chart: combined stacked column and line chart, titled 'New Smartphone Unit Shipments vs. Y/Y Growth'. Left vertical axis titled 'New Smartphone Shipments, Global', range 0 to 1.6B with ticks at 0, 0.4B, 0.8B, 1.2B, 1.6B. Right vertical axis titled 'Y/Y Growth (Red Line)', range -25% to 75% with ticks at -25%, 0%, 25%, 50%, 75%. Horizontal category axis labelled 2009 to 2018, one column per year. No values are printed on the bars or line, so all values below are estimates marked about. Stacked series, bottom to top: Android (dark blue #00517A), iOS (light grey #BFBFBF), Other (green #258B74). Estimated stack totals in billions: 2009 about 0.17 (Android about 0.01, iOS about 0.03, Other about 0.13); 2010 about 0.30 (Android about 0.07, iOS about 0.05, Other about 0.18); 2011 about 0.49 (Android about 0.24, iOS about 0.09, Other about 0.16); 2012 about 0.74 (Android about 0.50, iOS about 0.14, Other about 0.10); 2013 about 1.02 (Android about 0.81, iOS about 0.15, Other about 0.06); 2014 about 1.32 (Android about 1.06, iOS about 0.20, Other about 0.06); 2015 about 1.44 (Android about 1.17, iOS about 0.23, Other about 0.04); 2016 about 1.47 (Android about 1.25, iOS about 0.21, Other about 0.01); 2017 about 1.46 (Android about 1.25, iOS about 0.21, no visible Other); 2018 about 1.40 (Android about 1.19, iOS about 0.21, no visible Other). Red line series (Y/Y growth, right axis, plotted as a line with markers at each year, no markers visible): 2009 about 18%, 2010 about 74%, 2011 about 62%, 2012 about 47%, 2013 about 41%, 2014 about 28%, 2015 about 10%, 2016 about 2%, 2017 about -1%, 2018 about -4%. A black horizontal line at 0% spans the plot width. Legend below the chart, centred: Android, iOS, Other, with square markers in the series colours. No highlighted points. Logo: BOND wordmark, grey serif, bottom-left.
Slide 10
Global Internet Users =
3.8B >50% of Population
Internet Penetration, 2018
70%
51%
Global
24%
35%
Internet Penetration, Global
0%
2009
2010
2011
2012
2013
2014
2015
2016
2017
2018
9
BOND
Internet Trends
2019
Internet user data is as of mid-year. Source: United Nations / International Telecommunications Union, USA Census Bureau. Pew Research (USA), China Internet Network Information Center (China), Islamic Republic News Agency / InternetWorldStats / Bond estimates (Iran), Bond estimates based on IAMAI data (India), & APJII (Indonesia).
Visuals: Line chart titled 'Internet Penetration, 2018' (bold, Arial-style). Y-axis titled 'Internet Penetration, Global' with labelled ticks 0%, 35% and 70%, gridlines at those three values, range 0% to 70%, units percent. X-axis shows calendar years 2009 to 2018, one label per year, unit year. One series, a single thick green (#2FAE76) line with no markers. Printed values: 2009 = 24% and 2018 = 51%, both highlighted with bold green data labels above the line ends. Other points have no printed value; estimates read from the plot: 2010 about 27%, 2011 about 30%, 2012 about 33%, 2013 about 36%, 2014 about 39%, 2015 about 42%, 2016 about 46%, 2017 about 49%. No legend. Highlighted points are the 2009 and 2018 end points. A small BOND logo sits in the footer at the bottom left, rendered as grey serif wordmark text in a 60 by 15 pixel image.
Slide 11
Global Internet Users =
Asia Pacific Leads in Users + Potential
Internet Users by Region, 2018
Asia Pacific
53% of Global Internet Users
48% Internet User Penetration in Region
Europe
15%
78%
Africa & Middle East
13%
32%
Latin America & Caribbean
10%
62%
North America
9%
89%
0
3B
6B
Population
Internet Users
Non-Internet Users
BOND
Internet Trends
2019
Internet user data is as of mid-year. Source: United Nations / International Telecommunications Union, USA Census Bureau. Pew Research (USA), China Internet Network Information Center (China), Islamic Republic News Agency / InternetWorldStats / Bond estimates (Iran), Bond estimates based on IAMAI data (India), & APJII (Indonesia).
10
Visuals: Chart: horizontal stacked bar chart, title 'Internet Users by Region, 2018'. Value axis labelled 'Population' runs from 0 to 6B with tick labels 0, 3B and 6B (light grey, #BFBFBF), vertical light-grey gridlines (#D9D9D9) at 0, 3B and 6B. Category axis lists five regions top to bottom: Asia Pacific, Europe, Africa & Middle East, Latin America & Caribbean, North America. Two stacked series: Internet Users (dark blue #00517A, first segment) and Non-Internet Users (light grey #D9D9D9, second segment). Estimated values, read against the axis (no numeric bar values printed, so about): Asia Pacific Internet Users about 2.0B, Non-Internet Users about 2.2B, total about 4.2B; Europe about 0.6B and about 0.15B; Africa & Middle East about 0.5B and about 1.1B; Latin America & Caribbean about 0.4B and about 0.2B; North America about 0.3B and about 0.03B. Printed labels beside each bar, two lines each: Asia Pacific '53% of Global Internet Users' and '48% Internet User Penetration in Region'; Europe '15%' and '78%'; Africa & Middle East '13%' and '32%'; Latin America & Caribbean '10%' and '62%'; North America '9%' and '89%'. No bars are highlighted. Legend below the axis: dark blue square then 'Internet Users', light grey square then 'Non-Internet Users'. Logo: small grey BOND wordmark (serif, bottom-left), image about 60 by 15 pixels.
Slide 12
Global Internet Users = / China @ 21% of Total...India @ 12%...USA @ 8% / Internet Users – Top Countries, 2018 / China / India / United States / Indonesia / Brazil / Japan / Russia / Mexico / Germany / The Philippines / United Kingdom / Iran (I.R.) / Nigeria / France / Turkey / 0 / 0.8B / 1.6B / Internet Users / Non-Internet Users / BOND / Internet Trends / 2019 / Internet user data is as of mid-year. Source: United Nations / International Telecommunications Union, USA Census / Bureau. Pew Research (USA), China Internet Network Information Center (China), Islamic Republic News Agency / / InternetWorldStats / Bond estimates (Iran), Bond estimates based on IAMAI data (India), & APJII (Indonesia). / 11
Visuals: Horizontal stacked bar chart titled 'Internet Users – Top Countries, 2018'. X-axis: units are billions of people (labels 0, 0.8B, 1.6B), with vertical light grey gridlines at 0, 0.8B and 1.6B; the axis runs from 0 to about 1.6B and the plot extends slightly past 1.6B. Y-axis: 15 countries listed top to bottom in this order: China, India, United States, Indonesia, Brazil, Japan, Russia, Mexico, Germany, The Philippines, United Kingdom, Iran (I.R.), Nigeria, France, Turkey. Two stacked series per bar: Internet Users (navy #00517A, left segment) and Non-Internet Users (light grey #D9D9D9, right segment). No values are printed on the bars; estimates follow, marked about. China: Internet Users about 0.80B, Non-Internet about 0.58B, total about 1.38B. India: Internet Users about 0.45B, Non-Internet about 0.84B, total about 1.29B. United States: about 0.29B and about 0.04B, total about 0.33B. Indonesia: about 0.17B and about 0.09B, total about 0.26B. Brazil: about 0.14B and about 0.07B, total about 0.21B. Japan: about 0.11B and about 0.01B, total about 0.12B. Russia: about 0.11B and about 0.03B, total about 0.14B. Mexico: about 0.08B and about 0.05B, total about 0.13B. Germany: about 0.07B and about 0.01B, total about 0.08B. The Philippines: about 0.06B and about 0.04B, total about 0.10B. United Kingdom: about 0.06B, no visible grey segment. Iran (I.R.): about 0.05B and about 0.03B, total about 0.08B. Nigeria: about 0.06B and about 0.14B, total about 0.20B. France: about 0.05B and about 0.02B, total about 0.07B. Turkey: about 0.05B and about 0.03B, total about 0.08B. Legend: navy square labelled Internet Users, light grey square labelled Non-Internet Users, in a horizontal row below the axis. No highlighted points. Sorted in descending order of total users. Also a BOND wordmark logo bottom left, a small grey rule across the footer, and no photographs or icons.
Slide 13
Global Internet Market Capitalization Leaders = / USA Stable @ 18 of 30…China Stable @ 7 of 30 / Rank / Market Cap Value ($B) / 2019 / Company / Region / 6/7/19 / 6/7/16 / % Change / 1 Microsoft USA $1,007B $410B +146% / 2 Amazon USA 888 343 +159% / 3 Apple USA 875 540 +62% / 4 Alphabet USA 741 497 +49% / 5 Facebook USA 495 340 +46% / 6 Alibaba China 402 195 +106% / 7 Tencent China 398 206 +93% / 8 Netflix USA 158 43 +266% / 9 Adobe USA 136 50 +174% / 10 PayPal USA 134 46 +190% / 11 Salesforce USA 125 56 +123% / 12 Booking.com USA 77 67 +15% / 13 Uber USA 75 -- -- / 14 Recruit Holdings Japan 52 20 +167% / 15 ServiceNow USA 51 12 +316% / 16 Workday USA 48 16 +197% / 17 Meituan Dianping China 44 -- -- / 18 JD.com China 39 32 +22% / 19 Baidu China 38 60 (36%) / 20 Activision Blizzard USA 35 28 +25% / 21 Shopify Canada 34 2 +1,297% / 22 NetEase China 33 23 +44% / 23 eBay USA 33 28 +19% / 24 Atlassian Australia 32 5 +509% / 25 MercadoLibre Argentina 30 6 +388% / 26 Twitter USA 29 11 +173% / 27 Square USA 29 3 +808% / 28 Electronic Arts USA 29 23 +25% / 29 Xiaomi China 28 -- -- / 30 Spotify Sweden 25 -- -- / Total $6,119 $3,064 / 12 / Internet Trends / 2019 / USA stable at 18 of 30 refers to the fact that 19 USA companies were in the top 30 using same parameters in 2018. China in 2018 = 8 of 30. Source: CapitaIIQ data collected 6/7/19. / Note: % change only applies to companies that were publicly traded on 6/7/16, private valuations not taken into account. Reflects a global list of publicly traded companies, some companies / (e.g., Meituan Dianping) derive the majority of their revenue from one country. Companies selected are considered to be 'pureplay' Internet companies that do not derive a significant portion / of revenues / profits from other business lines. Example companies that would be included otherwise = Reliance Industries (Refining), AT&T (Telecom), & Naspers (Television).
Visuals: A data table with 9 columns: Rank (centred, 1 to 30), Company (left), Region (left), Market Cap Value ($B) 6/7/19 (right-aligned), Market Cap Value ($B) 6/7/16 (right-aligned), and % Change (right-aligned). The Market Cap Value group header sits over the two date columns and is underlined by a thick dark rule. Rows are: 1 Microsoft USA $1,007B $410B +146%; 2 Amazon USA 888 343 +159%; 3 Apple USA 875 540 +62%; 4 Alphabet USA 741 497 +49%; 5 Facebook USA 495 340 +46%; 6 Alibaba China 402 195 +106%; 7 Tencent China 398 206 +93%; 8 Netflix USA 158 43 +266%; 9 Adobe USA 136 50 +174%; 10 PayPal USA 134 46 +190%; 11 Salesforce USA 125 56 +123%; 12 Booking.com USA 77 67 +15%; 13 Uber USA 75 -- --; 14 Recruit Holdings Japan 52 20 +167%; 15 ServiceNow USA 51 12 +316%; 16 Workday USA 48 16 +197%; 17 Meituan Dianping China 44 -- --; 18 JD.com China 39 32 +22%; 19 Baidu China 38 60 (36%); 20 Activision Blizzard USA 35 28 +25%; 21 Shopify Canada 34 2 +1,297%; 22 NetEase China 33 23 +44%; 23 eBay USA 33 28 +19%; 24 Atlassian Australia 32 5 +509%; 25 MercadoLibre Argentina 30 6 +388%; 26 Twitter USA 29 11 +173%; 27 Square USA 29 3 +808%; 28 Electronic Arts USA 29 23 +25%; 29 Xiaomi China 28 -- --; 30 Spotify Sweden 25 -- --; then a Total row with $6,119 and $3,064 under the two date columns. Row text is coloured by region or status: China rows in red #C00000, USA rows in navy #1F497D, Japan in olive #4F6228, Canada in purple #7030A0, Australia in pink #DA9694, Argentina in cyan #00B0F0, Sweden in green #00B050. All % Change values are green #00B050 except Baidu (36%) which is red #C00000. Thin light grey horizontal rules separate the rows, a thick dark rule sits under the column header row and another above the Total row. Two white rectangles at x 28.7 and x 43.7 sit behind the header row. Two white 'B' glyphs at x 58.1 and x 67.2 are invisible on the white fill. A small BOND wordmark logo (60 by 15 pixels) is at bottom left. No photographs or charts.
Slide 14
Global Market Capitalization Leaders =
USA Stable @ 23 of 30…Technology Stable @ 9 of 30
Rank
Market Cap Value ($B)
2019 / Company / Sector / Region / 6/7/19 / B / 6/7/16 / B / % Change
1 / Microsoft / Technology / USA / $1,007B / $410B / +146%
2 / Amazon / Technology / USA / 888 / 343 / +159%
3 / Apple / Technology / USA / 875 / 540 / +62%
4 / Alphabet / Technology / USA / 741 / 497 / +49%
5 / Berkshire Hathaway / Financial Services / USA / 505 / 350 / +44%
6 / Facebook / Technology / USA / 495 / 340 / +46%
7 / Alibaba / Technology / China / 402 / 195 / +106%
8 / Tencent / Technology / China / 398 / 206 / +93%
9 / Visa / Financial Services / USA / 372 / 192 / +94%
10 / Johnson & Johnson / Healthcare / USA / 368 / 318 / +16%
11 / JPMorgan / Financial Services / USA / 354 / 239 / +48%
12 / Exxon Mobil / Energy / USA / 316 / 371 / (15%)
13 / Nestlé / Food / Beverages / Switzerland / 306 / 230 / +33%
14 / Walmart / Retail / USA / 303 / 221 / +37%
15 / ICBC / Financial Services / China / 285 / 224 / +27%
16 / Procter & Gamble / Home Goods / USA / 273 / 220 / +24%
17 / Mastercard / Financial Services / USA / 271 / 106 / +156%
18 / Bank of America / Financial Services / USA / 262 / 149 / +76%
19 / Royal Dutch Shell / Energy / Netherlands / 259 / 198 / +31%
20 / Samsung / Technology / South Korea / 249 / 166 / +50%
21 / Disney / Media / USA / 248 / 160 / +55%
22 / Cisco / Technology / USA / 239 / 146 / +64%
23 / Pfizer / Pharmaceuticals / USA / 238 / 212 / +12%
24 / AT&T / Telecom / USA / 237 / 242 / (2%)
25 / Verizon / Telecom / USA / 237 / 207 / +15%
26 / UnitedHealth / Healthcare / USA / 235 / 131 / +79%
27 / Roche / Healthcare / Switzerland / 233 / 224 / +4%
28 / Chevron / Energy / USA / 231 / 191 / +21%
29 / Coca-Cola / Food / Beverages / USA / 220 / 196 / +12%
30 / Home Depot / Retail / USA / 217 / 161 / +35%
Total / $11,264 / $7,385
USA stable at 23 of 30 refers to the fact that 21 USA companies were in the top 30 using same parameters in 2018. Technology in 2018 = 10 of 30.
Source: CapitalIQ data collected 6/7/19. Reflects a global list of publicly traded companies, some companies (e.g., ICBC) derive the majority of their revenue from one country.
BOND / Internet Trends / 2019 / 13
Visuals: Table. Columns: Rank (2019), Company, Sector, Region, Market Cap Value ($B) with sub-columns 6/7/19 and 6/7/16, and % Change. Rows, in order, with values as printed: 1 Microsoft, Technology, USA, $1,007B, $410B, +146%; 2 Amazon, Technology, USA, 888, 343, +159%; 3 Apple, Technology, USA, 875, 540, +62%; 4 Alphabet, Technology, USA, 741, 497, +49%; 5 Berkshire Hathaway, Financial Services, USA, 505, 350, +44%; 6 Facebook, Technology, USA, 495, 340, +46%; 7 Alibaba, Technology, China, 402, 195, +106%; 8 Tencent, Technology, China, 398, 206, +93%; 9 Visa, Financial Services, USA, 372, 192, +94%; 10 Johnson & Johnson, Healthcare, USA, 368, 318, +16%; 11 JPMorgan, Financial Services, USA, 354, 239, +48%; 12 Exxon Mobil, Energy, USA, 316, 371, (15%); 13 Nestlé, Food / Beverages, Switzerland, 306, 230, +33%; 14 Walmart, Retail, USA, 303, 221, +37%; 15 ICBC, Financial Services, China, 285, 224, +27%; 16 Procter & Gamble, Home Goods, USA, 273, 220, +24%; 17 Mastercard, Financial Services, USA, 271, 106, +156%; 18 Bank of America, Financial Services, USA, 262, 149, +76%; 19 Royal Dutch Shell, Energy, Netherlands, 259, 198, +31%; 20 Samsung, Technology, South Korea, 249, 166, +50%; 21 Disney, Media, USA, 248, 160, +55%; 22 Cisco, Technology, USA, 239, 146, +64%; 23 Pfizer, Pharmaceuticals, USA, 238, 212, +12%; 24 AT&T, Telecom, USA, 237, 242, (2%); 25 Verizon, Telecom, USA, 237, 207, +15%; 26 UnitedHealth, Healthcare, USA, 235, 131, +79%; 27 Roche, Healthcare, Switzerland, 233, 224, +4%; 28 Chevron, Energy, USA, 231, 191, +21%; 29 Coca-Cola, Food / Beverages, USA, 220, 196, +12%; 30 Home Depot, Retail, USA, 217, 161, +35%. Total row: $11,264 and $7,385. Row colours: China rows 7, 8, 15 in red #C00000; Switzerland rows 13 and 27 and the Food/Beverages-type text in brown #974706; Royal Dutch Shell row 19 in gold #FFC000; Samsung row 20 in black #000000; all others navy #1F497D; % Change positive values green #00B050, negative values (15%), (2%) in red #C00000. Market cap values for rows 2 to 30 have no $ sign; only row 1 and the Total row carry $. The 6/7/19 and 6/7/16 headers are light grey #BFBFBF and the 2019 rank header is light grey #BFBFBF; a thin grey rule separates each row.
Slide 15
Global Internet Market Capitalization Leader Revenue Growth =
Slowing +11% vs. +13% (Y/Y – Q1 vs. Q4)
Global Internet Leaders – Revenue vs. Y/Y Growth
$400B
30%
Revenue (Blue Bar)
Y/Y Growth (Red Line)
$200B
15%
$0
0%
Q1:16 Q2:16 Q3:16 Q4:16 Q1:17 Q2:17 Q3:17 Q4:17 Q1:18 Q2:18 Q3:18 Q4:18 Q1:19
14
BOND
Internet Trends
2019
Source: CapitaIIQ. Revenue from Microsoft / Amazon / Apple / Alphabet / Facebook / Tencent / Alibaba / Netflix / Adobe / PayPal / Salesforce.com / Booking.com /
Recruit Holdings / ServiceNow / Workday / JD.com / Baidu / Activision Blizzard / Shopify / NetEase / eBay / Atlassian / MercadoLibre / Electronic Arts / Twitter / Square.
Note: *Uber, Meituan Dianping, Xiaomi and Spotify which had recent IPOs that did not provide detailed financials from Q1:15-Q4:16 that are necessary
to illustrate the Y/Y growth rate & are therefore excluded. Due to their revenue scale relative to the cumulative group, they have minimal impact on overall growth rate.
Visuals: Combo chart titled Global Internet Leaders – Revenue vs. Y/Y Growth. Left vertical axis labelled Revenue (Blue Bar) with ticks $0, $200B, $400B (range $0 to $400B). Right vertical axis labelled Y/Y Growth (Red Line) with ticks 0%, 15%, 30% (range 0% to 30%). Horizontal category axis with 13 quarters Q1:16 to Q1:19, no axis title. Light grey horizontal gridlines at $200B, $400B and $0 baseline. Series 1, Revenue, dark teal #00517A columns, one per quarter, values not printed; about values read from bar tops: Q1:16 about $167B, Q2:16 about $167B, Q3:16 about $178B, Q4:16 about $236B, Q1:17 about $197B, Q2:17 about $204B, Q3:17 about $222B, Q4:17 about $297B, Q1:18 about $255B, Q2:18 about $259B, Q3:18 about $275B, Q4:18 about $335B, Q1:19 about $284B. Series 2, Y/Y growth, dark red #C00000 line with no markers, values not printed; about values read from the line: Q1:16 about 7.8%, Q2:16 about 9.8%, Q3:16 about 13.4%, Q4:16 about 16.0%, Q1:17 about 18.2%, Q2:17 about 22.6%, Q3:17 about 25.0%, Q4:17 about 25.9%, Q1:18 about 29.2%, Q2:18 about 26.5%, Q3:18 about 23.3%, Q4:18 about 12.7%, Q1:19 about 11.3%. No legend; series identified by axis titles. No highlighted points. Logo: BOND wordmark in the footer, grey serif bold, a small raster image of 60 by 15 pixels.
Slide 16
Global Market Capitalization Leader Revenue Growth =
Slowing +2% vs. +7% (Y/Y – Q1 vs. Q4)
Global Leaders – Revenue vs. Y/Y Growth
$1,200B
16%
Revenue (Blue Bar)
Y/Y Growth (Red Line)
$600B
0%
$0
-16%
Q1:16 Q2:16 Q3:16 Q4:16 Q1:17 Q2:17 Q3:17 Q4:17 Q1:18 Q2:18 Q3:18 Q4:18 Q1:19
Source: CapitaIIQ. Revenue from Microsoft / Amazon / Apple / Alphabet / Berkshire Hathaway / Facebook / Tencent / Alibaba / Visa / Johnson & Johnson / JPMorgan / Exxon Mobil / Walmart / ICBC / Procter & Gamble / Bank of America / Samsung / Disney / Cisco / Pfizer / AT&T / Verizon / UnitedHealth / MasterCard / Chevron / Coca-Cola / Home Depot. Nestle & Royal Dutch Shell quarterly revenue excluded due to bi-annual earnings releases.
15
BOND
Internet Trends
2019
Visuals: Combo chart titled 'Global Leaders – Revenue vs. Y/Y Growth'. Left y-axis 'Revenue (Blue Bar)' in US dollars billions, range $0 to $1,200B with labelled ticks at $0, $600B and $1,200B. Right y-axis 'Y/Y Growth (Red Line)' in percent, range -16% to 16% with labelled ticks at -16%, 0% and 16%. X-axis categories Q1:16 through Q1:19 (13 quarters). Series 1, blue bars in #00517A, approximate values read from the axis (about values, none printed): Q1:16 about $746B; Q2:16 about $785B; Q3:16 about $796B; Q4:16 about $873B; Q1:17 about $837B; Q2:17 about $859B; Q3:17 about $885B; Q4:17 about $1,005B; Q1:18 about $946B; Q2:18 about $980B; Q3:18 about $1,008B; Q4:18 about $1,077B; Q1:19 about $966B. Series 2, red line #C00000 about 3 pt, approximate Y/Y growth values (none printed): Q1:16 about -2%; Q2:16 about -1%; Q3:16 about +1%; Q4:16 about +5%; Q1:17 about +12%; Q2:17 about +9%; Q3:17 about +11%; Q4:17 about +15%; Q1:18 about +13%; Q2:18 about +14%; Q3:18 about +14%; Q4:18 about +7%; Q1:19 about +2%. A dark horizontal line at 0% (#2A3137) spans the plot width, marking the zero growth level. No legend; the axis titles name the series. No points are highlighted. A small BOND wordmark logo appears in the footer.
Slide 17
E-COMMERCE + ONLINE ADVERTISING = / (blank line) / SOLID… / BUT SLOWING GROWTH / BOND / Internet Trends / 2019 / 16
Visuals: A thin white horizontal rule spanning most of the slide width, and a small grey 'BOND' wordmark logo in the bottom-left footer. No photographs, charts, tables or diagrams.
Slide 18
E-Commerce
17
BOND
Internet Trends
2019
Visuals: Non-text elements: (1) a BOND wordmark logo image, 60 by 15 pixels, at bottom left above the 'Internet Trends' footer line, showing the word BOND in bold grey serif capitals (about #A6A6A6 to #C8C8C8), not boxed. (2) A thin horizontal light grey rule (about #E6E6E6, about 0.1% of slide height) spanning the full slide width at about y 93%, above the footer. No photographs, charts, tables or icons.
Slide 19
E-Commerce Growth =
Solid +12.4% vs. +12.1% (Y/Y – Q1 vs. Q4)
E-Commerce Sales vs. Y/Y Growth, USA
$140B
20%
E-Commerce Sales (Blue Bar)
$70B
10%
Y/Y Growth (Red Line)
$0
0%
Q1 Q2 Q3 Q4 Q1 Q2 Q3 Q4 Q1 Q2 Q3 Q4 Q1 Q2 Q3 Q4 Q1 Q2 Q3 Q4 Q1 Q2 Q3 Q4 Q1 Q2 Q3 Q4 Q1 Q2 Q3 Q4 Q1 Q2 Q3 Q4 Q1
2010 2011 2012 2013 2014 2015 2016 2017 2018 2019
Source: St. Louis Federal Reserve FRED database. Note: Historic data (Pre-2016) adjusted / back-casted in 2017 by
USA Census Bureau to better align with Annual Retail Trade + Monthly Retail Trade Survey data. Seasonally adjusted.
BOND
Internet Trends
2019
18
Visuals: Combined bar and line chart. Title: 'E-Commerce Sales vs. Y/Y Growth, USA' (bold). Left axis titled 'E-Commerce Sales (Blue Bar)' in $ billions, range $0 to $140B with gridlines at $0, $70B and $140B. Right axis titled 'Y/Y Growth (Red Line)' in percent, range 0% to 20% with labels at 0%, 10% and 20%. Series 1, bars: 37 quarterly bars from Q1 2010 to Q1 2019, dark blue, rising steadily; no values printed, so estimates: Q1 2010 about $39B, Q1 2019 about $138B (the tallest bar). Series 2, red line (Y/Y growth): starts around Q2 2010 at about 17%, peaks near Q1 2011 at about 19.5%, falls to about 10% around Q1 2013 and about 11% in 2014, rises to about 14% by Q4 2017 and drops to about 12% by Q4 2018, ending at about 12.4% at Q1 2019. Quarter labels Q1 to Q4 sit under each bar, grouped under year labels 2010 to 2019 with short light grey underline brackets. Legend: none; series are identified by axis titles. Highlighted points: none. Headline values in title: Q1 +12.4% and Q4 +12.1% Y/Y. Logo: BOND wordmark (small image, 60 by 15 pixels) at bottom-left.
Slide 20
Physical Retail Growth =
Solid +2.0% vs. +1.6% (Y/Y – Q1 vs. Q4)
Physical Retail Sales vs. Y/Y Growth, USA
$800B
10%
Physical Retail Sales, USA (Blue Bar)
$400B
0%
Y/Y Growth (Red Line)
$0
-10%
2000
2001
2002
2003
2004
2005
2006
2007
2008
2009
2010
2011
2012
2013
2014
2015
2016
2017
2018 2019
Q1 Q2 Q3 Q4 (repeated for each year, 2000 Q1 to 2019 Q1)
Source: St. Louis Federal Reserve FRED Database. Note: Physical Retail includes
all retail sales excluding food services, motor vehicles / auto parts & fuel.
BOND
Internet Trends
2019
19
Visuals: Chart: combo bar and line chart, type column plus line, titled Physical Retail Sales vs. Y/Y Growth, USA. Left vertical axis labelled Physical Retail Sales, USA (Blue Bar), range $0 to $800B with labelled ticks at $0, $400B and $800B. Right vertical axis labelled Y/Y Growth (Red Line), range -10% to 10% with labelled ticks at -10%, 0% and 10%. Horizontal category axis of quarters from 2000 Q1 to 2019 Q1, with year labels 2000 to 2019 and quarter tick labels Q1 to Q4. Series 1: blue columns in #00517A, one per quarter, showing Physical Retail Sales in USD billions; no values are printed, so values are about: about $460B in 2000 Q1 rising steadily to about $600B around 2007, dipping to about $500B around 2009 Q2 to Q3 (the trough, about $300B to $400B range lower than prior peak is not printed; trough is about $200B to $250B on the bars), recovering to about $600B by 2011, and reaching about $760B at 2019 Q1. Series 2: red line in about #C00000, showing Y/Y growth in percent; no values are printed, so about +4% to +6% in 2001 to 2005 with a peak about +6% near 2005, falling to about 0% to -1% around 2008, dipping to a low of about -4% around 2009, then about +2% to +4% from 2010 to 2019 with a high about +5% in 2017 and a value of about +2.0% in 2019 Q1. Legend: none; the axis titles identify the blue bars and red line. Highlighted points: none. Horizontal black line at 0% (level with $400B) across the plot. Light grey gridline at $800B / 10% at the top of the plot.
Slide 21
E-Commerce Share = / Gains Continue @ 15% of Retail vs. 14% Y/Y / E-Commerce as % of Retail Sales, USA / 16% / E-Commerce Share / 8% / 0% / 2000 2001 2002 2003 2004 2005 2006 2007 2008 2009 2010 2011 2012 2013 2014 2015 2016 2017 2018 2019 / Source: USA Census Bureau, St. Louis Federal Reserve FRED database. Note: 15% = Annualized share. Penetration calculated by dividing / E-Commerce sales by “Core” Retail Sales (excluding food services, motor vehicles / auto parts, gas stations & fuel). All figures are seasonally adjusted. / Per US Census Bureau, E-Commerce is ~10% of total retails sales in Q1:19, including out-of-scope channels such as gas stations, fuel dealers, etc. / BOND / Internet Trends / 2019 / 20
Visuals: Line chart titled E-Commerce as % of Retail Sales, USA. Y axis titled E-Commerce Share, range 0% to 16%, gridlines and labels at 0%, 8% and 16%, units percent. X axis is quarterly from Q1 2000 to Q1 2019, with Q1 to Q4 tick labels in tiny grey text and year labels 2000 to 2019 beneath. One series drawn as a thick green line (about #33A96F), with no printed data labels, so values are estimated: about 1.4% at Q1 2000, about 2.0% around 2001, about 3.5% around 2003, about 5.0% around 2005, about 6.0% around 2007, a flat stretch near 6.0% in 2007 to 2008 with a dip to about 5.8% in 2008, about 7.0% in 2010, about 8.0% in 2012, about 9.5% in 2014, about 11.0% in 2016, about 13.0% in 2018, and about 15.4% at Q1 2019. No legend. No highlighted points. The line runs from the lower left to the upper right and ends at the top right near the 16% gridline without touching it. Gridlines are light grey horizontal lines at 8% and 16%, plus the baseline at 0%.
Slide 22
Online Advertising / BOND / Internet Trends / 2019 / 21
Visuals: None. The slide contains no charts, photographs, illustrations, diagrams or icons. The only graphic is the BOND wordmark in the footer, a 60 by 15 pixel image listed under elements.
Slide 23
Media Time vs. Advertising Spending = Mobile @ Equilibrium (2018)…Desktop (2015) % Time Spent in Media vs. % Advertising Spending 2010 50% 50% % of Time Spent in Media / Advertising Spending, 2010, USA 25% % of Time Spent in Media / Advertising Spending, 2018, USA 25% 2018 33% 33% 43% 43% 25% 19% 18% 18% 0% 0% Print Radio TV Desktop Mobile Print Radio TV Desktop Mobile Print Radio TV Desktop Mobile Desktop Mobile Desktop Mobile Mobile 8% 27% 0.5% 16% 12% 11% 8% 8% 7% 3% 34% 34% Time Spent Ad Spend Source: Internet & Mobile advertising spend based on IAB & PwC data for full year 2018 & 2010. Print advertising spend based on Magna Global estimates for full year 2018 & 2010. Print includes newspaper & magazine. Time spent share data based on eMarketer (10/18). Excludes out-of-home, video game & cinema advertising. BOND Internet Trends 2019 22
Visuals: Grouped vertical bar chart pair. Chart 1 title 2010 and chart 2 title 2018, both bold. Y axis labelled % of Time Spent in Media / Advertising Spending, 2010, USA (left chart) and % of Time Spent in Media / Advertising Spending, 2018, USA (right chart); scale 0% to 50% with gridlines at 0%, 25% and 50%; light grey gridlines. X categories: Print, Radio, TV, Desktop, Mobile. Each category has two bars: Time Spent (deep maroon #640F2A, or light pink #E03169 at 25% opacity for Print, Radio and TV) and Ad Spend (dark teal #00517A, or pale blue-grey #00517A at 25% opacity for Print, Radio and TV). 2010 values: Time Spent Print 8%, Radio 16%, TV 43%, Desktop 25%, Mobile 8%; Ad Spend Print 27%, Radio 11%, TV 43%, Desktop 19%, Mobile 0.5%. 2018 values: Time Spent Print 3%, Radio 12%, TV 34%, Desktop 18%, Mobile 33%; Ad Spend Print 7%, Radio 8%, TV 34%, Desktop 18%, Mobile 33%. Data labels sit above the bars for Desktop and Mobile in dark text and inside the top of the lighter bars in small grey-green text for other categories. Desktop and Mobile categories are bold. Legend: maroon square with Time Spent and teal square with Ad Spend, both small squares. A logo image (BOND) sits bottom left, approximately 60 by 15 pixels.
Slide 24
Internet Ad Spending (Annual)=
Accelerated +22% vs. +21% Y/Y
Internet Advertising Spend
$120B
30%
$60B
15%
Internet Advertising Spend, USA (Bars)
Y/Y Growth (Red Line)
0
0%
2009
2010
2011
2012
2013
2014
2015
2016
2017
2018
Desktop Advertising
Mobile Advertising
Y/Y Growth
Source: IAB / PWC Internet 2018 Advertising Report (5/19).
BOND
Internet Trends
2019
23
Visuals: Chart: combination chart, stacked columns plus a line on a secondary axis. Chart title: Internet Advertising Spend (bold, #3C444C). Primary (left) y-axis: Internet Advertising Spend, USA (Bars), $0 to $120B, gridlines at $60B and $120B, light grey. Secondary (right) y-axis: Y/Y Growth (Red Line), 0% to 30%, labels at 0%, 15%, 30%. X-axis: years 2009 to 2018, categories. Series 1, Desktop Advertising (stacked bottom, dark blue #00517A), about values: 2009 $23B, 2010 $26B, 2011 $31B, 2012 $34B, 2013 $36.5B, 2014 $38B, 2015 $40B, 2016 $37B, 2017 $39B, 2018 $38B. Series 2, Mobile Advertising (stacked top, light grey #D9D9D9), about total column heights: 2009 $23B (no mobile visible), 2010 $26.5B, 2011 $32.5B, 2012 $38B, 2013 $43.5B, 2014 $50B, 2015 $61B, 2016 $74B, 2017 $87B, 2018 $107B. Series 3, Y/Y Growth (red line #C00000, about 3pt wide, no markers, drawn on right axis), about values: 2010 14.5%, 2011 22%, 2012 15.5%, 2013 17%, 2014 15.7%, 2015 20.5%, 2016 21.7%, 2017 21.5%, 2018 22.3%; no 2009 point. Legend below plot, in order: Desktop Advertising (dark blue swatch), Mobile Advertising (grey swatch), Y/Y Growth (red line swatch). No highlighted points. Logo: BOND wordmark in bottom-left corner.
Slide 25
Internet Ad Revenue (Quarterly – Leading USA Platforms) =
Decelerating +20% vs. +29% (Y/Y – Q1 vs. Q4)
Leading USA-Based Online Ad Platform Revenue, Global
$60B
40%
Y/Y Growth (Red Line)
Revenue (Blue Bar)
$30B
20%
$0
0%
Q1:17
Q2:17
Q3:17
Q4:17
Q1:18
Q2:18
Q3:18
Q4:18
Q1:19
24
BOND
Internet Trends
2019
Source: Company public releases & Morgan Stanley estimates. Note: Includes Google / Facebook / Twitter / Amazon / Snapchat / Pinterest.
Visuals: Chart: combination column and line chart, titled 'Leading USA-Based Online Ad Platform Revenue, Global'. Left axis titled 'Revenue (Blue Bar)' in $ billions, range $0 to $60B with gridlines at $30B and $60B. Right axis titled 'Y/Y Growth (Red Line)' in percent, range 0% to 40%, with ticks at 20% and 40%. X-axis categories: Q1:17, Q2:17, Q3:17, Q4:17, Q1:18, Q2:18, Q3:18, Q4:18, Q1:19. Series 1, blue columns (revenue, $B; values are about estimates, no values printed): Q1:17 about 32, Q2:17 about 35, Q3:17 about 38, Q4:17 about 45, Q1:18 about 44, Q2:18 about 47, Q3:18 about 49, Q4:18 about 58, Q1:19 about 53. Series 2, red line (Y/Y growth, %; about estimates, no values printed): starts at Q1:18 about 37%, Q2:18 about 35%, Q3:18 about 31%, Q4:18 about 29%, Q1:19 about 20%; no points for Q1:17 to Q4:17. No legend. Highlighted points: none; the Q1:19 line point is the lowest. Logo: small BOND wordmark in grey serif at bottom left, 60 by 15 pixels.
Slide 26
Internet Ad Platforms =
Google + Facebook Lead But Others Gaining Share
Select USA-Based Advertising Platform Revenue, Global
$40B
$20B
$0
+1.4x
+1.9x
Amazon / Twitter /
Snap / Pinterest
+2.6x
Q1:17 Q2:17 Q3:17 Q4:17 Q1:18 Q2:18 Q3:18 Q4:18 Q1:19
Source: Company public releases & Morgan Stanley estimates.
BOND
Internet Trends
2019
25
Visuals: Chart: three grouped bar charts (small multiples) of select USA-based advertising platform revenue, global, quarterly from Q1:17 to Q1:19 (9 quarters labelled Q1:17, Q2:17, Q3:17, Q4:17, Q1:18, Q2:18, Q3:18, Q4:18, Q1:19), on a shared y-axis in US dollars billions from $0 to $40B with gridlines at $20B and $40B. No values are printed; estimates are marked about. Panel 1, Google (green #00B050, 10 bars, the Q1:17 to Q1:19 labels repeated): about $21B, $23B, $24B, $27B, $27B, $28B, $29B, $32.5B, $31B, with an arrow rising from the lower left to the upper right labelled 'Google / +1.4x' in green. Panel 2, Facebook (navy #00517A, 9 bars): about $8B, $9B, $10B, $13B, $12B, $13B, $13.5B, $16.5B, $15B, with an arrow labelled 'Facebook / +1.9x' in navy. Panel 3, Amazon / Twitter / Snap / Pinterest (maroon #640F2A, 9 bars): about $1.5B, $1.6B, $1.9B, $2.7B, $2.9B, $3.1B, $3.5B, $4.6B, $3.7B, with an arrow labelled 'Amazon / Twitter / Snap / Pinterest / +2.6x' in maroon. Each arrow is a straight line with a solid arrowhead, rising left to right. No legend; series identified by panel colour and label. No highlighted points. The BOND logo is a small image of the wordmark, 60 by 15 pixels, placed bottom left.
Slide 27
Internet Ad Buying = Programmatic Gains vs. Direct Continue…
Negatively Impacting Pricing
Programmatic Buying – % Digital Display Advertising, Global
80%
62%
% Display Advertising Spend Programmatic, Global
40%
10%
0%
2012
2013
2014
2015
2016
2017
2018
26
BOND
Internet Trends
2019
Source: Publicis / Zenith 2018 Programmatic Marketing Forecast. Note: Programmatic refers to ads bought both via real-time bidding
& non real-time algorithmically-driven ad purchases. Does not include non-display advertising (e.g., Search)
Visuals: Line chart titled 'Programmatic Buying – % Digital Display Advertising, Global'. Y-axis: '% Display Advertising Spend Programmatic, Global', range 0% to 80% with gridlines at 0%, 40% and 80%. X-axis: years 2012 to 2018, one tick per year. One green series (#00B050) with a 3pt-looking line; labelled values: 2012 = 10%, 2018 = 62%. Values for 2013 to 2017 are not printed; about 20% in 2013, about 35% in 2014, about 44% in 2015, about 51% in 2016, about 57% in 2017. Labelled points are the 10% point at 2012 and the 62% point at 2018, both labelled in bold green. No legend. Gridlines light grey, axis labels light grey #BFBFBF.
Slide 28
Ad Share Gain Drivers =
Better Targeting + New Creative + Commerce + High-Relevance
YouTube
Targeting
Audience Customization
Machine Learning
Automatically Time-Edited Clips
Commerce
Shoppable Catalogs
High-Relevance
Promoted Tweets
BOND
Internet Trends
2019
Source: Facebook / Google / Pinterest / Twitter
27
Visuals: Four portrait device screenshots in a row, each with a thick dark slate-grey (#2A3137) border and square corners, boxed not cropped. (1) Facebook, left column: a Facebook 'Why am I seeing this ad?' ad-preference screen. At the top is a flat illustration of three browser windows with images, a light blue (#8FCBE8) band behind them. Body text reads: One reason you're seeing this ad is that [Kit and Ace] wants to reach people who may have visited their website or used one of their apps. This is based on information provided by Kit and Ace. There may be other reasons you're seeing this ad, including that Kit and Ace wants to reach men ages 18 to 64 who live or were recently in the United States. This is information based on your Facebook profile and where you've connected to the internet. A row at the bottom reads Manage your ad preferences / Take control over the ads you see, with a round thumbnail and a chevron. The bottom edge shows a faint grey ABOUT THIS ADVERTISER strip, cut off. Light grey (#D9D9D9) footer band. (2) YouTube, second column: a dark-mode YouTube mobile video screen. A YouTube header bar in charcoal (#2B2B2B) with the YouTube logo and search and menu icons. Below is a video still of a person in a dark blue-lit scene with a blue glow, a black letterbox strip above and a red progress bar at the bottom. Under it: Grubhub | Blizzard, 5.8M views, action icons (thumbs up 2, thumbs down 2, Share, Save, Report), channel Grubhub 5.3K subscribers with a red SUBSCRIBE button, and a recommended card GOURMET MAKES S1 • E18 Pastry Chef Attempts to Make Gourmet Doritos |... Bon Appétit, Recommended for you, New, with a 46:50 duration thumbnail. The video still is a 390 by 229 pixel frame overlapping the upper part of the screen. (3) Pinterest, third column: a white mobile screen headed by 8:08 AM and a Shop Levi's® bar with a red Levi's logo. A 2x2 grid of product photos, each with a grey (#E8E8E8) backdrop and a levi.com tag: Oversized Sherpa Trucker Jacket (model in light denim jacket with brown faux-fur collar), Levi's Made in Japan Boyfriend Trucker... (model in denim jacket), Levi's Baggy Sherpa (model in denim sherpa jacket), Levi's Extra Long Trucker Jacket (model in long denim coat). Bottom tab bar with red Pinterest icon labelled Home, Following, Notifications, Saved. (4) Twitter, right column: a white iOS-style search screen, 9:07 status bar, search field containing hbo, tabs Top (blue, underlined), Latest, People, Photos, Videos. A tweet from Cox @CoxComm (verified) reads Freeview is here! Binge hundreds of movies and tv shows now On Demand. Say "Freeview" into your Contour voice remote to start watching. Below is a blue (#1DA1F2) promotional card with white hand-lettered text Your BIGGEST PROBLEM PRICING... and tweet action icons with counts 3, 3, 25. Labelled Promoted with a flag icon. Bottom tab bar with settings, search (blue), notifications with badge 3, and mail icons. Logo: BOND wordmark in grey serif at bottom left.
Slide 29
Customer Acquisition Cost (CAC) = / Rising in Highly Competitive / Capitalized Sectors / Cost Per User Activation – Mobile Finance Apps, Global per Liftoff / $60 / $30 / Average Cost per User Activation, Global / $0 / 1/17 / 4/17 / 7/17 / 10/17 / 1/18 / 4/18 / 7/18 / 10/18 / 1/19 / 28 / BOND / Internet Trends / 2019 / Source: Liftoff’s 2019 / 2018 Mobile Finance App Report. Note: Report draws from internal Liftoff Data from 2/1/17 to 3/31/19, spanning 19B+ ad impressions across 5MM+ App installs, 270MM+ clicks & 3MM activations / registrations. Data focused on North America, Europe, Middle East, Africa & Asia Pacific. Note: Activation = Adding & depositing funds to an account, activating a spending card, opening an equities position or starting a paid subscription.
Visuals: One line chart. Type: line chart with a dotted linear trendline. Title: Cost Per User Activation – Mobile Finance Apps, Global per Liftoff (bold, dark grey #3E464E, printed above the chart). Y axis: titled Average Cost per User Activation, Global (rotated vertical, light grey #BFBFBF), range $0 to $60, labelled ticks $0, $30, $60, with light grey horizontal gridlines at $30 and $60 and a baseline at $0. X axis: time in months, labelled every third month 1/17, 4/17, 7/17, 10/17, 1/18, 4/18, 7/18, 10/18, 1/19 (light grey #BFBFBF labels), series spanning roughly 1/17 to 3/19. Series: one solid green line (#00AA50 approximately, about 3 pt) with estimated values, marked 'about' because no values are printed: about $30 at 1/17, about $29 at 2/17, about $35 at 3/17, about $38 at 4/17, about $36 at 5/17, about $33 at 6/17, about $37 at 7/17, about $34 at 8/17, about $39 at 9/17, about $44 at 10/17, about $34 at 11/17, about $35 at 12/17, about $29 at 1/18, about $30 at 2/18, about $25 at 3/18, about $25 at 4/18, about $35 at 5/18, about $38 at 6/18, about $49 at 7/18, about $43 at 8/18, about $43 at 9/18, about $37 at 10/18, about $42 at 11/18, about $42 at 12/18, about $41 at 1/19, about $33 at 2/19, about $46 at 3/19. Trendline: dotted green line rising from about $32 at the start to about $40 at the end. Legend: none. Highlighted points: none; the peak about $49 at 7/18 and the final point are the highest and most recent.
Slide 30
Reality =
CAC Can’t Exceed LTV for Very Long
CAC = Customer Acquisition Cost. LTV = Lifetime Value.
29
BOND
Internet Trends
2019
Slide 31
Effective + Efficient Marketing =
One’s Own Product +
Happy Customers + Recommendations
BOND
Internet Trends
2019
30
Visuals: Decorative solid navy rectangle forming a band across the top of the slide. Small grey BOND wordmark logo (placed image, 60 by 15 px) at bottom-left. Thin light grey horizontal rule above the footer across the full width. No charts, photographs, illustrations or diagrams.
Slide 32
Effective + Efficient Marketing =
Can Be Free Trial / Tier
Online Streaming – Reasons For Trying New Service
Free Trial / Tier
42%
Free Trial
42%
Content Library
38%
Access to Exclusive Content
29%
Good User Experience
26%
0%
25%
50%
BOND
Internet Trends
2019
Source: 2BrightCove / YouGov survey of 10,502 adults in USA, UK, France, Australia, Germany, Canada & UAE, 9/18.
31
Visuals: Horizontal bar chart titled 'Online Streaming – Reasons For Trying New Service'. Four categories, top to bottom: Free Trial / Tier 42%, Content Library 38%, Access to Exclusive Content 29%, Good User Experience 26%. Value axis runs 0% to 50% with labelled gridlines at 0%, 25% and 50% (vertical light-grey gridlines at 0, 25 and 50); no unit beyond the percent sign. Values are printed at the end of each bar. Single series; no legend. The Free Trial / Tier bar is the highlighted point: dark blue #00517A with a bold label and bold value, while the other three bars are light grey #D9D9D9 with grey labels #BFBFBF. The bars are about 4.7% of slide height each, evenly spaced. The BOND wordmark in the footer is a small grey logo image of 60 by 15 pixels.
Slide 33
Happy Customers…
Spotify = Free User Conversion to Paid Subscribers…
Free Ad-Supported Product…
…Rising LTV / Subscriber Acquisition Cost Ratio
Morgan Stanley LTV:CAC Estimate
4x
3.0x
2x
1.5x
0x
2015
2016
2017
2018
Lifetime Value of Premium Subscribers (Adjusted for Advertising
Revenue from Free Users) / Subscriber Acquisition Cost
Our freemium model accounts for
~60% of our gross added premium subscribers...
the ad-supported service is a subsidy program
that offsets costs of new subscriber acquisition.
Developing a better user experience
produces by far the most viral effect &
impact when investing in growth.
Engagement drives conversion from
free consumption to paid subscription.
Barry McCarthy – CFO, Spotify, 3/18
Source: Spotify releases & Morgan Stanley estimates of LTV & SAC. Barry McCarthy @ Spotify Investor Day (3/18). Note: Morgan Stanley estimates LTV by
calculating the value of a subscriber (including advertising revenue they generate before they upgrade to a paid user) accounting for gross margin & churn.
Subscriber acquisition cost calculated by dividing sales & marketing spend in a relevant period by the number of new subscribers in the same period.
32
Internet Trends
2019
BOND
Monthly User Cohorts Since 2014
Visuals: 1) Photograph-style line chart screenshot, boxed with a dark grey border, not cropped, on the left column: titled 'Monthly User Cohorts Since 2014'; y-axis 'Subscriber / MAU' 0% to 60% in 15% steps; x-axis 'Months After Joining' 0 to 48 in steps of 2; about 30 thin light-green (#7FD67F-ish) cohort curves rising steeply over months 0–6 from about 5% to 25–30%, then flattening, ending roughly between 45% and 55% near months 40–48; faint blue gridlines on navy background. 2) Line chart on the right: title 'Morgan Stanley LTV:CAC Estimate' in light grey; y-axis title 'Lifetime Value of Premium Subscribers (Adjusted for Advertising / Revenue from Free Users) / Subscriber Acquisition Cost', unit multiple (x), range 0x to 4x with ticks at 0x, 2x, 4x; x-axis categories 2015, 2016, 2017, 2018. Solid green series (#00B050): 2015 1.5x, 2016 about 1.6x, 2017 about 2.3x, 2018 3.0x; labelled points 1.5x (2015) and 3.0x (2018). Dotted green series: 2015 about 1.2x, 2016 about 1.8x, 2017 about 2.4x, 2018 about 2.9x (unlabelled). No legend. Light grey horizontal gridlines at 0x, 2x and 4x. 3) BOND logo wordmark in grey serif type at bottom-left.
Slides 34 to 334 continue in the full text file.
Download this deck
The hosted PDF of every library deck is free for readers of the SlideDeck Co newsletter. Join with your email and the viewer and download appear here.
Building a deck of your own? The SlideDeck Co Standard Deck is a slide library for business presentations: reviews, updates and plans.







