
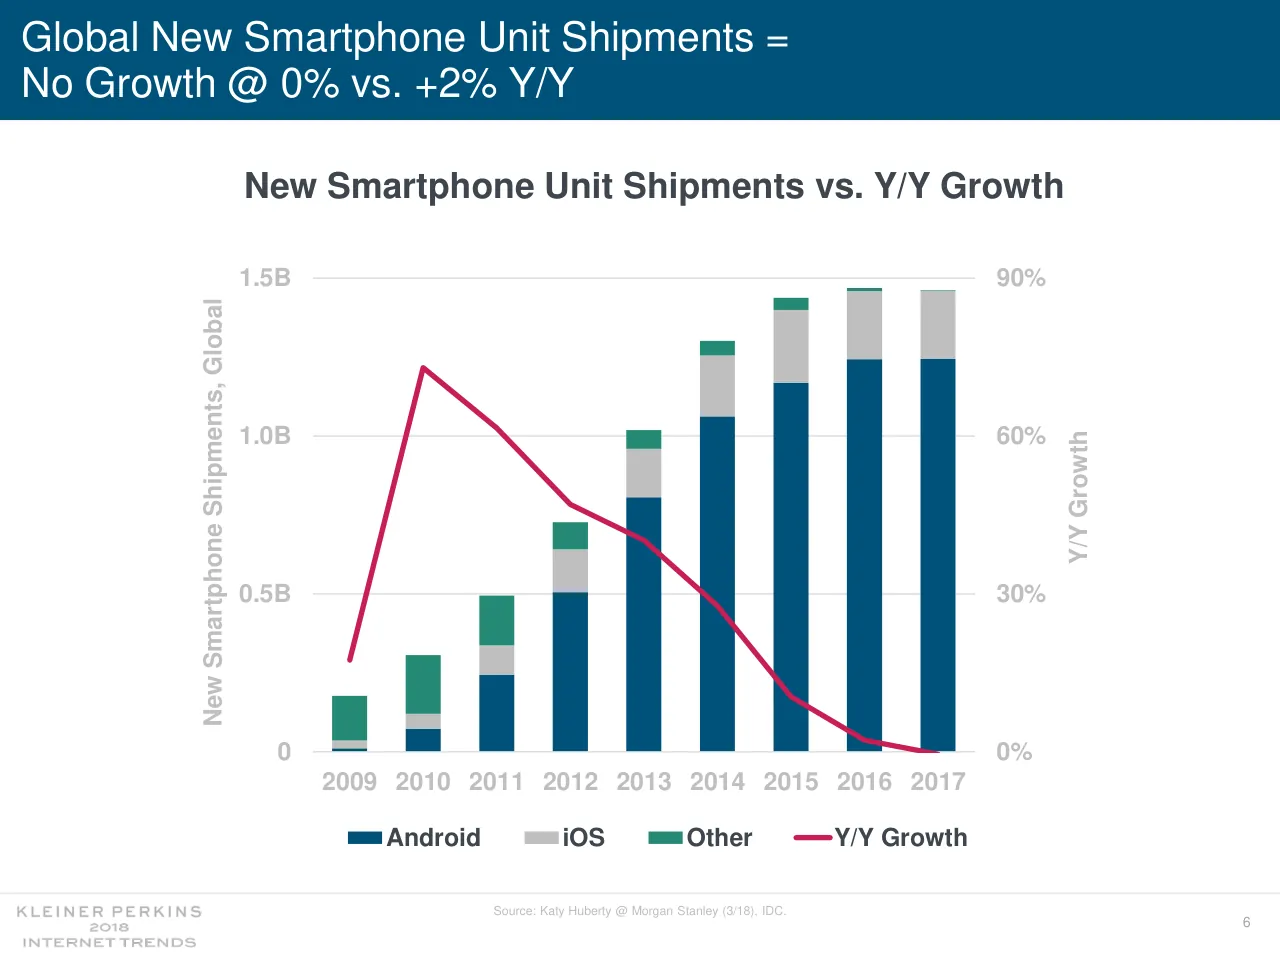
Mary Meeker's Internet Trends 2018 was presented at the Code 2018 conference on May 30, 2018, and published by the venture firm Kleiner Perkins. It opens with a title slide, a credits slide thanking contributors, and a context slide that frames the report around data, personalization, R&D spending, e-commerce, consumer spending, the consumerization of enterprise software, and China. A table of contents then lists twelve sections in order: users, usage, innovation and competition with scrutiny, e-commerce, advertising, consumer spending, work, data gathering and optimization, economic growth drivers, China, enterprise software, and USA Inc. and immigration. Each section opens with a short title slide, followed by charts that each carry one headline claim, such as the flat growth in smartphone shipments and the rise in internet users past half the world's population. The deck is built around data slides with headline-style titles and small-type source notes. Slides worth studying include the smartphone shipment chart that pairs bars with a growth line, the section divider slides, and the contents slide, which uses numbered sections with page references.
Slides worth studying
Questions about this deck
How many slides does the Mary Meeker, Kleiner Perkins Internet Trends 2018 deck have?
The deck is listed as having 295 pages. The slides supplied for this review are numbered through slide 38.
What sections does the Mary Meeker, Kleiner Perkins Internet Trends 2018 deck cover?
The table of contents on slide 5 lists twelve sections, from Users (pages 5-9) through USA Inc. + Immigration (pages 278-291). The sections in order are Users, Usage, Innovation + Competition + Scrutiny, E-Commerce, Advertising, Consumer Spending, Work, Data Gathering + Optimization, Economic Growth Drivers, China, Enterprise Software, and USA Inc. + Immigration.
What does the Mary Meeker, Kleiner Perkins Internet Trends 2018 deck say about smartphone shipments?
Slide 7 is titled 'Global New Smartphone Unit Shipments = No Growth @ 0% vs. +2% Y/Y' and charts global shipments against year-over-year growth from 2009 to 2017. Slide 6 frames the section as 'Internet Devices + Users = Growth Continues to Slow'.
What does the Mary Meeker, Kleiner Perkins Internet Trends 2018 deck say about internet users?
Slide 9 is titled 'Global Internet Users = 3.6B @ >50% of Population (2018)' and charts internet penetration from 2009 to 2017. Slide 4 states that at 3.6B, the number of Internet users has surpassed half the world's population.
Details
- Company: Mary Meeker, Kleiner Perkins
- Year: 2018
- Type: Conference talk
- Industry: Venture capital
- Pages: 295
More from Mary Meeker
- Mary Meeker, Bond conference talk, 2019
- Mary Meeker, Kleiner Perkins conference talk, 2017
- Mary Meeker, Kleiner Perkins conference talk, 2016
- Mary Meeker, Kleiner Perkins conference talk, 2015
All Mary Meeker decks in the library
Review score: 8 out of 10, Strong
Presentation quality, judged with the SlideDeck Co review heuristic. Ask, evidence and idea merit are not rated here.
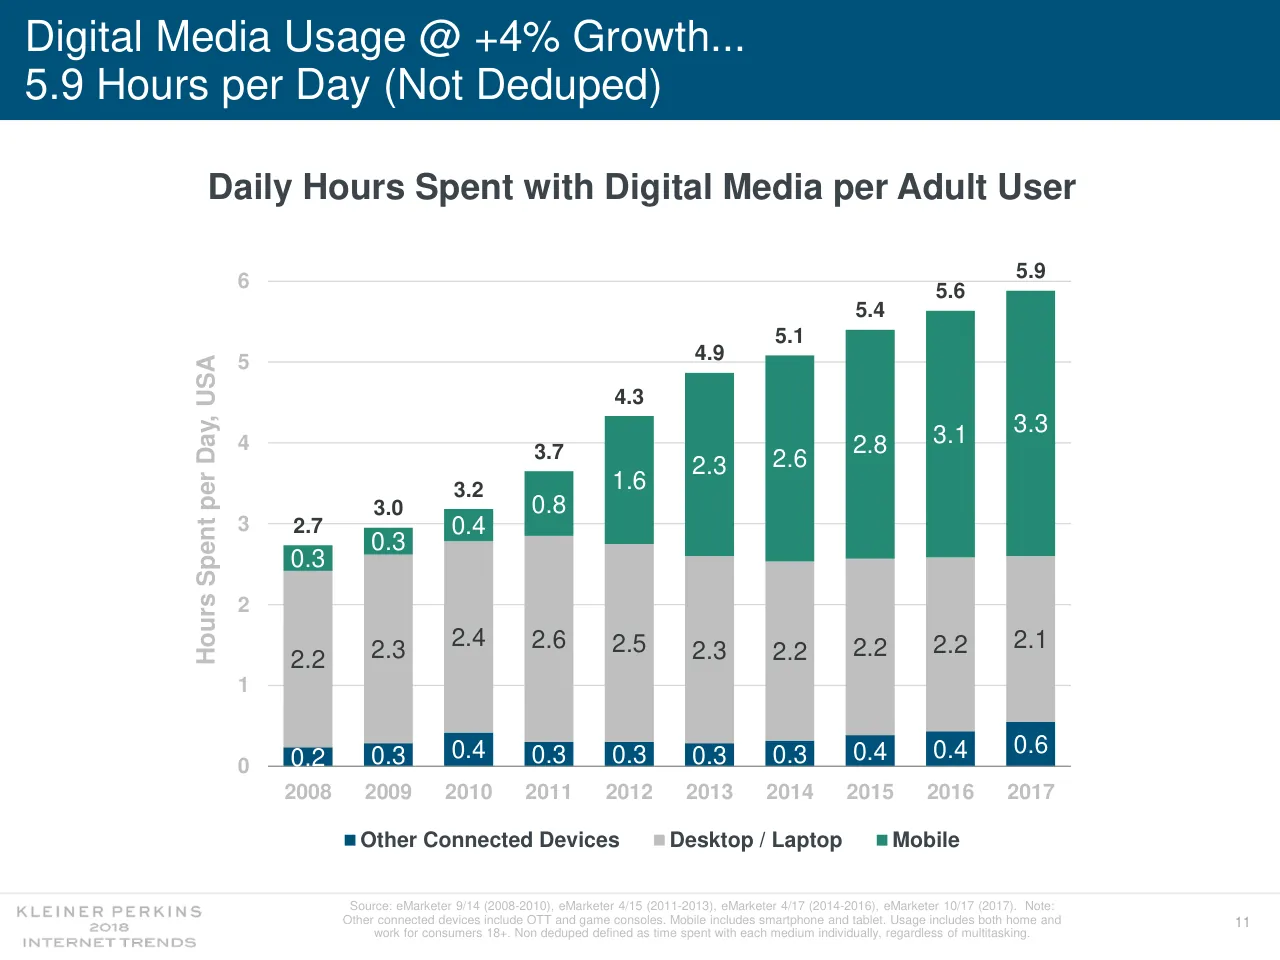
Across the 72 pages inspected, almost every chart slide carries a full-sentence headline in the blue bar that states the takeaway (slides 7, 12, 40, 48), with one chart and a clear chart title, so a reader gets the point in seconds. The route is easy to follow: contents (slide 5), blue section dividers (slides 6, 45), and repeated recap slides (slides 16, 29, 60, 62, 66, 68) keep the audience oriented through a very long deck. The visual system is consistent and disciplined, with clean charts, direct labels on slide 12, and a restrained palette. Weaknesses are tiny, near-illegible source notes, faint axis labels, some sparse text-only slides, and a very long run of similar-looking pages that is better suited to reading than to presenting.
Worth keeping: Keep the takeaway headline in the blue bar over a single clean chart, the numbered contents slide, and the recap slides that highlight the current point in a list (slides 62, 66, 68).
Most useful repair: Enlarge the source notes and the pale axis labels so they can be read at normal size, and fill the near-empty bars on the untitled text slides (slides 10, 13, 29) with a real title or remove the bar.
What would change the score: I would trim or merge the run of near-identical tool and product slides in the e-commerce section (slides 49 to 60) and add more variation in layout to break the rhythm.
Confidence medium. 72 of 295 pages inspected on contact sheets, 4 at readable size. Reviewed 2026-11-08. Model-assisted review (claude-sonnet-5-5).
Full text of the slides (295 slides)
Every slide's words and a description of its charts and images, so the deck can be searched and rebuilt. Also available as Markdown.
Slide 1
O
Internet Trends
2018
Mary Meeker
May 30 @ Code 2018
Visuals: One logo mark: a pale blue-grey serif lowercase-style 'O' glyph formed by a pair of parentheses-like curves enclosing an O, centred horizontally near the top of the slide, roughly 6% of slide width. No photographs, charts or other graphics.
Slide 2
INTERNET TRENDS 2018 / Mary Meeker / May 30 @ Code 2018 / KLEINER PERKINS / kleinerperkins.com/InternetTrends
Visuals: Two non-text images. (1) Kleiner Perkins logo icon: a 110 by 109 pixel mark centred horizontally at about x 47.4 to 52.9 percent and y 62.4 to 69.7 percent. It is a dark grey (#4A4A4A) rounded square with a white diagonal notch cut from the upper-left and lower-right, forming a stylised arrow or pennant shape. (2) Kleiner Perkins wordmark: the letters KLEINER PERKINS in widely letter-spaced, light grey capitals, placed centred at x 22.7 to 77.3 percent and y 75.6 to 80.6 percent, image 1070 by 73 pixels. No chart, table, photograph or diagram.
Slide 3
Thanks
Kleiner Perkins Partners
Ansel Parikh & Michael Brogan helped steer ideas and did a lot of heavy lifting. Other
contributors include: Daegwon Chae, Mood Rowghani, Eric Feng (E-Commerce) & Noah
Knauf (Healthcare). In addition, Bing Gordon, Ted Schlein, Ilya Fushman, Mamoon Hamid,
Juliet deBaubigny, John Doerr, Bucky Moore, Josh Coyne, Lucas Swisher, Everett Randle &
Amanda Duckworth were more than on call with help.
Hillhouse Capital
Liang Wu & colleagues’ contribution of the China section provides an overview of the world’s
largest market of Internet users.
Participants in Evolution of Internet Connectivity
From creators to consumers who keep us on our toes 24x7 + the people who directly help us
prepare the report. And, Kara & team, thanks for continuing to do what you do so well.
2
Visuals: Logo: the Kleiner Perkins 2018 Internet Trends logo in the bottom-left corner, set in light grey (about #A6A6A6) with widely letter-spaced capitals reading KLEINER PERKINS on top, 2018 in the centre, and INTERNET TRENDS below it; it is placed as a boxed image, not cropped, with no overlay. A second image of the wordmark KLEINER PERKINS overlaps the upper part of the logo block. A thin horizontal light grey rule (about #E0E0E0, roughly 0.1% of slide height) runs full width at about y 93%, above the logo. No photographs, charts, tables or diagrams.
Slide 4
Context
We use data to tell stories of business-related trends we focus on. We hope others take the ideas, build on
them & make them better.
At 3.6B, the number of Internet users has surpassed half the world’s population. When markets reach
mainstream, new growth gets harder to find - evinced by 0% new smartphone unit shipment growth in
2017.
Internet usage growth is solid while many believe it’s higher than it should be. Reality is the dynamics of
global innovation & competition are driving product improvements, which, in turn, are driving usage &
monetization. Many usability improvements are based on data - collected during the taps / clicks /
movements of mobile device users. This creates a privacy paradox...
Internet Companies continue to make low-priced services better, in part, from user data. Internet Users
continue to increase time spent on Internet services based on perceived value. Regulators want to ensure
user data is not used ‘improperly.’
Scrutiny is rising on all sides - users / businesses / regulators. Technology-driven trends are changing so
rapidly that it’s rare when one side fully understands the other...setting the stage for reactions that can have
unintended consequences. And, not all countries & actors look at the issues through the same lens.
We focus on trends around data + personalization; high relative levels of tech company R&D + Capex
Spending; E-Commerce innovation + revenue acceleration; ways in which the Internet is helping
consumers contain expenses + drive income (via on-demand work) + find learning opportunities. We review
the consumerization of enterprise software and, lastly, we focus on China’s rising intensity & leadership in
Internet-related markets.
3
Visuals: Logo: Kleiner Perkins 2018 Internet Trends wordmark at bottom-left, grey, stacked in three lines reading KLEINER PERKINS / 2018 / INTERNET TRENDS, spaced capitals. No photographs, charts or other graphics.
Slide 5
Internet Trends 2018
1) Users
5-9
2) Usage
10-12
3) Innovation + Competition + Scrutiny
13-43
4) E-Commerce
44-94
5) Advertising
95-99
6) Consumer Spending
100-140
7) Work
141-175
8) Data Gathering + Optimization
176-229
9) Economic Growth Drivers
230-237
10) China (Provided by Hillhouse Capital)
237-261
11) Enterprise Software
262-277
12) USA Inc. + Immigration
278-291
KLEINER PERKINS
2018
INTERNET TRENDS
4
Visuals: None apart from the small Kleiner Perkins 2018 Internet Trends wordmark logo in the bottom-left corner: three stacked lines, 'KLEINER PERKINS' in widely letter-spaced capitals, '2018' in small type, and 'INTERNET TRENDS' in letter-spaced capitals, rendered in light grey on the dark blue background. Also one thin white horizontal rule under the title.
Slide 6
INTERNET DEVICES + USERS =
GROWTH CONTINUES TO SLOW
KLEINER PERKINS
2018
INTERNET TRENDS
5
Visuals: Two-line bold sans-serif title with no chart, photo, table or illustration. One thin white horizontal rule above the title. Footer logo at bottom-left (wordmark KLEINER PERKINS above 2018 and INTERNET TRENDS in light grey, stacked and centred). No other non-text visuals.
Slide 7
Global New Smartphone Unit Shipments =
No Growth @ 0% vs. +2% Y/Y
New Smartphone Unit Shipments vs. Y/Y Growth
1.5B
90%
1.0B
60%
Y/Y Growth
New Smartphone Shipments, Global
0.5B
30%
0
0%
2009 2010 2011 2012 2013 2014 2015 2016 2017
Android
iOS
Other
Y/Y Growth
KLEINER PERKINS
2018
INTERNET TRENDS
Source: Katy Huberty @ Morgan Stanley (3/18), IDC.
6
Visuals: Chart: combined stacked column and line chart titled 'New Smartphone Unit Shipments vs. Y/Y Growth'. Left axis titled 'New Smartphone Shipments, Global' in units of billions of units, range 0 to 1.5B with gridlines labelled 0, 0.5B, 1.0B, 1.5B. Right axis titled 'Y/Y Growth' in percent, range 0% to 90% with labels 0%, 30%, 60%, 90%. X axis categories 2009 to 2017. Stacked columns have three series from bottom to top: Android (dark navy #00517A), iOS (light grey #BFBFBF), Other (teal green #258B74). Column totals are not printed; about values read from the plot: 2009 Android about 0.01B, iOS about 0.02B, Other about 0.14B, total about 0.18B; 2010 Android about 0.07B, iOS about 0.05B, Other about 0.19B, total about 0.31B; 2011 Android about 0.25B, iOS about 0.10B, Other about 0.15B, total about 0.49B; 2012 Android about 0.50B, iOS about 0.14B, Other about 0.09B, total about 0.73B; 2013 Android about 0.80B, iOS about 0.16B, Other about 0.06B, total about 1.02B; 2014 Android about 1.06B, iOS about 0.19B, Other about 0.05B, total about 1.30B; 2015 Android about 1.16B, iOS about 0.24B, Other about 0.04B, total about 1.44B; 2016 Android about 1.24B, iOS about 0.22B, Other about 0.01B, total about 1.47B; 2017 Android about 1.24B, iOS about 0.22B, Other about 0.00B, total about 1.46B. Y/Y Growth line in crimson red (#C8215A approx.) with about values: 2009 about 17%, 2010 about 73%, 2011 about 61%, 2012 about 47%, 2013 about 40%, 2014 about 28%, 2015 about 11%, 2016 about 2%, 2017 about 0%. No points are highlighted. Legend centred below the plot in one row: Android (navy square), iOS (grey square), Other (teal square), Y/Y Growth (red line). Gridlines are light grey horizontal lines at 0.5B intervals. Logo: Kleiner Perkins 2018 Internet Trends wordmark in grey, bottom left.
Slide 8
Global Internet Users =
Slowing Growth @ +7% vs. +12% Y/Y
Internet Users vs. Y/Y Growth
4B
16%
3B
12%
Internet Users, Global
8% Y/Y Growth
2B
1B
4%
0
0%
2009 2010 2011 2012 2013 2014 2015 2016 2017
Global Internet Users
Y/Y Growth
7
Source: United Nations / International Telecommunications Union, USA Census Bureau. Internet user data is as of mid-year. Internet user / data: Pew Research (USA), China Internet Network Information Center (China), Islamic Republic News Agency / InternetWorldStats / KP / estimates (Iran), KP estimates based on IAMAI data (India), & APJII (Indonesia). Note: Historical data (particularly in Sub-Saharan Africa) / revised by ITU in 2017 to better account for dual-SIM subscriptions (i.e. two Internet subscriptions per single smartphone user).
Visuals: Chart: combination chart, vertical bars plus a line on a secondary axis. Chart title 'Internet Users vs. Y/Y Growth'. Left axis 'Internet Users, Global' in billions, range 0 to 4B with gridlines at 1B, 2B, 3B, 4B. Right axis 'Y/Y Growth' in percent, range 0% to 16% with ticks at 4%, 8%, 12%, 16%. X axis years 2009 to 2017. Series 1 'Global Internet Users' navy bars, about 1.6B (2009), about 1.8B (2010), about 2.1B (2011), about 2.3B (2012), about 2.5B (2013), about 2.8B (2014), about 3.0B (2015), about 3.4B (2016), about 3.6B (2017); no values are printed, all are estimates marked about. Series 2 'Y/Y Growth' crimson line, starting 2010, about 12.9% (2010), about 13.1% (2011), about 10.2% (2012), about 10.8% (2013), about 9.2% (2014), about 9.5% (2015), about 11.9% (2016), about 7.0% (2017); no values printed. Legend beneath the chart: navy rectangle 'Global Internet Users' and crimson line 'Y/Y Growth'. No points are highlighted. Logo: Kleiner Perkins 2018 Internet Trends wordmark in grey at bottom left.
Slide 9
Global Internet Users =
3.6B @ >50% of Population (2018)
Internet Penetration
60%
49%
Global
40%
24%
Internet Penetration,
20%
0%
2009 2010 2011 2012 2013 2014 2015 2016 2017
8
Source: CIA World Factbook, United Nations / International Telecommunications Union, USA Census Bureau. Internet user data is as of mid-year.
Internet user data: Pew Research (USA), China Internet Network Information Center (China), Islamic Republic News Agency / InternetWorldStats
/ KP estimates (Iran), KP estimates based on IAMAI data (India), & APJII (Indonesia). Note: Historical data (particularly in Sub-Saharan Africa)
revised by ITU in 2017 to better account for dual-SIM subscriptions (i.e. two Internet subscriptions per single smartphone user).
Visuals: Line chart titled Internet Penetration. Y-axis titled Internet Penetration, Global, scale 0% to 60% in 20% steps, unit percent. X-axis years 2009 to 2017, one tick per year. One series, teal line about 0.5% of slide height thick, values: 2009 24% (labelled), 2010 about 26.5%, 2011 about 29.5%, 2012 about 32%, 2013 about 35%, 2014 about 38%, 2015 about 41.5%, 2016 about 46%, 2017 49% (labelled). Labelled points are 24% at 2009 and 49% at 2017, shown in dark slate bold above the line ends. No legend. Horizontal light grey gridlines at 0%, 20%, 40% and 60%. Small Kleiner Perkins 2018 Internet Trends logo at bottom left in grey.
Slide 10
Internet Users…
Growth Harder to Find After
Hitting 50% Market Penetration
KLEINER PERKINS
2018
INTERNET TRENDS
9
Visuals: Logo: the Kleiner Perkins 2018 Internet Trends lockup at bottom left, set in light grey wide-tracked capitals reading KLEINER PERKINS on the first line, 2018 on the second, and INTERNET TRENDS on the third. The lockup is placed as two image pieces: a 390 by 92 pixel block and a 287 by 19 pixel wordmark strip for KLEINER PERKINS. No photographs, charts, tables, or diagrams.
Slide 11
INTERNET USAGE =
GROWTH REMAINS SOLID
10
Visuals: A thin white horizontal rule spans from about x 3.3% to x 95% at about y 17%. Bottom-left is a small grey-beige logo lockup reading KLEINER PERKINS / 2018 / INTERNET TRENDS, set in a wide-tracked sans-serif. No photographs, charts, or other graphics.
Slide 12
Digital Media Usage @ +4% Growth... 5.9 Hours per Day (Not Deduped) Daily Hours Spent with Digital Media per Adult User 6 5 4 3 2 1 0 Hours Spent per Day, USA 5.9 5.6 5.4 5.1 4.9 4.3 3.7 3.2 3.0 2.7 3.3 3.1 2.8 2.6 2.3 1.6 0.8 0.4 0.3 0.3 2.1 2.2 2.2 2.2 2.3 2.5 2.6 2.4 2.3 2.2 2.3 2.2 2.2 2.6 0.6 0.4 0.4 0.3 0.3 0.3 0.3 0.4 0.4 0.3 0.2 2008 2009 2010 2011 2012 2013 2014 2015 2016 2017 Other Connected Devices Desktop / Laptop Mobile KLEINER PERKINS 2018 INTERNET TRENDS Source: eMarketer 9/14 (2008-2010), eMarketer 4/15 (2011-2013), eMarketer 4/17 (2014-2016), eMarketer 10/17 (2017). Note: Other connected devices include OTT and game consoles. Mobile includes smartphone and tablet. Usage includes both home and work for consumers 18+. Non deduped defined as time spent with each medium individually, regardless of multitasking. 11
Visuals: Chart: vertical stacked column chart titled Daily Hours Spent with Digital Media per Adult User. Y-axis titled Hours Spent per Day, USA, in hours, range 0 to 6 with gridlines at each whole hour. X-axis shows years 2008 to 2017 with a dark baseline at 0. Three stacked series, bottom to top: Other Connected Devices (dark teal blue #00517A), Desktop / Laptop (light grey #BFBFBF), Mobile (green #258B74). Printed values per series, bottom to top: Other Connected Devices 0.2, 0.3, 0.4, 0.3, 0.3, 0.3, 0.3, 0.4, 0.4, 0.6; Desktop / Laptop 2.2, 2.3, 2.4, 2.6, 2.5, 2.3, 2.2, 2.2, 2.2, 2.1; Mobile 0.3, 0.3, 0.4, 0.8, 1.6, 2.3, 2.6, 2.8, 3.1, 3.3. Bold black totals above each column: 2.7, 3.0, 3.2, 3.7, 4.3, 4.9, 5.1, 5.4, 5.6, 5.9. Segment value labels are white on the teal and blue segments and dark grey on the grey segments. Legend at bottom centre with small square markers: Other Connected Devices, Desktop / Laptop, Mobile. No highlighted points. No photographs, logos other than the footer logo, or icons inside the chart.
Slide 13
Internet Usage… / How Much = Too Much? / Depends How Time is Spent / KLEINER PERKINS / 2018 / INTERNET TRENDS / 12
Visuals: None apart from the grey Kleiner Perkins 2018 Internet Trends logo at bottom left (a wordmark 'KLEINER PERKINS' above '2018' above 'INTERNET TRENDS', in light grey with wide letter-spacing). No charts, photographs or illustrations.
Slide 14
INNOVATION + COMPETITION =
DRIVING PRODUCT IMPROVEMENTS /
USEFULNESS / USAGE +
SCRUTINY
13
KLEINER PERKINS
2018
INTERNET TRENDS
Visuals: none (apart from the thin white horizontal rule and the Kleiner Perkins 2018 Internet Trends logo, both listed under elements)
Slide 15
Innovation + Competition =
Driving Product Improvements / Usefulness / Usage
Devices
Access
Simplicity
Payments
Local
Messaging
Video
Voice
Personalization
KLEINER PERKINS
2018
INTERNET TRENDS
14
Slide 16
Devices =
Better / Faster / Cheaper
Apple iPhone
New Smartphone Shipments – ASP
2016
2017
$500
‘Portrait’ Photos
Water Resistant
Face Tracking
Full Device Display
Wireless Charging
New Smartphone Shipment ASP, Global*
$400
$300
2016
2017
Google Android
$200
$100
Google Assistant
‘AI-Assisted’
Photo Editing
‘Lens’ Smart
Image Recognition
Always-On Display
$0
2007 2009 2011 2013 2015 2017
Source: Apple, Google, Katy Huberty @ Morgan Stanley, IDC. *ASP Based on Morgan Stanley’s new smartphone shipment breakdown
by taking the midpoint of each $50 price band & assuming a $1,250 ASP for smartphones over $1,000. Note: Deloitte estimates that
120MM used smartphones were traded in 2016 and 80MM in 2015 which may further reduce smartphone costs to consumers as the
ratio of used to new devices rises. Apple 2016 = iPhone 7 Plus, 2017 = iPhone X. Google 2016 = Pixel, 2017 = Pixel 2.
15
KLEINER PERKINS
2018
INTERNET TRENDS
Visuals: Chart: line chart titled New Smartphone Shipments – ASP. Y axis titled New Smartphone Shipment ASP, Global* (units US dollars), range $0 to $500, gridlines and labels at $0, $100, $200, $300, $400, $500. X axis years 2007 to 2017, labels every two years, one data point per year (11 points). Series 1: solid teal line #1E8C6E, values are not printed; estimated points about 2007 $415, 2008 $428, 2009 $418, 2010 $427, 2011 $424, 2012 $383, 2013 $335, 2014 $302, 2015 $297, 2016 $284, 2017 $314. Series 2: dotted teal linear trendline running from about $450 in 2007 to about $284 in 2017. No legend. No highlighted points. Phone images (four, unboxed, uncropped, no overlay): top left, iPhone 7 in white with a teal abstract blob wallpaper on the screen, front view, bright even studio lighting, dominant colours white and teal; top right, iPhone X with black bezel and full-screen pink, orange and blue gradient display, front view, studio lighting; bottom left, Google Pixel in white with a teal and green aerial-map wallpaper and a row of app icons, front view, studio lighting; bottom right, Pixel 2 in black with a blurred night city wallpaper and app icons, front view, studio lighting. Logo: Kleiner Perkins wordmark KLEINER PERKINS / 2018 / INTERNET TRENDS in grey at bottom left.
Slide 17
Access =
WiFi Adoption Rising
WiFi Networks
500MM
400MM
WiFi Networks, Global
300MM
200MM
100MM
0
2001
2003
2005
2007
2009
2011
2013
2015
2017
KLEINER PERKINS
2018
INTERNET TRENDS
Source: WiGLE.net as of 5/29/18. Note: WiGLE.net is a submission-based catalog of wireless
networks that has collected >6B data points since launch in 2001. Submissions are not paired
with actual people, rather name / password identities which people use to associate their data.
16
Visuals: One line chart. Chart type: line chart with a single series. Chart title: WiFi Networks (bold, dark slate). Y axis: title WiFi Networks, Global (rotated 90 degrees, vertical text); scale 0 to 500MM in gridlines every 100MM, labelled 0, 100MM, 200MM, 300MM, 400MM, 500MM; values in millions of networks (MM). X axis: years labelled every two years 2001, 2003, 2005, 2007, 2009, 2011, 2013, 2015, 2017; the series runs from 2001 to about 2017/2018. No data labels are printed, so values are estimated: about 0 in 2001 to 2003, about 2 MM in 2004, about 5 MM in 2005, about 10 MM in 2006, about 12 MM in 2007, about 15 MM in 2008, about 18 MM in 2009, about 20 MM in 2010, about 30 MM in 2011, about 50 MM in 2012, about 90 MM in 2013, about 130 MM in 2014, about 180 MM in 2015, about 240 MM in 2016, about 320 MM in 2016.5, about 420 MM in 2017, about 445 MM at the last point near 2017.5. Line is a steady teal-green stroke with a curve that steepens sharply after about 2010. No legend. No highlighted points. Logo: Kleiner Perkins 2018 Internet Trends wordmark in grey, three stacked lines KLEINER PERKINS, 2018, INTERNET TRENDS, bottom left.
Slide 18
Simplicity =
Easy-to-Use Products Becoming Pervasive
Messaging
Commerce
Media
Telegram
Square Cash
Spotify
Source: Telegram (5/18), Square (5/18), Spotify (5/18).
17
KLEINER PERKINS
2018
INTERNET TRENDS
Visuals: Three smartphone screenshots, each in a black-bordered rectangular frame with square corners, all the same height (about 50% of slide height) and top-aligned at about 31.2%. (1) Left, Messaging, Telegram: a dark-mode chat screen (portrait, 423 by 753 px) showing a status bar reading AT&T and 12:43 PM, a contact header with an orange circle 'MB' avatar, name Michael Brogan, status online, a '1 new message' divider, the date 11 May, a grey received bubble 'How are you?' 12:38 PM, a blue sent bubble 'Tired, pretty sure I dreamed about PowerPoint last night. How about you?' 12:39 PM with double tick, a grey received bubble 'That wasn't a dream... I'm doing great, excited for this year's report' 12:42 PM, and a composer field reading 'Me too!' with a blue send arrow, above an iOS-style number and symbol keyboard with suggestions I / It's / We and a key labelled English (US). (2) Centre, Commerce, Square Cash: a solid bright green (#00C040 approx.) payment screen (portrait, 288 by 513 px) with status bar at top showing 10:03, a small circular profile photo at left, a pill-shaped label 'Cash & BTC' in darker green, and a clock icon at right; large white amount '$35' in the middle; a white numeric keypad 1 2 3 / 4 5 6 / 7 8 9 / . 0 backspace arrow; and a bottom bar of two buttons, Request at left and Pay at right, in white bold text on green separated by a thin darker line. (3) Right, Media, Spotify: a dark navy now-playing screen (portrait, 286 by 515 px) with status bar 8:46, a chevron at top left, the label PLAYING FROM ALBUM and Magic in small text at top centre, a menu icon at top right, a square album art image of two angel-wing shapes in white-grey on a dark blue starry background filling most of the upper screen, text Magic and Coldplay beneath it, a plus icon at left and an info icon at right, a progress bar with 0:13 at left and 4:45 at right, and a row of controls: shuffle, previous, a large circled white pause button, next, and repeat; a bottom Android navigation bar with back, home and recent icons. Light grey vertical divider rules sit between the columns at about x 33.9% and x 65.8%, from about y 31% to y 81%. A Kleiner Perkins 2018 Internet Trends logo in light grey sits at bottom left, and a thin grey horizontal rule spans the width near y 93%.
Slide 19
Payments =
Digital Reach Expanding…
Transactions by Payment Channel
Thinking of your past 10 everyday transactions, how many were made in each of the following ways?
In-Store
40%
Other Online
15%
Buy Buttons
9%
Other Mobile Payments
8%
P2P Transfer
7%
Mobile Messenger Apps
7%
Other In-App Payments
4%
QR Codes
4%
Smart Home Device
3%
Wearables / Contactless
2%
Other
1%
0%
10%
20%
30%
40%
50%
% of Global Responses (9/17)
60% =
Digital
Source: Visa Innovations in a Cashless World 2017. Note: Full question was ‘Please think about the payments you make for everyday transactions (excluding rent,
mortgage, or other larger, infrequent payments). Thinking of your past 10 everyday transactions, how many were made in each of the following ways?’, GfK
Research conducted the survey with n = 9,200 across 16 countries (USA, Canada, UK, France, Poland, Germany, Mexico, Brazil, Argentina, Australia, China, India,
Japan, South Korea, Russia, UAE), between 7/27/17 – 9/5/17. All respondents do not work in Financial Services, Marketing, Marketing Research, Advertising, or
Public Relations, own and currently use a smartphone, have a savings or checking account; own/use a computer or tablet, and own a credit or debit card.
18
KLEINER PERKINS
2018
INTERNET TRENDS
Visuals: Horizontal bar chart, untitled apart from the slide-level chart title 'Transactions by Payment Channel'. X axis: '% of Global Responses (9/17)', linear 0% to 50% in 10% steps, gridlines at each step (0% at about 40.3% of slide width, 50% at about 75.2%). Y axis: payment channel categories, listed top to bottom. Series (single series, bars in #00517A except the top bar): In-Store 40% (bar in light grey #D9D9D9, printed value 40%); Other Online 15%; Buy Buttons 9%; Other Mobile Payments 8%; P2P Transfer 7%; Mobile Messenger Apps 7%; Other In-App Payments 4%; QR Codes 4%; Smart Home Device 3%; Wearables / Contactless 2%; Other 1%. All values are printed. No legend. Highlight: a crimson #C82055 rounded-corner bracket outline encloses the ten digital categories from Other Online to Other, open on its right side where it meets the axis, labelled '60% =' over 'Digital' in bold crimson to its left. The In-Store label and 40% value are in light grey. Logo: Kleiner Perkins 2018 Internet Trends logo bottom-left, grey wordmark 'KLEINER PERKINS' above '2018' and 'INTERNET TRENDS' in grey small capitals.
Slide 20
…Payments = / Friction Declining... / China Mobile Payment Users / 600MM / 400MM / Mobile Payment Users, China / 200MM / 0 / 2012 / 2013 / 2014 / 2015 / 2016 / 2017 / KLEINER PERKINS / 2018 / INTERNET TRENDS / Source: China Internet Network Information Center (CNNIC). Note: User defined as active user of mobile-passed payment technology for everyday transactions, as well as more complex transactions, such as bill paying in the relevant period. Includes all forms of transactions on mobile (e.g., QR codes, P2P, etc.) / 19
Visuals: Chart: line chart titled 'China Mobile Payment Users', bold dark grey, centred above the plot. Y-axis titled 'Mobile Payment Users, China' (rotated vertical, bold light grey), range 0 to 600MM, labelled ticks 0, 200MM, 400MM, 600MM, with light grey horizontal gridlines at each labelled tick. X-axis shows categories 2012, 2013, 2014, 2015, 2016, 2017 with no axis title and no unit stated beyond the millions on the Y-axis. One series, a single thick teal-green line (about 3pt, #2A8A78) with no markers and no data labels printed. Estimated values, none printed on the slide: 2012 about 55MM, 2013 about 120MM, 2014 about 220MM, 2015 about 360MM, 2016 about 470MM, 2017 about 525MM. No legend. No highlighted points. Logos: Kleiner Perkins '2018 INTERNET TRENDS' stacked grey logo block at bottom left, and the 'KLEINER PERKINS' wordmark in widely letter-spaced grey capitals directly above it.
Slide 21
…Payments =
Digital Currencies Emerging
Coinbase Users
4x
Coinbase Registered Users, Global (Indexed to 1/17)
3x
2x
1x
January
March
May
July
September
November
2017
Source: Coinbase. Note: Registered users defined as users that have an account on Coinbase.
KLEINER PERKINS
2018
INTERNET TRENDS
20
Visuals: Line chart titled 'Coinbase Users'. Y-axis: 'Coinbase Registered Users, Global (Indexed to 1/17)', range 1x to 4x with gridlines at 1x, 2x, 3x, 4x. X-axis: months January to November 2017, with labels at January, March, May, July, September, November and year label 2017 beneath. One series in green (about #2E8B6A) with a thick stroke, values about: January 1.0x, February about 1.1x, March about 1.1x, April about 1.2x, May about 1.3x, June about 1.5x, July about 1.6x, August about 1.8x, September about 1.9x, October about 2.1x, November about 2.5x, December about 3.6x. No legend; no highlighted points. Kleiner Perkins logo lockup in grey at bottom left.
Slide 22
Local = / Offline Connections Driven by Online Network Effects / Nextdoor Active Neighborhoods / 200K / 150K / Active Neighborhoods, USA / 100K / 50K / 0 / 2011 / 2012 / 2013 / 2014 / 2015 / 2016 / 2017 / 2018 / Source: Nextdoor (5/18). Note: There are ~130MM households in USA. Nextdoor estimates / that there are ~650 households per average neighborhood (~200K USA neighborhoods). / 21 / KLEINER PERKINS / 2018 / INTERNET TRENDS
Visuals: One line chart titled 'Nextdoor Active Neighborhoods' in bold dark grey. Y-axis: title 'Active Neighborhoods, USA', linear, range 0 to 200K, gridlines and labels at 0, 50K, 100K, 150K, 200K. X-axis: years 2011 to 2018, labels at yearly intervals with no axis title. One series, a single teal line of about 4pt width with rounded joins, plotted at about these values (estimated, no values printed): about 1K near the 2011.6 position, about 7K near 2012.6, about 25K near 2013.6, about 49K near 2014.6, about 86K near 2015.6, about 121K near 2016.6, about 165K near 2017.6, about 174K near 2018. No legend, no highlighted points, no data labels. Gridlines are thin light grey horizontal lines running across the plot. A small Kleiner Perkins 2018 Internet Trends logo sits bottom-left in grey, with the 'KLEINER PERKINS' wordmark as a separate overlapping image above '2018 INTERNET TRENDS'.
Slide 23
Messaging =
Extensibility Expanding
Messaging
Tencent (2000 → 2018)
Messenger MAUs
1.5B
1.0B
0.5B
0
2011 2012 2013 2014 2015 2016 2017
Facebook Messenger
22
KLEINER PERKINS
2018
INTERNET TRENDS
Source: Facebook, WhatsApp, Tencent, Instagram, Twitter, Morgan Stanley Research. Note: 2013 data for Instagram &
Facebook Messenger are approximated from statements made in early 2014. Twitter users excludes SMS fast followers.
MAUs (Monthly Active Users) are defined as users who log into a messenger on the web or through an application.
WeChat screenshot UI text: 取消 / 1:21 AM / 发表 / 在这个地方偶遇老朋友,真开心 / 所在位置 / 谁可以看 / 公开 / 提醒谁看
QQ screenshot text is too small to transcribe legibly, apart from the window labels and the chat lines.
Visuals: Two phone or desktop screenshots side by side. (1) QQ: a desktop chat-client window, about 6.9% to 28.3% of slide width and 36% to 60% of slide height, with a left contacts column of penguin avatars, a chat history pane with small green and dark text, an input area and a blue-and-yellow banner at the bottom; the window has a thin dark frame. (2) WeChat: a smartphone screen mockup, about 29.4% to 48% of width and 36% to 76% of height, with a black rounded frame and thick black border, status bar showing 1:21 AM and 100%, a grid of photos (blue-sky building and trees, yellow-leaf branches, green fern, a group of three people in blue), a grey plus tile, and a list of rows with location pin, person and @ icons and chevrons. Line chart titled 'Messenger MAUs'. Y axis: 0 to 1.5B, gridlines at 0, 0.5B, 1.0B and 1.5B, light grey labels. X axis: 2011 to 2017, one label per year, light grey. Series (values are estimates, marked about, since the slide prints none): WhatsApp (green): about 0.45B in 2013, 0.70B in 2014, 1.00B in 2015, 1.20B in 2016, 1.50B in 2017. WeChat (red): about 0.16B in 2012, 0.36B in 2013, 0.50B in 2014, 0.70B in 2015, 0.90B in 2016, 1.00B in 2017. Facebook Messenger (dark navy): about 0.20B in 2013, 0.50B in 2014, 0.80B in 2015, 1.00B in 2016, 1.30B in 2017. Instagram (tan orange): about 0.01B in 2011, 0.10B in 2012, 0.20B in 2013, 0.30B in 2014, 0.40B in 2015, 0.60B in 2016, 0.80B in 2017. Twitter (light blue): about 0.12B in 2011, 0.18B in 2012, 0.24B in 2013, 0.29B in 2014, 0.31B in 2015, 0.33B in 2016, 0.34B in 2017. Lines are about 2.5 px wide with no markers and no highlighted points. Legend below the chart in two columns: WhatsApp and WeChat on the left, Facebook Messenger and Instagram on the right, and Twitter centred beneath, each with a short coloured line sample. Logo: the Kleiner Perkins 2018 Internet Trends wordmark in grey at the bottom-left.
Slide 24
Video =
Mobile Adoption Climbing...
Mobile Video Usage
40
Global
30
Minutes,
Video Viewing
20
Mobile
10
Daily
0
2012
2013
2014
2015
2016
2017
2018E
23
Source: Zenith Online Video Forecasts 2017 (7/17). Note: Based on a study across 63 countries. The
historical figures are taken from the most reliable third-party sources in each market including Nielsen
and comScore. The forecasts are provided by local experts, based on the historical trends,
comparisons with the adoption of previous technologies, and their judgement.
Visuals: One line chart titled Mobile Video Usage (bold dark grey, centred above the plot). Y-axis titled Daily Mobile Video Viewing Minutes, Global, linear scale from 0 to 40 in steps of 10, with horizontal light-grey gridlines at 0, 10, 20, 30 and 40 (no unit printed on the axis beyond the title's 'Minutes'). X-axis categories 2012, 2013, 2014, 2015, 2016, 2017 and 2018E, with 2018E marking a forecast. One series in teal green (about #1F8A70), line width about 0.5% of slide height, with solid segments from 2012 to 2017 and a dashed segment from 2017 to 2018E. No values are printed; estimated values: 2012 about 4, 2013 about 10, 2014 about 12, 2015 about 14, 2016 about 20, 2017 about 28.5, 2018E about 34. No legend. No highlighted points.
Slide 25
…Video = / New Content Types Emerging / Fortnite Battle Royale / Most Watched Game on Twitch / Twitch Streaming Hours / 18MM / 12MM / Average Daily Streaming Hours, Global / 6MM / 0 / 2012 2013 2014 2015 2016 2017 / Source: Twitch (3/18). Note: Tyler “Ninja” Blevins Twitch stream has 7MM+ / followers (#1 ranked) as of 5/29/18 based on Social Blade data. / KLEINER PERKINS / 2018 / INTERNET TRENDS / 24
Visuals: Chart: vertical column chart titled Twitch Streaming Hours (heading above the chart, not inside the plot). Y-axis title 'Average Daily Streaming Hours, Global' rotated vertically, units MM (millions) implied by tick labels; y-axis range 0 to 18MM with gridlines and labels at 0, 6MM, 12MM, 18MM. X-axis categories 2012, 2013, 2014, 2015, 2016, 2017. One series, all bars solid #00517A, no data labels printed. Estimated values (about, read from bar heights, no values printed): 2012 about 3.3MM; 2013 about 6.5MM; 2014 about 8.7MM; 2015 about 11.0MM; 2016 about 13.3MM; 2017 about 16.2MM. No legend, no highlighted points. Photograph: boxed screenshot of a Twitch channel page for the streamer Ninja playing Fortnite Battle Royale, not cropped, not full-bleed, shown inside a thin black border. Top of the screenshot is the purple Twitch navigation bar with the Twitch logo, Following, Browse, Get Desktop, Try Prime, a search field, and green, purple Subscribe and Get Bits buttons. A dark left sidebar holds small icons. Below, the channel row shows Ninja with a verified badge, Videos 397, Clips. The main player shows a daytime third-person Fortnite scene: green grass, tall pine trees, blue sky, the character seen from behind holding a pickaxe, a webcam inset of the streamer at upper left, a minimap at upper right, health and shield bars and a hotbar at lower right, a 6 | 44 timer. Under the player is a stream card reading Aim at the meteor == | @Ninja on Twitter and Insta ;) with Fortnite and Luminosity Gaming tags, 113,264 viewers and 109,831,486 views, and a Share button. At the bottom, two dark navy rectangular buttons with gold trim read SUBSCRIBE and DONATE. Lighting is flat screen light; dominant colours are green, blue and purple. Logo: KLEINER PERKINS 2018 INTERNET TRENDS lockup in grey at lower left.
Slide 26
Voice = / Technology Lift Off… / Google Machine Learning Word Accuracy / 100% / 95% / 90% / Word Accuracy Rate / 80% / 70% / 2013 / 2014 / 2015 / 2016 / 2017 / 95% / 95% / Google / Threshold for Human Accuracy / KLEINER PERKINS / 2018 / INTERNET TRENDS / Source: Google (5/17). Note: Data as of 5/17/17 & refers to recognition accuracy for / English language. Word error rate is evaluated using real world search data which is / extremely diverse & more error prone than typical human dialogue. / 25
Visuals: Chart: line chart titled Google Machine Learning Word Accuracy. Y-axis titled Word Accuracy Rate (no units printed), gridlines and tick labels at 70%, 80%, 90% and 100% (scale 70% to 100%). X-axis shows the categories 2013, 2014, 2015, 2016 and 2017 with no axis title. Series 1, Google, is a solid green line (#2A8A74) with no markers. Its values are not printed except the final point labelled 95% at 2017; estimated values are about 77% in 2013, about 86% in 2014, about 92% in 2015, about 93.5% in 2016 and 95% in 2017. Series 2, Threshold for Human Accuracy, is a flat dashed crimson line (#C82055) at 95% running from 2013 to 2017, labelled 95% at its left end. Highlighted points: the 2017 end point of the Google line, labelled 95% in dark grey bold. Legend centred below the plot: solid green line segment followed by Google, then dashed crimson segment followed by Threshold for Human Accuracy. Logo: Kleiner Perkins 2018 Internet Trends wordmark in grey (#A6A6A6), with the wordmark line above 2018 and INTERNET TRENDS in spaced capitals below.
Slide 27
…Voice = / Product Lift Off / Amazon Echo Installed Base / Amazon Echo Skills / 40MM / 30K / 30MM / 20K / Installed Base, USA / Number of Skills / 20MM / 10K / 10MM / 0 / 0 / 2015 / 2016 / 2017 / 2015 / 2016 / 2017 / 2018 / Q2 Q3 Q4 Q1 Q2 Q3 Q4 Q1 Q2 Q3 Q4 / Source: Consumer Intelligence Research Partners LLC (Echo install base, 2/18), Various / media outlets including Geekwire, TechCrunch, and Wired (Echo skills, 3/18) / 26 / KLEINER PERKINS / 2018 / INTERNET TRENDS
Visuals: Two charts. (1) Left: vertical column chart titled 'Amazon Echo Installed Base'. Y-axis titled 'Installed Base, USA' with unit MM (millions), range 0 to 40MM, gridlines and labels at 0, 10MM, 20MM, 30MM, 40MM. X-axis: 11 quarterly categories labelled Q2 Q3 Q4 (2015), Q1 Q2 Q3 Q4 (2016), Q1 Q2 Q3 Q4 (2017), with year labels 2015, 2016, 2017 beneath underline brackets. Single series, dark blue columns, no printed data values; estimated values: Q2 2015 about 1.6MM, Q3 2015 about 2.1MM, Q4 2015 about 2.9MM, Q1 2016 about 4.2MM, Q2 2016 about 5.1MM, Q3 2016 about 5.8MM, Q4 2016 about 8.3MM, Q1 2017 about 10.9MM, Q2 2017 about 15MM, Q3 2017 about 20MM, Q4 2017 about 31MM. No legend, no highlighted points. (2) Right: line chart titled 'Amazon Echo Skills'. Y-axis titled 'Number of Skills' with range 0 to 30K, gridlines and labels at 0, 10K, 20K, 30K. X-axis labelled 2015, 2016, 2017, 2018 with gridline-free baseline. Single series, teal-green line about 4pt thick, no printed data values; estimated shape: near 0 through 2015, about 1K by mid 2016, about 2K early 2016.5, about 5K late 2016, about 10K around early 2017, about 15K mid 2017, about 20K late 2017, about 30K at the end of 2018. No legend, no highlighted points. Also a Kleiner Perkins 2018 Internet Trends logo block at bottom left: wordmark 'KLEINER PERKINS' in widely letter-spaced grey capitals, '2018' and 'INTERNET TRENDS' in grey capitals below, no graphic mark.
Slide 28
Innovation + Competition =
Driving Product Improvements / Usefulness / Usage
Devices
Access
Simplicity
Payments
Local
Messaging
Video
Voice
Personalization
KLEINER PERKINS
2018
INTERNET TRENDS
27
Visuals: Non-photographic. One logo lockup at bottom left reading KLEINER PERKINS, 2018, INTERNET TRENDS in small light-grey letters. No charts, tables, photographs or illustrations. A thin light-grey horizontal rule runs across the slide above the footer.
Slide 29
Personalization = / Data Improves / Engagement + Experiences… / Drives Growth + Scrutiny / 28
Visuals: None apart from the Kleiner Perkins 2018 Internet Trends logo lockup at bottom left, which is a grey wordmark: 'KLEINER PERKINS' on the first line, '2018' on the second and 'INTERNET TRENDS' on the third.
Slide 30
Personal + Collective Data =
Provide Better Experiences for Consumers…
2.2B
Facebooks
200MM
Pinterests
170MM
Spotifys
125MM
Netflixes
Newsfeed
Discovery
Music
Video
Source: Facebook (5/18), Pinterest (5/18), Spotify (5/18), Netflix (5/18).
Note: Facebook Q1:18 MAU (4/18), Pinterest MAU (9/17), Spotify Q1:18
MAU (5/18), Netflix Q1:18 global streaming memberships (4/18).
29
Visuals: Four phone-style screenshots in black-bordered frames, left to right: (1) Newsfeed: a Facebook mobile post from Wegmans (May 16 at 12:30pm) with text 'Summer is right around the corner and we're gearing up for sundae season. Our Wegmans Ice Creams are a great value in over 40 flavors your family will love! What's your favorite ice cream flavor for a summer sundae? http://ow.ly/WcPe30k1WOo', a large photo of an ice cream sundae in a glass bowl with chocolate sauce, nuts, strawberries, banana and a spoon on a pale green blurred background, reaction count 54, '8 Comments 7 Shares', and Like / Comment / Share buttons; the blue Facebook top navigation bar with a red badge reading 33 is cropped as a separate strip at the top. (2) Discovery: a Pinterest search screen showing time 8:08 AM and 100% battery, a grey 'Search' field with camera icon, and a two-column masonry grid of basketball photos (player numbered 30 in gold and blue uniform, player in white jersey, players in action, a player in front of a blue backdrop with the word SLAM, and a player with a dark background), with the red Pinterest logo in the bottom tab bar. (3) Music: a dark charcoal Spotify screen with white text 'Your weekly mixtape of fresh music. Enjoy new discoveries and deep cuts chosen just for you. Updated every Monday, so save your favorites!', a green Spotify logo circle with 'SPOTIFY' pill label, 'Apr 15, 2018' and '1h 50min', a green 'SHUFFLE PLAY' button, a grey Download toggle, 'Includes' heading and a now-playing bar 'Touch The Sky - Kanye West / Devices Available', with a bottom tab bar of Home, Browse, Search, Radio, Your Library. (4) Video: a Netflix app screen with red NETFLIX wordmark at top, a hero banner for the film BRIGHT (two actors, one in prosthetic makeup, one in a dark jacket, warm orange and grey tones), 'Watch Now' bar, 'My List' row of three posters (The Defenders, The Crown, okja) and a 'Top Picks For You' row of posters including Despicable Me 2 and Monsters University. Icons: Facebook top bar icons, Pinterest and Spotify and Netflix logos. Four bold dark grey stats and a dark grey horizontal rule across the slide. Footer logo block 'KLEINER PERKINS / 2018 / INTERNET TRENDS' in grey.
Slide 31
...Personal + Collective Data =
Provide Better Experiences for Consumers
100MM+
Waze
Drivers
20%
UberPOOL Share of All
Rides, Where Available*
100MM+
Snap Map
MAUs
17MM**
Nextdoor
Recommendations
Real-Time
Navigation
Real-Time
Transportation
Real-Time
Social Stories
Often Real-Time
Local News
Source: Facebook (5/18), Waze (2/18), Snap (5/18), Nextdoor (5/18) *Active Markets = Atlanta, Austin, Boston, Chicago, Denver, Las Vegas, Los Angeles, Miami, Nashville, New Jersey, New York City, Philadelphia, Portland, San Diego, San Francisco, Seattle, Washington D.C., Toronto, Rio de Janeiro, Sao Paulo, Bogota, Guadalajara, Mexico City, Monterrey, Lima, Paris, London, Ahmedabad, Bangalore, Chandigarh, Chennai, New Delhi, Guwahati, Hyderabad, Jaipur, Kochi, Kolkata, Mumbai, Pune, & Sydney. **Refers to cumulative recommendations as of 11/17.
30
Visuals: Four phone-screen images in a row, each boxed with a thick black border and a rounded-corner phone-like frame, all with the same top edge. Image 1 (left, Waze-style navigation): a street map of Syracuse NY in pale grey and green with white roads, labelled streets (I-690 shield, W Genesee St, W Fayette St, Fitch St, W Onondaga St, S West St), place labels (Inner Harbor Concert area, Leavenworth Park, Rosamond Gifford Zoo, Syracuse, Bellevue Elementary School), small orange and yellow hazard and incident icons, a grey compass-style circle at lower left, and a bottom search bar reading Good evening. Image 2 (UberPOOL): a grey top band with street names (Fremont St, Mission St), a white panel with blue-and-black pictogram illustrations of two riders and a stop sign joined by a blue zigzag route line, the heading Share your ride and save, body copy, three bullets, and a solid black button labelled CONTINUE. Image 3 (Snap Map): a light blue and green city map of Dallas area with a heat map of red, orange and yellow hotspots over Dallas and near Duncanville, labels Plano, Carrollton, Addison, Richardson, University Park, Garland, Dallas, Duncanville. Image 4 (Nextdoor): a green-header app screen showing status bar 10:26 and 100%, a search field and Invite button, neighbourhood Alta Hill + 1 neighborhood, a post by DJ Johnson, Alta Hill titled Looking for a roofer with body text and Thank and Reply actions, and a second post by Kristen Lee, Alta Hill titled Lost dog with a photograph of a golden retriever lying on a lawn in warm daylight, a red collar, green grass and a stone wall behind, cropped at the bottom of the screen. Logo: Kleiner Perkins 2018 Internet Trends wordmark in grey at lower left.
Slide 32
Privacy Paradox
Internet Companies
Making Low-Priced Services Better, in Part, from User Data
Internet Users
Increasing Time on Internet Services Based on Perceived Value
Regulators
Want to Ensure User Data is Not Used ‘Improperly’
31
Slide 33
Rising User Engagement =
Drives Monetization + Investment in Product Improvements...
Facebook Annualized Revenue per Daily User
$40
$30
$20
Annualized Average Revenue
per Daily Active User (ARPDAU), Global
$10
$34
$16
$0
2015
2016
2017
2018
Q1 Q2 Q3 Q4 Q1 Q2 Q3 Q4 Q1 Q2 Q3 Q4 Q1
32
Source: Facebook (4/18). Note: Facebook Daily Active Users (DAU) defined as a registered Facebook user who
logged in and visited Facebook on desktop or mobile device, or took action to share content or activity with his or
her Facebook friends or connections via a third-party website that is integrated with Facebook, on a given day.
ARPDAU calculated by dividing annualized total revenue by average DAU in the quarter.
KLEINER PERKINS
2018
INTERNET TRENDS
Visuals: Line chart titled 'Facebook Annualized Revenue per Daily User'. Y-axis: 'Annualized Average Revenue per Daily Active User (ARPDAU), Global', US dollars, range $0 to $40 with gridlines and labels at $0, $10, $20, $30, $40. X-axis: quarters Q1 to Q4 for 2015, 2016, 2017 and Q1 for 2018, grouped under year labels with thin underline rules, 13 quarters in total. Series (solid line, teal #258B74, about 4 px thick, no markers): Q1 2015 $16 (labelled), Q2 2015 about $17, Q3 2015 about $18, Q4 2015 about $23, Q1 2016 about $20, Q2 2016 about $23, Q3 2016 about $24, Q4 2016 about $29, Q1 2017 about $26, Q2 2017 about $29, Q3 2017 about $31, Q4 2017 about $37, Q1 2018 $34 (labelled). Highlighted points: first point labelled $16 and last point labelled $34 in bold teal. A dotted teal linear trendline runs from about $16 at Q1 2015 to about $34 at Q1 2018. No legend. Logo at bottom left: grey KLEINER PERKINS wordmark over 2018 INTERNET TRENDS in grey letters, plus a second overlapping wordmark image of KLEINER PERKINS.
Slide 34
...Rising Monetization + Data Collection =
Drives Regulatory Scrutiny
Data / Privacy
Competition
The European Data Protection Regulation will be
applicable as of May 25th, 2018 in all member states
to harmonize data privacy laws across Europe.
- European Union, 5/18
Facebook’s collection & use of data from
third-party sources is abusive.
- German Federal Cartel Office, 12/17
Commission fines Google €2.42 billion for abusing
dominance as search engine by giving illegal
advantage to its own comparison shopping service.
- European Commission, 6/17
Commission approves acquisition of LinkedIn by
Microsoft, subject to conditions.
- European Commission, 12/16
Safety / Content
The Germany Network Enforcement Act will require
for-profit social networks with >2MM registered
users in Germany to remove unlawful content
within 24 hours of receiving a complaint.
- German Federal Ministry of Justice & Consumer
Protection, 10/17
Taxes
Commission finds Luxembourg gave illegal tax
benefits to Amazon worth around €250 million.
- European Commission, 10/17
Source: European Union (5/18), European Commission (6/17, 10/17,
12/16), Bundeskartellmt (German Competition Authority (12/17).
German Federal Ministry of Justice and Consumer Protection (10/17).
33
Visuals: No charts, tables, photographs or illustrations. The only non-text items are four rectangular outline boxes with black borders (Data / Privacy, Competition, Safety / Content, Taxes), a thin light grey horizontal rule across the foot above the logo, and the Kleiner Perkins 2018 Internet Trends logo in grey at bottom left.
Slide 35
Internet Companies =
Key to Understand Unintended Consequences of Products...
We’re an idealistic & optimistic company.
For the first decade, we really focused on all the good that
connecting people brings.
But it’s clear now that we [Facebook] didn’t do enough.
We didn’t focus enough on preventing abuse & thinking
through how people could
use these tools to do harm as well.
- Mark Zuckerberg, Facebook CEO, 4/18
Source: Facebook (4/18).
34
Visuals: Visual elements: Kleiner Perkins 2018 Internet Trends logo in the lower-left corner (grey wordmark reading KLEINER PERKINS, 2018, INTERNET TRENDS, stacked, letter-spaced). No photographs, charts, or illustrations. No other graphics beyond the thin light-grey horizontal rule across the footer area.
Slide 36
…Regulators = / Key to Understand Unintended Consequences of Regulation / This month, the European Union will embark on an / expansive effort to give people more control / over their data online... / As it comes into force, Europe should / be mindful of unintended consequences / & open to change when things go wrong. / - Bloomberg Opinion Editorial, 5/8/18 / KLEINER PERKINS / 2018 / INTERNET TRENDS / Source: Bloomberg (5/18). / 35
Visuals: None apart from the Kleiner Perkins 2018 Internet Trends logo in the bottom-left corner: a grey stacked wordmark reading KLEINER PERKINS, 2018 and INTERNET TRENDS in wide-tracked capitals, with the 'KLEINER PERKINS' line rendered as a separate 287 by 19 pixel image overlaying a 390 by 92 pixel logo image. No photographs, charts, diagrams or icons.
Slide 37
It’s Crucial To Manage For
Unintended Consequences…
But It’s Irresponsible to Stop
Innovation + Progress
36
KLEINER PERKINS
2018
INTERNET TRENDS
Visuals: Logo, bottom-left: the Kleiner Perkins wordmark 'KLEINER PERKINS' with '2018' and 'INTERNET TRENDS' set below it in widely letter-spaced grey capitals, shown in a 390 by 92 pixel image placed at x 0.0, y 93.6, w 18.3, h 6.2 percent. A separate 287 by 19 pixel image of the 'KLEINER PERKINS' wordmark sits inside it at x 1.3, y 94.3, w 14.4, h 1.3 percent. Both are flat grey, unboxed and uncropped. No photographs, charts, icons or diagrams are present.
Slide 38
USA Internet Leaders =
Aggressive + Forward-Thinking
Investors for Years
KLEINER PERKINS
2018
INTERNET TRENDS
37
Visuals: Logo: the Kleiner Perkins 2018 Internet Trends lockup at bottom left, in grey. It reads KLEINER PERKINS in widely letter-spaced capitals, then 2018, then INTERNET TRENDS in letter-spaced capitals, centred and stacked. It is a flat, unboxed, uncropped placed image in mid-grey (about #A6A6A6) on white. No photographs, charts or other graphics.
Slide 39
Investment (Public + Private) Into Technology Companies = / High for Two Decades / Global USA-Listed Technology IPO Issuance & / Global Technology Venture Capital Financing / Technology IPO & Private Financing, Global / $200B / $150B / $100B / $50B / $0 / 8,000 / 6,000 / 4,000 / 2,000 / 0 / NASDAQ Composite / 1990 / 1995 / 2000 / 2005 / 2010 / 2015 2018YTD* / Technology Private Financing / Technology IPO / NASDAQ / Source: Morgan Stanley Equity Capital Markets, *2018YTD figure as of 5/25/18, Thomson ONE. All global USA-listed / technology IPOs over $30MM, data per Dealogic, Bloomberg, & Capital IQ. 2012: Facebook ($16B IPO) = 75% of 2012 / IPO $ value. 2014: Alibaba ($25B IPO) = 69% of 2014 IPO $ value. 2017: Snap ($4B IPO) = 34% of 2017 $ value. / 38
Visuals: Combo chart. Type: vertical stacked-column bars (blue Technology Private Financing at the bottom, grey Technology IPO stacked above) with a green NASDAQ Composite line on a secondary axis. Chart title: Global USA-Listed Technology IPO Issuance & Global Technology Venture Capital Financing. Primary y-axis: title Technology IPO & Private Financing, Global, ticks $0, $50B, $100B, $150B, $200B (linear, gridlines light grey at each tick). Secondary y-axis: title NASDAQ Composite, ticks 0, 2,000, 4,000, 6,000, 8,000. X-axis: years 1990 to 2018YTD*, labelled at 1990, 1995, 2000, 2005, 2010, 2015 and 2018YTD*, one bar per year. Values about: 1990 private about $2B with IPO about $1B; 1995 total about $14B; 1999 private about $58B, IPO about $31B; 2000 private about $126B, IPO about $30B (peak total about $156B); 2001 private about $48B, IPO about $10B; 2003 total about $22B; 2008 total about $34B; 2009 total about $24B; 2013 private about $70B, IPO about $36B; 2014 private about $90B, IPO about $6B; 2015 private about $86B, IPO about $3B; 2016 private about $87B, IPO about $11B; 2018YTD* private about $32B, IPO about $10B. NASDAQ line runs from about 500 in 1990 to about 7,500 at the end, with peak about 5,000 around 2000 and dip near 2009. No values are printed on the bars or line. Highlighted points: none. Legend below the axis: blue square Technology Private Financing, grey square Technology IPO, green line NASDAQ. Logo: Kleiner Perkins 2018 Internet Trends logo, grey wordmark letters, bottom-left, not a photograph.
Slide 40
Technology Companies = / 25% & Rising % of Market Cap, USA / USA Information Technology % of MSCI Market Capitalization / 40% / 33% / March, 2000 / 30% / 25% / April, 2018 / IT % of MSCI Market Capitalization, USA / 20% / 10% / 0% / 1997 1999 2001 2003 2005 2007 2009 2011 2013 2015 2017 / KLEINER PERKINS / 2018 / INTERNET TRENDS / Source: FactSet, Katy Huberty @ Morgan Stanley. MSCI, Formerly Morgan Stanley Capital / International = American provider of equity, fixed income, hedge fund stock market indexes, and / equity portfolio analysis tools. Data refers to MSCI’s index of USA publicly traded companies. / 39
Visuals: Chart: line chart, title 'USA Information Technology % of MSCI Market Capitalization'. Y-axis title 'IT % of MSCI Market Capitalization, USA', range 0% to 40% with gridlines at 0%, 10%, 20%, 30%, 40%; unit is percent. X-axis runs 1997 to 2017 with labels every two years (1997, 1999, 2001, 2003, 2005, 2007, 2009, 2011, 2013, 2015, 2017); the series ends around 2018. One series, a single green line (#258B74) about 3 pt wide with no markers; values about 14% in 1997, rising to about 21% in 1999, peaking at 33% in March 2000, falling to about 13% in 2002, about 17% in 2005, about 20% in 2012, and ending at 25% in April 2018. Highlighted points: 33% March, 2000 at the peak and 25% April, 2018 at the end, each labelled in bold green with the date in grey beneath. No legend. Logo: Kleiner Perkins 2018 Internet Trends wordmark, grey, bottom left.
Slides 41 to 295 continue in the full text file.
Download this deck
The hosted PDF of every library deck is free for readers of the SlideDeck Co newsletter. Join with your email and the viewer and download appear here.
Building a deck of your own? The SlideDeck Co Standard Deck is a slide library for business presentations: reviews, updates and plans.







