

Mary Meeker's Internet Trends 2017 was presented at the Code Conference on May 31, 2017, and published by Kleiner Perkins. It opens with a title slide and a conference-branded cover, then a contents page listing eleven sections: global internet trends, online advertising and commerce, interactive games, media, the cloud, the China and India internet, healthcare, public and private internet companies, macro thoughts and closing thoughts. The early slides cover global user growth, smartphone shipments and installed base, and US time spent on digital media. Each section opens with a full-bleed divider slide followed by chart-led slides whose headlines state the takeaway in a short phrase with the key figure. Slides worth studying include the 'Global Internet Users = 3.4B @ 46% Penetration' chart slide, which pairs a bar chart with a growth line and a source footer, and the time-spent chart that shows mobile overtaking desktop. The deck runs to 356 pages, so this review covers only the portion of text shown and the first twelve slides.
Slides worth studying
Questions about this deck
How many slides does the Mary Meeker, Kleiner Perkins Internet Trends 2017 deck have?
The deck runs to 356 pages, but the shown text covers only the first twelve slides. Slide 3 lists the closing section, Closing Thoughts, at pages 352-353.
What does the Mary Meeker, Kleiner Perkins Internet Trends 2017 deck say about global internet users?
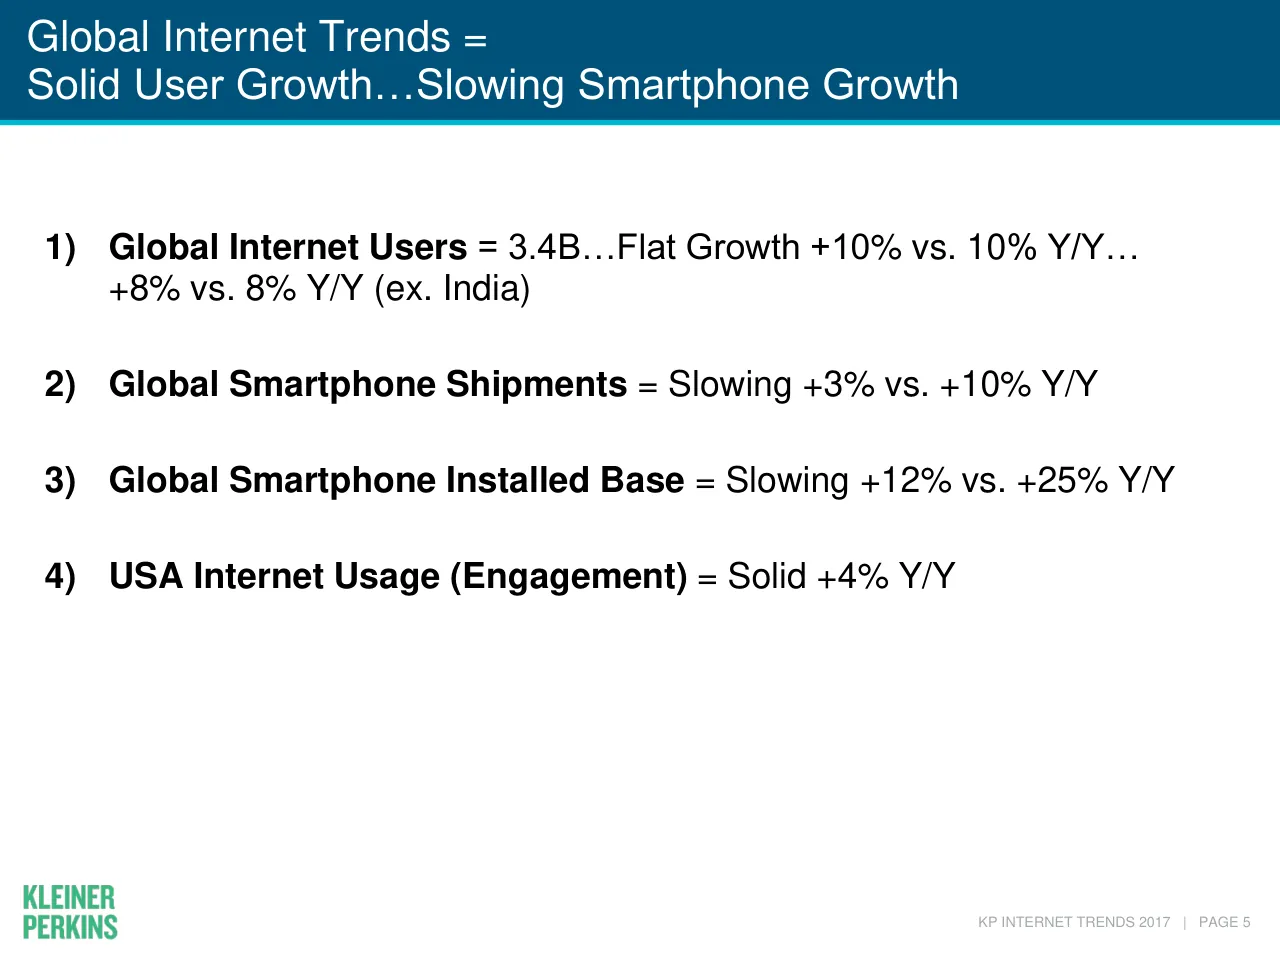
Slide 6 states Global Internet Users = 3.4B, with +10% vs. 10% Y/Y and +8% vs. 8% Y/Y (ex. India). Slide 7 charts global internet users from 2009 to 2016 under the headline Global Internet Users = 3.4B @ 46% Penetration.
What does the Kleiner Perkins Internet Trends 2017 deck by Mary Meeker say about global smartphone shipments?
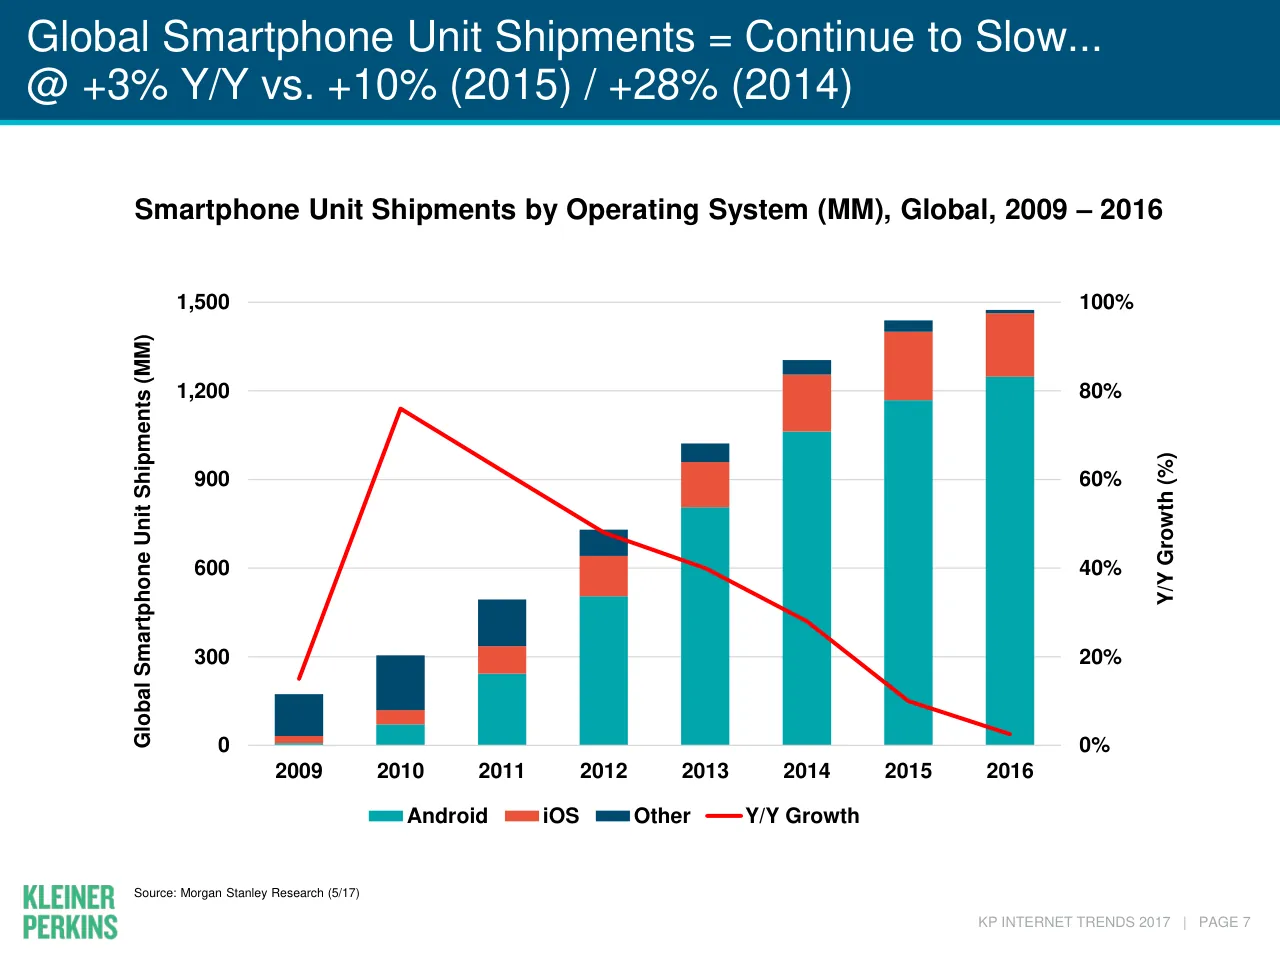
Slide 8 is headed Global Smartphone Unit Shipments = Continue to Slow, with +3% Y/Y vs. +10% (2015) and +28% (2014). Slide 6 summarizes global smartphone shipments as Slowing +3% vs. +10% Y/Y.
How is the Mary Meeker, Kleiner Perkins Internet Trends 2017 deck structured?
Slide 3 lists eleven sections, from 1) Global Internet Trends at pages 4-9 through 11) Closing Thoughts at pages 352-353. The sections run in order: Global Internet Trends, Online Advertising (+ Commerce), Interactive Games, Media, The Cloud, China Internet, India Internet, Healthcare, Global Public / Private Internet Companies, Some Macro Thoughts, and Closing Thoughts.
Details
- Company: Mary Meeker, Kleiner Perkins
- Year: 2017
- Type: Conference talk
- Industry: Venture capital and internet
- Pages: 356
More from Mary Meeker
- Mary Meeker, Bond conference talk, 2019
- Mary Meeker, Kleiner Perkins conference talk, 2018
- Mary Meeker, Kleiner Perkins conference talk, 2016
- Mary Meeker, Kleiner Perkins conference talk, 2015
All Mary Meeker decks in the library
Review score: 8 out of 10, Strong
Presentation quality, judged with the SlideDeck Co review heuristic. Ask, evidence and idea merit are not rated here.
The deck uses one disciplined system across the 72 pages I saw: a blue title band that states the takeaway with its key figure, a clean chart or screenshot body, and a source footer on nearly every slide. Charts such as slides 8 and 10 are readable, with direct data labels, a clear legend, and one accent color for growth. The route is easy to follow, with a contents slide (3), section dividers (6, 11), and short pivot statements between topics. Weaknesses are the heavy density of many chart and screenshot slides, tiny source notes and screenshot text, and a few bare-header or text-only pages.
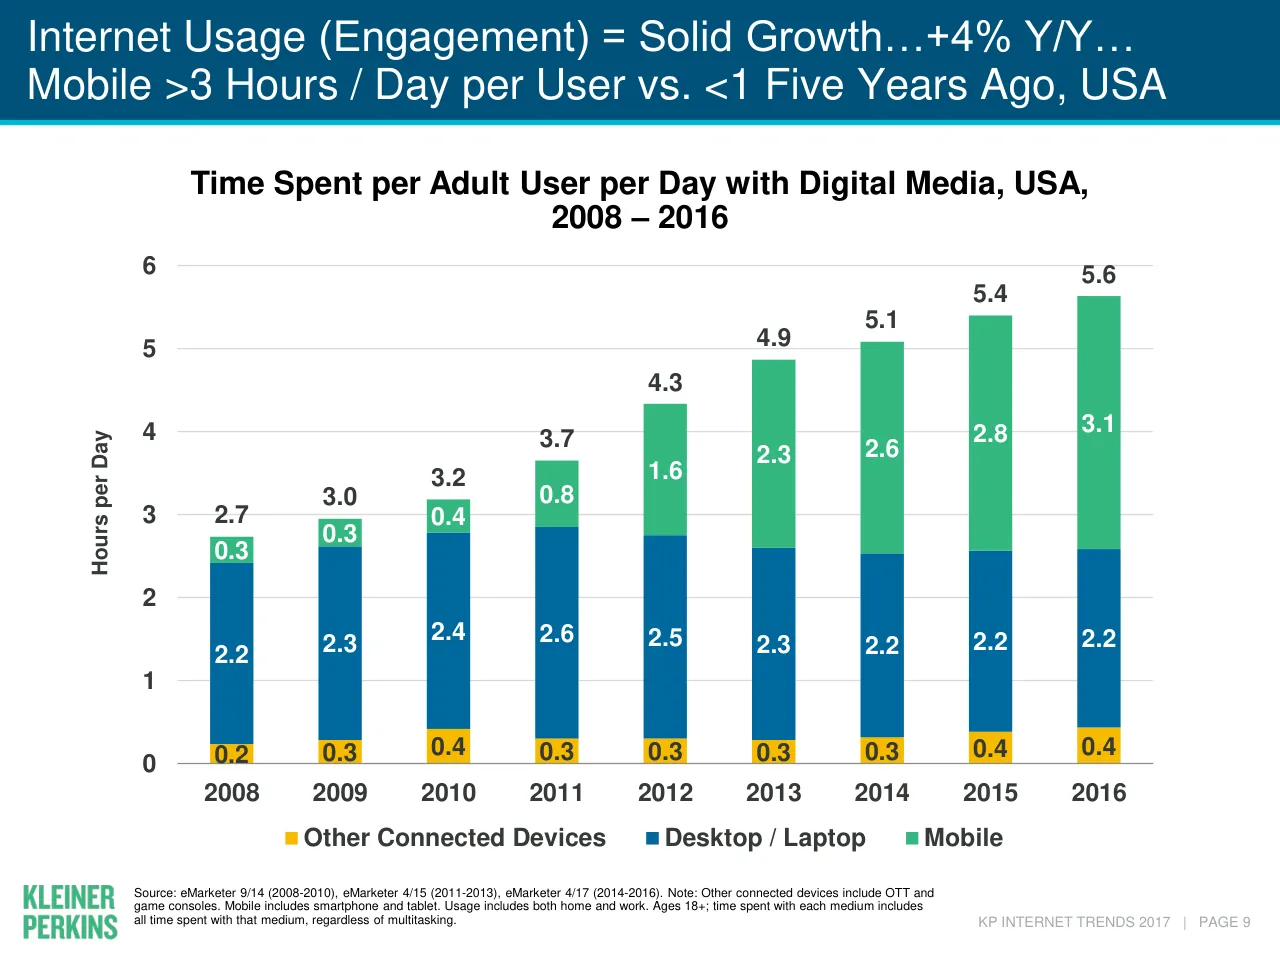
Worth keeping: Keep the takeaway-with-number title band, the consistent chart styling with direct labels and sources (slides 8 and 10), and the section divider rhythm.
Most useful repair: Fix the slides with an empty header band over a lone italic statement (12, 17, 20, 31, 36, 37, 38, 42, 58, 65) and the unstructured text on slide 4.
What would change the score: I would cut or enlarge the small-print screenshots and dual panels (21, 28, 45, 46, 62) so key callouts survive projection, and shorten the titles that run to two dense lines.
Confidence medium. 72 of 356 pages inspected on contact sheets, 4 at readable size. Reviewed 2026-11-08. Model-assisted review (claude-sonnet-5-5).
Full text of the slides (356 slides)
Every slide's words and a description of its charts and images, so the deck can be searched and rebuilt. Also available as Markdown.
Slide 1
Internet Trends / 2017 / Mary Meeker / May 31 @ Code 2017
Visuals: One logo mark at the top centre: a small stylised serif glyph in light steel blue #A8C0D4 that reads as a pair of parentheses '()'. No photographs, charts, or other graphics.
Slide 2
INTERNET TRENDS 2017 –
CODE CONFERENCE
Mary Meeker
May 31, 2017
kpcb.com/InternetTrends
Visuals: One logo: the Kleiner Perkins wordmark, two stacked lines reading KLEINER / PERKINS in a bold condensed sans-serif, set in green #33B780, placed at x 6.5%, y 77.0%, w 12.9%, h 10.0% (image 164 by 96 pixels). No photographs, charts or diagrams. The top band is a decorative filled rectangle in #33B780 at x 0, y 0, w 100%, h 2.7%.
Slide 3
Internet Trends 2017
1) Global Internet Trends = Solid…Slowing Smartphone Growth
4-9
2) Online Advertising (+ Commerce) = Increasingly Measurable + Actionable
10-79
3) Interactive Games = Motherlode of Tech Product Innovation + Modern Learning
80-150
4) Media = Distribution Disruption @ Torrid Pace
151-177
5) The Cloud = Accelerating Change Across Enterprises
178-192
6) China Internet = Golden Age of Entertainment + Transportation
(Provided by Hillhouse Capital)
193-231
7) India Internet = Competition Continues to Intensify…Consumers Winning
232-287
8) Healthcare @ Digital Inflection Point
288-319
9) Global Public / Private Internet Companies…
320-333
10) Some Macro Thoughts…
334-351
11) Closing Thoughts…
352-353
KP INTERNET TRENDS 2017 | PAGE 2
Visuals: Two non-text elements: a thin white horizontal rule spanning from about 3.4% to 96.7% of slide width at about 15.8% of slide height, about 2 px thick, and the green stacked Kleiner Perkins wordmark (KLEINER over PERKINS, bold condensed sans capitals) in the bottom-left corner. No charts, photographs or icons.
Slide 4
Thanks...
Kleiner Perkins Partners
Alexander Krey & Ansel Parikh - who were fearless and sometimes sleepless - helped / steer the ideas / presentation we hope you find useful / learn from / improve on. Key / contributors to specific content include: Noah Knauf & Nina Lu (Healthcare), Bing Gordon / (Interactive Games), Alex Tran & Anjney Midha (India), Daegwon Chae (Ads + / Commerce) and Alex Kurland & Lucas Swisher (Enterprise). In addition, Mood Rowghani, / Eric Feng, Daniel Axelsen, Dino Becirovic and Shabih Rizvi were more than on call with / help.
Hillhouse Capital
Especially Liang Wu…his / their contribution of the China sector of Internet Trends / provides an especially thoughtful overview of the largest market of Internet users in the / world…
Participants in Evolution of Internet Connectivity
From creators to consumers who keep us on our toes 24x7...and the people who directly / help us prepare this presentation...
Kara & Walt
For continuing to do what you do so well...
KP INTERNET TRENDS 2017 | PAGE 3
Visuals: Visual elements: one logo only. Kleiner Perkins logo at bottom-left, 164 by 96 pixel image: the words KLEINER and PERKINS stacked in bold condensed uppercase sans-serif letters, in a bright medium green about #3CB878, left-aligned, no tagline. No photographs, charts, tables or shapes other than the header band and the thin teal rule.
Slide 5
GLOBAL INTERNET TRENDS = / SOLID USER GROWTH… / SLOWING SMARTPHONE GROWTH / KP INTERNET TRENDS 2017 | PAGE 4
Visuals: Two non-text elements. (1) A thin white horizontal line running from about x 3.3% to x 95% of the slide width at about y 17% of the slide height, with a stroke of roughly 2 px in white #FFFFFF and no ornament. (2) The Kleiner Perkins wordmark logo at bottom-left, set in two stacked lines reading KLEINER / PERKINS in condensed bold capitals, coloured green about #4CB55B, placed at x 1.8%, y 92.2%, w 7.5%, h 5.8%. No photographs, charts, or diagrams.
Slide 6
Global Internet Trends =
Solid User Growth…Slowing Smartphone Growth
1) Global Internet Users = 3.4B…Flat Growth +10% vs. 10% Y/Y…
+8% vs. 8% Y/Y (ex. India)
2) Global Smartphone Shipments = Slowing +3% vs. +10% Y/Y
3) Global Smartphone Installed Base = Slowing +12% vs. +25% Y/Y
4) USA Internet Usage (Engagement) = Solid +4% Y/Y
KP INTERNET TRENDS 2017 | PAGE 5
Visuals: One logo: the Kleiner Perkins wordmark, two stacked lines reading KLEINER over PERKINS in bold condensed uppercase sans-serif, in green (about #3BB273), placed bottom-left in a 164 by 96 pixel image. No charts, photographs, illustrations or other graphics.
Slide 7
Global Internet Users = 3.4B @ 46% Penetration...
+10% Y/Y vs. +10%...+8% Y/Y vs. +8% (Ex-India)
Global Internet Users (MM), 2009 – 2016
4,000
35%
3,500
30%
3,000
25%
2,500
20%
Y/Y % Growth
Global Internet Users (MM)
2,000
15%
1,500
10%
1,000
5%
500
0
0%
2009
2010
2011
2012
2013
2014
2015
2016
Global Internet Users (MM)
Y/Y Growth (%)
Source: United Nations / International Telecommunications Union, US Census Bureau. Internet user data is as of mid-year. Internet user data for:
USA from Pew Research, China from CNNIC, Iran from Islamic Republic News Agency / InternetWorldStats / KPCB estimates, India from KPCB
estimates based on IAMAI data, Indonesia from APJII.
KP INTERNET TRENDS 2017 | PAGE 6
Visuals: Chart: combined bar and line chart titled 'Global Internet Users (MM), 2009 – 2016' in bold black. Left y-axis titled 'Global Internet Users (MM)' ranges 0 to 4,000 in steps of 500 with light grey horizontal gridlines. Right y-axis titled 'Y/Y % Growth' ranges 0% to 35% in steps of 5%. X-axis shows years 2009 to 2016. Series 1, blue (#00689D) columns, Global Internet Users (MM), printed values: none; estimated values: 2009 about 1,620; 2010 about 1,840; 2011 about 2,090; 2012 about 2,300; 2013 about 2,550; 2014 about 2,780; 2015 about 3,060; 2016 about 3,370. Series 2, red (#FF0000) line of about 4 pt, Y/Y Growth (%), no 2009 point; estimated values: 2010 about 14%; 2011 about 13.5%; 2012 about 10.5%; 2013 about 11%; 2014 about 9%; 2015 about 10%; 2016 about 10%. No values are printed on the chart and no points are highlighted. Legend below the x-axis: blue square labelled 'Global Internet Users (MM)' and red line labelled 'Y/Y Growth (%)'. Logo: Kleiner Perkins wordmark in green (#3DBE7A) stacked as two bold lines, KLEINER over PERKINS.
Slide 8
Global Smartphone Unit Shipments = Continue to Slow... / @ +3% Y/Y vs. +10% (2015) / +28% (2014) / Smartphone Unit Shipments by Operating System (MM), Global, 2009 – 2016 / 1,500 / 100% / 1,200 / 80% / 900 / 60% / Y/Y Growth (%) / Global Smartphone Unit Shipments (MM) / 600 / 40% / 300 / 20% / 0 / 0% / 2009 / 2010 / 2011 / 2012 / 2013 / 2014 / 2015 / 2016 / Android / iOS / Other / Y/Y Growth / KLEINER PERKINS / Source: Morgan Stanley Research (5/17) / KP INTERNET TRENDS 2017 | PAGE 7
Visuals: Chart: combined stacked column and line chart. Chart title: 'Smartphone Unit Shipments by Operating System (MM), Global, 2009 – 2016' (bold, black, centred above the plot). Left y-axis: 'Global Smartphone Unit Shipments (MM)', range 0 to 1,500, gridlines at 300, 600, 900, 1,200 and 1,500, light grey horizontal gridlines. Right y-axis: 'Y/Y Growth (%)', range 0% to 100%, labels at 0%, 20%, 40%, 60%, 80%, 100%. X-axis: years 2009 to 2016 as categories, bold black labels. Stacked columns, bottom to top: Android (teal #00A6AD), iOS (red-orange #EA543B), Other (dark navy #004A6F). Estimated column totals (no values printed on the slide, so these are about readings): 2009 about 170 MM (Android about 7, iOS about 28, Other about 135); 2010 about 300 MM (Android about 70, iOS about 50, Other about 185); 2011 about 490 MM (Android about 240, iOS about 95, Other about 155); 2012 about 725 MM (Android about 505, iOS about 135, Other about 90); 2013 about 1,020 MM (Android about 805, iOS about 155, Other about 60); 2014 about 1,300 MM (Android about 1,060, iOS about 195, Other about 45); 2015 about 1,440 MM (Android about 1,165, iOS about 235, Other about 40); 2016 about 1,475 MM (Android about 1,245, iOS about 215, Other about 15). Line series 'Y/Y Growth' in pure red (#FF0000), about 2.5pt thick, plotted against the right axis with markers at each year but no visible marker shapes; printed label values on the slide are only in the title: +3% for 2016, +10% for 2015, +28% for 2014; estimated points: 2009 about 15%, 2010 about 76%, 2011 about 62%, 2012 about 48%, 2013 about 40%, 2014 28%, 2015 10%, 2016 3%. Legend below the plot, horizontal, centred: teal swatch 'Android', red-orange swatch 'iOS', navy swatch 'Other', red line swatch 'Y/Y Growth'. No highlighted points. Logo: Kleiner Perkins wordmark, two stacked bold uppercase lines 'KLEINER' over 'PERKINS' in green (about #3DB86E), bottom left.
Slide 9
Global Smartphone Installed Base = 2.8B… / +12% Y/Y vs. +25% (2015) / +37% (2014) / Global Smartphone Installed Base (MM), 2009 – 2016 / 3,500 / 70% / 3,000 / 60% / 2,500 / 50% / 2,000 / 40% / Y/Y % Growth / Global Smartphone Installed Base (MM) / 1,500 / 30% / 1,000 / 20% / 500 / 10% / 0 / 0% / 2009 / 2010 / 2011 / 2012 / 2013 / 2014 / 2015 / 2016 / Global Smartphone Installed Base (MM) / Y/Y Growth (%) / KP INTERNET TRENDS 2017 | PAGE 8 / Source: Morgan Stanley Research (5/17) / Note: Owing to use of different source, prior period data may have slight adjustments vs prior reports. Smartphone installed base based on / preceding 8 quarters of smartphone shipments.
Visuals: Combo chart titled 'Global Smartphone Installed Base (MM), 2009 – 2016'. Left y-axis titled 'Global Smartphone Installed Base (MM)', range 0 to 3,500 in steps of 500, gridlines light grey. Right y-axis titled 'Y/Y % Growth', range 0% to 70% in steps of 10%. X-axis categories 2009 to 2016, no axis title. Series 1 is a column series 'Global Smartphone Installed Base (MM)' in #00689D blue with no printed data labels; estimated values: 2009 about 300, 2010 about 375, 2011 about 610, 2012 about 990, 2013 about 1,475, 2014 about 2,025, 2015 about 2,540, 2016 about 2,830. Series 2 is a red line 'Y/Y Growth (%)' with no printed data labels; estimated values: 2010 about 25%, 2011 about 63%, 2012 about 62%, 2013 about 49%, 2014 about 37%, 2015 about 25%, 2016 about 12%; the printed title gives +25% for 2015, +37% for 2014 and +12% for 2016. No points are highlighted. Legend below the chart: blue square for the column series and red line sample for the growth series.
Slide 10
Internet Usage (Engagement) = Solid Growth…+4% Y/Y… / Mobile >3 Hours / Day per User vs. <1 Five Years Ago, USA / Time Spent per Adult User per Day with Digital Media, USA, / 2008 – 2016 / 6 / 5 / 4 / 3 / 2 / 1 / 0 / Hours per Day / 2.7 / 3.0 / 3.2 / 3.7 / 4.3 / 4.9 / 5.1 / 5.4 / 5.6 / 0.2 / 0.3 / 0.4 / 0.3 / 0.3 / 0.3 / 0.3 / 0.4 / 0.4 / 2.2 / 2.3 / 2.4 / 2.6 / 2.5 / 2.3 / 2.2 / 2.2 / 2.2 / 0.3 / 0.3 / 0.4 / 0.8 / 1.6 / 2.3 / 2.6 / 2.8 / 3.1 / 2008 / 2009 / 2010 / 2011 / 2012 / 2013 / 2014 / 2015 / 2016 / Other Connected Devices / Desktop / Laptop / Mobile / Source: eMarketer 9/14 (2008-2010), eMarketer 4/15 (2011-2013), eMarketer 4/17 (2014-2016). Note: Other connected devices include OTT and / game consoles. Mobile includes smartphone and tablet. Usage includes both home and work. Ages 18+; time spent with each medium includes / all time spent with that medium, regardless of multitasking. / KP INTERNET TRENDS 2017 | PAGE 9
Visuals: One stacked vertical bar chart. Chart title: 'Time Spent per Adult User per Day with Digital Media, USA, 2008 – 2016'. Y-axis: titled 'Hours per Day', linear, range 0 to 6, gridlines at each integer 0 to 6 in light grey. X-axis: years 2008 to 2016 as categories, baseline in grey. Series, stacked bottom to top: Other Connected Devices (yellow #F6BB00), Desktop / Laptop (blue #00689D), Mobile (green #33B780). Values printed inside each segment and total printed above each bar. 2008: Other 0.2, Desktop 2.2, Mobile 0.3, total 2.7. 2009: 0.3, 2.3, 0.3, total 3.0. 2010: 0.4, 2.4, 0.4, total 3.2. 2011: 0.3, 2.6, 0.8, total 3.7. 2012: 0.3, 2.5, 1.6, total 4.3. 2013: 0.3, 2.3, 2.3, total 4.9. 2014: 0.3, 2.2, 2.6, total 5.1. 2015: 0.4, 2.2, 2.8, total 5.4. 2016: 0.4, 2.2, 3.1, total 5.6. Segment labels are white on blue and green and dark grey on yellow; totals are dark grey. Legend below the x-axis, bold dark grey text with square swatches. No bars are highlighted. Bars are flat with no outlines or shadows. Logo: Kleiner Perkins wordmark in green, not a photograph. A thin cyan rule sits under the title band.
Slide 11
ONLINE ADVERTISING (+ COMMERCE) =
INCREASINGLY
MEASURABLE + ACTIONABLE
KP INTERNET TRENDS 2017 | PAGE 10
Visuals: Two non-photographic elements only: a thin white horizontal rule (line) spanning from about x 3.3% to x 95.2% at about y 17.1%, and the Kleiner Perkins wordmark logo in green stacked two-line bold condensed capitals reading 'KLEINER' over 'PERKINS' at bottom-left. No charts, tables, photographs or diagrams.
Slide 12
Ad Growth = / Driven by Mobile / KP INTERNET TRENDS 2017 | PAGE 11
Visuals: Non-text elements: a solid dark teal header band (#00517A) across the top 12.5% of the slide, with a thin cyan rule along its lower edge; and the Kleiner Perkins logo (green wordmark, two stacked lines reading KLEINER and PERKINS) at bottom-left. No charts, photographs or diagrams.
Slide 13
Online Advertising = Growth Accelerating, +22% vs. +20% Y/Y... / Mobile $ > Desktop (2016) on Higher Growth, USA
USA Internet Advertising ($B), 2009 – 2016
$80 / $70 / $60 / $50 / $40 / $30 / $20 / $10 / $0
40% / 35% / 30% / 25% / 20% / 15% / 10% / 5% / 0%
USA Internet Advertising ($B)
% Y/Y Growth
$23 / $26 / $32 / $37 / $43 / $50 / $60 / $73
2009 / 2010 / 2011 / 2012 / 2013 / 2014 / 2015 / 2016
Desktop Advertising / Mobile Advertising / Y/Y Growth
Source: IAB / PWC Internet Advertising Report (2016)
KP INTERNET TRENDS 2017 | PAGE 12
Visuals: Chart: combined stacked column and line chart. Chart title: 'USA Internet Advertising ($B), 2009 – 2016' in bold black. Left y-axis titled 'USA Internet Advertising ($B)', range $0 to $80 in $10 steps. Right y-axis titled '% Y/Y Growth', range 0% to 40% in 5% steps. X-axis: years 2009 to 2016, categories, no axis title. Series 1, Desktop Advertising: dark blue #00689D stacked columns; about $23 in 2009 (no mobile), about $25.5 in 2010, about $30 in 2011, about $33 in 2012, about $36 in 2013, about $37 in 2014, about $39 in 2015, about $36 in 2016 (values estimated, not printed). Series 2, Mobile Advertising: green #31AF78 stacked on top of desktop; about $0.5 in 2010, about $2 in 2011, about $4 in 2012, about $7 in 2013, about $13 in 2014, about $21 in 2015, about $37 in 2016 (estimated, not printed). Stack totals are printed above each column: $23, $26, $32, $37, $43, $50, $60, $73. Series 3, Y/Y Growth: red-orange #E94F37 line with no markers, plotted against the right axis; about 14.5% in 2010, about 22% in 2011 (highest point), about 15% in 2012, about 17% in 2013, about 15.5% in 2014, about 20.5% in 2015, about 21.5% in 2016 (estimated, no values printed). Legend: horizontal row below the x-axis with swatch and label for Desktop Advertising (dark blue bar), Mobile Advertising (green bar) and Y/Y Growth (red line). No highlighted points. Gridlines: thin light grey horizontal lines at each left-axis step. No logos other than the Kleiner Perkins logo at bottom left.
Slide 14
Advertising $ =
Shift to Usage (Mobile) Continues
% of Time Spent in Media vs. % of Advertising Spending, USA, 2016
Time Spent
Ad Spend
% of Total Media Consumption Time
or Advertising Spending
50%
40%
Total
Of Which
Internet Ad Mobile Ad
= $73B
= $37B
38%
38%
30%
28%
20%
20%
20%
21%
~$16B
Opportunity
in USA
10%
12%
9%
9%
4%
0%
Radio
TV
Internet
Mobile
Source: Internet and Mobile advertising spend based on IAB and PwC data for full year 2016. Print, Radio, and TV advertising spend based on
Magna Global estimates for full year 2016. Print includes newspaper and magazine. Internet (IAB) includes desktop + laptop + other connected
devices. ~$16B opportunity calculated assuming Mobile (IAB) ad spend share equal its respective time spent share. Time spent share data
based on eMarketer (4/17). Arrows denote Y/Y shift in percent share. Excludes out-of-home, video game, and cinema advertising.
KP INTERNET TRENDS 2017 | PAGE 13
Visuals: One clustered column chart titled '% of Time Spent in Media vs. % of Advertising Spending, USA, 2016'. Y axis: '% of Total Media Consumption Time or Advertising Spending', linear, 0% to 50%, ticks every 10%, light grey horizontal gridlines at each tick. X categories: Print, Radio, TV, Internet, Mobile. Series 1 Time Spent (yellow #FCD03F): Print 4%, Radio 9%, TV 38%, Internet 20%, Mobile 28%. Series 2 Ad Spend (cyan #02B5CC): Print 12%, Radio 9%, TV 38%, Internet 20%, Mobile 21%. Each bar carries its printed value as a data label: dark grey #353B37 bold on yellow bars and white bold on cyan bars. Legend at top centre: yellow square labelled Time Spent, cyan square labelled Ad Spend. Highlights: a red dashed ellipse around the top-right callout reading Total Internet Ad = $73B and Of Which Mobile Ad = $37B; a light green dashed box above the Mobile Ad Spend bar spanning 21% to 28%; a green box at right reading ~$16B Opportunity in USA with a black arrow pointing to the Mobile Ad Spend bar. Ten block arrows mark year-over-year shifts: Print Time Spent none, Print Ad Spend down arrow; Radio Time Spent down arrow, Radio Ad Spend down arrow; TV Time Spent up arrow, TV Ad Spend down arrow; Internet Time Spent down arrow, Internet Ad Spend down arrow; Mobile Time Spent up arrow, Mobile Ad Spend up arrow. Print has a pair of stacked bars (equals sign) drawn beside its Time Spent bar indicating no change. Each arrow is a light blue bevelled block arrow with a soft shadow.
Slide 15
Advertising $ =
Internet > TV Within 6 Months, Global
Internet vs. TV Ad Spend ($B), Global, 1995-2017E
$250
$200
$150
Global Advertising Spend ($B)
$100
$50
$0
1995 1996 1997 1998 1999 2000 2001 2002 2003 2004 2005 2006 2007 2008 2009 2010 2011 2012 2013 2014 2015 2016 2017E
Global Internet Ad Spend Global TV Ad Spend
Source: Zenith Advertising Expenditure Forecasts (3/17)
KP INTERNET TRENDS 2017 | PAGE 14
Visuals: Chart: line chart, title 'Internet vs. TV Ad Spend ($B), Global, 1995-2017E'. Y-axis: 'Global Advertising Spend ($B)', linear, $0 to $250, gridlines every $50 (labels $0, $50, $100, $150, $200, $250). X-axis: years 1995 to 2016 plus 2017E, labels rotated about 45 degrees, no axis title. Series 1, 'Global Internet Ad Spend', cyan line, values about: 1995 $0, 1996 $0, 1997 $1, 1998 $2, 1999 $5, 2000 $8, 2001 $9, 2002 $10, 2003 $12, 2004 $15, 2005 $21, 2006 $28, 2007 $39, 2008 $49, 2009 $54, 2010 $66, 2011 $74, 2012 $88, 2013 $105, 2014 $128, 2015 $155, 2016 $183, 2017E about $205 shown as a dashed continuation. Series 2, 'Global TV Ad Spend', red line, values about: 1995 $80, 1996 $87, 1997 $94, 1998 $99, 1999 $107, 2000 $118, 2001 $115, 2002 $118, 2003 $122, 2004 $132, 2005 $136, 2006 $144, 2007 $150, 2008 $152, 2009 $141, 2010 $157, 2011 $167, 2012 $175, 2013 $181, 2014 $186, 2015 $187, 2016 $190, 2017E about $192 shown as a dashed continuation. Legend: horizontal, centred below the x-axis, cyan line swatch followed by 'Global Internet Ad Spend', then red line swatch followed by 'Global TV Ad Spend'. Highlighted points: none. The cross-over where internet passes TV is between 2016 and 2017E. Logo: Kleiner Perkins wordmark in two stacked lines, 'KLEINER' over 'PERKINS', bold condensed sans-serif in green.
Slide 16
Google + Facebook =
85% (& Rising) Share of Internet Advertising Growth, USA
Advertising Revenue ($B) and Growth Rates (%) of
Google vs. Facebook vs. Other, USA, 2015 – 2016
$50
$45
$40
$35
$30
$25
USA Advertising Revenue ($B)
$20
$15
$10
$5
$
+20% Y/Y
+62% Y/Y
+9% Y/Y
2015
2016
2015
2016
2015
2016
Others
Source: IAB / PWC Advertising Report (2016), Facebook, Morgan Stanley Research
Note: Facebook revenue includes Canada. Google USA ad revenue per Morgan Stanley estimates as company only discloses total ad revenue
and total USA revenue. “Others” includes all other USA internet (mobile + desktop) advertising revenue ex-Google / Facebook.
KP INTERNET TRENDS 2017 | PAGE 15
Visuals: Chart: clustered column chart. Title (bold, centred): 'Advertising Revenue ($B) and Growth Rates (%) of Google vs. Facebook vs. Other, USA, 2015 – 2016'. Y-axis title (rotated): 'USA Advertising Revenue ($B)'. Y-axis range $0 to $50 in $5 steps, labelled $, $5, $10 ... $50, with light grey horizontal gridlines at each step. X-axis: three groups labelled Google, Facebook, Others, each with bars labelled 2015 and 2016. No printed data values on the bars; values below are estimates marked about. Google 2015 bar (#31AF78): about $29.5B. Google 2016 bar (#33B780): about $35.6B. Facebook 2015 bar (#00689D): about $8.2B. Facebook 2016 bar (#00689D): about $13.5B. Others 2015 bar (#C82055): about $21.1B. Others 2016 bar (#C82055): about $23.3B. No legend; colour identifies the company group. Annotations: '+20% Y/Y' in bold italic green #33B780 above Google with a thin black arrow rising from about the top of the 2015 bar to just above the 2016 bar; '+62% Y/Y' in bold italic blue #00689D above Facebook with a thin black arrow rising from the 2015 bar to the 2016 bar; '+9% Y/Y' in bold italic crimson #961840 above Others with a thin black arrow running shallowly up-right from the 2015 bar to the 2016 bar. Highlighted points: none. Logo: Kleiner Perkins wordmark, two stacked words in green, at lower left.
Slide 17
Ad Measurability =
Can Be Triple-Edged…
When Things Are Measured =
People Don’t Always Like What They See…
Users Don’t Always Like Data Collected
KP INTERNET TRENDS 2017 | PAGE 16
KLEINER PERKINS
Visuals: One visual element: the Kleiner Perkins logo, a green wordmark reading KLEINER on the first line and PERKINS on the second, set in a heavy condensed sans-serif in green about #3CB878, placed bottom-left in a 164 by 96 pixel image at 1.8%, 92.2%, 7.5% by 5.8%. No photographs, charts, diagrams or icons.
Slide 18
Advertisers = Like Measurable Engagement Metrics But…
Some Find Measuring ROI Challenging (as with Offline)
Social Advertisers
Metrics Used to Measure Success, 6/16
70%
61%
60%
56%
50%
40%
% of Respondents
38%
34%
30%
21%
20%
15%
10%
0%
Engagement Conversion & Revenue Amplification & Brand Awareness
Social Media Marketing
Top Challenges, 6/16
70%
60%
50%
40%
% of Respondents
30%
20%
10%
0%
Measuring ROI
Securing Budget & Resources
Tying Social Campaigns to Business Goals
Source: SimplyMeasured State of Social Marketing Annual Report (6/16)
Note: Based on a survey of social media advertisers, n=350.
KLEINER PERKINS
KP INTERNET TRENDS 2017 | PAGE 17
Visuals: Two vertical bar charts side by side. Left chart: title 'Social Advertisers', subtitle 'Metrics Used to Measure Success, 6/16'. Y axis titled '% of Respondents', scale 0% to 70% in 10% steps with light grey horizontal gridlines. Series (single series, bars): Engagement 56% (cyan bar, highlighted, #02B5CC); Conversion & Revenue 21% (blue bar #00689D); Amplification & Brand Awareness about 15% (blue bar #00689D, label 15% printed). Bars are narrow, about 3.4% of slide width for the highlighted bar and 14.1% wide for the others as measured, with no legend. Right chart: title 'Social Media Marketing', subtitle 'Top Challenges, 6/16'. Y axis titled '% of Respondents', scale 0% to 70% in 10% steps with light grey gridlines. Series: Measuring ROI 61% (cyan highlighted bar #02B5CC); Securing Budget & Resources 38% (blue #00689D); Tying Social Campaigns to Business Goals about 34% (blue #00689D, label 34% printed). No legend. Value labels sit just above each bar in bold black. The Kleiner Perkins logo is a green wordmark, bottom-left. Nothing is photographed, cropped or overlaid.
Slide 19
Ad Blocking = Growth Continues…Especially in Developing Markets… / Users Increasingly Opt Out of Stuff They Don’t Want / Adblocking Users on Web / (Mobile + Desktop), Global, 4/09 – 12/16 / Global Adblocking Users (MM) / 400 / 300 / 200 / 100 / 0 / 2009 2010 2011 2012 2013 2014 2015 2016 / Desktop Adblocking Software Users / Mobile Adblocking Browser Users / Adblocking Penetration / (Mobile + Desktop), Selected / Countries, 12/16 / Country / Desktop / Mobile / China / 1% / 13% / India / 1% / 28% / USA / 18% / 1% / Brazil / 6% / 1% / Japan / 3% / -- / Russia / 6% / 3% / Germany / 28% / 1% / Indonesia / 8% / 58% / UK / 16% / 1% / France / 11% / 1% / Canada / 24% / -- / Source: PageFair 2015, 2017 reports. These two data sets have not been de-duplicated. The number of desktop adblockers after 1/16 are estimates based on the / observed trend in desktop adblocking and provided by PageFair. Note that mobile adblocking refers to web / browser-based adblocking and not in-app adblocking. / Desktop adblocking estimates are for global monthly active users of desktop adblocking software between 4/09 – 12/16, as calculated in the PageFair’s 2015 and 2017 / reports. Mobile adblocking estimates are for global monthly active users of mobile browsers that block ads by default between 9/14 – 12/16, including the number of / Digicel subscribers in the Caribbean (added 10/15), as calculated in the PageFair & Priori Data 2016 and PageFair 2017 Adblocking Report. / KP INTERNET TRENDS 2017 | PAGE 18
Visuals: Chart (left): line chart titled 'Adblocking Users on Web (Mobile + Desktop), Global, 4/09 – 12/16', with 'Users' in bold italic. Y-axis titled 'Global Adblocking Users (MM)', rotated vertically, range 0 to 400, labelled gridlines at 0, 100, 200, 300, 400 in light grey. X-axis 2009 to 2016 with year labels at the start of each year, bold black. Series 1, 'Desktop Adblocking Software Users', solid red line: about 20 MM in 2009, about 25 MM late 2009, about 45 MM in 2011, about 40 MM in 2012, rising steeply from 2012 through 2013 (about 90 MM mid-2013), about 140 MM in 2014, a marked point at about 200 MM at the 2015 crossing, then about 215 MM in 2016 and about 236 MM at the end of 2016. Series 2, 'Mobile Adblocking Browser Users', solid green line: starts about 145 MM in late 2014 and rises steeply to about 275 MM in mid-2016 and about 380 MM at the end of 2016 (values after the first and last tick are about). No data labels are printed; values above are estimates. Legend below the x-axis, left-aligned, with a short red line swatch and a short green line swatch next to the two series names. No highlighted points. Table (right): 3 columns (Country, Desktop, Mobile) and 11 rows including header. Header row fill #00689D with white bold text. Body rows alternate white and #EBF7FF, separated by thin black horizontal rules. Rows: China 1% 13%; India 1% 28%; USA 18% 1%; Brazil 6% 1%; Japan 3% --; Russia 6% 3%; Germany 28% 1%; Indonesia 8% 58%; UK 16% 1%; France 11% 1%; Canada 24% --. Logo (bottom left): the 'KLEINER PERKINS' wordmark in green, two stacked lines, bold condensed sans, about 164 by 96 pixels.
Slide 20
Leading Platform Ad Offerings =
Rapidly Improving with
Back-End Data +
Front-End Measurement Tools +
Targeted Delivery of Ads
Users Increasingly Want
KP INTERNET TRENDS 2017 | PAGE 19
Visuals: Kleiner Perkins logo at bottom left: a stacked two-line wordmark reading KLEINER over PERKINS in a bold condensed sans-serif capitals in green, approximately #3DBE7A, placed in a 164 by 96 pixel image. No other photographs, charts, icons or diagrams. The only other graphic is the dark blue header band with a thin teal rule along its lower edge.
Slide 21
Leading Online Ad Platforms = / Providing More Ways to Target + Measure Ads / Facebook (Delivery Insights) / Google (AdWords) / Snap (Snap Ads) / Source: Facebook, Google, Snap / KP INTERNET TRENDS 2017 | PAGE 20
Visuals: Three UI screenshots of online ad platforms, no charts drawn by the slide itself. (1) Facebook Delivery Insights, boxed, top-left: a white app window with a dark grey top bar containing a Facebook logo, 'Delivery Insights' label, search field and user avatar; below, an 'Ad Set 1 of 1: Bailey Round 2' dropdown, a 'Performance Details' panel, and a line chart of 'Amount Spent' in blue over dates Mar 8 to Mar 14 with y-axis labels $11.00, $10.50, $10.00, $9.50; beneath is a table with columns Date, Amount Spent, Auction Dedupe Rate, Overlapping Ad Set 1, Overlapping Ad Set 2, Overlapping Ad Set 3 and rows dated 03/15/2017 to 03/11/2017 with amounts $10.42, $9.97, $9.78, $9.88, $10.63 and 0.00% values. Light grey and white palette with blue line. (2) Google AdWords, boxed, top-right: a dark charcoal left sidebar listing campaigns (Antique, Bands, Bracelets, Design Your Own, Designer, Diamond Rings, Platinum, Princess Cut, Promise Rings, Simple, Solitaire, Platinum, White Gold), a top bar reading 'All campaigns > Diamond Rings', KPI cards Clicks 16.6k (blue), Conversions 248 (red), Cost $10.7k and CTR 1.51%, a line chart with blue and red series, a 'Top ad groups' table with blue and red bars, and a 'Devices' panel with Mobile, Tablet, Desktop bars in blue, red and yellow. (3) Snap Ads Ad Manager, boxed, bottom-centre: a green header bar reading 'Ad Manager' with 'Snap Inc | Snap Ads' at right; 'Ad Account: Snap Ads' heading; Performance panel with SPEND $18,421.14, IMPRESSIONS 5.3M, ECPM $3.46, SWIPE UPS 21.1K, COST PER SWIPE UP $0.87 and a green line chart with y-axis labels $673.33, $1,673.33, $2,673.33, $3,673.33 and x-axis dates 5/15/2017 to 5/21/2017, plus a Results table with columns NAME, STATUS, DAILY BUDGET, SPEND, IMPRESSIONS, ECPM, SWIPE UPS, COST PER SWIPE UP and rows Campaign 1 ($1,000.00, $1,406.05, 390.8K, $3.60, 3K, $0.46), Campaign 2 ($5,000.00, $468.12, 0, $0.00, 0, $0.00), Campaign 3 ($5,000.00, $0.00, 0, $0.00, 0, $0.00), Campaign 4 ($10,000.00, $0.00, 0, $0.00, 0, $0.00), Campaign 5 ($17,015.10, 4.9M, $3.45, 18.1K, $0.94). Green toggles in status column. (4) Kleiner Perkins logo, bottom-left, green wordmark.
Slide 22
Product Listing Ads (Google) = / Driving Clicks to Product Pages / Google Product Listing Ads (PLAs) / Share of Retail Paid Clicks on Google, USA, 2014-2016 / 60% / 50% / 40% / 30% / 29% / 20% / 10% / 0% / PLA Share of Retail Paid Clicks on Google (%) / 3/14 / 6/14 / 9/14 / 12/14 / 3/15 / 6/15 / 9/15 / 12/15 / 3/16 / 6/16 / 9/16 / 12/16 / 3/17 / 52% / Google PLA on Mobile Web, / 12/16 / Source: Merkle Digital Marketing Report (Q1:14-Q1:17), Right image: Search Engine Land / KP INTERNET TRENDS 2017 | PAGE 21
Visuals: Line chart titled 'Google Product Listing Ads (PLAs)' with subtitle 'Share of Retail Paid Clicks on Google, USA, 2014-2016'. Y-axis titled 'PLA Share of Retail Paid Clicks on Google (%)', range 0% to 60% in 10% steps with light grey horizontal gridlines. X-axis categories 3/14, 6/14, 9/14, 12/14, 3/15, 6/15, 9/15, 12/15, 3/16, 6/16, 9/16, 12/16, 3/17, labels rotated about 45 degrees. One red series (about #FF0000), 2.5pt line, no markers. Labelled values: 3/14 29%, 3/17 52%. Unlabelled points, estimated: 6/14 about 26%, 9/14 about 27%, 12/14 about 30%, 3/15 about 35%, 6/15 about 32%, 9/15 about 34%, 12/15 about 38%, 3/16 about 43%, 6/16 about 46%, 9/16 about 48%, 12/16 about 48%. No legend. Highlighted points: the two end points, labelled 29% and 52% in bold black. Right: photograph of an Android phone screenshot, full colour, boxed with a thin border, showing a Google search for 'measuring cups' with status bar time 1:59, URL https://www.google.com/search?q=m..., Google logo, tabs ALL, SHOPPING, IMAGES, VIDEOS, NEWS, MA. A 'Shop on Google' block labelled Sponsored holds three product cards: '16 OZ GRADUATED ...' $3.98 Michigan Company (black-handled clear measuring cup); 'OXO 6-pc. Measuring Cup ...' $13.99 Kohl's, with blue badge '6.8 mi - pickup' (black measuring cups set); 'Norpro 4-Cup Plastic Measuring ...' $4.94 Amazon.com (clear plastic measuring cup). Below: 'Amazon.com: Cups - Measuring Tools & Scales: Home & Kitchen', 'Amazon.com › Measuring-Cups', 'Results 1 - 24 of 3799 - Discover our great selection of Measuring Cups on Amazon.com. Over 2300 Measuring Cups ✓ Great Selection & Price ✓ Free Shipping ...'. A red rounded-rectangle outline surrounds the three product cards. Lighting is flat screen light; the screenshot is not cropped and sits inside a black Android navigation bar at the bottom. Logo: Kleiner Perkins wordmark in green, bottom-left.
Slide 23
Targeted Pins (Pinterest) =
Driving Product Discovery + Purchase
Shop the Look
Browsing Turning into Buying, 4/17
Inspired Purchases, 2/17
Which of these services is a
great place to browse for
things you might want to buy?
Which of these services is a
great place to buy things online?
50%
45%
44%
40%
35%
33%
30%
25%
24%
% of Respondents
20%
15%
12%
10%
5%
0%
Browse
Buy
4/15
4/17
Shop the look
$190.00
Men's 6-Inch
Premium Waterpr...
Timberland US
KLEINER
PERKINS
Source: Pinterest
Note: Based on an internal survey of global internet users, n=12K. Other answers to the questions include Facebook, Instagram, Twitter, Snap,
YouTube, and Google with each respondent only allowed to choose one option.
KP INTERNET TRENDS 2017 | PAGE 22
Visuals: Chart: clustered vertical bar chart titled 'Pinterest / Browsing Turning into Buying, 4/17', split into two question panels by a dashed cyan vertical divider at about x 33.5 percent. Y axis: '% of Respondents', 0% to 50% in 5% steps, gridlines light grey. X categories: 'Browse' (left panel, question 'Which of these services is a great place to browse for things you might want to buy?') and 'Buy' (right panel, question 'Which of these services is a great place to buy things online?'). Series: 4/15 in green (#31AF78) and 4/17 in dark blue (#00689D). Labelled values: Browse 4/15 = 33%, Browse 4/17 = 44%, Buy 4/15 = 12%, Buy 4/17 = 24%. Legend centred below the chart: green square '4/15', blue square '4/17'. No points highlighted. Bar tops: Browse 4/15 at y 51.5 percent, Browse 4/17 at y 42.5 percent, Buy 4/15 at about y 68.7 percent, Buy 4/17 at about y 58.9 percent; baseline (0%) at y 78.5 percent. Bar widths are about 5 percent of slide width each, with the Browse pair near x 16.7 to 28.3 percent and the Buy pair near x 39.5 to 51.1 percent. Photo-style mock-up on the right: a product-discovery screenshot, 501 by 800 pixels, boxed with no crop and no rounding, at x 66.0 percent, y 26.7 percent, w 28.9 percent, h 61.6 percent. Its upper part is a photograph of a man in dark sunglasses, black leather biker jacket, black top and dark slim jeans with tan lace-up waterproof boots, walking left to right across grey concrete pavement in front of a pale grey wall of glass blocks; lighting is flat overcast daylight; colours are grey, black and tan with a saturated blue dot overlaid at the feet (about x 85.9 to 88.8 percent, y 55.2 to 59.0 percent, circular, solid blue). Full-body figure centred slightly right, cropped at the top edge of the photo area. Below the photo on a white card: a close (X) icon in grey, the text 'Shop the look', and a product tile with a tan Timberland-style boot on white (about x 67.1 to 76.3 percent, y 66.2 to 78.2 percent), price in blue, product name and brand in small grey text. Logo: Kleiner Perkins wordmark in green (#31AF78), two stacked bold sans-serif lines, bottom left.
Slide 24
Contextual Ads (Facebook) =
Driving Direct Purchases
Facebook Users
26% that Click Ads Make Purchase, USA, 3/17
In past 30 days, have you clicked an ad on Facebook?
In past 30 days, have you purchased a product you saw
on Facebook?
100%
90%
80%
70%
74%
60%
93%
90%
% of Respondents
50%
40%
30%
20%
26%
10%
10%
7%
0%
Clicked on an Ad
Didn’t Click on Ad
Not Sure
Made a Purchase
Did Not Make a Purchase
Facebook Messenger
Conversational Transactions,
9/16
Hi Meredith, we’ll let you know when The Classic White Button Up is back in stock.
Please let us know if you have any more questions.
The Classic White Button Up
Large, White, Cotton shirt
originalcoastclothing.com
$89.99
BUY NOW
Type a message...
Source: Survata (4/17), Messenger Image: Facebook Blog (9/16)
Note: Based on survey of USA internet users, n=1,500 (3/17).
KP INTERNET TRENDS 2017 | PAGE 23
Visuals: Chart: vertical 100% stacked column chart titled 'Facebook Users', subtitle '26% that Click Ads Make Purchase, USA, 3/17'. Y axis titled '% of Respondents', linear 0% to 100% in 10% steps with light grey horizontal gridlines at each step. X axis categories: 'Clicked on an Ad', 'Didn’t Click on Ad', 'Not Sure'. Two series stacked bottom to top: 'Made a Purchase' (dark blue #00689D) and 'Did Not Make a Purchase' (green #31AF78). Labelled values: Clicked on an Ad = Made a Purchase 26% (bottom, white label), Did Not Make a Purchase 74% (top, white label); Didn’t Click on Ad = 7% (bottom, white label), 93% (top, white label); Not Sure = 10% (bottom, white label), 90% (top, white label). Legend centred below the x axis: blue square 'Made a Purchase', green square 'Did Not Make a Purchase'. No highlighted points. Bars are about 8% of slide width each, evenly spaced. Photo: a smartphone screenshot of a Facebook Messenger conversation with the business 'Original Coast Cl...' (Original Coast Clothing), framed by a thin dark grey phone outline, shown boxed not full-bleed. Blue status bar with signal, wifi, battery icons and time 12:30; blue app header with back arrow, 'Original Coast Cl...' name, 'MANAGE' label and an info circle icon. Two grey speech bubbles from the business with rounded corners and small brand avatar (orange and black logo) at left. Below is a product card with a rounded-corner photo of a man in a white button-up shirt and navy tie, cropped at the neck and head, against a dark slate-grey background, lit softly from the front; the card has the product name, details, URL, price $89.99 and a blue outlined BUY NOW button with a circular outline. Bottom of the screenshot shows a message input bar with a blue hamburger icon and 'Type a message...' placeholder. Dominant colours of the screenshot: blue #1B6FE0 header, white and light grey chat area, slate #2F3B47 photo background. Logos: Kleiner Perkins logo in green (bottom-left, stacked wordmark 'KLEINER / PERKINS'); small Original Coast brand avatar appears twice in the chat (left of the bubbles and beside the price).
Slide 25
Goal Based Bidding Ads (Snap) =
Driving User Action
Snap / Gatorade Ad Campaign
Users Swipe Through Ad to Web Game, 8/16
Users Spend Average of 196 Seconds Playing Game
Serena Williams MATCH POINT PLAY NOW PLAY AD
13 of 22 PLAY AD
13 of 22 MAJOR #13 ENGLAND 2010 TAP TO PLAY AD
13 of 22 PERFECT!
Source: Snap Case Study: Gatorade (8/16)
KP INTERNET TRENDS 2017 | PAGE 24
Visuals: One photograph-style illustration composed of three pixel-art phone screenshots placed side by side in a row, each boxed with rounded corners and no border, on a white field. Left screen: pixel-art night scene, dark navy sky with stars and a dark navy city skyline in silhouette; a Gatorade logo at top centre; the stylised title 'Serena Williams MATCH POINT' in gold and cream letters with a light-blue cloud glow behind; a pixel-art woman in a yellow top and dark ponytail holding a white ball, mid-stance with a racket, standing on a dark elliptical shadow; the words PLAY NOW in white capitals; a small chevron and PLAY label at bottom centre and AD at bottom right. Middle screen: upper half is a dark navy night city with a dark ellipse and a small pixel figure and a PLAY label with an AD mark; lower half is a daylight pixel scene with a light blue sky, white clouds, a white Ferris wheel, a tan building cluster and a blue-grey skyline over green hedges; an orange badge reads 13 of 22; the green pixel title MAJOR #13 sits above ENGLAND 2010 in white; a yellow button with dark outline reads TAP TO PLAY. Right screen: top-down green tennis court with alternating light and mid green vertical stripes, a dark grey-green top bar with two small Gatorade logos and an orange badge 13 of 22; white court lines; a dark net across the middle; two orange cups at the net ends; a pixel player at the top and another at the bottom; the yellow word PERFECT! with black outline at centre; a brown border strip with round green bushes along the bottom. Lighting is flat, with no shading or gradients. Dominant colours are navy #1B1F3B, yellow #F2D23A, green #5DAE4A and light blue #7EC8E3. The three screens are full rectangles, not cropped, with a small white gutter between them. A separate small image is the Kleiner Perkins logo.
Slide 26
Geo-Targeted Local Ads (Google) = / Driving Foot Traffic to Stores / Google Location-Tagged Ads / 99% Accuracy Tracking Visits to 200MM Stores Globally, 9/16 / 5B Cumulative Tracked Store Visits, Up 5x Y/Y*, 5/17 / Photo: Thomas J. Story, Sunset.com / IMAGE 1 OF 25 / Zen retreat / This Palo Alto, CA front yard was designed be a point of interest for anyone passing by. Landscape designer Chris Jacobson kept mostly to a green palette to create tranquility and year-round good ... more / With no end to the dought in sight and water restrictions in place, many Bay Area homeowners are likely rethinking the state of their yards. / Fortunately, you don't need a lawn to landscape. / Garden Décor at The Home Depot / Store info / The Home Depot / Memorial Day Savings / Visit The Garden Center Today / Store info / Google / Map data ©2016 Google / Elizabeth Dr / N State Rd / Stanley St / Sylvia Dr / 21 / Source: Google Adwords Blog (5/16, 9/16, 5/17), Image: Google Adwords Blog (9/16) / * 5B (5/17) vs. 1B cumulative tracked (5/16). / KP INTERNET TRENDS 2017 | PAGE 25
Visuals: Two Android-style smartphone mockups shown side by side, both photographed straight-on with dark charcoal bezels and black rounded bodies, on a white ground. Left phone: a screen showing a Google Adwords/Sunset magazine style article page; top half is a photograph of a Palo Alto front yard with a sunlit green garden path, a black spherical planter, ornamental grasses and autumn trees, framed in a black letterbox; below is body text on white. A red rounded-rectangle outline (about 3px stroke, #E02020) encloses the bottom ad strip containing the Home Depot logo, 'Garden Décor at The Home Depot' and an orange 'Store info' button with a small red map pin. Right phone: a full-screen advertisement for The Home Depot showing a close-up photograph of grilled chicken breasts on a grill grate with a hand holding orange-handled tongs, warm orange and grey tones, slightly overexposed; three carousel dots overlay the image (two grey, one orange). Below the photo, white space holds the Home Depot logo (orange square with white wordmark) and text. A larger red rounded-rectangle outline (about 3px, #E02020) encloses the orange 'Store info' bar and a small map with a red pin, Google logo and street labels. The map has light grey and white streets. No other graphics.
Slide 27
Incentive-Based + Skippable Video Ads =
Driving Positive Interactions
Incentive-Based + Skippable Video Ads
More Likely to be Viewed Positively, 5/16
How would you characterize your attitude towards the following formats of online video advertising?
Mobile App Reward
68%
32%
Social Click-to-Play
52%
48%
Skippable Pre-Roll
51%
49%
Skippable Mobile Pop-up
46%
54%
In-Banner Click-to-Play
45%
55%
Social Auto-Play
26%
74%
In-Banner Auto-Play
21%
79%
Pre-Roll
20%
80%
Mobile App Pop-Up
19%
81%
Positive
Negative
% of Respondents
Source: MillwardBrown AdReaction Video Creative in a Digital World (5/16)
Note: Survey of people from Argentina, Australia, Brazil, France, Germany, Mexico, UK, and USA who watched 20 ads (at least 100 per ad) and
answered positive or negative, n=10.739. The survey included TV, YouTube skippable pre-roll, Facebook auto-play, Facebook click-to-play, and
mobile video ad formats.
KP INTERNET TRENDS 2017 | PAGE 26
Visuals: Horizontal 100% stacked bar chart. Title: Incentive-Based + Skippable Video Ads, subtitle More Likely to be Viewed Positively, 5/16. Question above the chart: How would you characterize your attitude towards the following formats of online video advertising? Value axis: % of Respondents, a 0 to 100% scale spanning about 40.4% to 83.0% of slide width (no tick labels printed). Category axis is labelled by the nine formats listed top to bottom. Two series: Positive in green (#00B050) on the left of each bar, Negative in blue (#00689D) on the right. Each bar's total is 100%. Printed values, top to bottom: Mobile App Reward Positive 68%, Negative 32%; Social Click-to-Play Positive 52%, Negative 48%; Skippable Pre-Roll Positive 51%, Negative 49%; Skippable Mobile Pop-up Positive 46%, Negative 54%; In-Banner Click-to-Play Positive 45%, Negative 55%; Social Auto-Play Positive 26%, Negative 74%; In-Banner Auto-Play Positive 21%, Negative 79%; Pre-Roll Positive 20%, Negative 80%; Mobile App Pop-Up Positive 19%, Negative 81%. Value labels are white bold, centred in each bar segment. Highlighted points: the top three rows (Mobile App Reward, Social Click-to-Play, Skippable Pre-Roll) are enclosed in a rounded cyan outline rectangle spanning about x 19.0 to 84.7 and y 31.9 to 49.9. Legend below the chart: green square Positive, blue square Negative, and the axis caption % of Respondents to the right. Thin light grey horizontal separator lines sit between bars, and a thin grey vertical axis line runs at about 40.4% of width. Logo: Kleiner Perkins wordmark in bold green capitals, two stacked lines.
Slide 28
In-App Ads + Dynamic Creative (Vungle) =
Driving Higher In-App Install Performance
Dynamic Tab Ad
Video + Images
Vungle Dynamic Creative Ads
Improving Conversion Rates, 5/17
600
500
400
300
200
100
0
0.60%
0.50%
0.40%
0.30%
0.20%
0.10%
0.00%
Dynamic Creative Variations (K)
Conversion Rate (%)
1/16 2/16 3/16 4/16 5/16 6/16 7/16 8/16 9/16 10/16 11/16 12/16 1/17 2/17 3/17 4/17
Dynamic Creative Variations
Conversion Rate
KLEINER PERKINS
Source: Vungle (5/17)
Note: “Dynamic creative” is any creative ad that changes automatically based on information about the user (behavior, location, or context). A
dynamic tab ad includes multiple interactive promotional modules alongside a video ad.
KP INTERNET TRENDS 2017 | PAGE 27
Visuals: Chart (right column): combination chart with vertical blue columns and a red line. Chart title 'Vungle Dynamic Creative Ads', subtitle 'Improving Conversion Rates, 5/17'. Left y-axis titled 'Dynamic Creative Variations (K)', range 0 to 600 in steps of 100, unit thousands. Right y-axis titled 'Conversion Rate (%)', range 0.00% to 0.60% in steps of 0.10%. X-axis categories rotated vertical: 1/16, 2/16, 3/16, 4/16, 5/16, 6/16, 7/16, 8/16, 9/16, 10/16, 11/16, 12/16, 1/17, 2/17, 3/17, 4/17 (months, no unit printed). Series 1, Dynamic Creative Variations (blue columns, #00689D): values are not printed, so estimates: 1/16 about 5K, 2/16 about 12K, 3/16 about 25K, 4/16 about 31K, 5/16 about 39K, 6/16 about 48K, 7/16 about 53K, 8/16 about 86K, 9/16 about 101K, 10/16 about 168K, 11/16 about 219K, 12/16 about 306K, 1/17 about 347K, 2/17 about 395K, 3/17 about 452K, 4/17 about 486K. Series 2, Conversion Rate (red line, about #E30613, about 3pt): values not printed, so estimates: 1/16 about 0.28%, 2/16 about 0.27%, 3/16 about 0.28%, 4/16 about 0.30%, 5/16 about 0.32%, 6/16 about 0.36%, 7/16 about 0.37%, 8/16 about 0.36%, 9/16 about 0.35%, 10/16 about 0.41%, 11/16 about 0.46%, 12/16 about 0.45%, 1/17 about 0.45%, 2/17 about 0.43%, 3/17 about 0.46%, 4/17 about 0.47%. Legend centred below the plot: blue rectangle swatch then 'Dynamic Creative Variations', red line swatch then 'Conversion Rate', both bold black. Gridlines: light grey horizontal lines at each left-axis tick, no border. Highlighted points: none. Photo (left column): a boxed phone-app marketing montage on a dark navy and black background. Top panel shows a black-and-white photo of a crowded concert with stage lights and silhouetted hands, with overlay text 'On-demand music videos' and a white X close button at top right; a phone mockup in the centre shows a video screen with a concert image and a Lucha Fighters card. Below it are three tab labels 'Screens', 'Reviews', 'About' in white on dark grey. Middle row shows three small app screenshots (Artist page with Lucha Fighters, Events list, and a Kaboom Lounge music player with a tree-artwork album image) plus a partial fourth screen with a Home menu. Bottom panel shows an app icon (black turntable record on a blue-violet gradient), title 'Sound Machine', developer 'Soundjamz, LLC', a four-and-a-half star rating in orange, and a green button labelled 'Download'. A small white 'Vungle' wordmark appears at the bottom centre of the screenshot. The image is a full rectangle, not cropped, with a thin dark border. Logo: Kleiner Perkins wordmark in green (#3CB043) stacked as 'KLEINER' over 'PERKINS', bold sans-serif, bottom-left.
Slide 29
In-Ride / In-Hand Recommendations (Uber + Foursquare) = / Location + Route + Destination + Time of Day (+ an Offer) / Uber / Foursquare Partnership / In-App Recommendations for Nearby Businesses, 4/17 / Foursquare / Foursquare / Hog Island Oyster Co. / 1155 ratings · $$ / Seafood · 1.1mi / "Right near the water! Get the oysters, mussels and fried anchovies. They are all super fresh and tasty" / Blue Bottle Coffee / 428 ratings · $$$ / Coffee Shop · 1.4mi / "Latte and Snickerdoodle - delicious quick snack. Clean facility, good coffee, good service and friendly staff." / KLEINER PERKINS / Source: Uber (4/17) / KP INTERNET TRENDS 2017 | PAGE 28
Visuals: Two photographs displayed as rectangular boxed cards, not cropped to a circle, not full-bleed. Left photo: overhead close-up of a tray of raw oysters in their shells, about 40 oysters visible, with two halved lemon wedges resting on an oyster and a small bowl of green herb sauce with a spoon at upper centre; cool blue-grey and white tones with dark slate surface; lit evenly from above with soft daylight. Right photo: close-up of a brown paper coffee cup with a white rim, showing a latte with a leaf-pattern foam design in cream and tan at top; a blue Blue Bottle bottle logo is printed on the cup near the bottom centre; light grey marble surface behind; warm tan and brown dominant colours; soft natural light. Both photos show a small pink Foursquare badge (white flag glyph on pink circle) with the white word Foursquare overlaid at upper left; no tint or gradient overlay on the photos. A single green Kleiner Perkins wordmark logo sits bottom left. The footer has a thin light grey rule under the left photo column at the bottom.
Slide 30
Hyperlocal Targeting (Nextdoor…xAd) = / From Home (Neighborhood) to Work (Commute) / Nextdoor / Neighbors Drive Word of Mouth / +8% Engagement Lift / for Ring / ND 10:26 AM 100% / Search / Invite / Thank / Reply / Ring · Sponsored / How to prevent package theft this holiday season / What comes after Black Friday and Cyber Monday? Package Theft Wednesday, the biggest day of the year for package thieves. But this holiday season, Ring is helping you fight back. See more / Ring neighborhood security / Learn more / 12 neighbors recommend Ring / Thank / Reply / Leslie Richards, Rockridge South / Help get Reno out of the shelter / xAd / Tracking Where / When Purchases / Likely to be Made / 42 visits / 1:10 min / Fitness Center / NikeStore / LinkNYC / Dry Cleaning / LinkNYC / BANANA REPUBLIC / LinkNYC / Grocery Store / Work / 36 visits / 5 min / Starbucks Coffee / 6 / 24 visits / 41 min / Home / Source: Nextdoor, xAd / KLEINER PERKINS / KP INTERNET TRENDS 2017 | PAGE 29
Visuals: Left: a photographic screenshot of the Nextdoor iOS app on a phone, shown in a thin black-outlined frame, full portrait, unrotated. The top shows a green status bar (ND, 10:26 AM, 100%) and a green search bar with Invite. A Ring sponsored post is shown: a blue bell icon, bold headline, grey body copy, a thumbnail of a doorbell camera feed showing a man in a dark suit at a front door with a package, a Ring doorbell device at right, a 'Learn more' blue button, a red heart icon with '12 neighbors recommend Ring', and Thank/Reply controls with counts 21 and 2. A bright red rounded-rectangle outline (about 3 px) highlights this post, overlapping the screenshot. Below is a partially visible post from Leslie Richards. Right: a satellite-style aerial map of lower Manhattan and the water to the south and east, in muted blue-grey and dark tones with dense grey-brown streets. An orange route line (about 3 px) snakes from the Work tag at left through the Fitness Center, Dry Cleaning, Grocery Store and along the river to the Home tag at right. Labelled white circular logos: NikeStore (top left, centre about 45.4%, 45.7%), Banana Republic (centre, about 63%, 51.5%), Starbucks Coffee (lower centre, about 48.9%, 63.2%). White rectangular LinkNYC labels appear at three points. Orange pin-and-tag markers: Fitness Center, Dry Cleaning, Grocery Store, Work, Home. Dotted lime-green circles with blue text: '42 visits 1:10 min' (top left), '36 visits 5 min' (lower centre), '24 visits 41 min' (bottom centre). A white train icon with a green circle badge showing 6 sits at lower left. Thin lime-green and white leader lines connect circles and tags. Lighting is flat overhead aerial, and the map is full-width in its frame, not cropped. Bottom left: the Kleiner Perkins wordmark in bold green capitals stacked on two lines.
Slide 31
Advertising Inefficiency =
Increasingly Exposed by Data…
Right ‘Ad’ @ Right Place / Time
KLEINER PERKINS
KP INTERNET TRENDS 2017 | PAGE 30
Visuals: One logo: the green Kleiner Perkins wordmark, two stacked uppercase lines (KLEINER / PERKINS), bottom-left, boxed at 164 by 96 pixels with no overlay. No photograph, chart, table or diagram. The top band is a flat decorative bar in dark blue #00517A with a thin teal (#00B5C4) rule along its lower edge.
Slides 32 to 356 continue in the full text file.
Download this deck
The hosted PDF of every library deck is free for readers of the SlideDeck Co newsletter. Join with your email and the viewer and download appear here.
Building a deck of your own? The SlideDeck Co Standard Deck is a slide library for business presentations: reviews, updates and plans.







