

This is Mary Meeker's Internet Trends 2016 deck, presented at the Code Conference on June 1, 2016, and published by KPCB. It opens with a title slide, a conference title slide, and an eight-part outline covering global internet users, macro trends, advertising and commerce, video, image and messaging, voice and transportation, China, public and private company data, and data privacy. It then moves through these sections in order, using large statistic-led headline slides followed by sourced bar and line charts, with the growth figure in each title and a footer carrying the source. Acknowledgements to partners, Hillhouse Capital and others appear early, before the data begins. The sections on advertising, commerce and messaging rely heavily on contrasting slides that pair a generation or platform with its behaviour. Slides worth studying include the India user growth slide, which uses a single large italic statement with a line of supporting numbers, and the smartphone share slide, which places a stacked chart beside a dual-axis chart. The deck is long, and the text provided runs only to slide 107.
Slides worth studying
Questions about this deck
How many slides does the Mary Meeker, Kleiner Perkins Internet Trends 2016 deck have?
The deck has 214 pages, but the text provided only runs to slide 107. The summary notes the deck is long, so the full 214 pages were not all reviewed here.
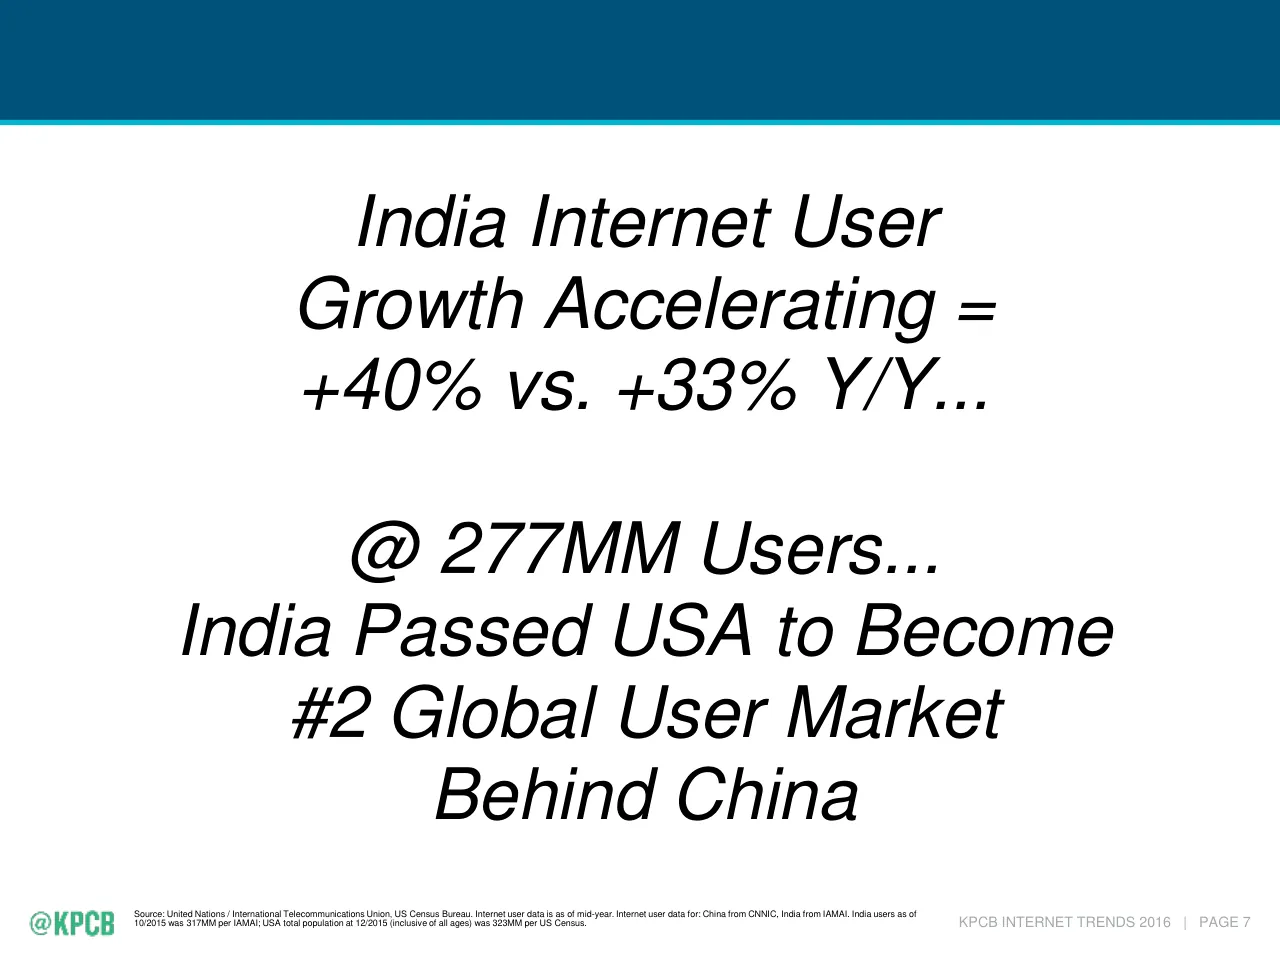
What does the Kleiner Perkins Internet Trends 2016 deck say about India's internet users?
Slide 8 states that India's growth is accelerating at +40% vs. +33% Y/Y, with 277MM users, and that India passed the USA to become the #2 global user market behind China. Slide 9 repeats 277MM users at 22% penetration.
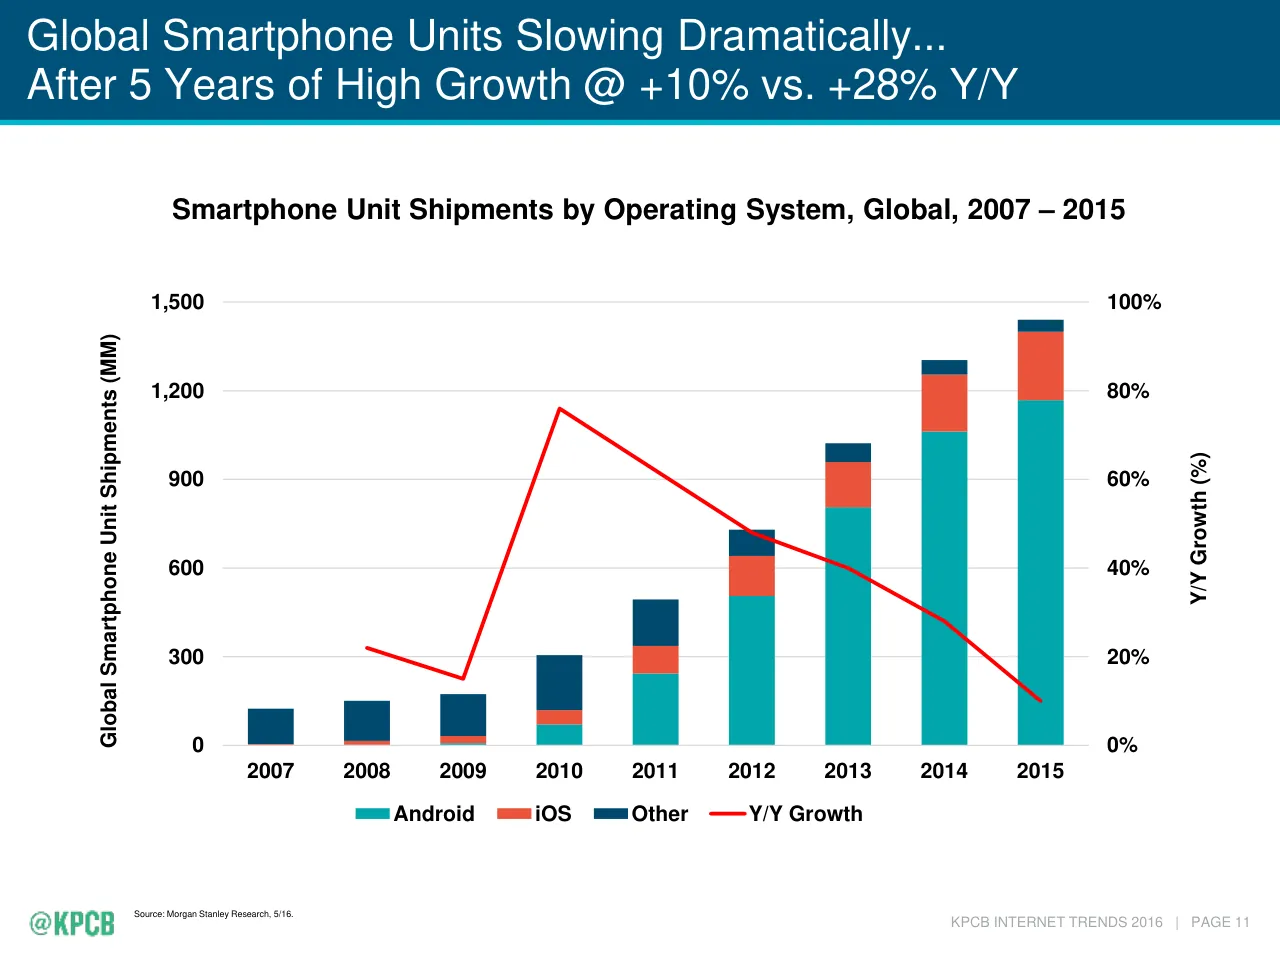
What does Mary Meeker of Kleiner Perkins say about global smartphone unit shipments?
Slide 10 is titled Global Smartphone Unit Shipments Slowing Dramatically at +10% vs. +28% Y/Y. Slide 13 gives the 2015 share as iOS = 16% and Android = 81%.
How is the Kleiner Perkins Internet Trends 2016 deck structured?
Slide 3 lists an eight-part outline: global internet trends, global macro trends, advertising, commerce and brand trends, re-imagining communication (video, image, messaging), re-imagining human-computer interfaces (voice, transportation), China, public and private company data, and data as a platform with data privacy.
Details
- Company: Mary Meeker, Kleiner Perkins
- Year: 2016
- Type: Conference talk
- Industry: Venture Capital / Technology
- Pages: 214
More from Mary Meeker
- Mary Meeker, Bond conference talk, 2019
- Mary Meeker, Kleiner Perkins conference talk, 2018
- Mary Meeker, Kleiner Perkins conference talk, 2017
- Mary Meeker, Kleiner Perkins conference talk, 2015
All Mary Meeker decks in the library
Review score: 7 out of 10, Effective
Presentation quality, judged with the SlideDeck Co review heuristic. Ask, evidence and idea merit are not rated here.
The deck has a clear spine: an eight-part outline on slide 3, divider slides, and a repeating pattern of an italic statement slide followed by a sourced chart with the finding in the title (slides 6-7, 8-9, 10-12). Charts are mostly legible with consistent colour, direct annotations and a source on every page. The weaknesses are consequential. Many statement slides are text-only and repeat what the next chart title says, and dense pages such as the generational tables (52-53), the McKinsey radar (15) and the Stitch Fix pages (69-70) use tiny type that is unreadable beyond a reader's desk. The long chain of macro slides (19-41) also delays the internet argument, and the 72 pages I could see are only about a third of 214.
Worth keeping: Keep the findings-as-titles, the consistent chart styling with direct callouts such as the 2008 and 2015 Asia-Pacific labels on slide 11, and the sourced footers.
Most useful repair: Fix the unreadable small type on slides 15, 52-53, 69 and 70 by cutting content or splitting the page, and make the dual-axis charts such as slide 12 easier to read by labelling the growth line directly.
What would change the score: Merge or cut the text-only statement slides that echo the following chart title, and compress the macro section so the internet-specific argument starts sooner.
Confidence medium. 72 of 214 pages inspected on contact sheets, 4 at readable size. Reviewed 2026-11-08. Model-assisted review (claude-sonnet-5-5).
Full text of the slides (214 slides)
Every slide's words and a description of its charts and images, so the deck can be searched and rebuilt. Also available as Markdown.
Slide 1
O
Internet Trends
2016
Mary Meeker
June 1 @ Code 2016
Visuals: One logo: a small serif letterform 'O' (a stylised monogram mark) in pale blue-grey #A8C0D4, centred horizontally at the top of the slide. No photographs, charts or other graphics.
Slide 2
INTERNET TRENDS 2016 –
CODE CONFERENCE
Mary Meeker
June 1, 2016
kpcb.com/InternetTrends
KPCB
KLEINER / PERKINS / CAUFIELD / BYERS
Visuals: One logo: the KPCB logotype, a bold green sans-serif wordmark 'KPCB' in #33B780 at the left, followed by a thin vertical grey divider line and the stacked grey spaced-capital text 'KLEINER / PERKINS / CAUFIELD / BYERS' in a light serif, grey #8C8C8C-ish. The logo is placed as a raster image (312 by 77 px), boxed at its natural size with no crop, no shadow, and no overlay. No photographs, charts or other graphics.
Slide 3
Outline
1) Global Internet Trends
2) Global Macro Trends
3) Advertising / Commerce + Brand Trends
4) Re-Imagining Communication – Video / Image / Messaging
5) Re-Imagining Human-Computer Interfaces – Voice / Transportation
6) China = Internet Leader on Many Metrics / (Provided by Hillhouse Capital)
7) Public / Private Company Data
8) Data as a Platform / Data Privacy
@KPCB
KPCB.COM
KPCB INTERNET TRENDS 2016 | PAGE 2
Visuals: A white horizontal rule across the slide under the title, spanning about 3.3% to 96.7% of the width, about 0.3% of the height thick. No charts, tables, photographs, illustrations or diagrams. Two logos: the '@KPCB' wordmark in white at bottom-left, drawn from two slightly offset raster copies, and the 'KPCB.COM' wordmark in white at bottom-right.
Slide 4
Thanks...
KPCB Partners
Especially Alex Tran / Dino Becirovic / Alexander Krey / Cindy Cheng
who helped develop the ideas / presentation we hope you find useful...
Hillhouse Capital
Especially Liang Wu...his / their contribution of the China section of
Internet Trends provides an especially thoughtful overview of the
largest market of Internet users in the world...
Participants in Evolution of Internet Connectivity
From creators to consumers who keep us on our toes 24x7...and the
people who directly help us prepare this presentation...
Kara & Walt
For continuing to do what you do so well...
@KPCB
KPCB INTERNET TRENDS 2016 | PAGE 3
Visuals: None apart from the small KPCB logo in the bottom-left corner, which is a green pixel-style wordmark reading '@KPCB' (about 72 by 25 pixels, dominant colour green #3CB371-like teal-green). No photographs, charts, or diagrams.
Slide 5
GLOBAL INTERNET TRENDS
Visuals: Two white logo wordmarks only: bottom-left '@KPCB' lettering (white, condensed bold sans with an at-sign) and bottom-right 'KPCB.COM' wordmark (white, condensed bold sans). Thin white horizontal rule across the slide. No photographs, charts or diagrams.
Slide 6
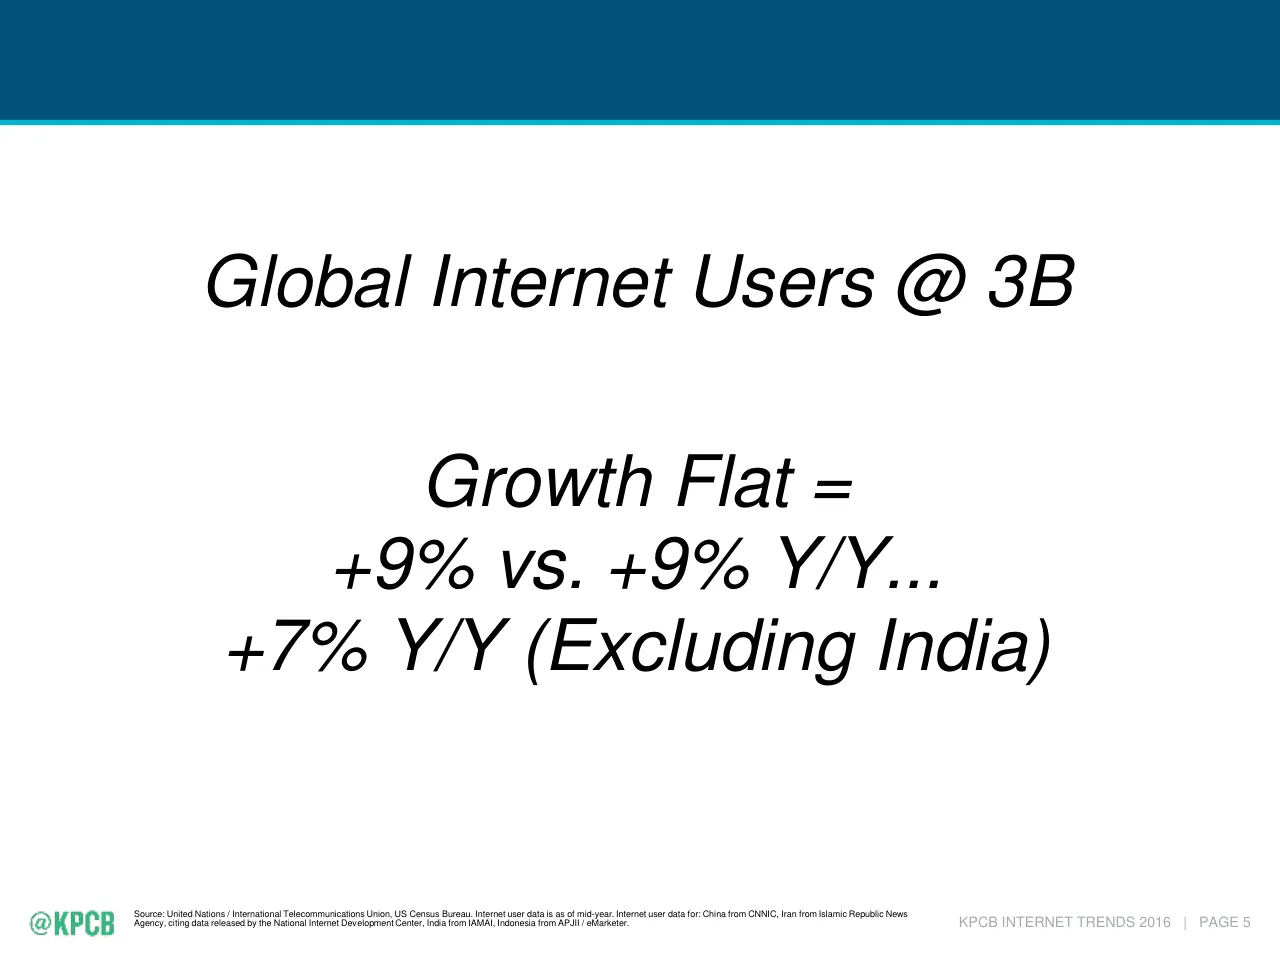
Global Internet Users @ 3B
Growth Flat =
+9% vs. +9% Y/Y...
+7% Y/Y (Excluding India)
KPCB INTERNET TRENDS 2016 | PAGE 5
Source: United Nations / International Telecommunications Union, US Census Bureau. Internet user data is as of mid-year. Internet user data for: China from CNNIC, Iran from Islamic Republic News
Agency, citing data released by the National Internet Development Center, India from IAMAI, Indonesia from APJII / eMarketer.
Slide 7
Global Internet Users = 3B @ 42% Penetration...
+9% vs. +9% Y/Y...+7% (Excluding India)
Global Internet Users, 2008 – 2015
3,500
3,000
2,500
2,000
1,500
1,000
500
0
35%
30%
25%
20%
15%
10%
5%
0%
Global Internet Users (MM)
Y/Y % Growth
2008 2009 2010 2011 2012 2013 2014 2015
Global Internet Users
Y/Y Growth (%)
Source: United Nations / International Telecommunications Union, US Census Bureau. Internet user data is as of mid-year. Internet user data for: China from CNNIC, Iran from Islamic Republic News
Agency, citing data released by the National Internet Development Center, India from IAMAI, Indonesia from APJII / eMarketer.
KPCB INTERNET TRENDS 2016 | PAGE 6
@KPCB
Visuals: Combo chart titled 'Global Internet Users, 2008 – 2015'. Left y-axis titled 'Global Internet Users (MM)' runs 0 to 3,500 in steps of 500, with light grey horizontal gridlines. Right y-axis titled 'Y/Y % Growth' runs 0% to 35% in steps of 5%. X-axis categories are 2008 to 2015. Series 1, Global Internet Users, is a dark blue (#00689D) column series with no printed data labels; about values: 2008 about 1,420; 2009 about 1,650; 2010 about 1,860; 2011 about 2,110; 2012 about 2,320; 2013 about 2,560; 2014 about 2,800; 2015 about 3,050 (all MM). Series 2, Y/Y Growth (%), is a red (#FF0000) line of about 3 pt width on the right axis with no markers and no printed values: 2008 no point; 2009 about 15.5%; 2010 about 13%; 2011 about 13.5%; 2012 about 10%; 2013 about 10%; 2014 about 9.3%; 2015 about 9.4%. Legend below the plot: blue square key with 'Global Internet Users' and red line key with 'Y/Y Growth (%)'. No highlighted points. Small KPCB logo bottom left in green (#3CB371 approx.) pixel lettering '@KPCB'.
Slide 8
India Internet User / Growth Accelerating = / +40% vs. +33% Y/Y... / @ 277MM Users... / India Passed USA to Become / #2 Global User Market / Behind China / KPCB INTERNET TRENDS 2016 | PAGE 7 / Source: United Nations / International Telecommunications Union, US Census Bureau. Internet user data is as of mid-year. Internet user data for: China from CNNIC, India from IAMAI. India users as of / 10/2015 was 317MM per IAMAI; USA total population at 12/2015 (inclusive of all ages) was 323MM per US Census.
Visuals: none apart from the small KPCB logo in the footer: a green (#3CB88A approx.) pixelated wordmark reading '@KPCB' at bottom left, 72 by 25 pixels, placed at x 1.8, y 94.4, w 7.5, h 3.4.
Slide 9
India Internet Users = 277MM @ 22% Penetration... / +40% vs. +33% Y/Y / India Internet Users, 2008 – 2015 / Y/Y % Growth / India Internet Users (MM) / 0% / 10% / 20% / 30% / 40% / 50% / 60% / 0 / 50 / 100 / 150 / 200 / 250 / 300 / 2008 / 2009 / 2010 / 2011 / 2012 / 2013 / 2014 / 2015 / India Internet Users / Y/Y Growth (%) / Source: IAMAI. Uses mid-year figures. / KPCB INTERNET TRENDS 2016 | PAGE 8
Visuals: Combo chart. Title: India Internet Users, 2008 – 2015 (bold black). Left y-axis: India Internet Users (MM), range 0 to 300, gridlines at 50 MM intervals, light grey horizontal gridlines. Right y-axis: Y/Y % Growth, range 0% to 60%, ticks every 10%. X-axis: years 2008 to 2015, categories with no axis title. Series 1, column bars in #00689D (blue), values not printed so estimated: 2008 about 45 MM, 2009 about 54 MM, 2010 about 66 MM, 2011 about 84 MM, 2012 about 111 MM, 2013 about 149 MM, 2014 about 198 MM, 2015 about 277 MM (the title states 277MM). Series 2, red line (#FF0000, about 3 pt) on the right axis, Y/Y Growth (%): 2008 no point, 2009 about 20%, 2010 about 22%, 2011 about 27%, 2012 about 32%, 2013 about 34%, 2014 about 33%, 2015 about 40% (the title states +40% vs. +33% Y/Y). No data labels, no highlighted points. Legend below the chart: blue rectangle swatch labelled India Internet Users, red line swatch labelled Y/Y Growth (%). Source note at bottom left: Source: IAMAI. Uses mid-year figures.
Slide 10
Global Smartphone
Users Slowing =
+21% vs. +31% Y/Y
Global Smartphone
Unit Shipments Slowing
Dramatically =
+10% vs. +28% Y/Y
KPCB INTERNET TRENDS 2016 | PAGE 9
Source: Nakono Research (2/16), Morgan Stanley Research (5/16).
“Smartphone Users” represented by installed base.
Slide 11
Global Smartphone User Growth Slowing...
Largest Market (Asia-Pacific) = +23% vs. +35% Y/Y
Smartphone Users, Global, 2005 – 2015
2015: Asia-Pacific = 52%
Global Smartphone Users (MM)
3,000
2,500
2,000
1,500
1,000
500
0
2005 2006 2007 2008 2009 2010 2011 2012 2013 2014 2015
North America
Western Europe
Eastern Europe
Asia-Pacific
Latin America
MEA
2008: Asia-Pacific = 34%
Source: Nakono Research (2/16).
* “Smartphone Users” represented by installed base.
KPCB INTERNET TRENDS 2016 | PAGE 10
Visuals: Chart: stacked area chart titled 'Smartphone Users, Global, 2005 – 2015' (bold). Y-axis titled 'Global Smartphone Users (MM)', range 0 to 3,000 MM, gridlines every 500 MM at light grey (#D9D9D9), labelled 0, 500, 1,000, 1,500, 2,000, 2,500, 3,000. X-axis categories 2005 to 2015, one per year. Series stacked bottom to top: North America (#FCCF41, yellow), Western Europe (#EA543B, red-orange), Eastern Europe (#A6E6CA, pale mint), Asia-Pacific (#00A6AD, teal), Latin America (#003B49, dark navy), MEA (#33B780, green). No values are printed on the areas. About values read from the chart at 2015: North America about 280 MM, Western Europe about 275 MM (top about 556), Eastern Europe about 145 MM (top about 700), Asia-Pacific about 1,340 MM (top about 2,040), Latin America about 280 MM (top about 2,320), MEA about 230 MM (top about 2,550). About 2008 total near 215 MM, with Asia-Pacific about 34% share as printed. Legend: horizontal row below the x-axis, bold dark grey (#353B37) labels, each preceded by a small coloured square matching its series. Highlighted points: two callout boxes. Callout 1 at 2008: white rectangle with thin teal (#00A6AD) outline, bold teal text '2008: Asia-Pacific = 34%', with a thin black arrow leading down-right from the box bottom to the Asia-Pacific area near the 2008 point at about 180 MM. Callout 2 at 2015: white rectangle with thin teal outline, bold teal text '2015: Asia-Pacific = 52%', with a thin black vertical arrow from the box bottom down to the Asia-Pacific area at about 1,670 MM on the 2015 column. Logo: small green '@KPCB' wordmark at bottom left, pixel-style bold letters (image 72 by 25 pixels).
Slide 12
Global Smartphone Units Slowing Dramatically...
After 5 Years of High Growth @ +10% vs. +28% Y/Y
Smartphone Unit Shipments by Operating System, Global, 2007 – 2015
Y/Y Growth (%)
Global Smartphone Unit Shipments (MM)
1,500
100%
1,200
80%
900
60%
600
40%
300
20%
0
0%
2007 2008 2009 2010 2011 2012 2013 2014 2015
Android
iOS
Other
Y/Y Growth
@KPCB
Source: Morgan Stanley Research, 5/16.
KPCB INTERNET TRENDS 2016 | PAGE 11
Visuals: Chart: combined stacked column and line chart, Smartphone Unit Shipments by Operating System, Global, 2007 – 2015. Columns are stacked by operating system, bottom to top: Android (teal #00A6AD), iOS (red-orange #EA543B), Other (navy #004A6F). Left axis titled Global Smartphone Unit Shipments (MM), linear, range 0 to 1,500, gridlines at 300 intervals, labels 0, 300, 600, 900, 1,200, 1,500. Right axis titled Y/Y Growth (%), range 0% to 100%, labels 0%, 20%, 40%, 60%, 80%, 100%. X axis years 2007 to 2015, labels in bold black. Column totals, values estimated as about: 2007 about 125 (Other only); 2008 about 150 (Other about 135, iOS about 15); 2009 about 170 (Android about 5, iOS about 25, Other about 140); 2010 about 305 (Android about 75, iOS about 45, Other about 185); 2011 about 495 (Android about 250, iOS about 85, Other about 160); 2012 about 735 (Android about 505, iOS about 130, Other about 100); 2013 about 1,025 (Android about 810, iOS about 155, Other about 60); 2014 about 1,305 (Android about 1,065, iOS about 190, Other about 50); 2015 about 1,445 (Android about 1,170, iOS about 230, Other about 45). Y/Y Growth series is a red (#FF0000) line of about 3 pt width on the right axis with markers absent; estimated values: 2008 about 22%, 2009 about 15%, 2010 about 76%, 2011 about 63%, 2012 about 48%, 2013 about 40%, 2014 about 28%, 2015 about 10%; the line has no point plotted for 2007. Legend centred under the chart in one row, bold black: Android teal swatch, iOS red swatch, Other navy swatch, Y/Y Growth red line swatch. No highlighted points. Logo: green @KPCB wordmark, bottom-left, a small bitmap about 72 by 25 pixels.
Slide 13
Android Smartphone Share Gains Continue vs. iOS...
Android ASP Declines Continue...Delta to iOS @ ~3x
Smartphone Unit Shipments, iOS vs. Android, Global, 2007 – 2016E
+7% Y/Y
2015 Share:
iOS = 16%
Android = 81%
2009 Share:
iOS = 14%
Android = 4%
-11% Y/Y
iOS
Android
Unit Shipments (MM)
0
400
800
1,200
2007 2008 2009 2010 2011 2012 2013 2014 2015 2016E
iOS ASP ($) $594 $621 $623 $703 $712 $686 $669 $680 $717 $651
Y/Y Growth – 4% 0% 13% 1% -4% -2% 2% 5% -9%
Android ASP – $403 $435 $441 $380 $318 $272 $237 $216 $208
Y/Y Growth – – 8% 1% -14% -16% -15% -13% -8% -4%
@KPCB
Source: Morgan Stanley Research, 5/16.
KPCB INTERNET TRENDS 2016 | PAGE 12
Visuals: Chart: clustered vertical bar chart, Smartphone Unit Shipments, iOS vs. Android, Global, 2007 – 2016E. Y-axis titled Unit Shipments (MM), linear, gridlines at 0, 400, 800 and 1,200 (light grey #D9D9D9 horizontal lines, axis top about 1,400 MM); x-axis categories 2007, 2008, 2009, 2010, 2011, 2012, 2013, 2014, 2015, 2016E with no axis title. Two series per year: iOS bars in red #EA543B on the left and Android bars in cyan #02B5CC on the right. No values are printed on bars; estimates are marked about: iOS about 3, 12, 25, 50, 95, 135, 150, 195, 230, 205 MM; Android about 1, 2, 4, 75, 240, 510, 805, 1,065, 1,170, 1,280 MM for 2007 to 2016E respectively. Legend at upper left of plot: red square iOS above cyan square Android, black bold labels. Callout box at upper right of plot reads 2015 Share: iOS = 16% Android = 81%, with a thin grey border on white. Callout box at lower left of plot reads 2009 Share: iOS = 14% Android = 4%, with a thin grey border on white. Highlighted points: a black arrow from the 2015 Android bar top rising up-right to the label +7% Y/Y in bold italic teal #00A6AD; a black arrow from the 2015 area at about 230 MM pointing right to the 2016E iOS bar, with label -11% Y/Y in bold italic red #DC3C2E. Table 1 (iOS ASP): boxed in a red #EA543B thin border with pale pink fill; columns 2007 to 2016E; row iOS ASP ($): $594, $621, $623, $703, $712, $686, $669, $680, $717, $651; row Y/Y Growth: –, 4%, 0%, 13%, 1%, -4%, -2%, 2%, 5%, -9%. Table 2 (Android ASP): boxed in a cyan #02B5CC thin border with pale blue-grey fill; row Android ASP: –, $403, $435, $441, $380, $318, $272, $237, $216, $208 under the years 2008 to 2016E columns (first column dash for 2007); row Y/Y Growth: –, –, 8%, 1%, -14%, -16%, -15%, -13%, -8%, -4%. Logo: @KPCB wordmark, 72 by 25 px image, in green #3DBE8B-style mint green, bold blocky pixel-style letters, at bottom left.
Slide 14
New Internet Users =
Continue to be Harder to
Garner Owing to High Penetration
in Developed Markets
@KPCB
KPCB INTERNET TRENDS 2016 | PAGE 13
Visuals: Visual elements: a flat dark teal header band (full width, top 12.5% of slide, colour #00517A) with a thin bright teal rule along its bottom edge (colour about #1AB3C0). Bottom left, the @KPCB logo: a green pixelated wordmark reading @KPCB, placed as a 72 by 25 pixel image, about 7.5% wide by 3.4% high, flat with no shadow or border. No photographs, charts, tables or icons.
Slide 15
With Already High Mobile Penetration in More Developed / Affluent Countries...
New Users in Less Developed / Affluent Countries Harder to Garner, per McKinsey
Countries fall into one of 5 groups based on
barriers they face to Internet adoption
Performance on Internet
Barriers Index
Average score
Minimum - 0
Maximum -100
Group 1
Group 2
Group 3
Group 4
Group 5
0
20
40
60
80
100
Incentives
Low incomes
and affordability
User capability
Infrastructure
Group 1: High barriers across the board; offline populations that are young,
rural, and have low literacy
Countries: Bangladesh, Ethiopia, Nigeria, Pakistan, Tanzania
Offline population, 2014: 548 million
Internet penetration, 2014: 18%
Group 2: Medium to high barriers with larger challenges in incentives and
infrastructure; mixed demographics
Countries: Egypt, India, Indonesia, Philippines, Thailand
Offline population, 2014: 1,438 million
Internet penetration, 2014: 20%
Group 3: Medium barriers with greatest challenge in incentives; rural and
literate offline populations
Countries: China, Sri Lanka, Vietnam
Offline population, 2014: 753 million
Internet penetration, 2014: 49%
Group 4: Medium barriers with greatest challenge in low incomes and
affordability; offline populations predominantly urban / literate / low income
Countries: Brazil, Colombia, Mexico, South Africa, Turkey
Offline population, 2014: 244 million
Internet penetration, 2014: 52%
Group 5: Low barriers across the board; offline populations that are highly
literate and disproportionately low income and female
Countries: Germany, Italy, Japan, Korea, Russia, USA
Offline population, 2014: 147 million
Internet penetration, 2014: 82%
Source: World Bank; McKinsey analysis from Internet Barriers Index
KPCB INTERNET TRENDS 2016 | PAGE 14
Visuals: Chart: radar (spider) chart with four axes meeting at the top (Incentives), right (Low incomes and affordability), bottom (User capability) and left (Infrastructure); radial scale 0 to 100 with rings labelled 0, 20, 40, 60, 80, 100 along the top axis; no units. Five series, values about (estimated from the drawing, not printed): Group 1 about Incentives 20, Low incomes 33, User capability 37, Infrastructure 34 (light blue line); Group 2 about Incentives 35, Low incomes 71, User capability 83, Infrastructure 34 (light periwinkle line); Group 3 about Incentives 32, Low incomes 75, User capability 88, Infrastructure 42 (mid blue line); Group 4 about Incentives 43, Low incomes 64, User capability 90, Infrastructure 48 (navy line); Group 5 about Incentives 68, Low incomes 91, User capability 99, Infrastructure 86 (black line). No values are printed on the points; the file also contains a hidden black text '3' at 4.44% size near the lower left of the chart that is not visible in the render. Legend at upper right of chart listing Group 1 to Group 5 with line swatches in the same colours as the series. Highlighted points: none. Icons: four navy circular icons, one above Incentives (monitor with globe and running figure), one left of Infrastructure (two gears), one right of Low incomes (banknote with dollar sign), one below User capability (head profile with gears). Right column: five cards, each with a bitmap drop shadow, a light grey body and a coloured header band, each listing groups' countries, offline population 2014 and internet penetration 2014 as in the text. Footer logo: @KPCB wordmark in green-teal letters at lower left.
Slide 16
Smartphone Cost in Many Developing Markets = Material % of Per Capita Income... / 15% (Vietnam) / 10% (Nigeria) / 10% (India) / 6% (Indonesia), per McKinsey / Average retail price of a smart phone, $USD, 2014 / Ethiopia / Tanzania / Bangladesh / Vietnam / India / Nigeria / Egypt / Indonesia / Philippines / Thailand / Colombia / South Africa / China / Turkey / Brazil / Russia / Mexico / Germany / Italy / Spain / South Korea / Japan / $262 / $198 / $123 / $279 / $158 / $307 / $195 / $212 / $163 / $273 / $291 / $256 / $243 / $522 / $319 / $232 / $244 / $486 / $327 / $269 / $216 / $232 / 47.6 / 21.5 / 11.4 / 14.8 / 10.1 / 10.3 / 6.1 / 5.8 / 4.7 / 4.7 / 3.7 / 3.8 / 3.3 / 4.8 / 2.7 / 1.8 / 2.5 / 1.0 / 0.9 / 0.9 / 0.8 / 0.6 / x% / Cost of smartphone as a % / of GNI per capita, 2014 / Developing / Developed / Source: McKinsey, Euromonitor, (smartphone prices); World Bank, estimates (GNI p.c., Atlas method) / Note: Reflects true prices as paid by the consumer at point-of-sale; includes taxes and subsidies. Excludes data plan costs. / KPCB INTERNET TRENDS 2016 | PAGE 15
Visuals: Horizontal bar chart, untitled apart from its subtitle 'Average retail price of a smart phone, $USD, 2014'. Categories (top to bottom): Ethiopia, Tanzania, Bangladesh, Vietnam, India, Nigeria, Egypt, Indonesia, Philippines, Thailand, Colombia, South Africa, China, Turkey, Brazil, Russia, Mexico, Germany, Italy, Spain, South Korea, Japan. No value axis or gridlines are printed; bars carry printed values. Series, each with its labelled value: Developing bars in #0066CC are Ethiopia $262, Tanzania $198, Bangladesh $123, Vietnam $279, India $158, Nigeria $307, Egypt $195, Indonesia $212, Philippines $163, Thailand $273, Colombia $291, South Africa $256, China $243, Turkey $522, Brazil $319, Russia $232, Mexico $244. Developed bars in #002960 are Germany $486, Italy $327, Spain $269, South Korea $216, Japan $232. Bar lengths are proportional to these values. Right-hand ovals give cost of smartphone as a percent of GNI per capita, 2014: Ethiopia 47.6, Tanzania 21.5, Bangladesh 11.4, Vietnam 14.8, India 10.1, Nigeria 10.3, Egypt 6.1, Indonesia 5.8, Philippines 4.7, Thailand 4.7, Colombia 3.7, South Africa 3.8, China 3.3, Turkey 4.8, Brazil 2.7, Russia 1.8, Mexico 2.5 in #0066CC; Germany 1.0, Italy 0.9, Spain 0.9, South Korea 0.8, Japan 0.6 in #002960. Legend box: white rectangle with thin light grey border containing a blue oval labelled x% with text 'Cost of smartphone as a % of GNI per capita, 2014', a blue square labelled Developing and a black square labelled Developed. No bars are highlighted. Flags of each country sit at the far left of each row, drawn as small rectangular boxed flags, each with a thin dark outline: Ethiopia (green, yellow, red tricolour with blue disc), Tanzania (diagonal green, black and blue with yellow edging), Bangladesh (dark green field with red disc), Vietnam (red with yellow star), India (saffron, white, green with blue wheel), Nigeria (green, white, green vertical), Egypt (red, white, black horizontal with eagle), Indonesia (red over white), Philippines (blue and red with white triangle and yellow sun), Thailand (red, white, blue, red bands with blue centre), Colombia (yellow, blue, red horizontal), South Africa (Y-shaped multicolour), China (red with yellow stars), Turkey (red with white crescent and star), Brazil (green with yellow diamond and blue globe), Russia (white, blue, red horizontal), Mexico (green, white, red vertical with emblem), Germany (black, red, gold horizontal), Italy (green, white, red vertical), Spain (red, yellow, red horizontal with emblem), South Korea (white field with taegeuk and trigrams), Japan (white with red disc). Logo: '@KPCB' wordmark in bold green letters, bottom left.
Slide 17
GLOBAL MACRO TRENDS
Visuals: A thin white horizontal line spanning nearly the full slide width near the top third, and two small white wordmark logos in the bottom corners: '@KPCB' at bottom-left and 'KPCB.COM' at bottom-right. No photographs, charts or diagrams.
Slide 18
Global Economic Growth =
Slowing
KPCB INTERNET TRENDS 2016 | PAGE 17
Slide 19
Global GDP Growth Slowing =
Growth in 6 of Last 8 Years @ Below 20-Year Average
Global Real GDP Growth (%), 1980 – 2015
6% / 5% / 4% / 3% / 2% / 1% / 0% / (1%)
1980 / 1981 / 1982 / 1983 / 1984 / 1985 / 1986 / 1987 / 1988 / 1989 / 1990 / 1991 / 1992 / 1993 / 1994 / 1995 / 1996 / 1997 / 1998 / 1999 / 2000 / 2001 / 2002 / 2003 / 2004 / 2005 / 2006 / 2007 / 2008 / 2009 / 2010 / 2011 / 2012 / 2013 / 2014 / 2015
Global Real GDP Growth (%)
20-Year Avg = 3.8%
35-Year Avg = 3.5%
Source: IMF WEO, 4/16. Stephen Roach, “A World Turned Inside Out,” Yale Jackson Institute for Global Affairs, 5/16.
Note: GDP growth based on constant prices (real GDP growth).
KPCB INTERNET TRENDS 2016 | PAGE 18
Visuals: Chart: vertical column chart titled Global Real GDP Growth (%), 1980 – 2015 (bold black). Y-axis titled Global Real GDP Growth (%), range (1%) to 6%, gridlines every 1% in light grey, tick labels 6%, 5%, 4%, 3%, 2%, 1%, 0%, (1%). X-axis: one column per year 1980 to 2015, labels rotated 90 degrees in bold black. Single series, values about as follows: 1980 2.1%; 1981 1.9%; 1982 0.7%; 1983 2.7%; 1984 4.7%; 1985 3.8%; 1986 3.7%; 1987 3.9%; 1988 4.75%; 1989 3.85%; 1990 3.45%; 1991 2.65%; 1992 2.3%; 1993 2.1%; 1994 3.3%; 1995 3.35%; 1996 3.9%; 1997 4.1%; 1998 2.55%; 1999 3.65%; 2000 4.8%; 2001 2.5%; 2002 2.9%; 2003 4.3%; 2004 5.4%; 2005 4.85%; 2006 5.5%; 2007 5.65%; 2008 3.0%; 2009 about -0.05%; 2010 5.4%; 2011 4.2%; 2012 3.45%; 2013 3.3%; 2014 3.4%; 2015 3.1%. Values are estimates read from bar heights; no values are printed on the bars. Bar colours: green #33B780 for years at or above about 3.5% (1984, 1985, 1986, 1987, 1988, 1989, 1996, 1997, 2000, 2003, 2004, 2005, 2006, 2007, 2010, 2011); red about #DE3E2E for years below about 3.5%. Reference lines: a solid black horizontal line at about 3.8% from 1996 to 2015 (20-year average), and a black dashed horizontal line at about 3.5% running from 1984 to 2015 (35-year average). Highlighted: a red ellipse outline drawn around the label 20-Year Avg = 3.8%. No legend. Logo: the KPCB wordmark in green #33B780 with an @ symbol, at lower left.
Slide 20
Commodity Price Trends =
In Part, Tell Tale of
Slowing Global Growth
KPCB INTERNET TRENDS 2016 | PAGE 19
Visuals: None apart from the small @KPCB logo in the bottom-left corner, which is a green pixel-style wordmark (72 by 25 pixels) reading '@KPCB' in bright green (about #3DB88A) and the footer text. No charts, photographs or diagrams.
Slide 21
Commodity Prices Down = -39% Since 5/14 vs. / -8% Annual Average (5/11-4/14) & +6% (1/00-4/11) / Global Commodity Prices, Bloomberg Commodity Index / (Indexed to 0 @ 1/00), 2000 – 2016YTD / Bloomberg Commodity Index (Indexed to 0 @ 1/00) / 200% / 150% / 100% / 50% / 0% / (50%) / 2000 2001 2002 2003 2004 2005 2006 2007 2008 2009 2010 2011 2012 2013 2014 2015 2016 / @KPCB / Source: Morgan Stanley, Bloomberg as of 5/25/16 / Note: Bloomberg Commodity Index represents 22 globally traded commodities, weighted as: 31% Energy, 23% Grains, 17% Industrial Metals, 16% Precious Metals, 7% Softs (Sugar, Coffee, Cotton), and 6% Livestock. / KPCB INTERNET TRENDS 2016 | PAGE 20
Visuals: Line chart titled Global Commodity Prices, Bloomberg Commodity Index (Indexed to 0 @ 1/00), 2000 – 2016YTD. Y-axis titled Bloomberg Commodity Index (Indexed to 0 @ 1/00), in percent, ticks at (50%), 0%, 50%, 100%, 150%, 200%, with horizontal light grey gridlines at each tick. X-axis shows calendar years 2000 to 2016 as labels, with the series running from 1/2000 to about 2016YTD. Single series in green (about #36B888) with a line width of about 3 px, no markers, no data labels printed. Values are not printed; approximate read-offs: about 5% at start in 2000, about -5% low in 2002, about 40% to 60% in 2004, about 90% to 100% by 2006 to 2007, peak about 158% in mid 2008, drop to about 15% in early 2009, about 90% peak in early 2011, about 50% in 2014, low about -20% in early 2016, ending about -8%. Three black thin annotation arrows overlay the chart: the first rises from about 2000 near 5% to about 2011 near 95%; the second falls from about 2011 near 95% to about 2014 near 52%; the third falls from about 2014 near 52% to about 2016 near -8%. No legend. No highlighted points beyond the arrows. A small teal and green @KPCB logo is at bottom left.
Slide 22
Global Growth Engines =
Evolve Over Time
KPCB INTERNET TRENDS 2016 | PAGE 21
Visuals: None. Only the navy header band, the thin teal rule, and the small @KPCB wordmark logo (72 by 25 pixels) are non-text graphics.
Slide 23
Global Growth Engines @ ~2/3 of Global GDP Growth...
1985 = N. America + Europe + Japan
2015 = China + Emerging Asia
Real GDP Growth Contribution by Region, 1985 / 2015
(Based on Purchasing Power Parity)
1985
$19T = World GDP
+4% Y/Y
2015
$114T = World GDP
+3% Y/Y
0%
N. America + Europe + Japan =
9%
29% of Total
15%
13%
China + Emerging Asia =
18% of Total
22%
28%
13%
11%
7%
9%
9%
N. America + Europe + Japan =
63% of Total
37%
26%
1%
China + Emerging Asia =
63% of Total
Europe
N. America
Japan
China
Emerging Asia (ex-China)
Lat Am
Middle East, Africa, Other
KPCB INTERNET TRENDS 2016 | PAGE 22
Source: IMF WEO, 4/16. GDP growth based on constant prices (real GDP growth). PPP = Purchasing Power Parity exchange rate, national currency per international dollar. GDP PPP = GDP adjusted by
PPP rate. Emerging Asia includes Bangladesh, Cambodia, India, Indonesia, Lao, Malaysia, Mongolia, Myanmar, Nepal, Philippines, Sri Lanka, Thailand, Vietnam and others and excludes China.
GDP growth contribution based on annual snapshots stated above and not necessarily reflective of secular trends.
Visuals: Two pie charts with callout labels, both on the same category set. 1985 pie (small, about 20.5% to 30% of slide width, 54.5% to 67% of height): slices clockwise from top are Europe 22% (purple), N. America 28% (green), Japan 13% (pale mint), China 11% (red), Emerging Asia ex-China 7% (cyan), Lat Am 9% (yellow), Middle East Africa Other 9% (dark blue). Crimson outline arc encloses the N. America + Europe + Japan slices (labelled 63% of Total); blue outline arc encloses the China + Emerging Asia slices (labelled 18% of Total). 2015 pie (large, about 57.4% to 88.3% of width, 39.7% to 79.7% of height): Europe 15% (purple, top right), N. America 13% (green), Japan 1% (pale mint, leader line to label), China 37% (red, bottom), Emerging Asia ex-China 26% (cyan, left), Lat Am 0% (yellow, leader line, sliver), Middle East Africa Other 9% (dark blue, top left). Slices are separated by small white gaps; the N. America + Europe + Japan group is pulled slightly outward and outlined in crimson, the China + Emerging Asia group is outlined in blue. Labels in the 2015 pie are white bold inside the slices and black outside. Legend below the charts: colour squares with Europe (purple), N. America (green), Japan (pale mint), China (red), Emerging Asia (ex-China) (cyan), Lat Am (yellow), Middle East, Africa, Other (dark blue). No data axes; values are printed on the slices.
Slide 24
China’s
Gross Capital Formation
(Capital Equipment /
Roads / Buildings...)
Past 6 Years >
Previous 30 Years
@KPCB
KPCB INTERNET TRENDS 2016 | PAGE 23
Visuals: none. The slide contains no charts, tables, photographs, illustrations, or icons. The only graphic elements are the dark teal header band, the thin teal rule beneath it, and the small @KPCB green wordmark logo at bottom-left.
Slide 25
China Gross Capital Formation = Slowing...
Sum of Past 6 Years > Previous 30 Years
China Gross Capital Formation, 1980 – 2015
(In 2010 Dollars)
$20T+
$21T+
$4,500
$4,000
$3,500
$3,000
$2,500
$2,000
$1,500
$1,000
$500
$0
1980 1981 1982 1983 1984 1985 1986 1987 1988 1989 1990 1991 1992 1993 1994 1995 1996 1997 1998 1999 2000 2001 2002 2003 2004 2005 2006 2007 2008 2009 2010 2011 2012 2013 2014 2015
China Gross Capital Formation ($B)
China Gross Capital Formation ($B)
@KPCB
Source: China National Bureau of Statistics, 5/16. Assumes constant FX rate RMB/USD @ 6.5.
Amounts are inflation adjusted to 2010 dollars based on IMF data on inflation rates (yearly average).
Gross capital formation = gross fixed capital formation (majority) + changes in inventory. Gross fixed capital formation includes land improvements (fences, ditches, drains, and so on); plant, machinery, and
equipment purchases; and the construction of roads, railways, and the like, including schools, offices, hospitals, private residential dwellings, and commercial and industrial buildings. It also includes the
value of draught animals, breeding stock and animals for milk, for wool and for recreational purposes, and newly increased forest with economic value.
KPCB INTERNET TRENDS 2016 | PAGE 24
Visuals: Chart: vertical bar chart titled China Gross Capital Formation, 1980 – 2015, subtitle (In 2010 Dollars). Y-axis titled China Gross Capital Formation ($B), range $0 to $4,500, gridlines at every $500, labels $0, $500, $1,000, $1,500, $2,000, $2,500, $3,000, $3,500, $4,000, $4,500. X-axis: years 1980 to 2015, one bar per year, labels rotated vertical bold. Single series, China Gross Capital Formation ($B), bars filled #EA543B. Values printed on the slide: none; estimates (about, in $B): 1980 about 120, 1981 about 120, 1982 about 120, 1983 about 135, 1984 about 170, 1985 about 230, 1986 about 235, 1987 about 250, 1988 about 280, 1989 about 250, 1990 about 245, 1991 about 285, 1992 about 375, 1993 about 475, 1994 about 480, 1995 about 500, 1996 about 525, 1997 about 535, 1998 about 565, 1999 about 595, 2000 about 645, 2001 about 750, 2002 about 840, 2003 about 1030, 2004 about 1240, 2005 about 1360, 2006 about 1545, 2007 about 1835, 2008 about 2140, 2009 about 2515, 2010 about 2950, 2011 about 3320, 2012 about 3535, 2013 about 3810, 2014 about 3990, 2015 about 3970. Brackets above the bars: a thin black bracket spanning 1980 to 2009 labelled $20T+, and a shorter bracket spanning 2010 to 2015 labelled $21T+, both bold black. Legend below the chart: red square swatch #EA543B followed by China Gross Capital Formation ($B). No highlighted points beyond the brackets. Logo: @KPCB wordmark, green #2BB673 approx, bottom left.
Slide 26
Shanghai Area Over Past 2+ Decades =
Illustrates Magnitude of China (& Emerging Asia) Growth
Shanghai, China,
Pudong District
1987
2016
Source: Reuters/Stringer, Carlos Barria, Yichen Guo.
KPCB INTERNET TRENDS 2016 | PAGE 25
Visuals: Two photographs and two circular year markers with connectors. Photo 1 (top right, 1987): a hazy daytime panorama over the Huangpu River taken from an elevated viewpoint. Many small boats and larger ships sit on grey-blue water, a dense low-rise urban grid fills the middle distance, and a historic clock tower and domed building with a red-roofed ship at the right edge are visible. Overcast pale blue sky fills the top half, and the image is a full rectangle with no border. Photo 2 (lower right, 2016): a clear-sky daytime view of the Pudong skyline across the river, showing the Oriental Pearl Tower with its spheres and spire at left-centre, a cluster of high-rise towers, the tall glass Shanghai Tower at right with a Jin Mao-style tower nearby, and river boats in the foreground. Overall tone is saturated cyan-blue sky and teal-grey water, with a small historic building with a clock tower at the bottom right. Both photographs are plain rectangles, not cropped to shape, with no overlay or tint. Year markers: a grey filled circle labelled 1987 and a teal filled circle labelled 2016, each with a dotted grey connector running right to its photo. A grey dotted vertical line runs from the 1987 circle to the 2016 circle, ending in a small grey downward-pointing solid triangle just above the 2016 circle. Logo: a small green '@KPCB' wordmark at bottom-left.
Slide 27
Re-Imagination of China / Over Past 3+ Decades – / World’s Population Leader + / #3 in Land Mass –
Helped Drive Incremental / Global Growth of Likes Which is / Difficult to Repeat
KPCB INTERNET TRENDS 2016 | PAGE 26
Slide 28
Interest Rates Have Fallen to / Historically Low Levels =
Interest Rate Trends = / Can be Indicative of / Perception for Growth Outlook
KPCB INTERNET TRENDS 2016 | PAGE 27
Visuals: One small raster logo at bottom-left reading '@KPCB' in green letters (72 by 25 pixels, placed at x 1.8%, y 94.4%, w 7.5%, h 3.4%). No charts, photographs or diagrams.
Slide 29
USA 10-Year Treasury Yield =
Low by Historical Standards
USA 10-Year Treasury Yields, Nominal and Real, 1962 – 2016YTD
20%
15%
10%
5%
0%
(5%)
1962 1967 1972 1977 1982 1987 1992 1997 2002 2007 2012
10-Year Yield (%)
Nominal Yield (%)
Real Yield (%)
Source: Morgan Stanley, Bloomberg, 5/16
Note: Real rates based on USGGT10Y Index on Bloomberg, which measures yield to maturity (pre-tax) on Generic 10-Year USA government inflation-index bonds.
KPCB INTERNET TRENDS 2016 | PAGE 28
Visuals: One line chart. Title: 'USA 10-Year Treasury Yields, Nominal and Real, 1962 – 2016YTD'. Y-axis: titled '10-Year Yield (%)', ticks 20%, 15%, 10%, 5%, 0%, (5%), range -5% to 20%, major gridlines in light grey at each tick. X-axis: years labelled 1962, 1967, 1972, 1977, 1982, 1987, 1992, 1997, 2002, 2007, 2012, range about 1962 to 2016. Series 1 'Nominal Yield (%)' in green: starts about 4% in 1962, dips to about 3.9% around 1965, rises to about 8% by 1970, about 9% by 1980, peaks at about 15.8% around 1981–1982, falls to about 10% by 1985, about 7% by 1987, about 9% around 1989, about 5% by 1995, about 4% by 2003, about 3% to 4% through 2008–2010, about 1.7% around 2013, and ends about 1.8% in 2016. Series 2 'Real Yield (%)' in blue: starts about 3.3% in 1997, peaks about 4.3% around 2000, falls to about 2% by 2004, about 1.5% to 2.5% 2005–2008, about 0% to 1% near 2010, about -1% around 2013, about 0.5% to 1% 2014–2016, ending about 0.1%. Legend below the plot, centred: green line swatch then 'Nominal Yield (%)', blue line swatch then 'Real Yield (%)'. No highlighted points. Logo: '@KPCB' wordmark in green, bottom left.
Slide 30
Global 10-Year Treasury Yields =
Have Trended Down
10-Year Real Sovereign Bond Yields (%), Various Countries, 2001 – 2016YTD
10-Year Real Sovereign Bond Yields (%)
(2%) 0% 2% 4% 6% 8% 2001 2003 2005 2007 2009 2011 2013 2015
USA Canada UK Japan France Germany Italy
@KPCB
Source: Morgan Stanley, Bloomberg, 5/16.
Note: Real rates based on yield to maturity on 10-year inflation-indexed treasury security for each country.
KPCB INTERNET TRENDS 2016 | PAGE 29
Visuals: Chart: multi-series line chart, titled 10-Year Real Sovereign Bond Yields (%), Various Countries, 2001 – 2016YTD. Y-axis titled 10-Year Real Sovereign Bond Yields (%) with ticks (2%), 0%, 2%, 4%, 6%, 8%, range about -2% to 8%, horizontal light grey gridlines at each 2% step. X-axis: years 2001, 2003, 2005, 2007, 2009, 2011, 2013, 2015 in bold black, daily-type data running from 2001 to about mid-2016. Seven series, all thin lines of about 2 px width: USA yellow #F2B705, Canada purple #7030A0, UK green #3BB27F, Japan cyan #17B5D6, France dark blue #0F5FA6, Germany magenta #A8336B, Italy red #E0412E. Approximate values, no printed values: USA about 3.7% in 2001 falling to about 0.2% by 2016; Canada about 3.4% in 2001 to about -0.1% by 2016; UK about 2.2% in 2001 and a low about -1.6% near 2013; Japan about 1.1% in 2004, spike to about 5.1% near 2009, low about 0.3% in 2005, ends about -0.5%; France spike to about 2.3% near 2012; Germany about -1.3% near 2015; Italy peak about 7.2% in late 2011 and about 0.5% at the end. Legend: horizontal row below the x-axis, each entry a short coloured line swatch followed by its bold black name, in the order USA, Canada, UK, Japan, France, Germany, Italy. Logo: @KPCB wordmark in green, bottom left. No photographs, icons or illustrations.
Slide 31
Total Global Debt Loads
Over 2 Decades =
High & Rising Faster Than GDP
KPCB INTERNET TRENDS 2016 | PAGE 30
Visuals: None apart from the small KPCB wordmark logo at bottom-left (green pixel-style '@KPCB' lettering, 72 by 25 pixels, placed at x 1.8%, y 94.4%, width 7.5%, height 3.4%).
Slide 32
Global Government Debt @ 66% Average Debt / GDP (2015) & Up...
+9% Annually Over 8 Years vs. +2% GDP Growth* for 50 Major Countries
Global Debt By Type ($T, Constant 2014 FX), Q4:00 – Q2:15
Compound annual
growth rate (%)
2000–2007 / 2007–Q2:15
$208
+70T
$138
$84
Household
Corporate
Government
Financial
$41 $59 $59 $49 $33 $37 $32 $37 $19 $25 $21 $20
8.5 3.0 5.7 6.4 5.9 8.7 9.6 3.7
Q4:00 Q4:07 Q2:15
Total debt as
% of GDP
250 274 299
GDP
Growth*:
4.1 2.2
Source: McKinsey Global Institute (3/16), IMF.
*GDP growth rate based on constant prices and calculated as average of average growth rates across 50 countries from 2000-2007 and 2008-2015.
KPCB INTERNET TRENDS 2016 | PAGE 31
Visuals: Chart: stacked column chart, titled 'Global Debt By Type ($T, Constant 2014 FX), Q4:00 – Q2:15'. Y-axis not drawn; values are printed on segments in $ trillions. Three columns with category labels Q4:00, Q4:07, Q2:15 beneath. Column totals printed above: $84 (Q4:00), $138 (Q4:07), $208 (Q2:15). Segments from bottom to top in every column: Financial (grey #B2B2B2), Government (red #C82055), Corporate (blue #00689D), Household (green #31AF78). Q4:00 values: Financial $20, Government $21, Corporate $25, Household $19. Q4:07 values: Financial $37, Government $32, Corporate $37, Household $33. Q2:15 values: Financial $49, Government $59, Corporate $59, Household $41. Annotation: a dark blue oval badge reading '+70T' sits above the Q4:07 column; a black arrow with thin dashed guide lines runs vertically from the top of the Q4:07 column ($138) up to the top of the Q2:15 column ($208). Row labels to the right of the Q2:15 column in black sans-serif: Household, Corporate, Government, Financial, aligned to segment rows. Right-hand table 'Compound annual growth rate (%)' with a black underline and two sub-columns '2000–2007' and '2007–Q2:15' each underlined. Ovals with white bold values: Household 8.5 and 3.0 (green #31AF78); Corporate 5.7 and 6.4 (blue #00689D); Government 5.9 and 8.7 (red #C82055); Financial 9.6 and 3.7 (grey #B2B2B2). Bottom row: 'Total debt as % of GDP' label with blue glossy oval badges 250 (Q4:00), 274 (Q4:07), 299 (Q2:15) with white bold numbers and a subtle dark drop shadow. 'GDP Growth*:' label underlined with yellow (#F5B800) oval badges 4.1 and 2.2 in white bold numbers. Logo: '@KPCB' green pixel-style wordmark bottom-left. No photographs.
Slide 33
Total Debt-to-GDP Ratios = High & Up in Most Major Countries...
@ 202% Average vs. 147% (2000)*
Change in Real Economy Debt / GDP (%), 2007 – Q2:15
Increasing leverage
Developed
Emerging
140 / 130 / 120 / 110 / 100 / 90 / 80 / 70 / 60 / 50 / 40 / 30 / 20 / 10 / 0 / -10 / -20
Ireland
Singapore
Hong Kong
Portugal
Greece
Belgium
France
Finland
Spain
Japan
Netherlands
Italy
Canada
Australia
Slovakia
Sweden
Korea
United Kingdom
Switzerland
Denmark
Austria
Norway
United States
Germany
China
Colombia
Chile
Malaysia
Thailand
Turkey
Russia
Mexico
Vietnam
Poland
Brazil
Czech Republic
Morocco
South Africa
Hungary
India
Romania
Egypt
Argentina
Nigeria
Saudi Arabia
Philippines
Peru
Indonesia
Leveraging
Deleveraging
Change in Real Economy Debt / GDP (%)
India
Hungary
Philippines
Peru
Deleveraging
0 / 30 / 60 / 90 / 120 / 150 / 180 / 210 / 240 / 270 / 300 / 330 / 360 / 390 / 420
Q2:15 Real Economy Debt / GDP (%)
KPCB INTERNET TRENDS 2016 | PAGE 32
Source: McKinsey Global Institute (3/16). Debt includes that owed by households, non-financial corporates, and governments (i.e. excludes financial sector debt).
*Country inclusion per McKinsey; includes top developed countries by GDP and representative geographic selection of emerging countries.
Visuals: Scatter plot. Title: 'Change in Real Economy Debt / GDP (%), 2007 – Q2:15' (bold, black, centred above plot). X-axis: 'Q2:15 Real Economy Debt / GDP (%)', range 0 to 420, ticks every 30, labelled 0 to 420. Y-axis: 'Change in Real Economy Debt / GDP (%)', range -20 to 140, ticks every 10, labelled 140 at top; a small green break mark sits on the y-axis at about 93. Horizontal thin grey reference line at y=0 across full plot width. Two series: Developed (orange dots, #F07D00 approx) and Emerging (light blue dots, #66CCFF approx). Legend top-left inside plot: orange dot 'Developed', light blue dot 'Emerging'. Labelled points, all values about: Ireland (about 349, 134) orange; Singapore (about 375, 123) orange; Hong Kong (about 289, 112) orange; Portugal (about 345, 90) orange; Greece (about 303, 87) orange; Belgium (about 345, 80) orange; France (about 284, 74) orange; Finland (about 253, 75) orange; Spain (about 303, 63) orange; Japan (about 398, 62) orange; Netherlands (about 317, 56) orange; Italy (about 261, 58) orange; Canada (about 241, 56) orange; Australia (about 229, 54) orange; Slovakia (about 148, 55) orange; Sweden (about 281, 52) orange; Korea (about 231, 46) orange; United Kingdom (about 258, 39) orange; Switzerland (about 251, 34) orange; Denmark (about 285, 36) orange; Austria (about 237, 27) orange; Norway (about 267, 27) orange; United States (about 245, 19) orange; Germany (about 186, 6) orange; China (about 221, 89) blue; Malaysia (about 207, 55) blue; Colombia (about 92, 45) blue; Chile (about 149, 49) blue; Thailand (about 170, 43) blue; Turkey (about 105, 35) blue; Russia (about 84, 36) blue; Mexico (about 85, 36) blue; Vietnam (about 170, 40) blue; Poland (about 132, 35) blue; Brazil (about 137, 38) blue; Czech Republic (about 130, 36) orange; Morocco (about 138, 22) blue; South Africa (about 131, 21) blue; Hungary (about 200, 25) blue; India (about 124, 1) blue; Romania (about 108, -1) blue; Egypt (about 99, -5) blue; Argentina (about 32, -12) blue; Nigeria (about 28, 4) blue; Saudi Arabia (about 73, 3) blue; Philippines (about 73, 11) blue; Peru (about 56, 16) blue; Indonesia (about 57, 16) blue. Annotation text: 'Increasing leverage' in red (#C00000) near top centre; 'Deleveraging' in green (#009900) near bottom centre. Leader lines are thin grey. Right side: vertical gradient arrow, double-headed, from red at top to yellow at middle to green at bottom, with 'Leveraging' above and 'Deleveraging' below in bold black. Bottom-left logo: '@KPCB' wordmark in green.
Slide 34
Demographic Trends =
Slowing Population Growth...
Slowing Birthrates +
Rising Lifespans
KPCB INTERNET TRENDS 2016 | PAGE 33
Slide 35
World Population Growth Rate Slowing =
+1.2% vs. +2.0% (1975)
Global Population and Y/Y % Growth, 1950 – 2050E
Global Population (B)
0.0%0.5%1.0%1.5%2.0%2.5%0246810
Y/Y Growth Rate (%)
1950 1955 1960 1965 1970 1975 1980 1985 1990 1995 2000 2005 2010 2015 2020E 2025E 2030E 2035E 2040E 2045E 2050E
Global Population (B)
Y/Y Growth (%)
Source: U.N. Population Division
Note: Growth Rates based on CAGRs over 5 Year Periods.
KPCB INTERNET TRENDS 2016 | PAGE 34
Visuals: Combination chart titled 'Global Population and Y/Y % Growth, 1950 – 2050E'. Left y-axis titled 'Global Population (B)', range 0 to 10 in steps of 2, no unit beyond billions. Right y-axis titled 'Y/Y Growth Rate (%)', range 0.0% to 2.5% in steps of 0.5%. X-axis categories 1950, 1955 through 2015 in 5-year steps, then 2020E through 2050E, labels rotated about 45 degrees. Series 1, 'Global Population (B)', shown as vertical columns: solid #00689D for 1950 to 2015 (values about 2.5, 2.75, 3.0, 3.3, 3.7, 4.05, 4.45, 4.85, 5.3, 5.7, 6.1, 6.5, 6.9, 7.35 billion); hollow columns with #F9F9F9 fill and #00689D outline for 2020E to 2050E (about 7.75, 8.15, 8.5, 8.85, 9.15, 9.45, 9.7 billion). No values are printed on the bars; all bar values are estimates. Series 2, 'Y/Y Growth (%)', a line in crimson #C8386A, 3 px weight, no markers, plotted on the right axis from 1955 onward: about 1.8% (1955), 1.85% (1960), 1.95% (1965), 2.07% (1970, peak), 1.97% (1975), 1.8% (1980), 1.8% (1985), 1.82% (1990), 1.55% (1995), 1.33% (2000), 1.25% (2005), 1.23% (2010), 1.19% (2015), about 1.08% (2020E), 0.95% (2025E), 0.86% (2030E), 0.79% (2035E), 0.72% (2040E), 0.65% (2045E), 0.57% (2050E). Legend centred below the axis: a blue #00689D square labelled 'Global Population (B)' and a crimson line labelled 'Y/Y Growth (%)'. Horizontal light grey gridlines #D9D9D9 at each left-axis tick. Highlighted points: none. Also present: a small KPCB logo at bottom left (green wordmark '@KPCB' in #3DBE8B, pixel-based, 72 by 25 pixels).
Slide 36
Global Birth Rates =
Down 39% Since 1960 (1% Annual Average Decline)
Birth Rates per 1,000 People per Year, By Region, 1960 – 2014
Birth Rate per 1,000 People, per Year
010203040501960 1965 1970 1975 1980 1985 1990 1995 2000 2005 2010 2014
World
USA
China
India
Europe / Central Asia
East Asia / Pacific
Middle East / North Africa
Sub-Saharan Africa
Source: World Bank World Development Indicators
Note: Represents birth rates per 1,000 people per year.
KPCB INTERNET TRENDS 2016 | PAGE 35
@KPCB
Visuals: Line chart titled 'Birth Rates per 1,000 People per Year, By Region, 1960 – 2014'. X axis: calendar years 1960 to 2014, labelled every 5 years (1960, 1965, ... 2014), no unit label. Y axis: 'Birth Rate per 1,000 People, per Year', range 0 to 50, gridlines and tick labels at 0, 10, 20, 30, 40, 50, light grey horizontal gridlines. Eight series, each with a legend entry: World (black dashed line; about 32 in 1960, about 36 peak in 1963, about 27.5 in 1980, about 19.5 in 2014); USA (purple; about 24 in 1960, about 16.7 peak near 1990, about 12.5 in 2014); China (green; about 21 in 1960, about 43.5 peak in 1963, about 18 low near 1979, about 12 in 2014); India (cyan; about 42 in 1960, about 41 in 1963, about 36 in 1980, about 20 in 2014); Europe / Central Asia (dark blue; about 22 in 1960, about 16 in 1990, about 12.3 in 2014); East Asia / Pacific (crimson; about 26.5 in 1960, about 40 peak in 1963, about 14 in 2014); Middle East / North Africa (gold; about 47 in 1960, about 41 in 1980, about 24 in 2014); Sub-Saharan Africa (teal; about 47.5 in 1960, about 47 in 1975, about 37 in 2014). Values are estimates from the line positions as no values are printed. No highlighted points. Legend: horizontal line swatches with bold labels in three columns. Logo: a green '@KPCB' wordmark (pixelated sans) at bottom-left, about 72 by 25 pixels, green #3CB88A.
Slide 37
Global Life Expectancy @ 72 Years =
Up 36% Since 1960 (0.6% Annual Average Increase)
Life Expectancy (Years, Both Genders), By Region, 1960 – 2014
Life Expectancy (Years)
30 / 40 / 50 / 60 / 70 / 80 / 1960 / 1965 / 1970 / 1975 / 1980 / 1985 / 1990 / 1995 / 2000 / 2005 / 2010 / 2014
World / USA / China / India / Europe / Central Asia / East Asia / Pacific / Middle East / North Africa / Sub-Saharan Africa
Source: World Bank World Development Indicators
@KPCB
KPCB INTERNET TRENDS 2016 | PAGE 36
Visuals: Line chart titled 'Life Expectancy (Years, Both Genders), By Region, 1960 – 2014'. Y-axis: 'Life Expectancy (Years)', range 30 to 80, gridlines every 10 years (30, 40, 50, 60, 70, 80). X-axis: years 1960 to 2014, labelled every 5 years from 1960 to 2014 (last label 2014). Eight series, values not printed, estimated: World (black dashed line, about 52.5 in 1960 rising to about 71.5 in 2014); USA (purple, about 70 in 1960 to about 79 in 2014); China (green, about 43.5 in 1960 rising steeply to about 59 by 1970 and about 75.8 in 2014); India (light cyan, about 41 in 1960 to about 68 in 2014); Europe / Central Asia (dark blue, about 67 in 1960 to about 77 in 2014); East Asia / Pacific (magenta-red, about 48 in 1960 to about 75 in 2014); Middle East / North Africa (amber-gold, about 46.5 in 1960 to about 72.7 in 2014); Sub-Saharan Africa (dark teal, about 40 in 1960 to about 58.5 in 2014). No highlighted points, no legend beyond the in-chart key at the bottom in three columns, each entry a short coloured line sample followed by its bold label. Gridlines are light grey horizontal lines.
Slide 38
Net, Net, / Economic Growth Slowing + / Margins for Error Declining = / (blank line) / Easy Growth Behind Us / KPCB INTERNET TRENDS 2016 | PAGE 37
Visuals: none apart from the KPCB logo at bottom left (green wordmark '@KPCB' on white, about 72 by 25 pixels, boxed by nothing, unrotated). No photographs, charts, or diagrams.
Slide 39
5 Epic Growth Drivers Over Past 2 Decades =
Losing Mojo
1) Connectivity Growth Slowing –
Internet Users rose to 3B from 35MM (1995)
2) Emerging Country Growth Slowing –
Underdeveloped regions developed – including China / Emerging Asia /
Middle East which rose to 69% of global GDP growth from 43%...
3) Government Debt Rising (& High) –
Spending rose to help support growth...Government debt-to-GDP
rose to 66% from 51% (2000) for 50 major economies
4) Interest Rates Have Declined –
Helped fuel borrowing – USA 10-Year Nominal Treasury Yield fell to
1.9% (2016) from 6.6% (1995)
5) Population Growth Rate Slowing & Population Aging –
Higher birth rates helped drive labor force growth – population growth rate
continued to fall – to 1.2% from 1.6% (1995)
Source: US Census, ITU, IMF, Stephen Roach, McKinsey, Bloomberg, US Bureau of Labor Statistics, UN Population Division
KPCB INTERNET TRENDS 2016 | PAGE 38
Slide 40
Several Up / Down Cycles in Past 2 Decades = / Internet 1.0 (2000)...Property / Credit (2008)... / Stock / Commodity Markets Performance (% Change From 1/93), 1/93 – 5/16 / 800% / 700% / 600% / 500% / 400% / 300% / 200% / 100% / 0% / 1993 1994 1995 1996 1997 1998 1999 2000 2001 2002 2003 2004 2005 2006 2007 2008 2009 2010 2011 2012 2013 2014 2015 2016 / Index Value (1/1/1993 = 100%) / S&P 500 / NASDAQ / China Shanghai Composite / MSCI Europe / @KPCB / Source: Capital IQ. / Note: All values are indexed to 1 (100%) on Jan 1, 1993. Data as of 5/2716. / KPCB INTERNET TRENDS 2016 | PAGE 39
Visuals: Line chart titled 'Stock / Commodity Markets Performance (% Change From 1/93), 1/93 – 5/16'. Y-axis: 'Index Value (1/1/1993 = 100%)', linear, 0% to 800% in 100% steps with light grey horizontal gridlines. X-axis: years 1993 to 2016, labels rotated vertical bold, monthly data from 1/93 to 5/16. Four series, no printed data values: S&P 500 green line (about 100% in 1993, about 300% to 350% around 2000, trough about 200% near 2003, about 450% to 480% at end of 2016), NASDAQ red line (about 100% in 1993, peak about 745% around 2000, drop to about 200% by 2003, about 400% in 2007, about 700% to 725% by 5/2016), China Shanghai Composite purple line (about 100% in 1993, dip to about 45% in 1994, peak about 770% around 2007-2008, about 680% spike in 2015, about 365% at 5/2016), MSCI Europe blue line (about 100% in 1993, peak about 500% around 2007-2008, about 335% at 5/2016). Legend below the x-axis as a horizontal row: green line S&P 500, red line NASDAQ, purple line China Shanghai Composite, blue line MSCI Europe. No highlighted points. KPCB logo: small green stylised '@KPCB' wordmark bottom-left.
Slide 41
Adjusting to Slower Growth +
Higher Debt + Aging Population
Creates Rising Risks...
Creates Opportunities for Businesses that
Innovate / Increase Efficiency /
Lower Prices / Create Jobs –
Internet Can Be @ Core of This...
KPCB INTERNET TRENDS 2016 | PAGE 40
Slide 42
ADVERTISING / COMMERCE + BRAND TRENDS
@KPCB
KPCB.COM
Visuals: Two small white wordmark logos and one thin white horizontal line. Logo 1: '@KPCB' at bottom-left, a small white at-sign followed by the bold condensed letters KPCB, 76 by 28 px, at x 1.8%, y 94.3%. Logo 2: 'KPCB.COM' at bottom-right, bold condensed white letters, 98 by 28 px, at x 87.7%, y 94.4%. Line: a solid white rule about 0.2% of slide height thick, running from x about 3.3% to x about 95%, at y about 17%. No photographs, charts or diagrams.
Slide 43
Online Advertising =
Mobile + Majors + Newcomers
Continue to Crank Away
KPCB INTERNET TRENDS 2016 | PAGE 42
Slides 44 to 214 continue in the full text file.
Download this deck
The hosted PDF of every library deck is free for readers of the SlideDeck Co newsletter. Join with your email and the viewer and download appear here.
Building a deck of your own? The SlideDeck Co Standard Deck is a slide library for business presentations: reviews, updates and plans.







