

The deck opens with a title slide, a conference-specific cover and an outline that lists eight sections: internet adoption, key internet trends, re-imagining enterprise and consumer behaviour, America's evolving work environment, big internet markets in China and India, public and private company data, one more thing, and an appendix. It starts with user growth from 1995 to 2014, tracing internet and mobile penetration with simple pie charts and then comparing company market capitalisations across two decades in a ranked table. The middle sections use a recurring structure of a headline-style title, a chart or table, and a short source line, and the enterprise section pairs a 'then' and 'now' panel for each software category. Later sections cover messaging platforms, user-generated content, drones, cyber security, labour market statistics and the growth of on-demand work. The deck is long, and most of its slides are dense data pages rather than visual statements. Slides worth studying include the outline, the market capitalisation comparison, and the then-and-now enterprise panels.
Slides worth studying

Questions about this deck
How many slides does the Mary Meeker, Kleiner Perkins Internet Trends 2015 deck have?
The deck has 197 pages. The outline on slide 3 lists eight sections, from internet adoption through to the appendix.
What does the Mary Meeker, Kleiner Perkins deck say about company market capitalizations?
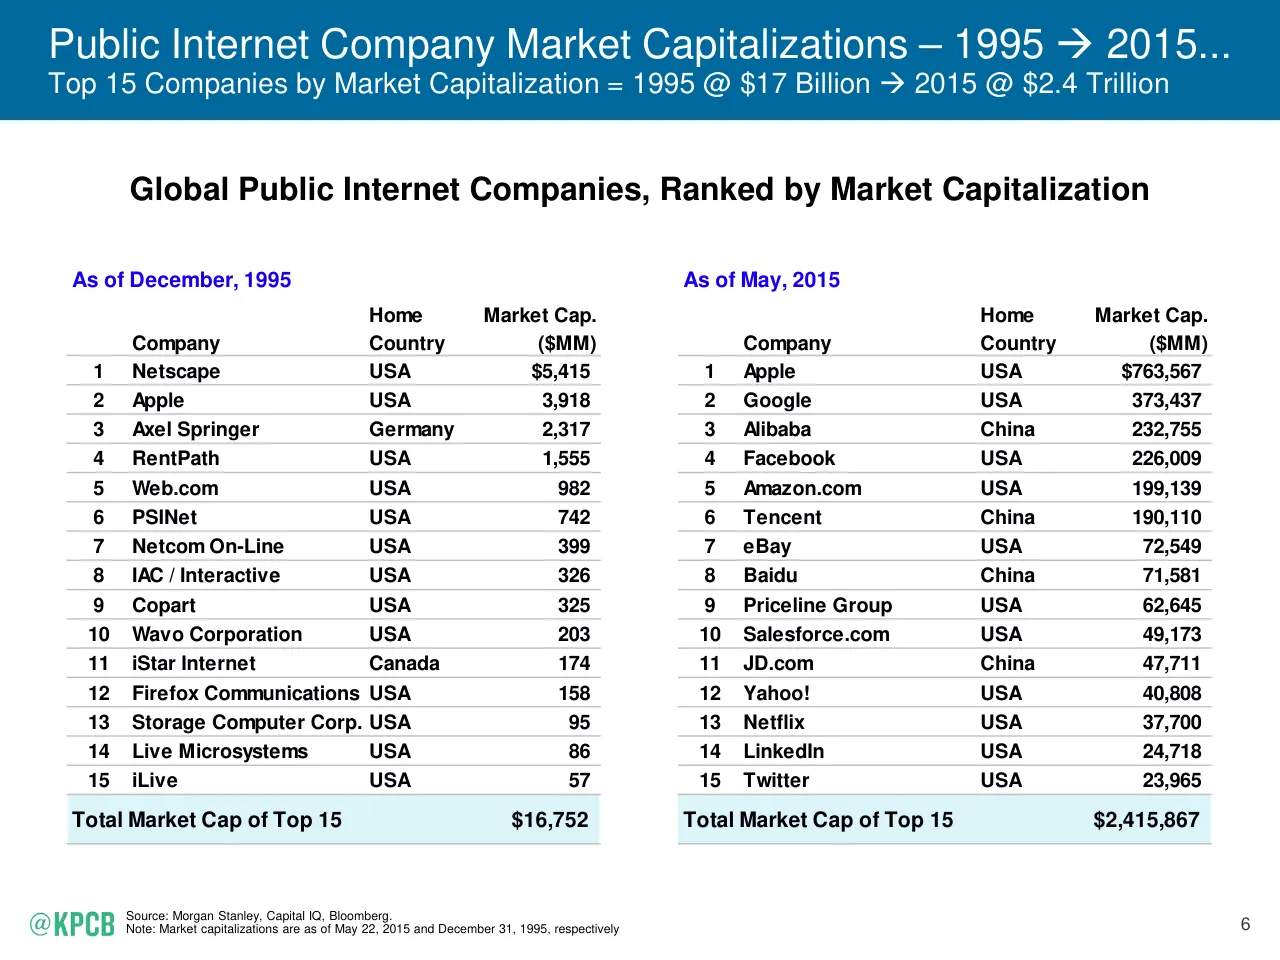
Slide 7 compares the top 15 public internet companies by market capitalization, stating 1995 @ $17 Billion and 2015 @ $2.4 Trillion. The totals on that slide are $16,752 MM for December 1995 and $2,415,867 MM for May 2015.
How is the Mary Meeker, Kleiner Perkins deck structured?
Slide 3 is the outline, listing eight sections: Internet, Key Internet Trends, Re-Imagining Continues, America's Evolving Work Environment, Big Internet Markets = China / India, Public / Private Company Data, One More Thing, and Ran Outta Time Thoughts with the Appendix. The middle sections repeat a headline-style title, a chart or table, and a short source line.
What internet user figures does the Mary Meeker, Kleiner Perkins deck give for 1995 and 2014?
Slide 5 states that internet users grew from 35MM+ in 1995, at 0.6% population penetration, to 2.8B in 2014, at 39% population penetration. Slide 11 adds that internet user growth was +8% in 2014 versus +10% in 2013.
Details
- Company: Mary Meeker, Kleiner Perkins
- Year: 2015
- Type: Conference talk
- Industry: Venture Capital
- Pages: 197
More from Mary Meeker
- Mary Meeker, Bond conference talk, 2019
- Mary Meeker, Kleiner Perkins conference talk, 2018
- Mary Meeker, Kleiner Perkins conference talk, 2017
- Mary Meeker, Kleiner Perkins conference talk, 2016
All Mary Meeker decks in the library
Review score: 7 out of 10, Effective
Presentation quality, judged with the SlideDeck Co review heuristic. Ask, evidence and idea merit are not rated here.
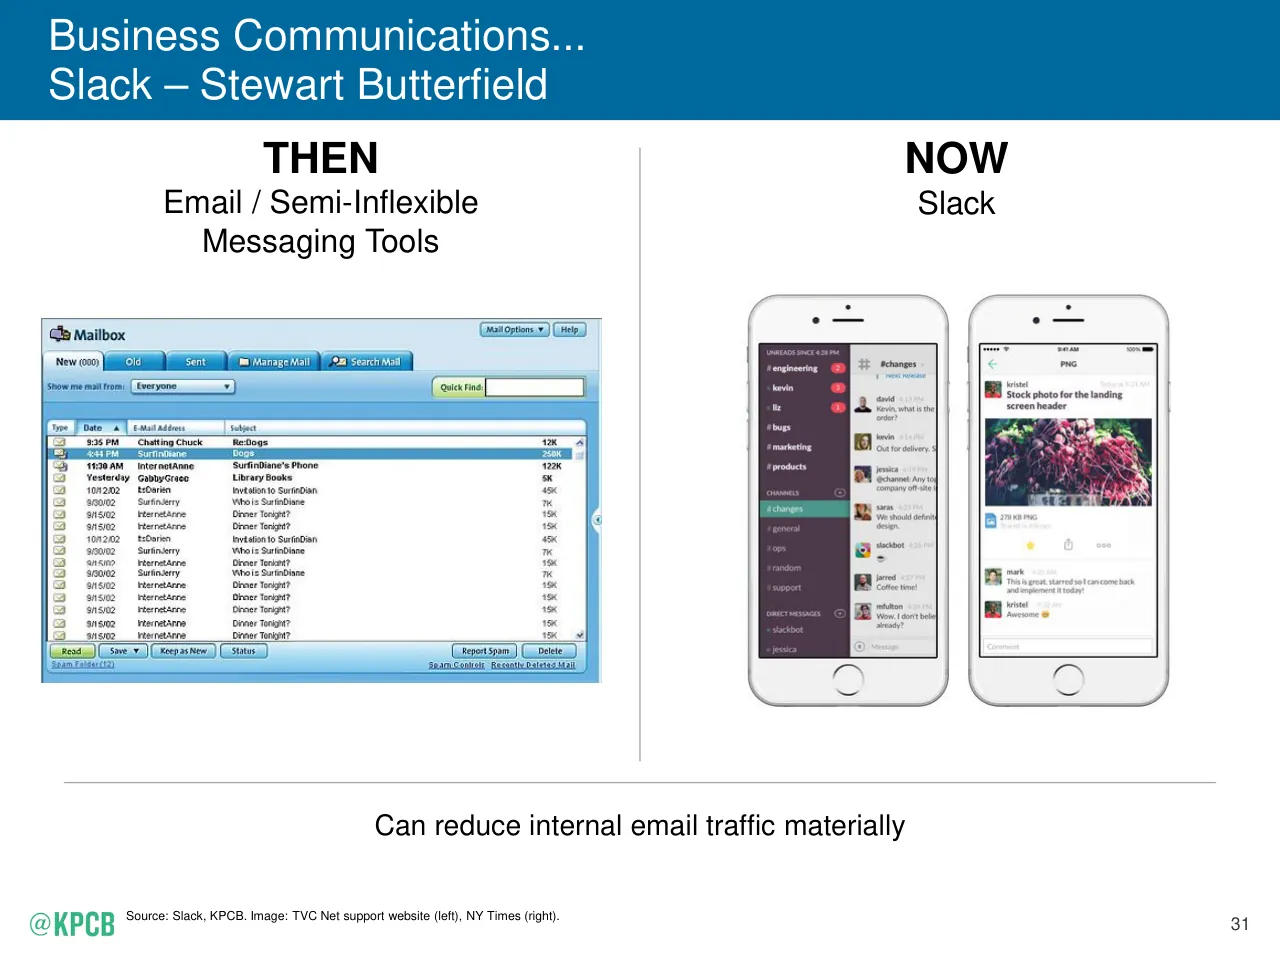
The deck has a clear, consistent system: blue title bars that state the takeaway, a chart or image below, a source line, and a section divider every so often, so the 72 pages I saw are easy to navigate (slides 3, 12, 30). Most charts are readable and well matched to the claim, such as the stacked bars on slides 15 and 25 and the market cap tables on slide 7, and the then-and-now panels on slides 32 to 45 make the enterprise case at a glance. The weaknesses are real: many slides carry tiny footnotes and dense tables (slides 50, 51, 55), some chart labels are small (slide 69), several pages are plain italic text with an empty title bar (slides 20, 23, 27), and the slide 1 and 2 covers do not match the rest of the deck. As a long reading document it works well, but as a spoken presentation it asks a lot of the audience.
Worth keeping: Keep the takeaway-style title bars, the consistent source line, and the then-and-now panel layout with a one-line benefit caption (slide 32).
Most useful repair: Replace the empty blue bars on the statement slides with real headlines or remove them, and enlarge the small table text and footnotes on slides 50, 51 and 55.
What would change the score: I would cut or split the densest comparison tables and trim the long run of near-identical pages so the deck keeps momentum.
Confidence medium. 72 of 197 pages inspected on contact sheets, 4 at readable size. Reviewed 2026-11-08. Model-assisted review (claude-sonnet-5-5).
Full text of the slides (197 slides)
Every slide's words and a description of its charts and images, so the deck can be searched and rebuilt. Also available as Markdown.
Slide 1
()
Internet Trends
2015
Mary Meeker
May 27 @ Code 2015
Visuals: Logo: one mark at top centre, a bold serif glyph resembling an O enclosed in parentheses, filled #A8C0D4, about 5.8% of slide width and 7.6% of slide height. No photographs, charts, icons or other graphics.
Slide 2
INTERNET TRENDS 2015 –
CODE CONFERENCE
Mary Meeker
May 27, 2015
kpcb.com/InternetTrends
KLEINER / PERKINS / CAUFIELD / BYERS
Visuals: One logo: the KPCB lockup in the lower-left, consisting of the bold green sans-serif wordmark 'KPCB' (#33B780) followed by a thin vertical grey divider line and the stacked serif-spaced grey wording 'KLEINER / PERKINS / CAUFIELD / BYERS' (light grey, about #8C8C8C, widely letter-spaced small capitals). The logo is a raster image of 488 by 122 pixels, placed unboxed on the white background. One hyperlink-styled text line (kpcb.com/InternetTrends) is underlined and is treated as text, not a graphic. No photographs, charts or illustrations.
Slide 3
Outline / 1) Internet – Two-Thirds of a Generation In... / 2) Key Internet Trends / 3) Re-Imagining Continues... / 4) America’s Evolving Work Environment... / 5) Big Internet Markets = China / India / 6) Public / Private Company Data / 7) One More Thing... / 8) Ran Outta Time Thoughts / Appendix / @KPCB / KPCB.COM / 2
Visuals: Two logo images and no photographs, charts or diagrams. Bottom-left: a white '@KPCB' wordmark, placed as two overlapping images (120 by 44 px at x1.7 y94.3 and 113 by 40 px at x1.8 y94.3). Bottom-right: a white 'KPCB.COM' wordmark (154 by 45 px at x87.7 y94.4). Also a white horizontal rule under the title, a thin line about 0.3% of the height thick, with no ends or decoration.
Slide 4
INTERNET TRENDS – / TWO-THIRDS OF A GENERATION IN... / TWO-THIRDS OF NEXT GENERATION OUT...
Visuals: Two white wordmark logos: '@KPCB' at bottom left and 'KPCB.COM' at bottom right, set in a bold condensed sans-serif. A thin white horizontal line (rule) spans from about 3.3% to 95.3% of the width at about 17% of the height. No photographs, charts, or diagrams.
Slide 5
Internet Users – 1995 → 2014... / <1% to 39% Population Penetration Globally / 1995 / 35MM+ Internet Users / 0.6% Population Penetration / 2014 / 2.8B Internet Users / 39% Population Penetration / 10% / 21% / 61% 0% 12% 22% 5% / 23% / 19% / 28% / USA / China / Asia (ex. China) / Europe / Rest of World / 4 / Source: Euromonitor, ITU, US Census.
Visuals: Two pie charts. Left chart: pie titled 1995, headline 35MM+ Internet Users, 0.6% Population Penetration. It is drawn very small, about 2.5% of slide width, with leader lines and outside labels: 61% (green USA slice, lower right), 0% (blue China slice, not visible, leader line points down), 12% (pink Asia slice, left), 22% (teal Europe slice, upper left), 5% (yellow Rest of World sliver, top). Right chart: pie titled 2014, headline 2.8B Internet Users, 39% Population Penetration. It is large, about 29% of slide width, centred at about 74.5% x and 57% y, drawn clockwise from 12 o'clock: USA 10% green, China 23% dark blue, Asia (ex. China) 28% pink, Europe 19% teal, Rest of World 21% yellow. Values are printed inside each slice, white on the green, blue, pink and teal slices and black on the yellow slice. Legend below the right chart, left to right: green square USA, dark blue square China, pink square Asia (ex. China), teal square Europe, yellow square Rest of World, all labels bold black. Logo: @KPCB wordmark, raster image 113 by 40 pixels, in green, bottom left, not boxed.
Slide 6
Mobile Phone Users – 1995 → 2014...
1% to 73% Population Penetration Globally
1995
80MM+ Mobile Phone Users
1% Population Penetration
2014
5.2B Mobile Phone Users
73% Population Penetration
40%
60%
Smartphone
Feature Phone
5
Source: Informa, World Cellular Information Service (WCIS). Assumes in 1995, one mobile phone subscription per unique user (no duplication).
Note: In 2014, user base per KPCB estimates based on Morgan Stanley Research and ITU data. Smartphone users & mobile phone users represent unique individuals owning mobile devices; mobile subscribers based on number of connections & may therefore overstate number of mobile users.
Visuals: Two pie charts with no axes. Left (1995): a pie chart showing 1% population penetration; the pie is so small it reads as a single tiny solid blue circle (about 3% wide, about 4% tall) near x 22%, y 51% with no visible slice division or labels. Right (2014): a pie chart titled 2014, 5.2B Mobile Phone Users, 73% Population Penetration. Slices: Smartphone 40% in green #33B780, shown at the top-right of the pie, starting at 12 o'clock and running clockwise; Feature Phone 60% in blue #00689D, the remaining slice. The green slice is slightly pulled out from the blue slice with a thin white gap. Data labels are bold white, printed inside the slices: '40%' at about x 82%, y 50% and '60%' at about x 62%, y 60%. The pie is about 25% of slide width and 43% of slide height, centred near x 67%, y 55%. Legend below the pie: green square then 'Smartphone', blue square then 'Feature Phone', both bold black, with no axes or gridlines. No highlighted points.
Slide 7
Public Internet Company Market Capitalizations – 1995 → 2015...
Top 15 Companies by Market Capitalization = 1995 @ $17 Billion → 2015 @ $2.4 Trillion
Global Public Internet Companies, Ranked by Market Capitalization
As of December, 1995
As of May, 2015
Home Country Market Cap. ($MM) Company (left table header row)
Home Country Market Cap. ($MM) Company (right table header row)
1 Netscape USA $5,415 | 1 Apple USA $763,567
2 Apple USA 3,918 | 2 Google USA 373,437
3 Axel Springer Germany 2,317 | 3 Alibaba China 232,755
4 RentPath USA 1,555 | 4 Facebook USA 226,009
5 Web.com USA 982 | 5 Amazon.com USA 199,139
6 PSINet USA 742 | 6 Tencent China 190,110
7 Netcom On-Line USA 399 | 7 eBay USA 72,549
8 IAC / Interactive USA 326 | 8 Baidu China 71,581
9 Copart USA 325 | 9 Priceline Group USA 62,645
10 Wavo Corporation USA 203 | 10 Salesforce.com USA 49,173
11 iStar Internet Canada 174 | 11 JD.com China 47,711
12 Firefox Communications USA 158 | 12 Yahoo! USA 40,808
13 Storage Computer Corp. USA 95 | 13 Netflix USA 37,700
14 Live Microsystems USA 86 | 14 LinkedIn USA 24,718
15 iLive USA 57 | 15 Twitter USA 23,965
Total Market Cap of Top 15 $16,752 | Total Market Cap of Top 15 $2,415,867
Source: Morgan Stanley, Capital IQ, Bloomberg.
Note: Market capitalizations are as of May 22, 2015 and December 31, 1995, respectively
6
Visuals: Two ranked tables, no charts. LEFT TABLE, titled 'As of December, 1995': columns Rank | Company | Home Country | Market Cap. ($MM). Rows: 1 Netscape, USA, $5,415; 2 Apple, USA, 3,918; 3 Axel Springer, Germany, 2,317; 4 RentPath, USA, 1,555; 5 Web.com, USA, 982; 6 PSINet, USA, 742; 7 Netcom On-Line, USA, 399; 8 IAC / Interactive, USA, 326; 9 Copart, USA, 325; 10 Wavo Corporation, USA, 203; 11 iStar Internet, Canada, 174; 12 Firefox Communications, USA, 158; 13 Storage Computer Corp., USA, 95; 14 Live Microsystems, USA, 86; 15 iLive, USA, 57. Total row: Total Market Cap of Top 15, $16,752. RIGHT TABLE, titled 'As of May, 2015': same columns. Rows: 1 Apple, USA, $763,567; 2 Google, USA, 373,437; 3 Alibaba, China, 232,755; 4 Facebook, USA, 226,009; 5 Amazon.com, USA, 199,139; 6 Tencent, China, 190,110; 7 eBay, USA, 72,549; 8 Baidu, China, 71,581; 9 Priceline Group, USA, 62,645; 10 Salesforce.com, USA, 49,173; 11 JD.com, China, 47,711; 12 Yahoo!, USA, 40,808; 13 Netflix, USA, 37,700; 14 LinkedIn, USA, 24,718; 15 Twitter, USA, 23,965. Total row: Total Market Cap of Top 15, $2,415,867. Values are printed for every cell; no estimates. Grey horizontal rules separate the header and each row. Small white Wingdings arrow glyphs appear in the header title and subtitle. Logo: the green '@KPCB' wordmark bottom left (lowercase @ then bold KPCB in green). No photographs or illustrations.
Slide 8
User Control of Content Up Significantly – 1995 → 2015
Evolution of Content Discovery, 1975 – 2015, per Nielsen
7th gen game console
YouTube
Netflix streaming
Time-shifted viewing
Hulu+
Smart TV
Satellite radio
Tablet
HD DVD & Blu-Ray
Streaming radio
DVR
8th gen game console
1965 1970 1975 1980 1985 1990 1995 2000 2005 2010 2015
VCR
Cable
AOL
DBS Satellite
Yahoo
Broadband
VOD
Apple TV
HDTV
Smartphone
Roku
Amazon Prime Instant Video
Chromecast
7
Source: Nielson, 12/14.
Visuals: One diagram: a horizontal timeline titled 'Evolution of Content Discovery, 1975 – 2015, per Nielsen' (the title is printed as the subtitle above the panel). Axis: a horizontal blue band carrying year labels 1965, 1970, 1975, 1980, 1985, 1990, 1995, 2000, 2005, 2010, 2015 at evenly spaced ticks, with no units. Two thin grey horizontal lines run across the chart, one above the band (about 58% of slide height) and one below (about 64.5%). Above the upper line, small open circles with light blue outlines mark events with vertical light-blue stems to labels: DVR (about 1998), HD DVD & Blu-Ray (about 1999), Satellite radio (about 2002), Time-shifted viewing (about 2003), Facebook (about 2004), 7th gen game console (about 2005), Twitter (about 2006), YouTube (about 2007), Netflix streaming (about 2008), Hulu+ (about 2009), Smart TV (about 2010), Tablet (about 2010), Instagram (about 2010), Streaming radio (about 2011), 8th gen game console (about 2012). Below the lower line, open circles with stems mark: VCR (about 1977), Cable (about 1979), AOL (about 1984), DBS Satellite (about 1992), Yahoo (about 1995), Google (about 1998), Broadband (about 1999), HDTV (about 2002), VOD (about 2006), Apple TV (about 2007), Smartphone (about 2007), Roku (about 2008), Amazon Prime Instant Video (about 2012), Chromecast (about 2013). Events are not connected by arrows. No legend and no highlighted points; all circles and labels are the same style, with no colour coding.
Slide 9
Impact of Internet Has Been Extraordinary & Broad...
But – in Many Ways – It’s Just Beginning
Sector of Economy / Society, USA
Internet Impact, to Date
Consumer
Business
Security / Safety / / Warfare
Education
Healthcare
Government / Regulation / / Policy Thinking
Note: Harvey Balls estimate degree to which Internet has changed behavior / outcomes in selected sectors of economy / society, 4/15.
8
Visuals: A table with two columns and six body rows. Column 1 header is Sector of Economy / Society, USA. Column 2 header is Internet Impact, to Date. Rows in order: Consumer; Business; Security / Safety / Warfare; Education; Healthcare; Government / Regulation / Policy Thinking. Column 2 holds a Harvey ball per row, each a circle about 4.7% of slide width. Consumer: fully filled blue circle, a gradient from about #00B0F0 at top to #0070C0 at bottom, no value printed. Business: about three quarters filled in blue (#00A8E8 to #0070C0 gradient), with the top-left quadrant grey, a light grey #D0D0D0 rim. Security / Safety / Warfare: half filled, the right half blue, the left half grey. Education: about one quarter filled, the top-right quadrant blue, the rest grey. Healthcare: about one quarter filled, the top-right quadrant blue, the rest grey. Government / Regulation / Policy Thinking: about one eighth filled, a wedge from 12 o’clock to about 1:30 in blue, the rest grey. Unfilled portions are light grey gradient #E0E0E0 to #C8C8C8 with a silver rim. Logo: the green wordmark @KPCB, green about #3DB88A, bottom-left.
Slide 10
KEY INTERNET TRENDS
@KPCB
KPCB.COM
Visuals: A thin white horizontal line runs from about x 3.3% to x 95% at about y 17% (straight, solid, roughly 0.3% of slide height thick). Two white wordmark logos sit in the footer: '@KPCB' (an '@' symbol followed by KPCB in a condensed bold sans-serif) at bottom left, and 'KPCB.COM' in the same condensed bold style at bottom right. No photographs, charts or other graphics.
Slide 11
Global Internet User + Smartphone Subscription Growth =
Good, But Growth Rate Continues to Slow*
•
Internet User Growth = Solid, But Slowing
@ 2.8B, +8% in 2014 vs. +10% in 2013, +11% in 2012
Net New User Additions = ~Flat @ ~200MM in 2014 / 2013 / 2012
China Users = +7%, USA = +2%, India = +33%, Japan = Flat, Brazil = +4%
•
Smartphone Subscription Growth = Strong, But Slowing
@ 2.1B, +23% in 2014 vs. +27% in 2013, +65% in 2012
Net New Sub Additions = ~Flat @ ~370MM+ in 2014 / 2013
China Subs = +21%, USA = +9%, India = +55%, Japan = +5%, Brazil = +28%
@KPCB
*Details on Internet Users & Smartphone Subscribers in Appendix.
10
Slide 12
Incremental Internet + Smartphone Users = / Harder to Garner Owing to Phase in Adoption Cycles... / Global Smartphone Subscriptions @ / 76% Penetration of Internet Users / 30% Penetration of Mobile Subscriptions / Global Users / Subscriptions (B) / 8 / 6 / 4 / 2 / 0 / 2010 / 20102 / 2011 / 2012 / 2013 / 2014 / 4.6 / 5.3 / 6.0 / 6.2 / 6.6 / 7.0 / 1.6 / 1.9 / 2.1 / 2.3 / 2.6 / 2.8 / 0.3 / 0.5 / 0.8 / 1.3 / 1.7 / 2.1 / Total Mobile Subscriptions / Internet Users / Smartphone Subscriptions / Source: ITU, Informa. Details on Internet Users & Smartphone Subscribers in Appendix. / 11
Visuals: Clustered column chart. Title: none inside the chart area; the centred subtitle above it reads 'Global Smartphone Subscriptions @ / 76% Penetration of Internet Users / 30% Penetration of Mobile Subscriptions'. Y axis: 'Global Users / Subscriptions (B)' rotated vertically, linear scale 0 to 8 with ticks at 0, 2, 4, 6, 8, dashed dark grey horizontal gridlines at each labelled tick (2, 4, 6, 8). X axis: categories 2010, 20102, 2011, 2012, 2013, 2014 (category label '20102' printed as shown). Series 1 Total Mobile Subscriptions, green #33B780, values 4.6, 5.3, 6.0, 6.2, 6.6, 7.0 (billions, printed above each bar in bold black). Series 2 Internet Users, blue #00689D, values 1.6, 1.9, 2.1, 2.3, 2.6, 2.8 (printed). Series 3 Smartphone Subscriptions, yellow #F6BB00, values 0.3, 0.5, 0.8, 1.3, 1.7, 2.1 (printed). Legend: horizontal row below the axis with square swatches: green Total Mobile Subscriptions, blue Internet Users, yellow Smartphone Subscriptions. No highlighted points. Logo: '@KPCB' wordmark in green #33B780 bottom left, boxed by nothing.
Slide 13
...Incremental Internet + Smartphone Users =
Harder to Garner Owing to Dependence on Developing Markets
Developina Markets Tend to Have Lower
GDP per Capita / Spending Power / Infrastructure
$44K = Average GDP Per Capita...
In 5 Countries with >50MM Population & ~ / >50% Smartphone Sub Penetration...
USA / Japan / Germany / UK / France
$13K = Average GDP Per Capita...
In 16 Countries* with >50MM Population & ~ / < 50% Smartphone Sub Penetration...
China / India / Brazil / Indonesia / Russia / Mexico / Philippines / Thailand / Italy / Turkey /
Nigeria / Vietnam / Egypt / Iran / Pakistan / Myanmar
Source: US Census, Informa. GDP per capita is adjusted for purchasing-power parity, from IMF.
*These 16 countries encompass 3.1B mobile non-smartphone subscriptions, 52% of world’s smartphone subscriptions (27% ex. China), 62% of non-smartphone (feature phone) subscriptions.
12
Visuals: None apart from the header band, which is a solid flat rectangle, and the green '@KPCB' wordmark logo at bottom-left. The logo is a 113 by 40 pixel raster image placed at x 1.8%, y 94.3%, width 7.5%, height 3.5%. It is the text '@KPCB' in a bold rounded sans-serif in green about #3CB878, with the '@' set in a lighter weight, on a white ground with no border.
Slide 14
Global Internet Usage (Data Traffic) Growth Strong =
+21% Y/Y Aided by Mobile + Video
Consumer Internet Traffic, Global =
+21% in 2014 vs. +24% in 2013, +31% in 2012
Consumer Internet Video Traffic, Global =
64% of consumer traffic in 2014 vs. 62% in 2013, 57% in 2012
Mobile Data Traffic, Global =
+69% in 2014 vs. +81% in 2013, +70% in 2012
Mobile Video Traffic, Global =
55% of mobile traffic vs. 52% in 2013, 50% in 2012
Source: Cisco, 2015.
13
Visuals: No charts, tables, photographs or diagrams. One logo: the @KPCB wordmark at bottom-left, in green, with a small at-sign before the letters KPCB in heavy sans-serif capitals. A solid blue header band (#00689D) spans the full slide width behind the title.
Slide 15
Internet Usage (Engagement) Growth Solid / +11% Y/Y = Mobile @ 3 Hours / Day per User vs. <1 Five Years Ago, USA / Time Spent per Adult User per Day with Digital Media, USA, / 2008 – 2015YTD / Mobile / Desktop / Laptop / Other Connected Devices / Hours per Day / 6 / 5 / 4 / 3 / 2 / 1 / 0 / 2.7 / 3.0 / 3.2 / 3.7 / 4.3 / 4.9 / 5.3 / 5.6 / 2.2 / 2.3 / 2.4 / 2.6 / 2.5 / 2.3 / 2.4 / 2.4 / 0.3 / 0.3 / 0.4 / 0.8 / 1.6 / 2.3 / 2.6 / 2.8 / 0.2 / 0.3 / 0.4 / 0.3 / 0.3 / 0.3 / 0.3 / 0.4 / 12% of Total / 80% of Total / 9% of Total / 51% of Total / 42% of Total / 7% of Total / 2008 / 2009 / 2010 / 2011 / 2012 / 2013 / 2014 / 2015YTD / Source: eMarketer 9/14 (2008-2010), eMarketer 4/15 (2011-2015). Note: Other connected devices include OTT and game consoles. Mobile includes smartphone and tablet. Usage includes both / home and work. Ages 18+; time spent with each medium includes all time spent with that medium, regardless of multitasking. / 14
Visuals: Chart: stacked column chart titled Time Spent per Adult User per Day with Digital Media, USA, 2008 – 2015YTD. Y-axis titled Hours per Day, linear, 0 to 6 in steps of 1, dashed horizontal gridlines at each step. X-axis categories 2008, 2009, 2010, 2011, 2012, 2013, 2014, 2015YTD. Three stacked series, bottom to top: Other Connected Devices in yellow #F6BB00, Desktop / Laptop in blue #00689D, Mobile in green #33B780. Printed segment values, Other Connected Devices: 0.2, 0.3, 0.4, 0.3, 0.3, 0.3, 0.3, 0.4. Desktop / Laptop: 2.2, 2.3, 2.4, 2.6, 2.5, 2.3, 2.4, 2.4. Mobile: 0.3, 0.3, 0.4, 0.8, 1.6, 2.3, 2.6, 2.8. Printed bar totals above each column: 2.7, 3.0, 3.2, 3.7, 4.3, 4.9, 5.3, 5.6. Segment values are white bold on the blue and green segments and dark grey on the yellow segments. Right-side and left-side italic annotations give the share of total for the 2008 and 2015YTD bars: 12% of Total and 80% of Total and 9% of Total for 2008; 51% of Total, 42% of Total and 7% of Total for 2015YTD. Legend in upper-left of the plot, with a white backing box, listing Mobile, Desktop / Laptop, Other Connected Devices with coloured square markers. No highlighted points. Logo: @KPCB wordmark in green at bottom left.
Slide 16
Advertising & Monetization = / Mobile Remains Compelling... / Growth Rates for Leaders / Still High But Slowing / 15
Visuals: One filled rectangle forming a top header band in #00689D, spanning the full slide width from the top edge down to about 12.5% of the slide height, with no border or shadow. One small green @KPCB logo (about 7.5% of slide width) at bottom-left. No photographs, charts, diagrams or illustrations.
Slide 17
Remain Optimistic About Mobile Ad Spend Growth... / Print Remains Way Over-Indexed Relative to Time Spent / % of Time Spent in Media vs. % of Advertising Spending, USA, 2014 / Time Spent / Ad Spend / 50% / 40% / 30% / 20% / 10% / 0% / % of Total Media Consumption Time or Advertising Spending / Print / Radio / TV / Internet / Mobile / 4% / 18% / 11% / 11% / 37% / 41% / 24% / 23% / 24% / 8% / Total Internet Ad / Of Which Mobile Ad / = $50B / = $13B / ~$25B+ / Opportunity in USA / Source: Advertising spend based on IAB data for full year 2014. Print includes newspaper and magazine. ~$25B+ opportunity calculated assuming Mobile ad spend share equal its respective time spent share. Time spent share data based on eMarketer 4/14 (adjusted to exclude outdoors / classified media spend). Arrows denote Y/Y shift in percent share. / 16
Visuals: Chart: clustered and stacked column chart titled '% of Time Spent in Media vs. % of Advertising Spending, USA, 2014'. Y-axis title '% of Total Media Consumption Time or Advertising Spending', scale 0% to 50% in 10% steps, dashed dark grey gridlines at each 10% step. X-axis categories Print, Radio, TV, Internet, Mobile. Series 'Time Spent' (yellow #F6BB00) and 'Ad Spend' (blue #00689D) with light-blue #9DDEEF stacked extensions on Internet and Mobile Ad Spend bars. Labelled values: Print Time Spent 4%, Print Ad Spend 18%; Radio Time Spent 11%, Radio Ad Spend 11%; TV Time Spent 37%, TV Ad Spend 41%; Internet Time Spent 24%, Internet Ad Spend 23% (light-blue segment to about 24%); Mobile Time Spent 24%, Mobile Ad Spend 8% (light-blue segment to about 24%). Legend at top centre: yellow square 'Time Spent', blue square 'Ad Spend'. Highlighted points: red dashed ellipse around 'Total Internet Ad = $50B' and 'Of Which Mobile Ad = $13B'; light-blue box '~$25B+ Opportunity in USA' with a thin black arrow pointing left to the Mobile light-blue segment. Twelve light-blue gradient block arrows with pale tan outlines show Y/Y shift: Print Time Spent down, Print Ad Spend down, Radio Time Spent down, Radio Ad Spend up, TV Time Spent down, TV Ad Spend down, Internet Time Spent down, Internet Ad Spend up, Mobile Time Spent up, Mobile Ad Spend up. Logo: green @KPCB wordmark, bottom left.
Slide 18
ARPU (+ MAU) Growth Strong But Slowing for Internet Leaders / Advertising ARPU, Annualized ($), MAUs / Ad ARPU / Annualized ($) / Q1:13 / Q2:13 / Q3:13 / Q4:13 / Q1:14 / Q2:14 / Q3:14 / Q4:14 / Q1:15 / Facebook ($) $4.60 $5.65 $6.14 $7.76 $7.24 $8.26 $8.87 $10.47 $9.36 / Y/Y Growth 15% 32% 39% 51% 57% 46% 44% 35% 29% / MAU (MM) 1,110 1,155 1,189 1,228 1,276 1,317 1,350 1,393 1,441 / Y/Y Growth 23% 21% 18% 16% 15% 14% 14% 13% 13% / Twitter ($) $1.97 $2.22 $2.65 $3.65 $3.55 $4.09 $4.51 $6.00 $5.14 / Y/Y Growth 52% 48% 61% 69% 80% 85% 70% 65% 45% / MAU (MM) 204 218 232 241 255 271 284 288 302 / Y/Y Growth 48% 44% 39% 30% 25% 24% 23% 20% 18% / Source: SEC Filings, Morgan Stanley Research. ARPU = Average Revenue per User, defined as annualized revenue per Monthly Active User (MAU). / 17
Visuals: Table with no chart. Columns: row label column (Ad ARPU / Annualized ($)), then Q1:13, Q2:13, Q3:13, Q4:13, a dashed divider, Q1:14, Q2:14, Q3:14, Q4:14, a dashed divider, Q1:15. Rows: Facebook ($) with values $4.60, $5.65, $6.14, $7.76, $7.24, $8.26, $8.87, $10.47, $9.36; Facebook Y/Y Growth 15%, 32%, 39%, 51%, 57%, 46%, 44%, 35%, 29%; Facebook MAU (MM) 1,110, 1,155, 1,189, 1,228, 1,276, 1,317, 1,350, 1,393, 1,441; MAU Y/Y Growth 23%, 21%, 18%, 16%, 15%, 14%, 14%, 13%, 13%; Twitter ($) $1.97, $2.22, $2.65, $3.65, $3.55, $4.09, $4.51, $6.00, $5.14; Twitter Y/Y Growth 52%, 48%, 61%, 69%, 80%, 85%, 70%, 65%, 45%; Twitter MAU (MM) 204, 218, 232, 241, 255, 271, 284, 288, 302; MAU Y/Y Growth 48%, 44%, 39%, 30%, 25%, 24%, 23%, 20%, 18%. Growth values from Q2:14 onward are in green (#00B050) and the Q1:13 to Q4:13 and Q1:14 values are black. Logo: green @KPCB wordmark, bottom left.
Slide 19
Internet Advertising = Mobile Growing Strongly (+34% Y/Y) =
@ Just 14% of Total While Desktop Decelerating (+11%)
Global Internet Advertising, 2009 – 2014
$59 $70 $85 $100 $117 $133
$150 $125 $100 $75 $50 $25 $0
25% 20% 15% 10% 5% 0%
2009 2010 2011 2012 2013 2014
Global Internet Advertising ($B)
Y/Y Growth
Desktop Advertising
Mobile Advertising
Y/Y Growth
Source: PWC Global Entertainment & Media Outlook.
18
Visuals: Chart: combined stacked column and line chart titled 'Global Internet Advertising, 2009 – 2014'. Left axis titled 'Global Internet Advertising ($B)' runs from $0 to $150 in $25 steps. Right axis titled 'Y/Y Growth' runs from 0% to 25% in 5% steps. Category axis shows 2009, 2010, 2011, 2012, 2013, 2014. Stacked series 'Desktop Advertising' (bottom, blue) and 'Mobile Advertising' (top, red). Printed stack totals: 2009 $59, 2010 $70, 2011 $85, 2012 $100, 2013 $117, 2014 $133. Desktop values are not printed; about $56 (2009), about $67 (2010), about $80 (2011), about $91 (2012), about $103 (2013), about $114 (2014). Mobile values are not printed; about $3 (2009), about $3 (2010), about $5 (2011), about $9 (2012), about $14 (2013), about $19 (2014). Line series 'Y/Y Growth' (green, about 3 px stroke with small markers) on the right axis: no point for 2009; about 19% (2010), about 22.5% (2011), about 17% (2012), about 17.5% (2013), about 13.5% (2014). No points are highlighted. Gridlines are dashed grey horizontals at each $25 step. Legend below the plot: blue square 'Desktop Advertising', red square 'Mobile Advertising', green line 'Y/Y Growth'. Logo: @KPCB green wordmark bottom left.
Slide 20
New Things
Vendors / Brands / Consumers
Should Be Excited About...
19
Slide 21
...Ad Formats = Optimized for Mobile...
Often Fast / Interactive / Fun / Video...
Pinterest Cinematic Pin
Video Moves as User Scrolls
Vessel 5-Second Ad
Short-Form Video
Inspire with the first adaptive mobile ad
GOOD MYTHICAL MORNING
Ad: 4s
Love Your Curls
With NEW Quench Absolute
Try it now
Following
Facebook Carousel Ad
Scroll to Browse Multiple Images
Google Local Inventory Ad
Shows Products Available In-Store Nearby
Neiman Marcus
Sponsored
Picture perfect shoes and handbags that will take your spring look to the next level. Shop our favorites here.
Bucket Bags
Flat Scandals
The Micro Bag
Backpacks
LCD TV
Shop on Google
3.3 mi
£159.99
Argos
In stock nearby at:
Orpington The Walnuts
27 The Walnuts Shopping Centre, Orpington, Greater London
Change shop
Toshiba 32W1333B - 32 LCD TV - 720p
£159.99
Product description
Local inventory ad
Local storefront
@KPCB
Image: Pinterest, Vessel, Facebook, Google.
20
Visuals: Four labelled example ad images, no chart or table. Top-left: Pinterest Cinematic Pin, a photo-composite of a white smartphone mockup (showing a Related Pins grid with a black Ford Mustang photo, a tan car photo and thumbnails) placed in front of a long-exposure night photo of a curving road with streaking red and white tail-light trails; dark blue-black tones, the phone at left-centre, the white overlay text 'Inspire with the first adaptive mobile ad' at right-centre in bold white sans-serif, image full-rectangle, no border, about 34.9% wide. Top-right: Vessel 5-Second Ad, a phone screenshot in a black status bar showing 10:35 AM, Verizon, 81% battery, a black app header 'GOOD MYTHICAL MORNING' with hamburger icon, and a grey-white product banner with Dove and Quench hair product bottles and a jar, bronze-pink circular backdrop, text 'Love Your Curls / With NEW Quench Absolute' and a blue 'Try it now' button; bottom black bar with share icon, heart 67, comment 13 and a blue checkmark 'Following' button. A green oval outline (#00B050, about 2pt stroke) with a grey translucent 'Ad: 4s' label sits over the top-left of the screenshot; four small 97 by 53 px image tiles lie at the same spot forming this callout. Bottom-left: Facebook Carousel Ad, a white phone mockup at left showing a sponsored Neiman Marcus post in blue Facebook header, with a light blue-grey (#D6E0EA) carousel strip to the right of five product cards (navy bucket bag, brown and multicolour sandals, pink and multicolour handbags, white backpack) on grey backgrounds; the strip is cropped at the bottom edge and the phone overlaps the strip. Bottom-right: Google Local Inventory Ad, two black Android-style phones side by side; the left phone shows a Google search for LCD TV with a blue-ringed magnifier circle containing 'Shop on Google', a small TV picture, '3.3 mi' and '£159.99' with Argos; the right phone shows an Argos storefront with a TV image and a second blue magnifier circle reading 'In stock nearby at:' and the store address. Both phones are white-screened with black bezels, photographed straight on, lit evenly; blue (#3B7DDD) circle outlines and blue captions 'Local inventory ad' and 'Local storefront' below. Small logo: green KPCB wordmark with an @ sign at bottom-left.
Slide 22
...Buy Buttons = Optimized for Mobile... / Minimize Friction to Purchase @ Moment of Interest
21
Images: Twitter, Facebook, Google.
Visuals: Three mobile screenshots, left to right. (1) Twitter: an iPhone-style tweet from Maroon 5 (@maroon5) reading 'West Coast! Here's an exclusive for our Twitter fans. 1 night only. Shirt, vinyl + #ThisSummerM5 download! #BBMAs', with a product image of a white T-shirt with a circular black graphic, a pink-and-blue 'V' vinyl sleeve and a black record, the caption 'Maroon 5 T-Shirt + "This Summer" Download + Special "V" Vinyl', 'US $39.95 • Maroon 5', '5/17/15, 8:00 PM', '603 RETWEETS 1,518 FAVORITES', and a small blue 'Buy' button outlined in red at the right. Blue #1DA1F2 header bar, white background. (2) Facebook: an iPhone-style sponsored post from Modify Watches, 'Show your colors this summer with one of Modify's best-selling watches. Save $10!', a photo of a mint-green square-cased watch with a multicoloured chevron strap on a colour swatch background, the product 'Rainbow Chevron Watch', '$35.00 was $45.00', '73 likes 9 comments', and a 'Buy' button with a red outline at lower right. Dark blue #3B5998 status and navigation bars. (3) Google: an Android-style 'Review Booking' screen for 'Modern family flat near CPH City' (Airbnb), with two pink-topped calendar tiles 'Check In 10 FEBRUARY' and 'Check Out 16 FEBRUARY', a 'GUESTS 1' field, a 'PRICE $1,270' field, grey fine print 'By tapping the 'Confirm & Pay' button, you indicate that you have read and agree to the Cancellation Policies and House Rules as outlined above.', and a blue 'Buy with Google' button with the Google multicolour G, outlined by a red ellipse. Light grey and white screen.
Slide 23
...Something Funny
Happened on the Way to the
Small Screen...
@KPCB
22
Visuals: Two non-text elements. (1) A flat, full-width rectangular header band filled #00689D (cerulean blue) across the top 12.5% of the slide, with no border, shadow or gradient. (2) The @KPCB logo at bottom-left: a green wordmark with a small italic '@' followed by the bold condensed capitals 'KPCB', in mint green about #3DB88A, placed as a 113 by 40 pixel image with no crop. No photographs, charts, tables or diagrams.
Slide 24
...Small Screen Vertical Viewing Became Big Deal...
Video = Then
Video = Now?
Image: Samsung (left), Snapchat (right).
23
Visuals: Two photographs. Left: a flat-panel television, front view, Samsung branded, with a black glossy screen showing no picture, a thin silver bezel, a central silver stand and a black glass base with a green-tinted edge; the TV is shown fully, unboxed, centred in its column on a white background, with a soft diagonal reflection across the upper-left of the screen. Right: a vertical smartphone-style screenshot (Snapchat) of a basketball court with a crowd in the background, a player dribbling a ball on a yellow-and-gold court, the overlaid blue text 'Curry Handles' and a gold banner reading 'Dub Nation' with an NBA logo; a small circular counter badge reading '106' sits at the top right of the frame; the image has a thin black border and is unshaded. Logo: @KPCB green wordmark bottom-left. Lighting is even and bright; dominant colours are black, gold, yellow and blue.
Slide 25
...Vertical Viewing =
29% of View Time (Multi-Platform) vs. 5% Five Years Ago, USA...
Time Spent on Screens by Orientation (Hours / Day), USA, 2010 – 2015
Mobile
Desktop / Laptop
Other Connected Devices
TV
12
9
6
3
0
Hours per Day
7.6 8.2 9.0 9.4 9.6 9.9
2.4 2.6 2.5 2.3 2.4 2.4 0.4 0.8 1.6 2.3 2.6 2.8
0.4 0.3 0.3 0.3 0.3 0.4
4.4 4.6 4.6 4.5 4.4 4.3
2010 2011 2012 2013 2014 2015
Vertical screens (29%)
Horizontal screens (71%)
24
Source: eMarketer 4/15, Coatue analysis. Note: Other connected devices include OTT and game consoles. Mobile includes smartphone and tablet. Usage includes both home and work. Ages 18+;
time spent with each medium includes all time spent with that medium, regardless of multitasking; for example, 1 hour of multitasking on desktop/laptop while watching TV is counted as 1 hour for TV
and 1 hour for desktop/laptop.
Visuals: Stacked column chart titled Time Spent on Screens by Orientation (Hours / Day), USA, 2010 – 2015. Y-axis titled Hours per Day, linear 0 to 12, gridlines dashed grey at 3, 6, 9 and 12 with tick labels 0, 3, 6, 9, 12. X-axis categories 2010, 2011, 2012, 2013, 2014, 2015. Stacks from bottom to top: TV (pink #CF3B6A) values 4.4, 4.6, 4.6, 4.5, 4.4, 4.3; Other Connected Devices (yellow #F6BB00) values 0.4, 0.3, 0.3, 0.3, 0.3, 0.4; Desktop / Laptop (blue #00689D) values 2.4, 2.6, 2.5, 2.3, 2.4, 2.4; Mobile (green #33B780) values 0.4, 0.8, 1.6, 2.3, 2.6, 2.8. Total labels above each column in black bold: 7.6, 8.2, 9.0, 9.4, 9.6, 9.9. Segment values are printed in white bold inside TV, Desktop and Mobile segments and in black bold inside the yellow segments. Legend at upper left, top to bottom Mobile, Desktop / Laptop, Other Connected Devices, TV, with square swatches. A red curly brace at the right spans the top of the stack (about 7.0 to 10 hours) labelled Vertical screens (29%) in red. A blue curly brace spans the bottom (0 to about 7 hours) labelled Horizontal screens (71%) in blue #0070C0. Columns are flat with no outlines, no shadows, no gradients. A white rectangle behind the legend masks the 12 gridline where it would cross the legend.
Slide 26
...Full-Screen Vertical Video Ads on Snapchat =
9x Higher Completion Rate vs. Horizontal Mobile Video Ads
AT&T LTE 7:13 PM 95%
My Friends
RECENT UPDATES
[blurred name]
[blurred name]
50 minutes ago - Tap to load
[blurred name]
Ouija
Sponsored
[blurred name]
2 hours ago - Tap to load
[blurred name]
2 hours ago - Tap to load
[blurred name]
2 hours ago - Tap to load
[blurred name]
2 hours ago - Tap to load
A B C D E F G H I J K L M N O P Q R S T U V W X Y Z #
9
1
OUIJA
FRIDAY
Source: Snapchat. Completion rate compared against industry standard horizontal ads, as measured by Nielsen. Image: Sprinkr blog, news sources.
25
Visuals: Three portrait images in a row. Left: an iOS screenshot of the Snapchat My Friends screen showing status bar AT&T LTE 7:13 PM 95 percent battery, a purple header bar with a camera icon, the title My Friends and an add-friend icon, a RECENT UPDATES label in purple caps, a list of blurred friend names with circular avatars, timestamps 50 minutes ago and 2 hours ago with Tap to load, a highlighted sponsored row for Ouija with a purple-outlined circular avatar showing a planchette-style board image and the word Sponsored, and a vertical A to Z index with search and add-friend icons at the right edge. Middle: a full-bleed vertical video frame of hands resting on a Ouija board in a dark blue tinted scene, viewed from above, with fingers on a triangular planchette and a person's head at the bottom; a white outlined circle badge with the number 9 sits at the top right. Right: a vertical video frame with a solid black background, the word OUIJA in large gold metallic serif capitals across the middle, the word FRIDAY in smaller light serif capitals below it, a warm orange-brown glow at the horizon line, and a white outlined circle badge with the number 1 at the top right. All three images are boxed with thin light grey borders and no rounded corners; none is cropped in its frame.
Slide 27
Mobile Usage Evolved Rapidly...
Text → Images → Videos →
All of Above...
Buy Buttons Likely to
Appear Just as Seamlessly
26
@KPCB
Slide 28
RE-IMAGINING CONTINUES
Slide 29
Re-Imagining / Enterprise Computing = / Changing Business Process / One Segment at a Time / 28
Visuals: A red hand-drawn style ellipse with a thin red diagonal cross-strike (an X drawn through the word 'Enterprise') overlapping the word 'Enterprise' on the second line; the ellipse is about 36% of slide width wide and sits centred on the word 'Enterprise', with its left edge just left of the word and its right edge just past the word's end. The cross-strike lines run from upper-left to lower-right and upper-right to lower-left through the word. Logo: the '@KPCB' wordmark in green, bottom-left.
Slide 30
Tweet from Aaron Levie...
Aaron Levie
@levie
Following
Enterprise software used to be about making existing work more efficient. Now, the opportunity for software is to transform the work itself.
RETWEETS
252
FAVORITES
214
9:42 PM - 9 Apr 2015
@KPCB
29
Visuals: One illustration: a screenshot of a Twitter-style tweet card, boxed inside a white rectangle with a soft grey drop shadow, not cropped and not full-bleed. Top row: a square profile photo (rounded corners) of a man with short dark hair, dark background, head-and-shoulders, neutral expression, of Aaron Levie; name 'Aaron Levie' in bold dark grey with a blue verified badge; handle '@levie' in light grey; a grey gear icon at right; a solid blue rounded button labelled 'Following' in white bold text. Body: large dark grey (#292F33) sans-serif tweet text in four lines. Below: a row of four grey action icons (reply arrow, retweet arrows, star, add-user with check mark in blue, and an ellipsis of three dots). Stats row: 'RETWEETS' label in small grey caps over blue '252', 'FAVORITES' label over blue '214', a thin vertical grey divider, then a row of nine small square avatar photos of different people (about 3% of slide width each) with a thin light grey rule beneath. Timestamp '9:42 PM - 9 Apr 2015' in small grey text. Lighting is flat screen lighting; the palette is white, grey, Twitter blue and the blue-tinted accent. No photographs beyond the avatars.
Slide 31
While Consumer Internet Entrepreneurs / Often Pursue / Personal Passion... / (blank line) / ‘Enterprise’ Internet Entrepreneurs / Often Pursue / Prior Company Pain Points / @KPCB / 30
Slide 32
Business Communications...
Slack – Stewart Butterfield
THEN
Email / Semi-Inflexible
Messaging Tools
NOW
Slack
Can reduce internal email traffic materially
Source: Slack, KPCB. Image: TVC Net support website (left), NY Times (right).
@KPCB
31
Visuals: Left: a screenshot of a desktop email client titled 'Mailbox' with a blue-grey window frame. Top row has tabs 'New (000)' (selected, white), 'Old', 'Sent', 'Manage Mail' and 'Search Mail', with 'Mail Options' and 'Help' buttons at top right. Below is 'Show me mail from: Everyone' dropdown and a 'Quick Find:' field. Table columns: Type, Date, E-Mail Address, Subject, size. Rows (top to bottom): 9:35 PM, Chatting Chuck, Re:Dogs, 12K; 4:44 PM (highlighted row in blue), SurfinDiane, Dogs, 250K; 11:30 AM, InternetAnne, SurfinDiane's Phone, 122K; Yesterday, GabbyGreg, Library Books, 5K; 10/12/02, tsDarien, Invitation to SurfinDarien, 45K; 9/30/02, SurfinJerry, Who is SurfinDiane, 7K; 9/15/02, InternetAnne, Dinner Tonight?, 15K; 10/12/02, tsDarien, Invitation to SurfinDarien, 45K; 9/30/02, SurfinJerry, Who is SurfinDiane, 7K; 9/30/02, InternetAnne, Dinner Tonight?, 15K; 9/30/02, SurfinJerry, Who is SurfinDiane, 7K; then further rows of InternetAnne, Dinner Tonight?, 15K, cut off at the bottom edge. Bottom button bar: Read, Save, Keep as New, Status, Report Spam, Delete; links 'Spam Folder (12)', 'Spam Controls', 'Recently Deleted Mail'. Dominant colours are light blue and white with a blue selected row. Image is boxed, not full-bleed, with a hard rectangular edge. Right: two white smartphone mockups side by side, each with a black bezel, speaker slot and round home button, shown upright and fully visible. Left phone shows the Slack sidebar on dark aubergine (about #4D394B): 'UNREADS SINCE 4:28 PM', unread channels 'engineering' (2), 'kevin' (3), 'liz' (1), 'bugs', 'marketing', 'products'; 'CHANNELS' heading with selected green row 'changes' (about #3EB489) and then 'general', 'ops', 'random', 'support'; 'DIRECT MESSAGES' with 'slackbot' and 'jessica'. Beside the sidebar is the '#changes' message list with avatars and messages from david, kevin, jessica, saras, slackbot, jarred and mfulton, and a Message input at the bottom. Right phone shows a file view titled 'PNG' from kristel: 'Stock photo for the landing screen header', a photograph of red-purple radishes or beets with stems filling the frame, a '278 KB PNG' file row, star and share icons, and replies from mark ('This is great, starred so I can come back and implement it today!') and kristel ('Awesome'), with a Comment field at the bottom. Logo: the green KPCB wordmark with an @ symbol at bottom left. No other photographs.
Slide 33
Offline Payments... / Square – Jack Dorsey / Jim McKelvey / THEN / Difficult to Set Up / Process Offline Payments / NOW / Square / Allows merchants to accept credit card payments via their existing / smartphone or tablet & run a sophisticated point of sale system / @KPCB / Source: Square. Image: Square (left and right). / 32
Visuals: Left: a photograph of a grey/beige electronic cash register (ROYAL brand, model shown on its display panel) viewed from above and slightly in front, on a wood-grain table. It shows a two-line LCD window with green display, two paper receipt rolls, a customer display pole, a keyboard with many coloured keys (grey, blue, green, red, purple), a cash drawer at the bottom, and a key lock at the right. Lighting is even and diffuse, dominant colours grey, beige and brown wood. The photo is a boxed rectangle, not cropped, not full-bleed, no overlay. Right: a composite of four Square product images on white. Top left: a blue Square card with a white square card reader plugged into the bottom of a silver smartphone whose screen reads Charge $0.00 (partly legible). Top right: a white Square stand holding a black-bezelled tablet showing a grid of item thumbnails and an order list, with a blue Charge button. Bottom left: a black smartphone showing a payment chat with Justin Keller: $100 Request for Tahoe, $100 for Tahoe (green bubble), $25 for tickets, $35 for dinner (green bubble), with REQUEST and SEND buttons at the bottom in green. Bottom right: a laptop-style browser window with address bar cash.me/$noblephoto, a green page with the Noble Photography profile, a large white $35 figure, and a bottom bar with a Debit Card Number field, expiry and CVC fields, and a green SEND $35 button. A thin grey horizontal line runs under the top two right-hand images, from about 57% to 92% width at about 52% height. A thin vertical grey divider separates the columns.
Slide 34
Online Payments...
Stripe – Patrick Collison / John Collison
THEN
Difficult to Set Up / Process Online Payments
seller
gateway / processor / ISOs / merchant acquirer / credit card networks / issuing banks
american express
alternative payment methods (Bitcoin, Alipay)
fraud prevention
reporting
PCI audits
international expansion
NOW
Stripe
Stripe / Alipay flow
Kickstarter / payment flow
Can dramatically reduce payment integration time for developers and allow them to take advantage of modern APIs, compared with time required to deploy traditional merchant account
@KPCB
Source: Stripe, 5/15. Image: Stripe (left and right).
33
Visuals: Two visuals. (1) Left, a stacked architecture diagram placed as an image (x 9.0%, y 29.1%, w 32.0%, h 50.3%): a tall vertical light-grey rounded bar labelled 'Seller' running down the left edge; to its right a pale blue-grey (#BFD3E2) rectangular panel containing, top to bottom, five vertical silver-grey gradient bars labelled 'gateway / processor', 'ISOs', 'merchant acquirer', 'credit card networks' and 'issuing banks' (text rotated 90 degrees, reading upward), then a light grey gradient bar 'american express', a green bar (#2E9E4F) 'alternative payment methods (Bitcoin, Alipay)', three navy bars (#0A1F5C) 'fraud prevention', 'reporting' and 'PCI audits', and a muted purple bar (#6E5A8A) 'international expansion'. The bars are stacked with equal gaps and no arrows. (2) Right, two smartphone mockups in white bezels with rounded corners. Left phone (Stripe Alipay flow, screen x 59.9%, y 31.4%, w 14.9%, h 34.8%): status bar reading 4:21 PM, address bar 'humblebundle.com', dark slate header (#2F3B47) reading 'Humble Bundle / Indie Bundle 12' with a round logo at right; tabs 'Card', 'Alipay' (selected, white tab) and 'Bitcoin'; fields 'User ID [email protected]', 'Enter the code sent to 135 •••• 4814:' with two boxed code segments separated by a dash, and 'ID Card Last 5 digits of ID card'; a bright blue (#3EA7E8) full-width button 'Pay ¥200' with a check mark; blue browser toolbar icons at the bottom. Right phone (Kickstarter payment flow, frame x 78.1%, y 26.7%, w 16.4%, h 44.0%): status bar reading 9:22 AM with Verizon, green 'Cancel', 'Back this project', green 'Next'; brown photo banner titled 'Houseworld by Andrew Hoopfner'; 'Select a reward' heading; reward options 'No reward' (I just want to help the project. Any amount of $1 or more), a selected light green (#D9F7E3) block '$10' with green 'Next' button, 'Pledge $10 or more' and 'Listed as a funder on our website, Houseworld.nyc, Est. delivery Jun 2015', and 'Pledge $25 or more' with 'A Houseworld polaroid from The...'. Both phones are shown upright, flat, front-on, full screen with no cropping of the frame, lit evenly with soft grey shadows. Also a thin dark grey vertical divider line at x 50% and a thin grey horizontal rule at y 81%.
Slide 35
Business Analytics...
Domo – Josh James
THEN
Data Overload Without
Easy Access for Execs
NOW
Domo
Improved access to real-time data can help users save time
& improve decision making
@KPCB
Source: Domo. Image: Omvana (left), Domo (right).
34
Visuals: Left: a photograph of a man in a white shirt, dark trousers and black belt, seen from behind with both hands clasped on his head, standing in front of a dark grey chalkboard covered in white chalk doodles (an airplane, hot-air balloon, sun, cloud, envelopes, a clock, pie charts, bar and line charts, skyscrapers, trees, arrows, a padlock, a pencil cup). The floor is a grey concrete surface. Framing is a medium-wide shot, centred, not cropped, displayed as a rectangular boxed image with no overlay; dominant colours are charcoal grey, white and black. Right: a laptop mockup with a dark grey bezel and light grey base, showing a Domo dashboard titled Competitive Momentum. The screen shows a donut chart labelled Virtucon with the centre value 443 DEALS, segments in salmon red (large) and teal green (small). Beside it is a stacked area chart titled Competitive Timeline in pink, red and green tones, with tabs Related Deals and Related Reps. On the right edge is a DomoTalk activity feed with user avatars and comments. Screen UI is white and light grey with a dark grey top navigation bar and orange and blue Domo logos. No axes or legend values are legible at this size. Logo: @KPCB in green wordmark bottom left. Divider: thin grey vertical line. Horizontal grey rule across the lower section.
Slide 36
Document Signing / Transaction Management... / DocuSign – Tom Gonser / THEN / Paper-Based Signatures / NOW / DocuSign / Can reduce transaction costs & improve transaction times / Source: DocuSign. Image: Good Marketplace (left), PaperlessChase.com (right). / 35
Visuals: Two photographs and one device composite, no chart or table. Left photograph: a close-up of a hand holding a black and gold fountain pen, signing a printed financial sheet with a blue ink signature; the sheet shows columns of numbers including 74,727.8, 71,536.3, 3,156.8, 629.1, 1,083.1 and 75,804.7, a printed '79' at right, and the page is white/pale grey with warm skin tones on the hand. The shallow depth of field blurs the foreground fingers and background, and the photo is a plain rectangle (not full-bleed, not cropped to a shape, no overlay or tint). Right composite: a black iPad in landscape, with a dark bezel and a blue app bar showing Sales Contract (1), a status bar reading 3:30 PM, and a toolbar with Drag & Drop onto Document, Signature, Initial, My Name, Date Signed, Text and Company buttons. The iPad screen displays a Device Install Sheet document with a blue header reading Device Install Sheet and Med Device International logo (a blue-and-white node mark with the words Med Device International), and a bulleted Device Checklist (Read and understand, Equipment required for the transaction in good working condition, Startup/shutdown procedures, Cleaning, exterior and optics Patient alignment and head position, Seating and table requirements, Exam flow and purpose of steps). Over the document is a Draw Your Signature dialog with a blue Cancel and Adopt button, a white signing pad with blue handwritten Tom Wood signature on a dashed line, pen tools, and black, blue and red colour swatches, plus a small line of fine print. Behind and to the right of the iPad a black smartphone is partly hidden, showing a blue and yellow screen edge. The composite has a soft grey floor shadow under the tablet. The logo at bottom left is the green @KPCB wordmark.
Slide 37
Customer Communication... / Intercom – Eoghan McCabe / THEN / Disconnected Point Solutions / NOW / Intercom / YOUR APP / HELPDESK / LIVE CHAT / MARKETING AUTOMATION / CRM / EMAIL MARKETING / In-app messages can be more engaging (based on reply rates) / than traditional email marketing products / Source: Intercom. Image: Intercom (left and right). / @KPCB / 36
Visuals: Left (THEN): a network diagram, about 688 by 600 px, showing a hub-and-spoke style set of connected nodes. There are five message-window icons, each a rounded rectangle with three dots at top and three horizontal text lines. YOUR APP is a yellow-green (#D4D92E) icon at top centre with its label above it. HELPDESK is a purple (#7B68B8) icon at upper right with its label above. LIVE CHAT is a red-orange (#E05A3A) icon at left with its label to the left. MARKETING AUTOMATION is a grey-teal (#7C918E) icon at centre with its label above. CRM is a green (#3DB574) icon at lower left-centre with its label above. EMAIL MARKETING is an orange (#F2A93B) icon at lower right with its label to the right. Each icon is linked by double-headed black curved arrows to one or more person nodes: dark navy (#243247) filled circles with a white person silhouette, and light blue (#CDE8F7) filled circles with a navy silhouette. There are about 14 person nodes in total, with dark nodes near the outer icons and light nodes between them. Arrows connect nodes in a loop around the icons, with no legend and no highlighted points. Right (NOW): a product screenshot, about 588 by 375 px, of the Intercom desktop web app on a white background, with a dark-bordered window frame and a blue top navigation bar (#0B6DB0) showing People (2,498), Companies (345), Conversations (3,146), Manual and Auto tabs. The left sidebar is light grey (#F2F4F6) with USER DATA filters (NAME, EMAIL, USER ID, SIGNED UP, LAST SEEN) and radio buttons for RELATIVE (more than, exactly, less than 30 days ago) and ABSOLUTE (after, on, before), plus blue buttons Save Segment... and Auto Message.... The main table header reads 372 / 839 users with columns NAME and EMAIL, and rows include Tom Bacon at Book (tom@book...), Claire Holmes at TRP (claire@trp...), Kelvin Diaz at Hub (kelvin@hub...), Dave Concannon at Hosted and 1 other (dave@grap...), Leah Schuster at Donate (leah@50...), César Sepúlveda at Canal 13 Inte... and 2 others (cesar@mec...), Alex von Oech at Lay ([email protected]), Anna Huston at Vestor (anna@vest...), Tom Barclay at Rosemary Co... (tom.barclay...), Casey at Scratch (casey@trys...), Austin Campbell at Sellbrite (acampbell...). Overlaid at lower right is a black smartphone mockup, about 1.2 times the height of the phone frame, showing a conversation with Janed Abbott at the top, a grey message from Matt Hodges asking to look at a trial, and a blue outgoing message reading Hi Janet, It looks like you have reached the limit for teammates on your current plan. You'll need to upgrade to add more collaborators. To do so, simply click Upgrade in your ProjectMap settings. Cheers, Matt. with a Write a reply... field below. Lighting is flat with no shadows; the screenshot is full-colour and not cropped, sitting on white with the phone overlapping its right edge.
Slide 38
Customer Success...
Gainsight – Nick Mehta
THEN
Transactional Sales / Process with High Churn
NOW
Gainsight
Typically improves net revenue retention
37
Source: Gainsight. Image: Salesforce (left), Gainsight (right).
Visuals: Two illustrations and one logo. Left: a circular composition (about 28.8% by 38% of the slide) of a cartoon businessman in a dark charcoal suit, white shirt and bright blue tie, standing with arms outstretched in a multi-armed pose, with brown hair and brown shoes. He is surrounded by a ring of small flat icons: a wall clock at top, a clipboard with green lines upper left, a dark grey coffee mug upper right, a calendar showing 25 at right, a smartphone with a green rising-line chart at lower left, a tablet/monitor with a bar chart and magnifier at lower right, a blue sneaker at the bottom, plus thin blue arcs, dotted network diagrams and small circles and dots. The circle sits on a very light grey grid-textured background, and the illustration is not boxed. Right: two smartphone mockups, the front one in white with a grey outline showing the Gainsight app: status bar reading AT&T, 9:35 AM, 97% battery; blue header with the word Gainsight and a bell icon; a back arrow, the customer name Abbett and a blue Save All button. Below are five rows: a red Overall tile showing 48 beside a grey speech bubble reading Abbett has made tremendous strides with our product, increasing their usage by 25% year over year. They've seen a 20% increase in their; a green Sponsor tile 76 with a slider marked 76 in a green circle; a red Support tile 48 with slider marked 48 in a red circle; a yellow Engagement tile 58 with slider marked 58 in a yellow circle; a red Usage tile 49 with slider marked 49 in a red circle. A second, partly hidden phone sits behind on the right showing a Record panel, an Engagement panel with 2 Weeks selector, a navy line chart with Sep '14 and Oct '14 axis labels, Karl Jones and integration Act... rows. Both phones have a home button and a faint reflection beneath. Logo: the @KPCB mark in bold green letters at bottom-left.
Slides 39 to 197 continue in the full text file.
Download this deck
The hosted PDF of every library deck is free for readers of the SlideDeck Co newsletter. Join with your email and the viewer and download appear here.
Building a deck of your own? The SlideDeck Co Standard Deck is a slide library for business presentations: reviews, updates and plans.







