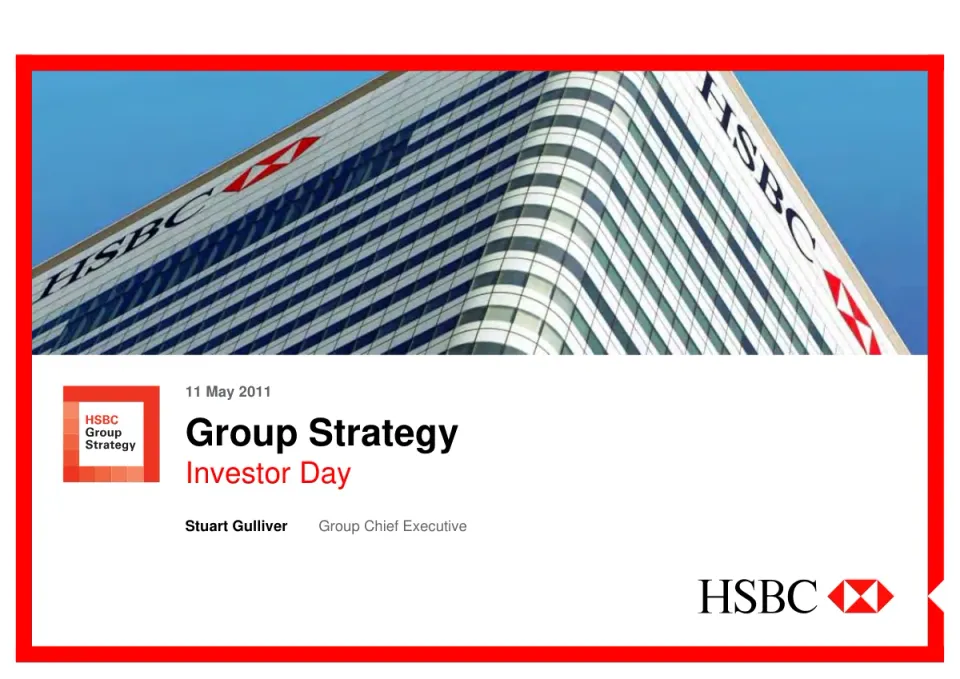
The deck is the Group Strategy Investor Day presentation given by HSBC Group Chief Executive Stuart Gulliver on 11 May 2011. It opens with a title slide, a forward-looking statements disclaimer, and a heritage and business model section that includes a total shareholder return chart. The main body is built around three repeated pillars: a distinctive position aligned with global trade and wealth trends, a clear strategy and execution focus covering capital deployment, cost efficiency and regional plans, and an experienced management team. Regional sections cover North America, Latin America, Europe, Middle East and North Africa, and Asia, each with 2010 profit, cost efficiency, risk weighted asset and return figures. The deck closes with a summary slide, a report card on execution progress, and appendices on basis of preparation and acronyms. Slides worth studying include the trade and capital flow charts on slide 6, the GDP shift on slide 8, the five-filter framework on slide 15, and the report card on slide 29, where dense data is reduced to a three-column scorecard.
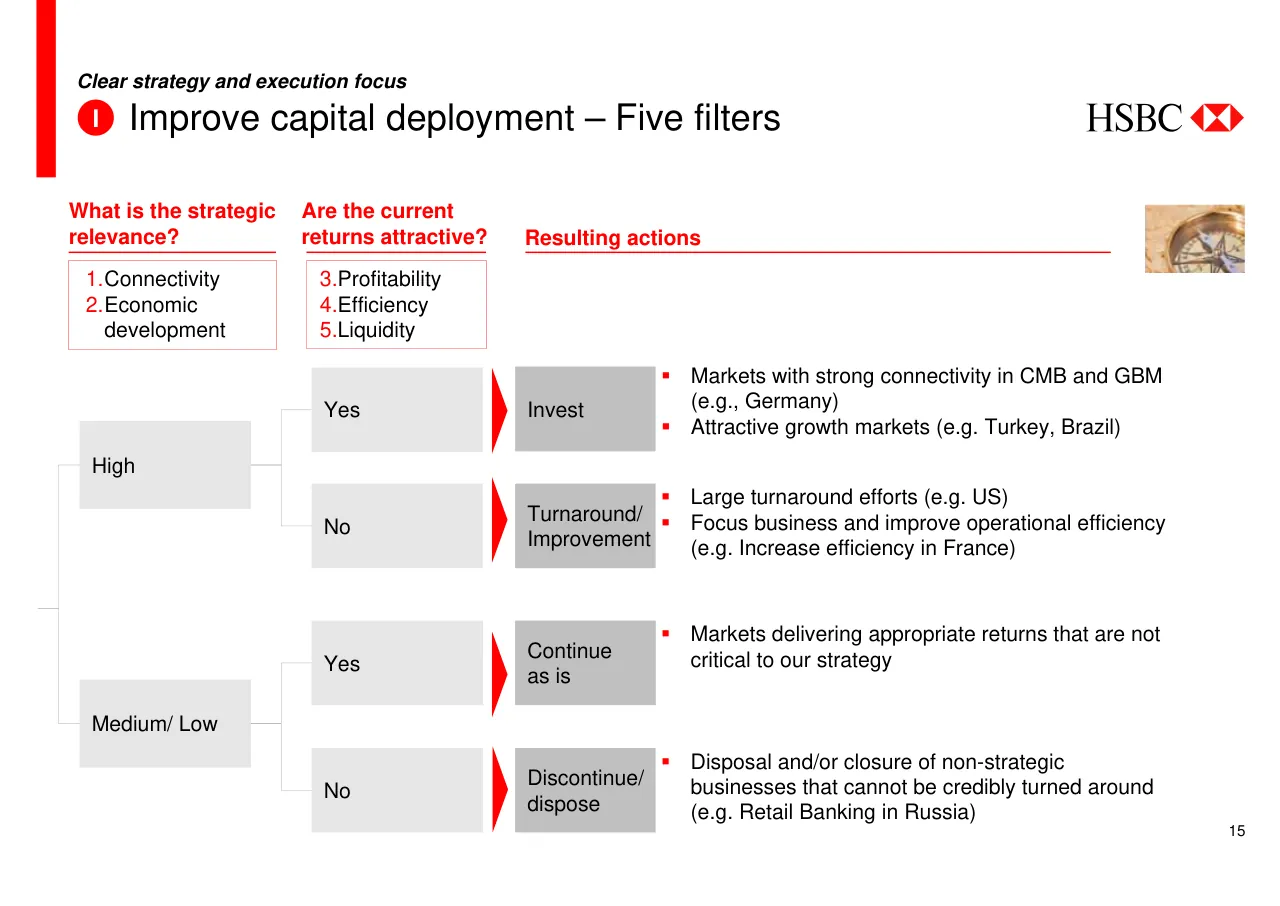
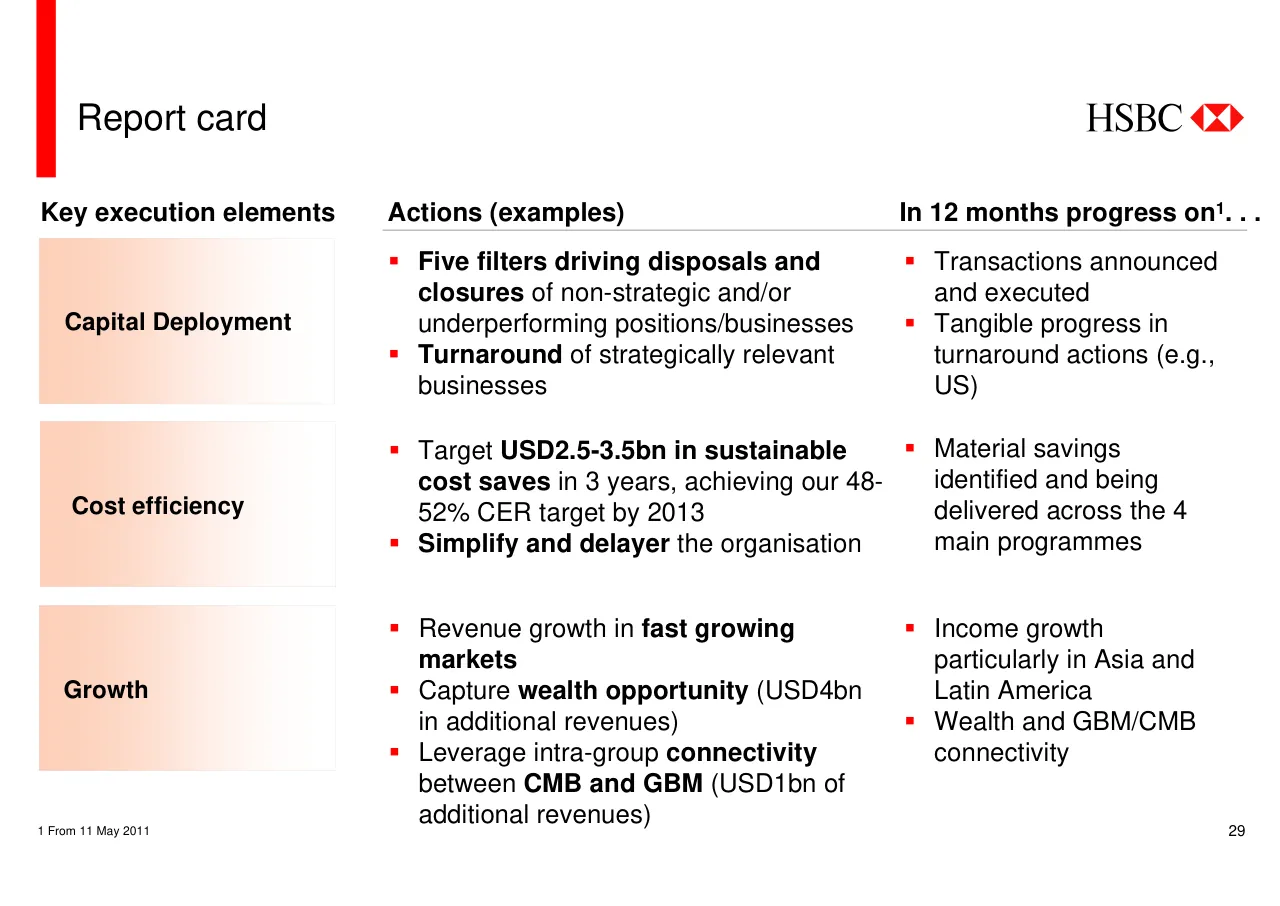
Slides worth studying
Questions about this deck
How many slides does the HSBC Group Strategy Investor Day deck have?
The deck has 32 pages in total, and its opening title slide is slide 1. The closing report card on slide 29 is followed by appendices on basis of preparation and acronyms.
What does the HSBC strategy deck say about trade growth?
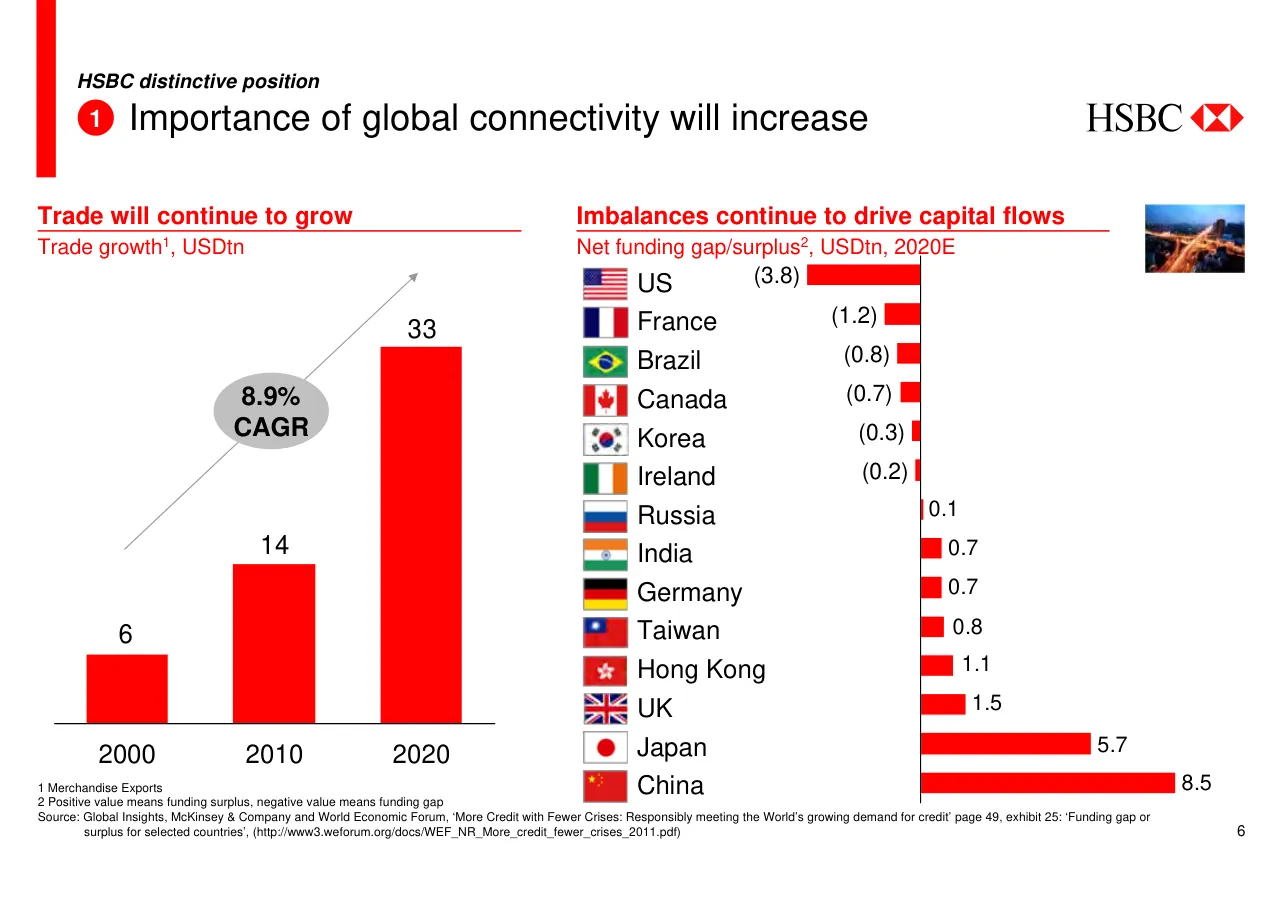
Slide 6 shows merchandise trade growth of USD6tn in 2000, USD14tn in 2010 and USD33tn in 2020, with an 8.9% CAGR. The slide states that the importance of global connectivity will increase.
What cost efficiency targets does the HSBC deck set out?
Slide 16 targets USD2.5-3.5bn of sustainable cost saves over the next 3 years and a 48-52% CER by 2013. Slide 12 describes the CER target of 48-52% as the goal for cost efficiency.
How is the HSBC Group Strategy Investor Day deck structured?
The deck is built around three pillars: distinctive position (slide 5), clear strategy and execution focus (slide 13), and an experienced management team (slide 26). Slide 28 summarises these three pillars in the closing summary.
Details
More from HSBC
Review score: 7 out of 10, Effective
Presentation quality, judged with the SlideDeck Co review heuristic. Ask, evidence and idea merit are not rated here.
The deck has a clear, repeated structure: slides 5 and 13 set out the three pillars, section labels above each title keep the viewer oriented, and slide 28 closes the loop. Charts on slides 6 to 9 are readable, with direct labels, one red accent and little clutter, and the five-filter tree on slide 15 turns a decision rule into a followable flow. Weaknesses are consequential: the regional and business-line pages (17 to 25) are dense bullet text with small charts and small stock photos, the report card on slide 29 is text in a three-column grid with no status marks, and slide 29 has a header clipped at the right edge. Slides 26 and 27 are portrait grids with tiny captions, and the title pages and appendices on 30 to 32 are very small text.
Worth keeping: Keep the repeated pillar numbering and section labels, the single red accent on clean bar charts (slides 6 to 9), and the five-filter decision tree on slide 15.
Most useful repair: Cut the text on slides 17 to 25 to a headline message and a few bullets, enlarge the financial charts, and fix the clipped column header on slide 29.
What would change the score: I would give the report card a visible status or metric per row, replace the decorative stock photos with content, and make slide titles state conclusions rather than topic labels such as 'Asia' and 'Europe'.
Confidence high. 32 of 32 pages inspected on contact sheets, 4 at readable size. Reviewed 2026-11-08. Model-assisted review (claude-sonnet-5-5).
Full text of the slides (32 slides)
Every slide's words and a description of its charts and images, so the deck can be searched and rebuilt. Also available as Markdown.
Slide 1
11 May 2011
Group Strategy
Investor Day
Stuart Gulliver Group Chief Executive
HSBC
HSBC
Group
Strategy
Visuals: Photograph across the top band: an HSBC office tower (Canary Wharf style) photographed from low angle looking up, with the HSBC name in dark serif lettering on the white facade and the red-and-white HSBC hexagon logo on the corners. Blue sky at upper left and right; the blue-and-white glass facade with dark navy horizontal window bands dominates. Lighting is bright daylight, the photo is cropped to a wide band, full-bleed inside the red frame. Square HSBC Group Strategy logo at left: red square outline with graduated red-to-salmon pixel blocks along the left and bottom edges, containing the text HSBC (red), Group (black), Strategy (black). HSBC wordmark in black serif with red hexagon at bottom right. Red frame is a solid band about 2% thick with a small notch at the lower right edge.
Slide 2
Forward-looking statements
This presentation and subsequent discussion may contain certain forward-looking statements with respect to the financial condition, results of operations and business of the Group. These forward-looking statements represent the Group's expectations or beliefs concerning future events and involve known and unknown risks and uncertainty that could cause actual results, performance or events to differ materially from those expressed or implied in such statements. Additional detailed information concerning important factors that could cause actual results to differ materially is available in our Annual Report and Accounts 2010. Past performance cannot be relied on as a guide to future performance.
This presentation contains non-GAAP financial information. Reconciliation of non-GAAP financial information to the most directly comparable measures under GAAP are provided in the 'Reconciliation of reported and underlying profit before tax' supplement available at www.hsbc.com.
2
HSBC
Visuals: none apart from the red vertical bar and the HSBC logo at top right: the logo is the HSBC wordmark in black serif capitals followed by the red hexagonal-diamond symbol made of two opposing chevrons with a white centre cross.
Slide 3
HSBC heritage and business model
HSBC
3
Visuals: One photograph/reproduction of a historical banknote: a sepia-cream Hongkong & Shanghai Banking Corporation one-dollar note, landscape orientation, showing ornate black engraved border with corner medallions bearing the numeral 1, a central scalloped '$1' medallion, 'THE HONGKONG & SHANGHAI BANKING CORPORATION' in black decorative serif script, two grey blank rectangles for serial numbers marked 'No.', a grey engraved band reading 'Promises to pay the Bearer on demand ONE MEXICAN DOLLAR at its Office here value received', 'BY ORDER OF THE BOARD OF DIRECTORS,' in small caps, 'Shanghai,' and '18' handwritten, and a cursive signature 'Wadegardner' with 'Acct.' and 'Manager' labels. Lighting is flat, dominant colours are cream/peach, black and grey. The note is unclipped, boxed within a rectangle with a slight cream tint, not full-bleed, centred. One HSBC logo: red hexagon-like diamond mark with white X pattern next to black serif 'HSBC' wordmark, top-right.
Slide 4
Context / Total shareholder return over the last 16 years / HSBC / Total shareholder return1 / TSR rebased to 100 on 30/12/1994 / 700 / 600 / 500 / 400 / 300 / 200 / 100 / 0 / 1995 / 2000 / 2005 / 2010 / 2011 / May / HSBC Holdings plc / MSCI World Banks Index / +542% / +81% / Outperformance / vs. market / Flat vs. market / Resilient in the / financial crisis / 1 Includes capital appreciation and dividends. Calculation is adjusted for equity raisings / Source: Thomson Reuters Datastream / 4
Visuals: Line chart titled 'Total shareholder return' with subtitle 'TSR rebased to 100 on 30/12/1994'. Y-axis: 0 to 700, gridline labels every 100, no unit printed. X-axis: years 1995 to 2011 with labels at 1995, 2000, 2005, 2010, 2011 and 'May' beneath 2011. Series 1: HSBC Holdings plc, solid red line about 3 px thick, starts near 100 in 1995, rises to about 350 in 1997, dips to about 190 in 1998, reaches about 550 in 2001, about 330 in late 2008 low point, and ends near 650 in May 2011. Series 2: MSCI World Banks Index, solid grey line about 2 px thick, starts at 100 in 1995, peaks about 340 in 2007, falls to about 105 in late 2008 and ends near 180 in May 2011. Dotted black horizontal baseline at 100. Annotations: black double-headed-style arrow at 2011 from 100 up to about 650 labelled '+542%' in an oval outline; a shorter black arrow from 100 up to about 180 labelled '+81%' in an oval outline. Three grey arrows beneath the axis: left arrow spanning 1995 to 2001 with label box 'Outperformance vs. market', middle arrow spanning 2001 to 2007 with label box 'Flat vs. market', right arrow spanning 2007 to 2011 with label box 'Resilient in the financial crisis'. Each label box is light grey #EBEBEB.
Slide 5
HSBC distinctive position / Why should you own HSBC? / HSBC / Distinctive position aligned with key trends / Network of countries relevant for international connectivity / Access and exposure to high growth markets and businesses / Strong balance sheet generating resilient stream of earnings / Clear strategy and execution focus / Strategy drives investment priorities and capital allocation / Action plan addressing growth and cost efficiency across geographies and businesses / Experienced management team accountable for delivery / Detailed in following section / 5
Visuals: Left column: three horizontal panels, each with a peach-to-white left-to-right gradient, containing a red numbered circle badge (1, 2, 3) at the left edge and a photograph at the right. Photo 1: city expressway interchange at dusk with light trails of orange and white traffic, blue twilight sky, boxed with a thin white border, full rectangle not cropped to a circle. Photo 2: low-angle view up through tall green trees into a bright sky, green foliage dominant, boxed. Photo 3: close-up of a gold combination safe dial with numerals 60, 70, 80, 100 visible, warm gold and brown tones, boxed. Right column: three flat light-grey boxes each with a red roman-numeral circle badge (I, II, III) at the left edge overlapping the box border. No charts, tables or logos other than the HSBC logo.
Slide 6
HSBC distinctive position / 1 Importance of global connectivity will increase / HSBC / Trade will continue to grow / Trade growth¹, USDtn / 6 / 14 / 33 / 8.9% / CAGR / 2000 / 2010 / 2020 / Imbalances continue to drive capital flows / Net funding gap/surplus², USDtn, 2020E / (3.8) / US / (1.2) / France / (0.8) / Brazil / (0.7) / Canada / (0.3) / Korea / (0.2) / Ireland / 0.1 / Russia / 0.7 / India / 0.7 / Germany / 0.8 / Taiwan / 1.1 / Hong Kong / 1.5 / UK / 5.7 / Japan / 8.5 / China / 1 Merchandise Exports / 2 Positive value means funding surplus, negative value means funding gap / Source: Global Insights, McKinsey & Company and World Economic Forum, ‘More Credit with Fewer Crises: Responsibly meeting the World’s growing demand for credit’ page 49, exhibit 25: ‘Funding gap or surplus for selected countries’, (http://www3.weforum.org/docs/WEF_NR_More_credit_fewer_crises_2011.pdf) / 6
Visuals: Left: vertical bar chart, titled Trade will continue to grow, subtitle Trade growth¹, USDtn. Three solid red bars with value labels above them: 2000 = 6, 2010 = 14, 2020 = 33. X-axis categories 2000, 2010, 2020 under a thin black baseline; no y-axis shown. A thin grey arrow runs diagonally from the bottom-left of the 2000 bar area up to above the 2020 bar, with a grey ellipse labelled 8.9% CAGR placed on the arrow. Right: horizontal diverging bar chart titled Imbalances continue to drive capital flows, subtitle Net funding gap/surplus², USDtn, 2020E. A vertical black zero axis runs through the centre. Each row has a country flag icon, a country name and a red bar with a value label: US (3.8) bar extends left; France (1.2); Brazil (0.8); Canada (0.7); Korea (0.3); Ireland (0.2); Russia 0.1 bar right; India 0.7; Germany 0.7; Taiwan 0.8; Hong Kong 1.1; UK 1.5; Japan 5.7; China 8.5 (longest bar, right). Negative values are shown in brackets. Flags shown in order: United States, France, Brazil, Canada, South Korea, Ireland, Russia, India, Germany, Taiwan, Hong Kong, United Kingdom, Japan, China. Small photograph at top right of the right column: night aerial view of a city with a multi-lane elevated highway with light trails of red and white, blue dusk sky, boxed with no border, no overlay.
Slide 7
HSBC distinctive position
1 Trade and capital flows connectivity is concentrated
HSBC
Cumulative growth in total merchandise export and import, 2010-2020
100% = USD37.1tn
100%
90%
80%
70%
60%
50%
40%
30%
20%
10%
0%
Cumulative growth
Number of Markets (total: c.200 markets)
35 markets represent 90% growth in trade flows
Similar degree of concentration in:
External debt, foreign exchange reserves, and current account balances
Banking profit growth
Foreign direct investment
Source: Global Insights
7
Visuals: Line chart of cumulative growth curve in red (#E30613) rising steeply then flattening. Title: Cumulative growth in total merchandise export and import, 2010-2020; subtitle 100% = USD37.1tn. Y-axis 'Cumulative growth' labelled 0% to 100% in 10% steps (about values only, no data labels printed). X-axis 'Number of Markets (total: c.200 markets)' with no tick labels. Curve starts about 30% at the origin, reaches about 90% at about 35 markets (dashed guide lines drawn from the 90% level on the y-axis and down to the x-axis), then approaches 100% by about 100 markets and stays flat to the right edge. The area under the curve from origin to the 35-market point is filled with a light salmon tint (#FBCDB8 approx). A solid black leader line runs from the dashed vertical guide at about 50% height to the callout box. Callout box with salmon-to-white horizontal gradient fill, containing bullets listed in the text. Small rectangular photograph at top right (about 1790-1945 px wide by 320-425 px tall in the 2000 px frame) showing an elevated multi-lane highway at dusk with light trails in orange and white and blue sky, boxed with no border, not cropped. Legend: none.
Slide 8
HSBC distinctive position
2 Rebalancing of the world economy
HSBC
GDP of top 30 economies
USDtn
106
37
10
57
27
49
Emerging / Markets
Developed / Markets
2010
2050
Largest countries
Share of 2050 GDP1 (%)
China
20
India
7
Brazil
2
Mexico
2
Turkey
2
Other 14 emerging
14
US
18
Japan
5
Germany
3
UK
3
France
2
Canada
2
Other 5 developed
4
19 of the top 30 / economies in / 2050 will be from / currently deemed / “emerging / markets”
1 2050 GDP estimated for top 30 countries, 2050 world GDP estimated by assuming top 30 maintain same share of total world GDP as 2010 of 85% / Source: HSBC – “The World in 2050: Quantifying the shift in the global economy”
8
Visuals: Stacked column chart. Title: GDP of top 30 economies, unit USDtn. No visible axis scale or gridlines; a horizontal baseline runs under both columns. Two columns: 2010 total 37, shown as Emerging Markets 10 (red segment, top) and Developed Markets 27 (grey segment, bottom); 2050 total 106, shown as Emerging Markets 57 (red segment, top) and Developed Markets 49 (grey segment, bottom). Thin dashed grey lines connect the top of the 2010 red segment to the top of the 2050 red segment and the boundary between the 2010 grey and red segments to the boundary in 2050. Two curly braces at right of the 2050 column mark the red segment (upper) and the grey segment (lower). No legend; the left-side labels act as the legend. Table of two columns: Largest countries (red rows: China 20, India 7, Brazil 2, Mexico 2, Turkey 2, Other 14 emerging 14; grey rows: US 18, Japan 5, Germany 3, UK 3, France 2, Canada 2, Other 5 developed 4) with national flag icons on the country rows. Photograph: looking up through a dense canopy of tall dark tree trunks toward bright sky, green foliage, bright white sunlight at centre top, boxed rectangle not cropped, with no overlay. Logo: HSBC wordmark in black serif with the red hexagonal diamond symbol. Flags: China, India, Brazil, Mexico, Turkey, US, Japan, Germany, UK, France, Canada, each in a small bordered square.
Slide 9
HSBC distinctive position
HSBC has exposure to markets with strong fundamentals / driving wealth creation
HSBC
Top economies by 2050
GDP, USDtn
China 24.6 / US 22.3 / India 8.2 / Japan 6.4 / Germany 3.7 / UK 3.6 / Brazil 3.0 / Mexico 2.8 / France 2.8 / Canada 2.3 / Turkey 2.1
Income per capita in 2050
USD thousands
Multiple over / 2010 income
China 17 / US 55 / India 5 / Japan 63 / Germany 53 / UK 49 / Brazil 14 / Mexico 22 / France 41 / Canada 51 / Turkey 22 / 35
China 7.3x / US 1.5x / India 6.4x / Japan 1.6x / Germany 2.1x / UK 1.8x / Brazil 2.9x / Mexico 3.5x / France 1.7x / Canada 2.0x / Turkey 4.3x / 2.5
Source: HSBC – The World in 2050
9
Visuals: Three horizontal bar charts with one row per country, all sharing the same country order from top to bottom: China, US, India, Japan, Germany, UK, Brazil, Mexico, France, Canada, Turkey. Each row has a flag icon to the left of the country name. Chart 1 (left, titled Top economies by 2050, unit GDP USDtn, no axis tick labels, bars start from a vertical black baseline at about 17 percent of the width): all bars are grey #999999 with values printed at the bar end: China 24.6, US 22.3, India 8.2, Japan 6.4, Germany 3.7, UK 3.6, Brazil 3.0, Mexico 2.8, France 2.8, Canada 2.3, Turkey 2.1. No legend, no highlighted points. Chart 2 (middle, titled Income per capita in 2050, unit USD thousands, vertical black baseline at left, bars in alternating colours by value): grey #999999 bars for China 17, India 5, Brazil 14, Mexico 22, Turkey 22 and red #FF0000 bars for US 55, Japan 63, Germany 53, UK 49, France 41, Canada 51; a dashed black vertical reference line at value 35 with a solid black upward triangle below the axis and the label 35 beneath it. Chart 3 (right, titled Multiple over 2010 income, unit multiple x): red #FF0000 bars for China 7.3x, India 6.4x, Brazil 2.9x, Mexico 3.5x, Turkey 4.3x and grey #999999 bars for US 1.5x, Japan 1.6x, Germany 2.1x, UK 1.8x, France 1.7x, Canada 2.0x; a dashed black vertical reference line at 2.5 with a solid black triangle below the axis and the label 2.5 beneath it. Flags, left to right in each row: China flag (red field with yellow stars), US flag (stars and stripes), India flag (saffron, white with blue wheel, green), Japan flag (white with red disc), Germany flag (black, red, gold horizontal bands), UK flag (Union Jack), Brazil flag (green with yellow diamond and blue globe), Mexico flag (green, white, red vertical bands), France flag (blue, white, red vertical bands), Canada flag (red, white with red maple leaf), Turkey flag (red with white crescent and star). Photograph at top right: a dense green forest canopy photographed from below looking straight up at tall dark tree trunks converging toward a bright white-green sunlit centre; full colour, boxed with hard rectangular edges, not cropped, no overlay. Logo at top right: the HSBC logo, a red and white hexagonal-diamond mark to the right of the black serif wordmark HSBC. Red numbered badge: solid red circle with white bold numeral 2.
Slide 10
HSBC distinctive position / 3 A well diversified business with ample access to funding and liquidity / HSBC has a well diversified business… / … with ample access to funding and liquidity / Distribution of revenues, 2010¹ / Customer accounts, 31/12/2010, USDm / Europe (32%) / Hong Kong (14%) / Rest of Asia Pacific (13%) / MENA (3%) / North America (24%) / Latin America (14%) / PFS (44%) / CMB (19%) / GBM (27%) / GPB (4%) / Other (6%) / Europe / 492 / Asia / 456 / N. America / 158 / L. America / 88 / MENA / 34 / Total / 1,228 / One of the largest deposit base in the World² / with an A/D ratio below 80% / 1 Intra-HSBC revenue has not been eliminated in the preparation of these charts. Intra-HSBC revenue includes revenue between geographic regions and revenue between customer groups and global businesses. / HSBC's Balance Sheet Management business, reported within Global Banking and Markets, provides funding to trading businesses / 2 Including Chinese and Japanese banks, HSBC has the 3rd largest deposit franchise / 10 / HSBC
Visuals: Two pie charts and one floating-bar chart, plus a small photograph and the HSBC logo. Pie 1 (left, top): title 'Distribution of revenues, 2010¹'; slices clockwise from 12 o'clock: Europe 32% red #FF0000, Hong Kong 14% mid grey #999999, Rest of Asia Pacific 13% light grey #E6E6E6, MENA 3% dark grey #666666, North America 24% charcoal #333333, Latin America 14% pale peach #FBCDB8; thin white separators; no value labels on slices, values are in the legend. Pie 2 (left, lower): PFS 44% red #FF0000 from 12 o'clock clockwise, CMB 19% grey #999999, GBM 27% light grey #E6E6E6, Other 6% dark grey #666666, GPB 4% near-black #333333 sliver at top; thin white and black edge lines; legend to the right in the same order as the slices with square swatches. Chart 3 (right): title 'Customer accounts, 31/12/2010, USDm'; floating horizontal bars with no axis scale or gridlines, one thin vertical black axis line at the left of the bars; categories top to bottom Europe 492, Asia 456, N. America 158, L. America 88, MENA 34, Total 1,228; each bar red #FF0000 and its value printed in black to the right of the bar end; bars step down-right so each starts where the previous ends (Europe 0 to 492, Asia 492 to 948, N. America 948 to 1,106, L. America 1,106 to 1,194, MENA 1,194 to 1,228); thin grey dashed connector lines link bar ends; Total is a full-length red bar from 0 to 1,228. Photo (top right): a close-up of a polished brass or gold-coloured lock or door knob with a dark shadowed recess, warm yellow-gold and brown tones, shown as a small rectangular unrotated box with sharp corners and no overlay. HSBC logo (top right): serif black wordmark 'HSBC' with a red four-pointed diamond-cross symbol to its right.
Slide 11
HSBC distinctive position / 3 Legacy positions have affected our results / HSBC / HSBC Finance Corporation / Consumer loans run-off portfolio, USDbn1 / 100.4 / 91.2 / 82.2 / 78.9 / 68.8 / 58.4 / 55.7 / Dec 2008 / Jun 2009 / Dec 2009 / Dec 2009 / Jun 2010 / Dec 2010 / Mar 2011 / Pre-180 days3 / GBM AFS ABS reserve / USDbn2 / (2.2) / (8.3) / (18.7) / (17.5) / (12.2) / (8.1) / (6.4) / (5.8) / Dec 2007 / Jun 2008 / Dec 2008 / Jun 2009 / Dec 2009 / Jun 2010 / Dec 2010 / Mar 2011 / 1 Excludes reverse repo balances / 2 Available-for-sale fair value reserve in respect of asset-backed securities / 3 Write off period changed from 240 days to 180 days / 11
Visuals: Two column charts. Chart 1: vertical column chart titled HSBC Finance Corporation, subtitle Consumer loans run-off portfolio, USDbn (footnote 1), with a horizontal baseline; seven red columns with printed labels 100.4 (Dec 2008), 91.2 (Jun 2009), 82.2 (Dec 2009, grey column), 78.9 (Dec 2009), 68.8 (Jun 2010), 58.4 (Dec 2010), 55.7 (Mar 2011); category axis label below Pre-180 days (footnote 3); columns are scaled from zero with the tallest reaching about 100.4 and no printed y-axis ticks. The Dec 2009 column at 82.2 is light grey #E6E6E6 while others are red; it is the only highlighted difference. Chart 2: diverging column chart titled GBM AFS ABS reserve, subtitle USDbn (footnote 2), with a thin black zero line at top; all eight red columns hang downward from the zero line with labels (2.2) Dec 2007, (8.3) Jun 2008, (18.7) Dec 2008, (17.5) Jun 2009, (12.2) Dec 2009, (8.1) Jun 2010, (6.4) Dec 2010, (5.8) Mar 2011; negative values in parentheses; no legend; no y-axis ticks; the most negative value is (18.7) at Dec 2008. Both charts have no legend and no gridlines.
Slide 12
HSBC distinctive position
3 HSBC has meaningful improvement opportunities
HSBC
Regulation and capital Requirements
Evolving regulation resulting in higher capital requirements which, in light of continued uncertainty, we assume to be 9.5-10.5% Common Equity Tier 1 under Basel III
HSBC can comfortably meet Basel III capital requirements
Common Equity Tier 1 ratio of 9.5% - 10.5% (Basel III)
Efficiency
CER of 55% for 2010 (in Q1 2011, 61%, or 55% excluding notable items and FVOD) is well above target range and unacceptable
There is a programme of sustainable cost saves planned to bring cost efficiency within the target range by 2013
CER target of 48 - 52%
Profitability
ROE of 9.5% for 2010, with some of the assets not delivering the desired target return (e.g., North America) of 12-15%
Persistent low interest rate environment impacting profitability
ROE target of 12 - 15% (Basel III)
12
Visuals: Three red right-pointing chevron arrows (solid red, #E10000-ish) each sitting between the bullet text column and the oval at the right of each row, aligned to the row's vertical centre. Three light grey gradient ovals (white to #D9D9D9 gradient, approximately centred vertically on each row) containing bold black text. Three grey gradient rectangular label boxes at left (gradient from light grey #D9D9D9 at left to white at right). Red circle with white numeral 3 next to the title. HSBC logo (red hexagonal split mark and black serif wordmark) top-right. No charts or photographs.
Slide 13
Clear strategy and execution focus
Why should you own HSBC?
HSBC
Distinctive position aligned with key trends
Clear strategy and execution focus
Network of countries relevant for
international connectivity
Access and exposure to high
growth markets and businesses
Strong balance sheet generating
resilient stream of earnings
I
Strategy drives investment
priorities and capital
allocation
II
Action plan addressing
growth and cost efficiency
across geographies and
businesses
III
Experienced management
team accountable for delivery
Detailed in following section
13
Visuals: Three numbered rounded-free red circular markers (I, II, III) sit on the left edge of the three right-hand cards, each a red filled circle with a white bold Roman numeral and a thin white outline. Three photographs sit at the right of the cards: (1) a close-up of a brass ship's compass with a dial and needle on a sandy-brown background, warm tones, cropped to a rectangle; (2) an antique sepia-toned world map with faded continents and compass rose, warm brown tones, cropped to a rectangle; (3) a blue-tinted world map overlaid with a group of silhouetted people standing on a bright blue globe-like surface, cropped to a rectangle. A small legend square outlined in thin red is shown with the text 'Detailed in following section'. No charts or tables.
Slide 14
Clear strategy and execution focus / To be the leading international bank / HSBC / Two main elements / This means . . . / International connectivity / Economic development/ / wealth creation / Presence in key markets that matter for international / connectivity / Businesses that are internationally connected: / GBM hub-and-spoke model with global reach / CMB provides a full range of commercial financial services to / companies in 60+ markets / Investment opportunities in fast growing and mature markets / Wealth creation in most relevant markets (18 key markets) / Focus on retail banking only in markets where we can achieve / profitable scale: / Large scale positions (Hong Kong and UK) / High growth markets (e.g., Mexico, Singapore, Turkey, Brazil) / Leading market shares in small geographies / Strategy provides a clear framework to review our portfolio / and achieve higher discipline in capital allocation / 14
Visuals: Two photographs in the left column. Upper: night aerial view of an elevated multi-level highway interchange with light trails of orange and white traffic, tall dark buildings at right and a blue dusk sky, framed as a rectangle with sharp corners. Lower: a silver metallic globe with continent outlines resting on stacks of copper and gold coins of varying heights, on a white background, boxed rectangle. Top-right: small photo of a brass or bronze compass on a tan/sand surface, slightly sepia, rectangle. Faint grey world map silhouette sits behind the right-column bullet text as a watermark.
Slide 15
Clear strategy and execution focus Improve capital deployment – Five filters HSBC What is the strategic relevance? Are the current returns attractive? Resulting actions 1.Connectivity 2.Economic development 3.Profitability 4.Efficiency 5.Liquidity High Medium/ Low Yes No Yes No Yes No Yes No Invest Turnaround/ Improvement Continue as is Discontinue/ dispose Markets with strong connectivity in CMB and GBM (e.g., Germany) Attractive growth markets (e.g. Turkey, Brazil) Large turnaround efforts (e.g. US) Focus business and improve operational efficiency (e.g. Increase efficiency in France) Markets delivering appropriate returns that are not critical to our strategy Disposal and/or closure of non-strategic businesses that cannot be credibly turned around (e.g. Retail Banking in Russia) 15
Visuals: Decision tree diagram. Left-most level: two grey boxes labelled High (top) and Medium/ Low (bottom), joined by a thin grey bracket line to a common stem at the left edge. Second level: from High, a grey elbow line branches to two boxes labelled Yes (upper) and No (lower); from Medium/ Low, a grey elbow line branches to Yes and No boxes. Each Yes/No box has a solid red right-pointing chevron arrow leading to an outcome box: High/Yes leads to Invest; High/No leads to Turnaround/ Improvement; Medium/ Low/Yes leads to Continue as is; Medium/ Low/No leads to Discontinue/ dispose. Each outcome row has red square bullets in the right column with the action text. Above the tree, a small rectangular photograph of a brass compass lying on a sandy or weathered surface, shown in a warm tan and brown palette with a blue-grey needle, cropped to a rectangle and not full-bleed, placed at top right of the content area. The HSBC logo is a serif wordmark in black with a red hexagonal split-diamond mark.
Slide 16
Clear strategy and execution focus
II Improve cost efficiency and organisational effectiveness
HSBC
Sustainable cost saves
Approach
USD2.5-3.5bn of sustainable cost saves targeted over the next 3 years
Achieve 48-52% CER by 2013
Sustainable cost saves will facilitate:
– Growth in key markets
– Investment in new products, processes and technology
– Provide buffer against regulatory and inflationary headwinds
Positive jaws
1
2
3
4
Implement Consistent Business Models
Re-engineer Global Functions
Re-engineer Processes
Streamline IT
16
Visuals: Background photograph behind left column: a faded, washed-out close-up of industrial pressure gauges and dials (grey and white dominant, with muted blue and tan tones), feathered/faded out at its edges into white, placed roughly x 0% to 47%, y 20% to 90%, with a white overlay tint making it pale. Small thumbnail photograph at top right of the right column (about x 89%, y 23%, w 8%, h 6%): an antique sepia/tan map with brown and grey tones, boxed with a thin border. Diagram: four overlapping circles in a 2x2 arrangement. Circle 1 (top-left, about x 25%, y 32%, w 37%, h 33%) is solid red #FF3333-ish with semi-transparency, labelled 'Implement Consistent Business Models', with a red numbered roundel '1' (white outline) at its top-left. Circle 2 (top-right, about x 50%, y 32%, w 37%, h 33%) is light grey #CCCCCC with transparency, labelled 'Re-engineer Global Functions', with a grey roundel '2' at top right. Circle 3 (bottom-left, about x 51%, y 58%, w 36%, h 33%... positioned about x 51% to 75%) is mid grey #999999 with transparency, labelled 'Re-engineer Processes', with a grey roundel '3' at its top-left. Circle 4 (bottom-right, about x 70% to 94%, y 57% to 90%) is dark charcoal #333333 with transparency, labelled 'Streamline IT', with a grey roundel '4' at its top-right. Overlap regions are darker blends of the overlapping colours.
Slide 17
Clear strategy and execution focus
Global Banking and Markets (GBM)
HSBC
Emerging markets-led, financing focused with greater emphasis on connectivity
GBM key financials
PBT, USDbn
Total PBT07-10: USD29.6bn
6.1
3.5
10.5
9.5
2007
08
09
2010
2010 Metrics
CER: 50%
RWAs: USD358bn
RoRWA: 2.5%
Position
Business built organically and run as a global business
Reached new base level of USD9-10bn in 2009/10 with additional upside for growth
Strong emphasis on connecting faster growing markets, in particular with Europe
Strategic actions
Improve client coverage (e.g., selective hiring)
Enhance core product strengths (e.g., FX, commodities) and selectively develop new capabilities (e.g., equities)
Increase penetration of product solutions into broader customer base (e.g., USD1bn of incremental revenue from CMB customer base)
Achieve sustainable cost saves (e.g., integrate technology trading platforms)
17
Visuals: Vertical bar chart titled 'GBM key financials', unit PBT in USDbn, with four red bars with no axis scale or gridlines shown; a horizontal baseline below the bars. Bars labelled with printed values: 2007 = 6.1, 08 = 3.5, 09 = 10.5, 2010 = 9.5 (category labels 2007, 08, 09, 2010 below the baseline). A pale grey ellipse callout above the left bars reads 'Total PBT07-10: USD29.6bn'. No legend; no highlighted points beyond the red fill. The 2010 Metrics grey box lists CER 50%, RWAs USD358bn, RoRWA 2.5%. A small photograph at top right of the banner: a close-up of a bronze or copper-coloured sculpted figure in warm brown tones beside a dark window or grille, in a landscape crop at about 3:1 ratio, boxed with no border, lit warmly. A red circle with white 'II' numeral beside the title. HSBC logo: black serif wordmark with a red hexagonal-diamond mark.
Slide 18
Clear strategy and execution focus
Commercial Banking (CMB)
HSBC
Strengthen our position as the leading international trade and business bank
CMB key financials
PBT, USDbn
Total PBT07-10:
USD24.7bn
7.1
7.2
4.3
6.1
2007
08
09
2010
2010 Metrics
CER: 49%
RWAs: USD322bn
RoRWA: 2.0%
Position
Heritage of the Group in international trade
Organic growth since the Group’s foundation
Present in 60+ markets
Strategic actions
Expand presence in key faster growing markets
Capture growth in International SMEs leveraging network, capabilities and scale
Collaborate with GBM to capture Mid-market opportunity in FX, derivatives and Global Capital Financing
18
Visuals: Column chart, titled CMB key financials, unit PBT in USDbn. Four red vertical bars on a common baseline with no y-axis: 2007 bar labelled 7.1, 08 bar labelled 7.2, 09 bar labelled 4.3, 2010 bar labelled 6.1. Values are printed above each bar; the 2007 and 08 bars are about the same height, the 09 bar is about 60% of the 2007 height, and the 2010 bar is about 85% of the 2007 height. Category labels under the bars read 2007, 08, 09, 2010. A grey callout ellipse above the bars reads Total PBT07-10: USD24.7bn. Legend: none. Highlighted points: none. Also a small photograph in the top right of the slide showing port gantry cranes and shipping containers beside water under a pale blue sky, shown as a thin horizontal strip, not cropped, with a blue and yellow dominant colour, and an HSBC logo (red hexagon-style diamond mark with the wordmark HSBC in serif) at top right. A red circle with white roman numeral II sits beside the title.
Slide 19
Clear strategy and execution focus
II Retail Banking and Wealth Management (RBWM)
HSBC
World class banking and wealth solutions
PFS key historical financials (going forward RBWM¹)
PBT, USDbn
Total PBT07-10: / USD-3.7bn
5.9
3.5
-2.1
-11.0
2007
08
09
2010
2010 Metrics
CER: 58%
RWAs: USD361bn
RoRWA: 1.0%
Position
Global propositions: Premier and Advance
Top 15 markets concentrate majority of profits
Strategic actions
Wealth Management
Develop world class wealth management for retail consumers focusing on 18 key markets (USD4bn in additional revenues)
Build sustainable non funds income
Up-skill RMs, invest in product platform and deepen client relationships
Retail Banking
Grow retail banking in key markets where we have or can achieve scale (e.g., Mexico, Turkey)
Standardise banking propositions and operating models to reduce complexity
Portfolio Management
Exit sub-scale markets (e.g., Retail Banking in Russia)
1 Does not include Global Asset Management
19
Visuals: Bar chart titled PFS key historical financials (going forward RBWM¹), subtitle PBT, USDbn. Vertical bars in red with values labelled: 2007 = 5.9 (positive, above zero line), 08 = -11.0 (negative), 09 = -2.1 (negative), 2010 = 3.5 (positive). Bars sit on a thin black horizontal zero line; no y-axis shown; category labels 2007, 08, 09, 2010 below the bars. A grey oval callout above the chart reads Total PBT07-10: USD-3.7bn. Below the chart a grey box lists 2010 Metrics. A small photograph in the top right corner shows a tall office tower against a pale blue sky, cropped to a thin horizontal strip, with warm-tinted lower edge.
Slide 20
Clear strategy and execution focus
II Global Private Banking (GPB)
HSBC
Become the world's leading international private bank
GPB key financials
PBT, USDbn
Total PBT07-10: USD5.1bn
1.5
1.4
1.1
1.1
2007
08
09
2010
2010 Metrics
CER: 66%
RWAs: USD25bn
RoRWA: 4.0%
Position
Well established footprint and in most attractive growth markets, particularly Asia
Efficient platform to deliver full range of solutions
Vigorous actions taken to address data security issues
Strategic actions
Focus on domestic and the faster growing markets in Asia, Middle East and Latin America as legacy offshore business becomes less relevant
Leverage intra-group connectivity (RBWM feeder, CMB referrals, GBM partnership)
Grow annuity revenues and invest in platform for improved efficiency
20
Visuals: Vertical bar chart titled 'PBT, USDbn', four red bars for 2007, 08, 09 and 2010 with labelled values 1.5, 1.4, 1.1 and 1.1 printed above each bar; no y-axis, baseline is a thin dark grey horizontal line; bars are about equal width and evenly spaced; no legend; no highlighted points. A grey ellipse callout above the chart reads 'Total PBT07-10: USD5.1bn'. A small photograph at top-right shows an aerial night view of a city with illuminated streets and a tall tower, warm yellow and orange lights on dark blue, boxed with no border and a sharp rectangle. The 2010 Metrics grey box contains three red square bullets with CER: 66%, RWAs: USD25bn, RoRWA: 4.0%. The HSBC logo is red hexagon-diamond mark with black serif wordmark.
Slide 21
Clear strategy and execution focus
II North America
HSBC
To build an internationally connected, sustainable business model, aligned with overall group strategy
Strategic market
Present
Not present
North America
In the US, explore other options to reallocate capital:
Finance business in run-off except for cards
Cards and Retail Services (USD33bn in customer loans)
Part of the branch network (currently total of 475 branches)
Invest in network in internationally connected areas
Capture internationalisation opportunity for small and mid-market US companies
Strengthen New York as GBM hub for the Americas
Strong Canadian franchise focused on international connectivity generating USD0.9bn PBT in 2010
North America 2010
PBT USD0.5bn
CER 49%
RWAs USD331bn
RoRWA 0.1%
21
Visuals: Map of North America in red (strategic market) with white outlines for Canada and Alaska regions; pale areas (Mexico, Pacific water) are white. Small white icon marks on the far left near Alaska/Pacific coast. Legend: red square for Strategic market, pale peach square for Present, light grey square for Not present. Photograph at bottom-right: low-angle view of a neoclassical stone building facade with columns (New York Stock Exchange style) against blue sky and tall glass towers, slightly cropped, full-width of the data panel, no overlay. Grey data panel beneath the photo with four bulleted red-square rows of label and value: PBT USD0.5bn; CER 49%; RWAs USD331bn; RoRWA 0.1%.
Slide 22
Clear strategy and execution focus
II Latin America
HSBC
Becoming the leading international bank serving key growth segments and markets
Strategic market
Present
Not present
Latin America
Position to capture social mobility and wealth creation opportunity
Organic growth in Brazil, Mexico and Argentina
Review opportunities to reallocate capital from less strategic and underperforming businesses
Leverage CMB and GBM competitive strength across the region
Costs efficiency and delayering
Latin America 2010
PBT USD1.8bn
CER 66%
RWAs USD96bn
RoRWA 2.0%
22
Visuals: Map of Latin America in red, peach and light grey showing market presence: Mexico, Central American countries, Brazil, Argentina, Peru, Chile and parts of the Andean region are shaded red (strategic market); Colombia, Venezuela, Bolivia, Uruguay and Central America in peach (present); Guyana, Suriname, French Guiana, Paraguay area and the Caribbean islands in light grey (not present). Legend at top right with three swatches: red Strategic market, peach Present, light grey Not present. A photograph in the lower right panel shows Rio de Janeiro: Christ the Redeemer statue on a hilltop at right, Guanabara Bay and blue water with green hills and city in the distance under a pale blue hazy sky with clouds; full-width crop at top of the stat box, boxed with no overlay. A thin grey connector line runs from the left text box edge to the map at mid height.
Slide 23
Clear strategy and execution focus
Europe
HSBC
Be the leading international bank connecting Europe
UK
Continue to develop Wealth Management through Premier, Advance and other key products, e.g., mortgages
Be the UK’s leading bank for international businesses
Evaluate the impact of ICB: potential ringfencing of retail operations
Continental Europe
Restructure sub-scale continental European operations (e.g., Retail Banking in Russia)
Focus mature European markets on connectivity
– France: Accelerate Wealth Management strategy, while reducing costs and increase role of Paris as a GBM hub
– Germany: Focus on large internationally connected corporates, taking advantage of German business momentum
– Turkey: Capture growth opportunities in Retail and CMB
Strategic market
Present
Not present
Europe 2010
PBT USD4.3bn
CER 68%
RWAs USD302bn
RoRWA 1.3%
23
Visuals: Map of Europe (choropleth) with countries coloured by presence: Strategic market in red #E60000 (United Kingdom and Ireland, France, Germany, Turkey); Present in peach #FBD0B8 (Spain, Portugal, Italy, Netherlands, Belgium, Poland, Austria, Greece, Balkan and eastern countries in part, Scandinavia not coloured peach); Not present in light grey #E6E6E6 (Norway, Sweden, Finland, Baltic states, much of central and southeast Europe). Country borders drawn in thin white lines. Map is cropped at the right edge and partly behind the photo and data panel. Legend at upper left of the map: three square swatches with labels Strategic market, Present, Not present. Photo at top right of map: dusk skyline of Canary Wharf towers, lit in warm orange-pink sky, dark glass towers with lit windows at centre-left, street lamps at right; boxed, not full-bleed, no tint. Data panel below photo: grey box containing a table of four rows: PBT USD4.3bn; CER 68%; RWAs USD302bn; RoRWA 1.3%, with red square bullets, labels left-aligned and values right-aligned.
Slide 24
Clear strategy and execution focus / Middle East and North Africa / HSBC / The leading international bank connecting Middle East and North Africa with the rest of the world and capturing its wealth opportunity / Middle East and North Africa / Align coverage of both individuals and corporates to capture trickle-down of wealth / Leverage regional and global footprint to capture East-to-East trade flows and FDI opportunities / Maintain leadership in Islamic Finance products / Strategic market / Present / Not present / MENA 2010 / PBT USD0.9bn / CER 45% / RWAs USD54bn / RoRWA 1.6% / 24
Visuals: Map of the Middle East and North Africa in flat fills with white country borders, shown without a frame. Strategic market (red #FF0000): Egypt, Saudi Arabia, United Arab Emirates, Qatar and Bahrain. Present (peach #FBD0B8): Algeria, Libya, Tunisia, Jordan, Lebanon, Syria, Turkey, Oman and Pakistan. Not present (light grey #E6E6E6): Morocco, Western Sahara, Mauritania, Iraq, Iran, Yemen, Afghanistan and Central Asia. Legend at centre-left of map with three square swatches: red 'Strategic market', peach 'Present', grey 'Not present'. Photograph at top-right of the data panel: a long colonnade of ornate columns with capitals receding into the distance, warm sepia and cream tones with grey stone and dark floor in the lower band, landscape crop, boxed with a flat rectangular edge, no overlay. Data panel: grey box containing bold label MENA 2010 and four red square bullets with values, labels left and values right-aligned: PBT USD0.9bn, CER 45%, RWAs USD54bn, RoRWA 1.6%.
Slide 25
Clear strategy and execution focus
Asia
Connecting Asia and the world
Greater China
Maintain leadership in Hong Kong
Continued leadership as China's top foreign bank
Be the leading international bank for RMB worldwide
Build on historic success of investment in associates and expand successful strategic partnership with BoCom
Pursue Shanghai listing
India
Continue to capture strong growth in GBM and CMB (PBT grew 3x from 2005-2010)
Continue to expand distribution to capture the retail opportunity e.g., RBS acquisition1
Other Markets
Invest for growth in further key markets: Singapore, Malaysia and Indonesia
Focus resources selectively in other markets to maintain leadership in connectivity
1 Subject to Regulatory approval
25
HSBC
Strategic market
Present
Not present
Asia 2010
PBT USD11.6bn
CER 49%
RWAs USD324bn
RoRWA 3.8%
Visuals: Map of Asia, Southeast Asia and Australasia (shape-filled political map). Strategic markets (China, India, Southeast Asia, Australia) are filled solid red #E60000; Japan and parts of Korea, Thailand/Vietnam area and New Zealand are light peach 'Present' #F9CBAE; Mongolia, Central Asian areas and other unpresent countries are light grey #E6E6E6. Two thin black connector lines run from the Greater China box right edge to China on the map and from the India box right edge to India. A photograph of Hong Kong harbour with red-sailed junk boats in the foreground and high-rise skyline behind, under blue-grey sky, sits in a rectangle above the data panel, full width of the panel, unmasked. Legend: red square 'Strategic market', peach square 'Present', grey square 'Not present'. Data panel: grey #E6E6E6 box with 'Asia 2010' header and four bullet rows with values right-aligned: PBT USD11.6bn, CER 49%, RWAs USD324bn, RoRWA 3.8%.
Slide 26
Clear strategy and execution focus
Experienced Management team
Group management board
Sandy Flockhart
Chairman EMEA, Latin America and Commercial Banking
Iain Mackay
Group Finance Director
Samir Assaf
Global Banking and Markets
Alan Keir
Commercial Banking
Paul Thurston
Retail Banking and Wealth Management
Niall Booker
North America
Emilson Alonso
Latin America and Caribbean
Brian Robertson
Europe
Peter Wong
Asia
Marc Moses
Risk
Ann Almeida
Human Resources
Richard Bennett
Legal
26
HSBC
Visuals: Twelve head-and-shoulders portrait photographs, one per card, each about 19 percent of slide width and 20 percent of card height, placed at the left of each card. Subjects are men in dark business suits except Ann Almeida, a woman with short dark hair and a light top; backgrounds range from plain grey and white to saturated blue. Lighting is frontal and even; the photos are small, low resolution and boxed with square corners, not cropped to shape. Dominant colours are navy, grey, skin tones and blue backdrops. Top-right thumbnail: a small rectangular photograph of a crowd of people in silhouette against a pale blue sky with white cloud shapes, boxed with square corners. Red roundel icon at title left: a filled red circle with three white vertical bars. HSBC logo: red hexagonal-diamond mark beside black serif wordmark.
Slide 27
Clear strategy and execution focus
Experienced Management team
HSBC
Other management members
Muhammad Al / Tuwaijri
Peter Boyles
Pat Burke
Simon Cooper
John Coverdale
Christophe de / Backer
Irene Dorner
Conrado Engel
John Flint
David Fried
Joe Garner
Naina Kidwai
Mark McCombe
Chris Meares
Sean O’Sullivan
Luis Pena
Russell Picot
Andreas Schmitz
Antonio Simões
Sandra Stuart
Helen Wong
Team with strong values:
‘Leading with courageous integrity’
27
Visuals: Twenty-two head-and-shoulders studio portraits of named managers, each about 6.7% of slide width and 10.6% of slide height, placed centred in its grey card above the name. Backgrounds vary (plain grey, blue, green, white, dark). Portraits are boxed with no border, no overlay and no cropping beyond the head-and-shoulders frame. One small top-right thumbnail (about 7.8% by 7.5% of slide) showing a blue-tinted illustration of a crowd of small figures with a large globe-like shape above. Red roundel icon at title left containing white 'III'. HSBC wordmark logo with a red diamond-shaped mark at right. No charts.
Slide 28
In summary…
HSBC
Distinctive position
Clear strategy and execution focus
Network of countries relevant for
international connectivity
Strategy drives investment
priorities and capital
allocation
Access and exposure to high growth
markets and businesses
Action plan addressing
growth and cost efficiency
across geographies and
businesses
Strong balance sheet generating
resilient stream of earnings
Experienced management
team accountable for delivery
28
Visuals: None. Six rectangular text panels with a horizontal peach-to-white gradient fill serve as text cards, with no photographs, charts, or icons apart from the HSBC logo mark in the top right corner.
Slide 29
Report card / HSBC / Key execution elements / Actions (examples) / In 12 months progress on¹. . . / Capital Deployment / Bullets: Five filters driving disposals and closures of non-strategic and/or underperforming positions/businesses / Turnaround of strategically relevant businesses / Bullets: Transactions announced and executed / Tangible progress in turnaround actions (e.g., US) / Cost efficiency / Bullets: Target USD2.5-3.5bn in sustainable cost saves in 3 years, achieving our 48-52% CER target by 2013 / Simplify and delayer the organisation / Bullets: Material savings identified and being delivered across the 4 main programmes / Growth / Bullets: Revenue growth in fast growing markets / Capture wealth opportunity (USD4bn in additional revenues) / Leverage intra-group connectivity between CMB and GBM (USD1bn of additional revenues) / Bullets: Income growth particularly in Asia and Latin America / Wealth and GBM/CMB connectivity / 1 From 11 May 2011 / 29
Visuals: Three label boxes in the left column, each a rectangle with a horizontal gradient fill from peach #FFD0B8 at the left edge to white at the right edge, with a hairline light grey border. Labels read Capital Deployment, Cost efficiency and Growth, in bold black. A thin dark grey horizontal rule runs under the Actions and progress column headers. Red square bullets (#FF0000) precede every bullet item. The HSBC logo at top-right is the wordmark HSBC in dark serif letters followed by the red hexagonal interlocking-diamond symbol (#DB0011). A solid red vertical bar (#FF0000) runs from the top edge down to about 20% of slide height at the left.
Slide 30
Basis of preparation (1/2)
HSBC
Actuals
Actual numbers presented are on a reported basis and include the effect of movements in the fair value of HSBC's own debt related to credit spreads
AMG
The Global Asset Management business formed part of GBM in 2010, but has been included in RBWM for the RoRWA targets. Comparative data will be presented to reflect this reclassification in the Interim Report 2011
Asia
Data for 'Asia' comprises the sum of reported figures for the Hong Kong and Rest of Asia-Pacific geographical regions without the elimination of inter-segment items
Composition of the Group
No changes to the composition of the Group have been assumed other than those described in this presentation
Financial targets
Financial targets are prepared on the basis of the Group's accounting policies as set out in the Annual Report and Accounts 2010, and on the basis of tax rates and laws enacted or substantively enacted as at 31 December 2010. The potential effects on HSBC's operations and performance of the Dodd-Frank Act in the US, the deliberations of the UK Independent Commission on Banking, and a range of evolving regulatory changes which may or may not affect HSBC have not been included in the targets
Other
The main items reported under 'Other' are certain property activities, the estimated impact of the UK bank levy, unallocated investment activities, centrally held investment companies, gains arising from the dilution of interests in associates, movements in the fair value of own debt designated at fair value (the remainder of the Group's gain on own debt is included in GBM) and HSBC's holding company and financing operations. The results also include net interest earned on free capital held centrally, operating costs incurred by the head office operations in providing stewardship and central management services to HSBC, and costs incurred by the Group Service Centres and Shared Service Organisations and associated recoveries
30
Slide 31
Basis of preparation (2/2)
HSBC
RoE
Return on equity ('RoE') is profit attributable to ordinary shareholders of the parent company divided by average ordinary shareholders' equity
RoRWA
The metric, return on risk weighted assets ('RoRWA'), is the profit before tax divided by average RWAs. The RWAs have been calculated using FSA rules for the 2010 metrics. The regional and customer group targets are adjusted for Basel 3 rules specific to the GBM business. In all cases, RWAs or financial metrics based on RWAs for geographical segments or customer groups are on a third party basis and exclude intra-HSBC exposures
RoRWA target for Europe
The Europe RoRWA target includes the Group's head office costs, intra-HSBC recharges and the total estimated impact of the UK bank levy
RoRWA target for 'Other'
No RoRWA target has been set for the 'Other' customer group as it is not considered to be a meaningful measure in terms of performance assessment and resource allocation
RWAs for the mainland China associates
RWAs for the mainland China associates have been reallocated from the 'Other' customer group to RBWM, CMB and GBM to align better with the basis for the allocation of their profits. This represents a reclassification from the basis used in HSBC's 2010 Pillar 3 Disclosures. Comparative customer group RWAs will be presented on the new basis in the Interim Report 2011
31
Visuals: A red vertical bar at the top-left running from the top edge to about 19% of slide height, roughly 2.5% wide, flush with the left edge at about 2.8% x. A HSBC logo at top-right: the wordmark 'HSBC' in a dark serif in black, followed by a red hexagonal-diamond emblem of two opposed chevrons forming a stylised diamond shape. No photographs, charts or tables.
Slides 32 to 32 continue in the full text file.
Download this deck
The hosted PDF of every library deck is free for readers of the SlideDeck Co newsletter. Join with your email and the viewer and download appear here.
Preparing a strategy presentation of your own? The SlideDeck Co Consulting Deck is a slide library with a statement of work and a worked client case.