The deck is HSBC's June 2018 strategy update for investors. It opens with a title slide and a formal notice covering forward-looking statements and non-GAAP measures, then gives a one-page summary of the strategy. The deck moves through four main sections: a profile of the bank as a leading international bank with access to high-growth markets and a strong balance sheet; a review of the transformation since 2011 and the plan for growth in Asia, the US, the UK and transaction banking; the financial framework covering costs, investment of USD15-17bn to 2020, capital and dividends; and a closing conclusion. It closes by restating the target of a return on tangible equity above 11% by 2020 with positive adjusted jaws. Slides worth studying include the strategy summary grid, the market-share charts that pair data with short claims, the wealth-in-Asia breakdown, and the capital bridge that separates the stated target from the underlying drivers. The deck uses dense tables, numbered priority codes that recur across slides, and consistent before-and-after charts to link each initiative to a measurable outcome.
Slides worth studying
Questions about this deck
How many slides does the HSBC Strategy Update investor presentation from June 2018 have?
The deck has 32 pages in total, and the title slide is slide 1. The page count is listed in the deck's own metadata rather than on a single slide.
What return on tangible equity target does the HSBC strategy update set out?
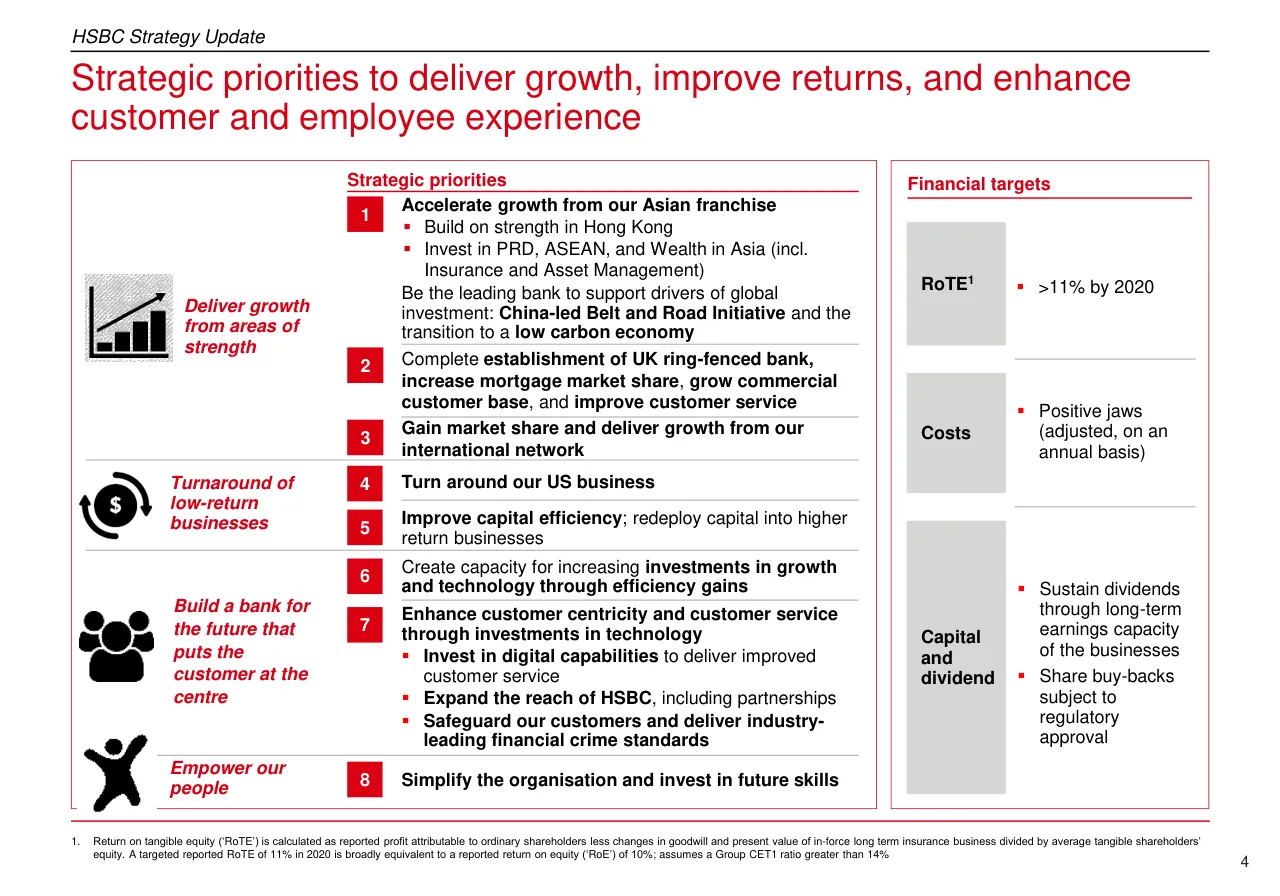
Slide 3 states that the Group targets a RoTE of >11% by 2020 while delivering positive adjusted jaws on an annual basis and sustaining its dividend. Slide 4 adds a footnote that a targeted reported RoTE of 11% in 2020 is broadly equivalent to a reported return on equity of 10%, assuming a Group CET1 ratio greater than 14%.
How much does HSBC plan to invest until 2020 according to its strategy deck?
Slide 3 says the Group is investing USD15-17bn until 2020, primarily in growth and technology, while delivering positive adjusted jaws. Slide 3 also describes the next phase of strategy as returning the Group to growth and improving returns.
How is the HSBC strategy update deck structured?
The agenda on slide 5 lists three sections: leading international bank with platform for growth and signature balance sheet strength, next phase of strategy focused on return to growth and value creation, and profitable growth to deliver RoTE above 11% by 2020. The agenda is repeated on slide 11, and the deck includes an important notice and forward-looking statements on slide 2.
Details
- Company: HSBC Holdings plc
- Year: 2018
- Type: Strategy presentation
- Industry: Banking
- Pages: 32
More from HSBC
Review score: 7 out of 10, Effective
Presentation quality, judged with the SlideDeck Co review heuristic. Ask, evidence and idea merit are not rated here.
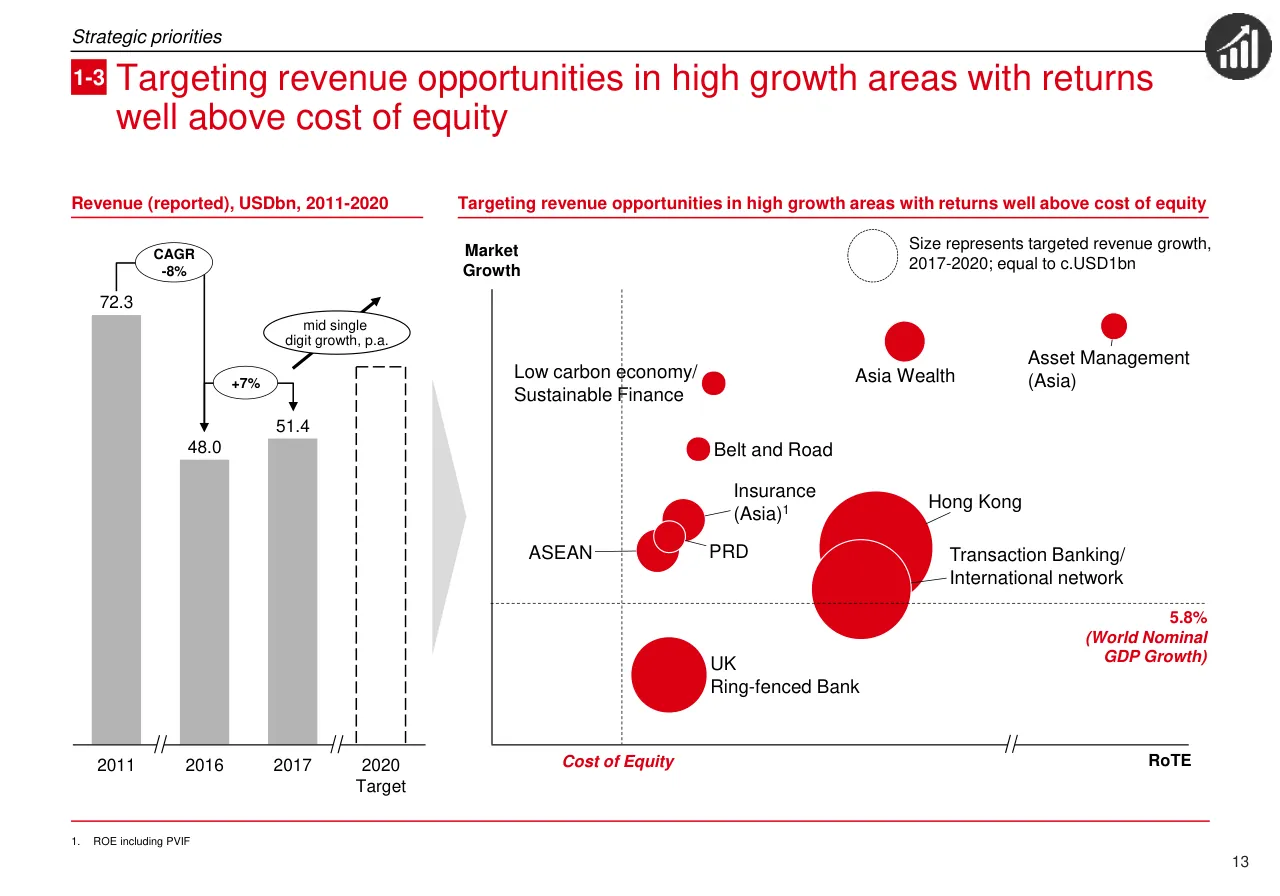
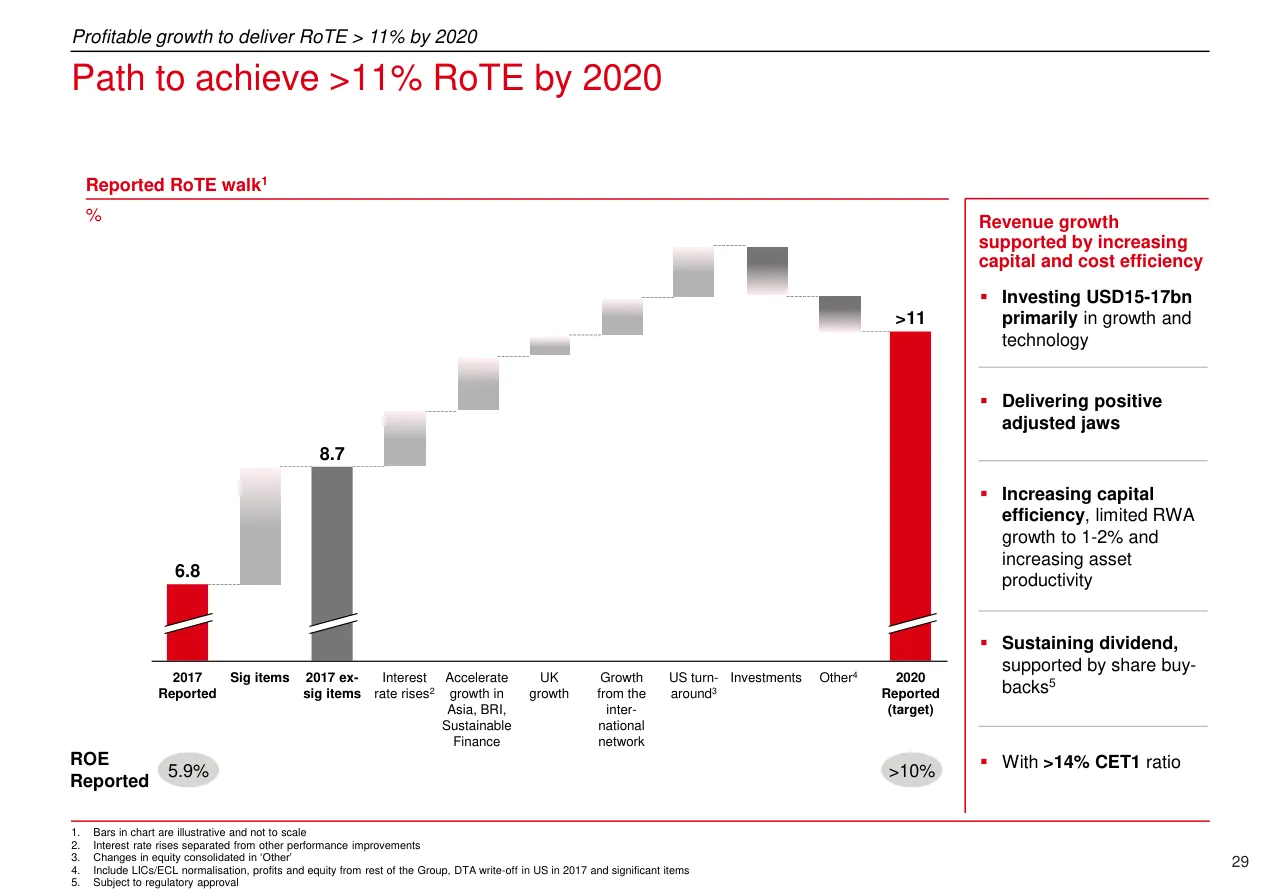
The deck has a clear route: an agenda that returns as a marker (slides 5, 11, 28), numbered priorities 1 to 8 on slide 4 that recur as red tags and icons on later slides, and a closing slide 31 that restates the RoTE target. Consistent chart styling, red-for-HSBC colour logic and action-style titles make most pages readable as claim plus evidence, and the pairing of data with short claims on slides 7, 8 and 18 works well. The weaknesses are density and some unclear charts: slides 13 and 29 carry visuals that do not communicate on their own (a bubble chart with no readable y or x scale values on slide 13, a waterfall with no values on most steps on slide 29), and many pages (20, 22, 25, 27) are tiny-text tables that a room audience could not read. The legal slide 2 is a full wall of fine print and the final slide 32 is a blank grey page.
Worth keeping: Keep the numbered priority tags and icons that tie slides 4, 12 and 13 to 27, the agenda slides that mark section changes, the action titles, and the red-for-HSBC highlighting against grey peers on slides 7, 10 and 21.
Most useful repair: Label the waterfall steps on slide 29 with values, add readable axes or scale cues to the bubble chart on slide 13, and cut the footnote-sized text on slides 20, 22 and 25 so the headline numbers stand out.
What would change the score: Split the densest slides (4, 12, 20, 27) into a headline page plus backup, and tighten the summary on slide 3 so the bolded phrases carry the message.
Confidence medium. 32 of 32 pages inspected on contact sheets, 4 at readable size. Reviewed 2026-11-08. Model-assisted review (claude-sonnet-5-5).
Full text of the slides (32 slides)
Every slide's words and a description of its charts and images, so the deck can be searched and rebuilt. Also available as Markdown.
Slide 1
HSBC Strategy Update: Return to Growth and Value Creation
Investor presentation, June 2018
HSBC
Visuals: Full-bleed black-and-white photograph of a historic Hong Kong harbourfront: grey hills at left and right, colonial stone buildings along the waterfront, a calm grey harbour in the foreground, and an overcast pale grey sky. Overlaid in the centre is a large stylised diamond composed of triangular facets. Inside the facets is a full-colour night view of the skyline in warm orange and red tones, with lit towers, a glowing red-lit tower at centre, and a illuminated ferris wheel at right. The overlay is cropped by the diamond shape and is not boxed. Lighting is night-time glow inside the facets against daylight monochrome outside. Dominant colours are grey, charcoal, red #C8102E-range and warm amber. Logo: HSBC hexagon mark, a red #DB0011 hexagon with white stylised cross-like inner shape, next to black HSBC wordmark, in bottom-left corner.
Slide 2
HSBC Strategy Update
Important notice and forward-looking statements
Important notice
The information, statements and opinions set out in this presentation and subsequent discussion do not constitute a public offer for the purposes of any applicable law or an offer to / sell or solicitation of any offer to purchase any securities or other financial instruments or any advice or recommendation in respect of such securities or other financial instruments.
The information contained in this presentation and subsequent discussion, which does not purport to be comprehensive nor render any form of financial or other advice, has been / provided by HSBC Holdings plc and its consolidated subsidiary undertakings (the “Group”) and has not been independently verified by any person. No responsibility, liability or / obligation (whether in tort, contract or otherwise) is accepted by the Group or any member of the Group or any of their affiliates or any of its or their officers, employees, agents or / advisers (each an “Identified Person”) as to or in relation to this presentation and any subsequent discussions (including the accuracy, completeness or sufficiency thereof) or any / other written or oral information made available or any errors contained therein or omissions therefrom, and any such liability is expressly disclaimed.
No representations or warranties, express or implied, are given by any Identified Person as to, and no reliance should be placed on the accuracy or completeness of any information / contained in this presentation, any other written or oral information provided in connection therewith or any data which such information generates. No Identified Person undertakes, or / is under any obligation, to provide the recipient with access to any additional information, to update, revise or supplement this presentation or any additional information or to remedy / any inaccuracies in or omissions from this presentation.
Forward-looking statements
This presentation and subsequent discussion may contain projections, estimates, forecasts, targets, opinions, prospects, results, returns and forward-looking statements with respect / to the financial condition, results of operations, capital position, strategy and business of the Group (together, “forward-looking statements”), including the strategic priorities and 2020 / financial, investment and capital targets described herein. Any such forward-looking statements are not a reliable indicator of future performance, as they may involve significant / assumptions and subjective judgements which may or may not prove to be correct and there can be no assurance that any of the matters set out in forward-looking statements are / attainable, will actually occur or will be realized or are complete or accurate. Forward-looking statements are statements about the future and are inherently uncertain and generally / based on stated or implied assumptions. Certain of the assumptions and judgements upon which forward-looking statements contained herein are based are discussed under / “Targeted Outcomes: Basis of Preparation”, available separately from this presentation at www.hsbc.com. The assumptions may prove to be incorrect and involve known and / unknown risks, uncertainties, contingencies and other important factors, many of which are outside the control of the Group. Actual achievements, results, performance or other future / events or conditions may differ materially from those stated, implied and/or reflected in any forward-looking statements due to a variety of risks, uncertainties and other factors / (including without limitation those which are referable to general market conditions or regulatory changes). Any such forward-looking statements are based on the beliefs, expectations / and opinions of the Group at the date the statements are made, and the Group does not assume, and hereby disclaims, any obligation or duty to update, revise or supplement them if / circumstances or management’s beliefs, expectations or opinions should change. For these reasons, recipients should not place reliance on, and are cautioned about relying on, any / forward-looking statements. No representations or warranties, expressed or implied, are given by or on behalf of the Group as to the achievement or reasonableness of any / projections, estimates, forecasts, targets, prospects or returns contained herein. Additional detailed information concerning important factors that could cause actual results to differ / materially is available in our Annual Report and Accounts for the fiscal year ended 31 December 2017 filed with the Securities and Exchange Commission (“SEC”) on Form 20-F on / 20 February 2018 (the “2017 20-F”) and in our 1Q 2018 Earnings Release furnished to the SEC on Form 6-K on 4 May 2018 (the “1Q 2018 Earnings Release”).
This presentation contains non-GAAP financial information. The primary non-GAAP financial measure we use is ‘adjusted performance’ which is computed by adjusting reported / results for the period-on-period effects of foreign currency translation differences and significant items which distort period-on-period comparisons. Significant items are those items / which management and investors would ordinarily identify and consider separately when assessing performance in order to better understand the underlying trends in the business. / Reconciliations between non-GAAP financial measurements and the most directly comparable measures under GAAP are provided in the 2017 20-F, the Reconciliations of Non- / GAAP Financial Measures document and the 1Q 2018 Earnings Release which are available at www.hsbc.com.
Information in this presentation was prepared as at 10 June 2018.
2
Slide 3
HSBC Strategy Update
Summary of the strategy
Leading international bank with platform for growth and signature balance sheet strength
World’s leading international bank and No 1 global transaction bank
Unparalleled access to high growth markets and coverage of trade corridors between them
Recognised for signature balance sheet strength – foundation for future growth and a stable dividend
Next phase of our strategy is to return the Group to growth, improve returns, and enhance customer and employee experience
After a period of restructuring, supported by normalising interest rates and synchronised economic growth, it is time for HSBC to get back into growth mode
Accelerate growth in areas of strength with higher capital efficiency, in particular in Asia and from our international network
Leverage our size and strength to embrace new technologies over a period of disruptive technological change. Investing USD15-17bn until 2020 primarily in growth and technology while delivering positive adjusted jaws
Complete the turnaround in the US
Simplify the organisation and invest in capabilities for the future
As a result of these strategic priorities, the Group targets a RoTE of >11% by 2020 while delivering positive adjusted jaws on an annual basis and sustaining our dividend
3
Visuals: none (no photographs, charts, icons or logos; the only graphic elements are the thin red rectangle outline framing the body text, the black header rule and the thin red rule below the frame, and the red square bullet glyphs).
Slide 4
HSBC Strategy Update / Strategic priorities to deliver growth, improve returns, and enhance / customer and employee experience / Strategic priorities / Financial targets / 1 / Accelerate growth from our Asian franchise / Build on strength in Hong Kong / Invest in PRD, ASEAN, and Wealth in Asia (incl. / Insurance and Asset Management) / Be the leading bank to support drivers of global / investment: China-led Belt and Road Initiative and the / transition to a low carbon economy / Deliver growth / from areas of / strength / 2 / Complete establishment of UK ring-fenced bank, / increase mortgage market share, grow commercial / customer base, and improve customer service / 3 / Gain market share and deliver growth from our / international network / Turnaround of / low-return / businesses / 4 / Turn around our US business / 5 / Improve capital efficiency; redeploy capital into higher / return businesses / Build a bank for / the future that / puts the / customer at the / centre / 6 / Create capacity for increasing investments in growth / and technology through efficiency gains / 7 / Enhance customer centricity and customer service / through investments in technology / Invest in digital capabilities to deliver improved / customer service / Expand the reach of HSBC, including partnerships / Safeguard our customers and deliver industry- / leading financial crime standards / Empower our / people / 8 / Simplify the organisation and invest in future skills / Financial targets / RoTE1 / >11% by 2020 / Costs / Positive jaws / (adjusted, on an / annual basis) / Capital / and / dividend / Sustain dividends / through long-term / earnings capacity / of the businesses / Share buy-backs / subject to / regulatory / approval / 4 / 1. Return on tangible equity (‘RoTE’) is calculated as reported profit attributable to ordinary shareholders less changes in goodwill and present value of in-force long term insurance business divided by average tangible shareholders’ / equity. A targeted reported RoTE of 11% in 2020 is broadly equivalent to a reported return on equity (‘RoE’) of 10%; assumes a Group CET1 ratio greater than 14%
Visuals: Four black icons in the left panel, aligned to the left column. (1) Bar chart icon: four ascending black bars with a black arrow rising diagonally across them, on a light grey hatched square, next to the label Deliver growth from areas of strength. (2) Circular icon: a black circle containing a white dollar sign, with two black curved arrows circling around it, next to the label Turnaround of low-return businesses. (3) Group icon: three black silhouette figures of people, one large in front and two smaller behind, next to the label Build a bank for the future that puts the customer at the centre. (4) Figure icon: a black silhouette of a person with arms raised and legs apart in a jumping pose, next to the label Empower our people. Eight solid red squares with white numerals 1 to 8 mark the priorities. Three light grey rectangles sit in the right panel behind the Financial targets labels RoTE1, Costs and Capital and dividend. No photographs.
Slide 5
HSBC Strategy Update
Agenda
1
Leading international bank with platform for growth and / signature balance sheet strength
2
Next phase of strategy: Return to growth and value creation
3
Profitable growth to deliver RoTE > 11% by 2020
5
Visuals: Three-row agenda graphic built from flat rectangles, no photographs or icons. Row 1 is a red box with white bold numeral 1 beside a red bar holding white bold two-line text. Rows 2 and 3 are light grey boxes with black regular numerals and black regular single-line text. Thin black horizontal rule under the header and thin red horizontal rule near the bottom, both spanning the content width.
Slide 6
Leading international bank with platform for growth and signature balance sheet strength / Leading international bank with a platform for growth and signature / balance sheet strength / Who we are / Strategic differentiators / c.38m / customers served / by 229k / colleagues¹ / 67 markets / Covering >90% / of global GDP, / trade and capital / flows / #1 / global transaction / bank² / #1 / International bank / in Asia³ / USD182bn / Total capital⁴ / Top 3 / FTSE dividend / payer⁵ / 1 Leading international bank / >50% of Group client revenue connected to the network / No 1 global transaction bank, gaining market share / Recognised by customers as leading international bank / 2 Unparalleled access to high growth markets / Access to high growth developing markets in Asia, / Middle East and Latin America / Investment aligned to high growth markets to deliver / shareholder value / 3 Signature balance sheet strength / Strong capital, funding and liquidity position with / diversified business model / Conservative approach to credit risk and liquidity / management / Low earnings volatility / Strong capital position and intrinsic capital generation / Foundation for sustained dividend; strong capacity for / distribution to shareholders / 1. Full-time equivalent as at 31 Dec 2017 / 2. Based on 2017 Transaction Banking product total revenue (including Payments, Cash Management, Trade / Finance, FX and Securities Services) compared with US and European peers. Source: HSBC Research / 3. Based on 2017 total revenue in Asia among major international and regional banks in Asia. Peers include / Standard Chartered, DBS, Citi, UOB, OCBC, Maybank and CIMB. Source: Company accounts / 4. As at 31 Dec 2017 / 5. Total USD payout (2015-2017) / 6
Visuals: None apart from the six flat grey stat tiles (#E6E6E6, no border, no shadow, square corners), three red square number markers (1, 2, 3) with white numerals, and red square bullet markers (Wingdings ▪) in #DB0011 for the list items; no photographs, charts, tables, logos or icons.
Slide 7
Leading international bank with platform for growth and signature balance sheet strength / 1 Leading international bank with high return transaction banking / Leading transaction banking franchises¹ / FY2017, revenue, USDbn / HSBC 15.2 / US Bank / US Bank / US Bank / European Bank / European Bank / European Bank / European Bank / European Bank / Recognised as leading international bank / % of large corporates choosing HSBC as their lead international bank² / 26% / 22% / 21% / Asia / US / Europe / RoTE Transaction Banking, % / >20% / 20% / 9% / HSBC Transaction Banking / Transaction Banking Industry¹ / Banking Industry overall⁷ / Leading market positions / #1 / bank for Trade Finance³ / #1 / bank for FX for corporates⁴ / #1 / bank for Liquidity and account management³ / #1 / For Assets Under Custody in Asia Pacific⁵ / #2 / bank for Emerging Markets Fixed Income⁶ / 53% / of client revenue connected to international network / 1. Revenue from GTRF, GLCM, FX and Securities Services, compared with peer equivalents. Source: Company financial data; HSBC adjusted revenue / 2. Greenwich Associates – Large Corporate Banking / 3. Oliver Wyman / 4. Greenwich Survey; G10 + EM countries / 5. EY, based on data provided by HSBC and Tricumen / 6. EM Macro; McKinsey/ Coalition / 7. McKinsey / 7
Visuals: Three charts and six tiles. Left: horizontal bar chart titled 'Leading transaction banking franchises', subtitle FY2017, revenue, USDbn. Bars are ranked, largest at top: HSBC (red #DB0011) labelled 15.2; then US Bank, US Bank, US Bank, and five European Bank bars, all grey #B4B4B4. Only the HSBC value is printed. Other bars are about 14.3, 13.3, 10.3, 5.3, 5.0, 4.4, 4.3 and 2.1 USDbn, estimated from bar length. No axis scale is printed; a thin black vertical axis line runs at the bar origin. Middle top: column chart titled 'Recognised as leading international bank', subtitle '% of large corporates choosing HSBC as their lead international bank', columns in red #DB0011: Asia 26%, US 22%, Europe 21%, with a black horizontal baseline. Middle bottom: column chart titled 'RoTE Transaction Banking, %': HSBC Transaction Banking >20% (red), Transaction Banking Industry 20% (grey #B4B4B4), Banking Industry overall 9% (grey #B4B4B4); black baseline. Right: six square-cornered tiles in light grey #D7D8D6, each with a red or black figure and bold black text: #1 bank for Trade Finance; #1 bank for FX for corporates; #1 bank for Liquidity and account management; #1 For Assets Under Custody in Asia Pacific; #2 bank for Emerging Markets Fixed Income; 53% of client revenue connected to international network. The 53% figure and #1 and #2 figures are red #DB0011. No photographs, logos or icons.
Slide 8
Leading international bank with platform for growth and signature balance sheet strength / 2 / Unparalleled access to high growth markets / Emerging markets remain drivers of global growth / HSBC has access to high growth markets / World Nominal GDP growth, 2017-2030 1 / Asia, Market shares 2 / CAGR / +5.8% / Asia / Middle East / Africa / Latin America / N. America / Europe / 7.4% / 7.4% / 6.5% / 6.0% / 4.3% / 4.6% / 2017 / 2030E / 29% / Hong Kong / Largest among international and regional banks 3 / 12% / PRD 4 (Share in Guangdong among foreign banks) / 50% of Group adjusted revenues and >75% of Group adjusted profits in 2017 / Strong foundation in China / PRD to support future expansion / 5% / Singapore / #1 DCM in Asia 5 (6% market share) / 3% / Malaysia / #1 in offshore RMB bond underwriting with 28% market share 6 / Middle East, Market shares 2 / 8% / Saudi Arabia 7 / Leading international bank in the Middle East 8 / 4% / United Arab Emirates / Ranked #1 in cash management and trade finance 9 / Well positioned for Saudi Vision 2030 and Belt and Road Initiative 10 / #1 DCM in Middle East 5 / Latin America, Market shares 2 / 8% / Mexico / Top 5 bank in Mexico 11 / Wholesale network across LATAM region / An intra-regional strategy focused on leveraging cross-border flows, including with NAFTA / World Trade Growth, 2017-2030 1 / +6.1% / CAGR / Asia / Middle East / Africa / Latin America / N. America / Europe / 7.1% / 7.8% / 8.0% / 5.7% / 4.4% / 5.4% / 2017 / 2030E / 1. Global Insights Jan18; World trade based on imports plus exports / 2. Customer deposits, based on local regulators’ data / 3. Excludes Asia-Pacific based banks where majority of revenue generated in its domestic market and excludes Japanese banks / 4. CBRC/PBOC / 5. Dealogic, based on 2017 full year fees / 6. 109 QFI applications approved by CMA / 7. Engagement in Saudi Arabia primarily through investment in Saudi British Bank (SABB); held as an Associate of HSBC / 8. By assets in 2017 from MENA regional bank financials / 9. Euromoney Trade Finance Survey 2018 and Euromoney Cash Management Survey 2017 / 10. Best International Bank for BRI in 2017 Asiamoney New Silk Road Finance Awards / 11. National Commission of Banking and Securities (Mexico) / 8
Visuals: Chart 1, World Nominal GDP growth 2017-2030 (stacked bar chart, upper left): two stacked columns labelled 2017 and 2030E on a shared black baseline; no numeric axis or segment values printed; 2030E column about twice the height of 2017 column (about 2.1 times). Stack segments from top: Asia red #DB0011, Middle East salmon pink, Africa dark grey, Latin America charcoal, N. America light grey, Europe very light grey. A black diagonal arrow with an arrowhead points up-right from lower left to upper right behind a white ellipse with black outline labelled +5.8%. Legend to the right of the bars lists Asia, Middle East, Africa, Latin America, N. America, Europe with matching colour squares. A CAGR column headed CAGR (underlined) lists values in white ellipses with black outlines: Asia 7.4% and Middle East 7.4% on pink-filled ellipses (highlighted), Africa 6.5%, Latin America 6.0%, N. America 4.3%, Europe 4.6%. Chart 2, World Trade Growth 2017-2030 (stacked bar chart, lower left): same structure with columns 2017 and 2030E, black diagonal arrow labelled +6.1%, legend Asia, Middle East, Africa, Latin America, N. America, Europe; CAGR column Asia 7.1% (pink-filled, highlighted), Middle East 7.8% (pink-filled, highlighted), Africa 8.0%, Latin America 5.7%, N. America 4.4%, Europe 5.4%. Right side: red bold percentage figures with bullet squares (red Wingdings square bullets) and no icons, logos or photographs. Market-share figures: Hong Kong 29%, PRD 12%, Singapore 5%, Malaysia 3%, Saudi Arabia 8%, United Arab Emirates 4%, Mexico 8%.
Slide 9
Leading international bank with platform for growth and signature balance sheet strength / Access to domestic growth in eight markets; network to connect / trade and capital flows / 2 / Aspiration / Characteristics / Markets / % of adj. / revenue / FY17 / Markets at / scale / “HSBC is / considered one of / the leading / domestic banks” / Top 5 bank, at least 3-5% / market share / At least USD1bn revenue / Universal bank / Full participation across / customer segments / Hong Kong / UK / Mexico / PRD / Singapore / Malaysia / UAE / Saudi / Arabia1 / c.60% / Markets as / leading / international / bank / “HSBC is the / leading international / bank in the country” / Leading international bank / At least USD0.5bn revenue / Wholesale bank or Universal / bank with very focused retail / offering (where strategic) / Australia / Canada / China / France / Germany / India / Indonesia / US / c.25% / Markets to / connect the / network / “HSBC is in the / country to connect / foreign and local / customers to our / network” / Targeted offering for / international customers / Wholesale-focused / Branch or rep office where / possible / Network markets to / connect trade and capital / flows (e.g. Japan, Spain, / Brazil) / Supporting subsidiaries of / global customers / c.15% / 1. / Engagement in Saudi Arabia primarily through investment in Saudi British Bank (SABB); held as an Associate of HSBC / 9
Visuals: Three parchment-style quote cards, one per row, each about 20.5% wide by 18.4% high, with torn, deckled edges and a soft drop shadow, cream to tan colour (about #F3DFC0 with darker edges). Row 1 card reads “HSBC is considered one of the leading domestic banks”; row 2 reads “HSBC is the leading international bank in the country”; row 3 reads “HSBC is in the country to connect foreign and local customers to our network”. Three grey (#B4B4B4) rectangular row-label boxes at left, each about 11% by 17.8%, with bold black labels. Three ovals outlining percentages in the % of adj. revenue column: c.60% (row 1), c.25% (row 2), c.15% (row 3), each a thin black outline about 5.9% wide by 5% high with bold black text, unfilled. Red square with white bold number 2 at top left of the title. Red square bullets (Wingdings) in all bullet lists. No photographs, logos or charts.
Slide 10
Leading international bank with platform for growth and signature balance sheet strength
3 Signature balance sheet strength
Strong balance sheet, FY2017, USD (unless otherwise stated)
Low-risk model with stable earnings, 2017
HSBC
Peer group average¹
Balance Sheet
Customer accounts
1.4tn
Loans & advances to customers
1.0tn
Total equity
198bn
Capital
Total regulatory capital
182bn
Leverage ratio
5.6%
Total capital ratio
20.9%
Funding and liquidity
Advances to deposits ratio
71%
Liquidity coverage ratio
142%
Liquid asset buffer
>500bn
10 year PBT volatility²
1.0x
2.6x
LICs / loans and advances³
0.2%
0.9%
Advances to deposits ratio
71%
82%
Leverage ratio
5.6%
5.5%⁴
Total capital ratio
20.9%
17.1%
CET1 ratio
14.5%
13.0%
10
Source: HSBC and peers’ public filings, Bloomberg, Factset
1. Average calculated based on 2017 published figures by the following peers: Barclays, BNP, Citi, DBS, Deutsche Bank, ICBC, Itau, JP Morgan, Santander, Standard Chartered, BoAML; ICBC not included in CET1 ratio
2. Calculated as range of reported PBT divided by average reported PBT from 2008 to 2017
3. Represents gross loans and advances to customers
4. Leverage ratio not disclosed by ICBC and Itau
Visuals: Two bar-style comparison panels and one tabular panel; no photographs or logos. Left panel is a table: three grey category blocks (Balance Sheet; Capital; Funding and liquidity) with values in light grey boxes: Customer accounts 1.4tn; Loans & advances to customers 1.0tn; Total equity 198bn; Total regulatory capital 182bn; Leverage ratio 5.6%; Total capital ratio 20.9%; Advances to deposits ratio 71%; Liquidity coverage ratio 142%; Liquid asset buffer >500bn. Grey separator lines sit between Total equity and Total regulatory capital, and between Total capital ratio and Advances to deposits ratio. Right panel is a bar chart with two series, HSBC (red bars, #DB0011) and Peer group average (grey bars, #B4B4B4), each bar with its value printed above it and a black baseline beneath each row. Rows, HSBC value then peer value: 10 year PBT volatility² 1.0x / 2.6x (HSBC bar about one-third of peer bar height); LICs / loans and advances³ 0.2% / 0.9%; Advances to deposits ratio 71% / 82%; Leverage ratio 5.6% / 5.5%⁴; Total capital ratio 20.9% / 17.1%; CET1 ratio 14.5% / 13.0%. No axes or legend are drawn; bar heights are proportional to the printed values within each row only (values about, where not printed: none).
Slide 11
HSBC Strategy Update / Agenda / 1 / Leading international bank with platform for growth and signature / balance sheet strength / 2 / Next phase of strategy: Return to growth and value creation / 3 / Profitable growth to deliver RoTE > 11% by 2020 / 11
Slide 12
Strategic priorities
Completing period of transformation; platform for growth
Transformation since 2011
Divested or exited 110 businesses / and geographies, reducing Group / footprint from 87 countries to 67
Reduced Risk Weighted Assets by / USD349bn or 29%1
Globalised the organisation / around 4 Global Businesses, / supported by Global Functions
Introduced robust financial crime / risk management capabilities
Invested USD7bn “Costs to Achieve” / to realise cost efficiencies of / USD6.1bn p.a. from our global / platform and built digital / capabilities
Shifted business to Asia and / faster-growing markets with Asia / representing c.50% of Group / revenue and c.75% of Group / profits2
Strengthened network to support / global trade and capital flows
Demonstrated ability to execute
Next phase of strategy: Return to growth and value creation
Growth
Deliver growth / from areas of / strength
1
Accelerate growth from our Asian franchise, and / Insurance and Asset Management in Asia
Be the leading bank to support drivers of global / investment: China-led Belt and Road Initiative / and the transition to a low carbon economy
2
Complete establishment of UK ring-fenced bank, / increase mortgage market share, grow commercial / customer base, and improve customer service
3
Gain market share and deliver growth from our / international network
Turnaround
Turnaround of / low-return / businesses
4
Turn around our US business
5
Improve capital efficiency; redeploy capital into / higher return businesses
6
Create capacity for increasing investments in / growth and technology through efficiency gains
Customer
Build a bank for / the future that / puts the / customer at the / centre
7
Enhance customer centricity and customer service / through investments in technology
Invest in digital capabilities to deliver improved / customer service
Expand the reach of HSBC, including partnerships
Safeguard our customers and deliver industry- / leading financial crime standards
Our People
Empower our / people
8
Simplify the organisation and invest in future / skills
1. Period 2015-17
2. Adjusted basis
12
Visuals: Four black monochrome icons sit in the right-hand band labels. (1) Growth: a square with light grey hatched background containing four ascending black bar-chart columns of increasing height and a black upward-pointing arrow running diagonally over them, box about 35.6% x 25.5% y, 6.8% by 9.7%. (2) Turnaround: a black circle at centre with a white dollar sign, surrounded by a thick black circular arrow loop with arrowheads at upper left and right, about 36.4% x 46.8% y, 5.6% by 8.1%. (3) Customer: a group of three black silhouetted adult figures, centre figure largest and in front, two smaller figures behind at left and right, about 36.1% x 64.3% y, 5.8% by 7.8%. (4) Our People: a single black silhouette of a person with both arms raised upward in a celebratory pose, about 37.6% x 81.7% y, 3.5% by 5.0%. A solid red right-pointing triangle sits at the right end of the left panel header at about 31.0% x 17.0% y, 2.9% by 2.0%. Eight solid red square number tiles (#DB0011) with white bold numerals 1 to 8 sit at the left of each item. No photographs or charts.
Slide 13
Strategic priorities
Targeting revenue opportunities in high growth areas with returns / well above cost of equity
1-3
Revenue (reported), USDbn, 2011-2020
Targeting revenue opportunities in high growth areas with returns well above cost of equity
Market / Growth
Size represents targeted revenue growth, / 2017-2020; equal to c.USD1bn
CAGR / -8%
72.3
mid single / digit growth, p.a.
+7%
48.0
51.4
Asset Management / (Asia)
Low carbon economy/ / Sustainable Finance
Asia Wealth
Belt and Road
Insurance / (Asia)1
Hong Kong
ASEAN
PRD
Transaction Banking/ / International network
UK / Ring-fenced Bank
5.8% / (World Nominal / GDP Growth)
2011
2016
2017
2020 / Target
Cost of Equity
RoTE
13
1. ROE including PVIF
Visuals: Left: vertical bar chart titled 'Revenue (reported), USDbn, 2011-2020'. Three grey bars with printed values: 2011 = 72.3, 2016 = 48.0, 2017 = 51.4; a fourth dashed-outline empty box labelled 2020 Target with no value. The axis breaks are marked with double slashes between 2011 and 2016 and between 2016 and 2017 and before 2020. No y-axis or scale is printed. Annotations: an ellipse labelled 'CAGR -8%' linked by a black elbow connector to the 2011 bar and by a long black arrow down to the 2016 bar; a small ellipse '+7%' on that connector with a black elbow arrow down to the 2017 bar; a large ellipse 'mid single digit growth, p.a.' with a thick black arrow pointing up-right from it toward the 2020 target box. A light grey (#DBDBDB) right-pointing chevron sits between the two panels. No legend. Right: bubble chart titled 'Targeting revenue opportunities in high growth areas with returns well above cost of equity'. Y-axis labelled 'Market Growth' with a black axis line and no numeric scale; X-axis labelled 'RoTE' (bottom right) with an axis break marked by double slashes near 79%; 'Cost of Equity' in red bold italic at the bottom left, marking a vertical dashed grey line at about 48.5%. A horizontal dashed line at about 67.3% marks the 5.8% (World Nominal GDP Growth) reference in red bold. Bubbles in red (#DB0011) with white labels outside: Low carbon economy/Sustainable Finance (small), Asia Wealth (medium), Asset Management (Asia) (small), Belt and Road (small), Insurance (Asia) with footnote 1 (medium), PRD (small white-outlined circle overlapping ASEAN), ASEAN (medium), Hong Kong (large, overlapping Transaction Banking), Transaction Banking/International network (large, outlined in white where it overlaps Hong Kong), UK Ring-fenced Bank (large). Size key at top right: a dashed-outline empty circle with text 'Size represents targeted revenue growth, 2017-2020; equal to c.USD1bn'. Top-right corner icon: a dark charcoal filled circle containing a white bar chart with an upward arrow.
Slide 14
Strategic priorities
Accelerate revenue growth in Asia
>3bn
>1bn
>0.2bn
Targeted revenue
growth by 2020
Franchise in Asia (reported, ex BoCom)
Opportunities and areas of investment
Revenue, 2017 USDbn
USD
PBT, 2017
USDbn
Hong Kong
(RBWM
and CMB)
11.4
7.5
A
Build on strength in Hong Kong
Capture growth in targeted segments
Enhance customer experience
Capitalise on China outbound investments
Hong Kong
(GB&M, GPB and
Corporate Centre)
4.7
2.1
B
Develop a leading business in the Pearl River Delta
Serve emerging middle class
Facilitate industrial up-grade and cross-border connectivity
Expand new business capabilities by further developing
technology in PRD
ASEAN
3.1
1.2
PRD
C
Build leading Wealth Management business
China
0.2
2.4
0.5
Capture growth in financial wealth in Asia
Build leading wealth business, particular focus on Greater
China and ASEAN
Grow insurance to address the protection gap
Enhance Asset Management to serve retail / institutional
clients
India
2.4
0.9
D
Expand our business in ASEAN
Australia
0.9
0.4
Continue to build regional product and coverage expertise
to capture opportunities from Singapore’s role as a regional
hub for treasury and wealth
Other Asia
0.9
0.8
Support intra-ASEAN business corridor flow
Capture infrastructure opportunity (including BRI)
Targeted digital investments to enhance position
14
Visuals: Horizontal bar chart titled Franchise in Asia (reported, ex BoCom), Revenue, 2017 USDbn, with seven grey bars (#B4B4B4) on a vertical black baseline, bars growing rightwards from the axis with value labels at bar ends: Hong Kong (RBWM and CMB) 11.4; Hong Kong (GB&M, GPB and Corporate Centre) 4.7; ASEAN 3.1; China 2.4 (with a red 0.2 label box marking the PRD portion); India 2.4; Australia 0.9; Other Asia 0.9. No axis scale or gridlines are printed. A red vertical marker line and red label PRD sit on the China bar. To the right, a column headed PBT, 2017 USDbn holds seven white ellipse outlines with bold italic values: 7.5, 2.1, 1.2, 0.5, 0.9, 0.4, 0.8 (Hong Kong RBWM and CMB, Hong Kong GB&M GPB and Corporate Centre, ASEAN, China, India, Australia, Other Asia). The right column Targeted revenue growth by 2020 (USD) uses square markers: A has three red squares, B has one red and two white, C has two red and one white, D has one red and two white. Legend top right: three red squares (>3bn), two red and one white (>1bn), one red and two white (>0.2bn). Icon top right: dark charcoal circle with a white rising bar chart and upward arrow.
Slide 15
Strategic priorities
1A Build on strength in Hong Kong
HSBC’s market share has been steady over the years…
Opportunities and areas of investment
CAGR
2005-17
Total banking
assets in Hong
Kong1, USDtn
USD0.9tn
USD2.9tn
10%
10%
Asset growth
HSBC market
share, %
24%
25%
2005
20172
Capture
growth in
targeted
segments
Grow millennials client base to build
customer generation for the future
Enhance proposition for Non Resident
Chinese customers
Invest in insurance for sustainable
market share growth
Enhance
customer
experience
Develop digital payment ecosystem
Build new capabilities in Business
Banking
Explore partnerships to launch
innovative solutions
Capitalise on
China
outbound
investments
Capture new growth opportunities with
China, in particular:
– Belt and Road Initiative
– International activities of Chinese
corporates and financial institutions
– Greater Bay Area / Pearl River Delta
– Sustainable Finance/ Hong Kong as
Green Financial Centre
– RMB Internationalisation
…with leading positions across major products3
Customer
accounts
#1
Mortgages
37%
#1
Loans and
advances to
customers
#1
Credit cards
>40%
DCM
#1
Trade finance
#1
1. HKMA, Annual Report 2017
2. 25% asset market share; 29% deposit market share
3. HKMA announcements, Bloomberg, mReferaln 2017 and HSBC internal data; HSBC including Hang Seng. Mortgages - new sales count, legal mortgages; Loans – loans for use in Hong Kong; DCM - G3 currency bonds, Asia excluding Japan
15
Visuals: Bar chart (column chart, two bars) titled HSBC market share, %, with the row label Total banking assets in Hong Kong1, USDtn above it. Bars: 2005 red bar labelled 24%; 2017 (footnote 2) red bar labelled 25%, slightly taller than the 2005 bar. No y-axis numbers or range are printed; bar heights are about proportional to 24 and 25 with a baseline axis line under the bars. Above the bars, grey ovals show total banking assets: USD0.9tn (2005) and USD2.9tn (2017). A CAGR 2005-17 column on the right shows a grey-outlined oval with 10% for total assets and a red-outlined oval with 10% for HSBC market share, labelled Asset growth beneath. Product table with rows: Customer accounts #1 (red oval); Mortgages 37% and #1 (red ovals); Loans and advances to customers #1 (red oval); Credit cards >40% (red oval); DCM #1 (red oval); Trade finance #1 (red oval). Thin grey horizontal dividers separate the rows. Right panel: three grey (#B4B4B4) label blocks with black bold text; red square bullets and red en-dash sub-bullets. Top-right icon: dark charcoal (#333333) circle with a white ascending bar chart and upward arrow. No photographs.
Slide 16
Strategic priorities
1B
Develop a leading business in the Pearl River Delta (PRD)
HSBC’s business in PRD has grown steadily
Opportunities and areas of investment
USDbn
Revenue
>USD1bn
0.18
0.22
c.0.5
2014
2017
2020
Medium-
target
term target
Loans & advances to customers
>20bn
>10bn
6.2
4.1
2014
2017
2020
Medium-
target
term target
First JV securities company: majority-owned by a foreign bank in China, opened for business in December 2017
Headcount: >700 FTE increase in 2017; more than doubled since project launched in June 2015
Credit cards: Launched first HSBC sole-branded credit cards in December 2016; total cards in force number: c.280k in PRD as of April 2018
Emerging Middle Class
Grow and enhance distribution network / access to customers
Broaden product offerings and accelerate quality asset growth
Capture cross-border wealth flows, e.g. opportunities from remittances, Shenzhen-Hong Kong Stock Connect
Industrial up-grade / cross-border connectivity
Enhance corporate coverage to capture growth from international supply chains and industrial upgrading
Broaden client base and drive for deposit-heavy product mix
New business capabilities
Fully leverage capital market capabilities of new Securities Joint Venture HSBC Qianhai Securities
Expand Global Markets capabilities arising from policy liberalisation
16
Visuals: Chart 1, Revenue, USDbn: vertical bar chart with four bars on a horizontal baseline at about y 39.2% of slide height (x 5.5% to 46.4%). Bars left to right: 2014 red #DB0011 value 0.18 (bar about 1.7% tall); 2017 red value 0.22 (about 2.0% tall); 2020 target grey #C0C0C0 labelled c.0.5 (about 4.6% tall); Medium-term target light grey #C0C0C0 labelled >USD1bn (about 9.1% tall). No y-axis, no gridlines, no legend. Chart 2, Loans & advances to customers, USDbn: same format, baseline at about y 63.3%. Bars: 2014 red labelled 4.1 (about 2.6% tall); 2017 red labelled 6.2 (about 3.9% tall); 2020 target grey labelled >10bn (about 6.2% tall); Medium-term target #B4B4B4 labelled >20bn (about 12.2% tall). Red bars are the actuals, grey bars are targets. Right panel: three grey #B4B4B4 rectangular label blocks at x 53.6% w 12.4%: Emerging Middle Class (y 24.5% to 45.9%), Industrial up-grade / cross-border connectivity (y 48.2% to 67.7%), New business capabilities (y 69.8% to 89.3%), separated by two thin grey divider lines (#A0A0A0, about 0.1% thick) at y 47.0% and y 68.6%, spanning x 66.8% to 94.2%. Icon top-right: dark circular badge with a white rising bar chart and upward arrow.
Slide 17
Strategic priorities
Asia expected to be the largest creator of wealth
1C
Rising wealth in Asia
Middle class in Asia2
Private financial wealth1, USDtn
2016-21E
# of people, bn
CAGR
3.5
223
2.5x
2
1.4
1
2015
2030E
166
33%
5.6%
E. Europe
152
Average household annual income3
L. America
USD‘000
MENA
2.3x
32.6
33%
N. America
34%
14.5
22%
3.5%
2017
2030E
24%
3
7%
1.7%
W. Europe
25%
HNWI financial wealth4
9%
USDtrn
Japan
10%
2.0x
42.1
28%
9.9%
23%
Asia ex Japan
21%
20.8
2014
2016
2021E
2017
2025E
4
17
1.
BCG Global Wealth 2017
2.
Global Economy and Development: The Unprecedented Expansion of the Global Middle Class, 2017
3.
Euromonitor, disposable income by household
4.
Capgemini: Asia Pacific Wealth Report, 2017
Visuals: Chart 1 (left): stacked column chart titled 'Private financial wealth1, USDtn' with a column per year for 2014, 2016 and 2021E, plus a 2016-21E CAGR column of bubbles at right. Totals above columns: 2014 152, 2016 166, 2021E 223. Segments from bottom to top: Asia ex Japan (red #DB0011) 21% in 2014, 23% in 2016, 28% in 2021E; Japan (mid grey #B4B4B4) 10%, 9%, 7%; W. Europe (light grey #D7D8D6) 25%, 24%, 22%; N. America (dark grey #4B4B4B) 34%, 33%, 33%; MENA, L. America and E. Europe (thin blue segments, from #C2CFE3 light blue to #4A6FA5 dark blue) are unlabelled at the top of each column. Series labels at left of the 2014 column: E. Europe, L. America, MENA, N. America, W. Europe, Japan, Asia ex Japan, with thin leader lines to the top three segments. CAGR bubbles to the right of the 2021E column: N. America 5.6% (dark grey oval), W. Europe 3.5% (light grey oval), Japan 1.7% (mid grey oval), Asia ex Japan 9.9% (red oval, bold italic, white text), each with a thin grey leader line to its segment. No value axis; no legend (labels act as legend). Highlighted: the red Asia ex Japan series and its 9.9% CAGR bubble. Chart 2 (top right): 'Middle class in Asia2', unit '# of people, bn'. Grey bars (#B4B4B4) with value labels: 2015 1.4 and 2030E 3.5, on a black baseline. Oval callout '2.5x' with black arrow pointing up-right between the bars. Chart 3 (middle right): 'Average household annual income3', unit 'USD‘000'. Grey bars: 2017 14.5 and 2030E 32.6. Oval callout '2.3x' with black arrow. Chart 4 (bottom right): 'HNWI financial wealth4', unit 'USDtrn'. Grey bars: 2017 20.8 and 2025E 42.1. Oval callout '2.0x' with black arrow. No axis numbering or ranges are printed on any chart. Icon: top-right circular logo, dark charcoal circle (#333333) with a white rising bar chart and upward arrow.
Slide 18
Strategic priorities
HSBC is well-positioned to build a leading wealth business in Asia
1C
>USD1bn
>0.4bn
>0.1bn
Wealth in Asia already a USD5.1bn
business for HSBC today
Revenue (reported) in USDbn, Asia, 2017
Targeted revenue
growth by 2020
USD
Opportunities and areas of investment
Wealth management (across Private Bank and RBWM)
Wealth in
Asia
5.1
Hong Kong: Increase share in UHNW segment across Greater
China
Singapore: Accelerate client coverage / RM growth across all
segments including ASEAN new-to-bank / referred clients, and
Chinese offshore wealth
Private
Bank
0.7
China: Primary focus on Jade build-out underpinned by
investment in RM and product platform
Product: Leverage transactional banking, digital, discretionary
portfolio management and lombard lending
RBWM
Insurance
2.4
Wealth
Develop product range to address the needs of new wealth
customers, and strengthen front line
Deepen existing insurance specialist coverage, and open up new
distribution channels
Insurance1
1.8
Exploring opportunities in mainland China
Asset management
Leverage coverage of GB&M / CMB clients
Asset
Increase share of wallet and net new money growth via RBWM /
0.3
Management1
GPB customers
Growth in Alternatives and Sustainable Investing
Exploring opportunities in mainland China
1
18
1
1.
Includes manufacturing revenue only
Visuals: Floating-bar (waterfall-style) chart, horizontal bars stacked vertically, titled 'Wealth in Asia already a USD5.1bn business for HSBC today' with subtitle 'Revenue (reported) in USDbn, Asia, 2017'. Vertical black axis line at about x 16.4 % running from y 27 % to y 92 %; no numeric axis scale or ticks. Five categories top to bottom with printed values: Wealth in Asia 5.1 (solid red #DB0011 bar from the axis, about 14.2 % of slide width, total bar, highlighted); Private Bank 0.7 (grey #B4B4B4 floating bar, about x 28.7-30.6 %, label 0.7 inside bar); RBWM Wealth 2.4 (grey floating bar, about x 22.1-28.7 %, label inside); Insurance 1.8 (grey floating bar, label inside, about x 17.2-22.1 %); Asset Management 0.3 (thin grey bar at the axis, label 0.3 beside it). Thin grey dotted connector lines link the bar ends between rows. No legend for the chart itself. Top-right legend of three small square groups with black outline: '>USD1bn' with three red filled squares, '>0.4bn' with two red and one white square, '>0.1bn' with one red and two white squares. Right column 'Targeted revenue growth by 2020' with USD heading and square markers per row: Wealth management row red, red, white; Insurance row red, red, white; Asset management row red, white, white. Bulleted red square markers (Wingdings) for each opportunity item. Top-right circular icon: dark charcoal #2B2B2B filled circle with a white bar-chart-with-upward-arrow glyph, about x 94.2-99.4 %, y 1.5-8.9 %.
Slide 19
Strategic priorities / UK presents an opportunity for growth after successful / completion of ring-fencing / >USD1bn / >0.4bn / >0.1bn / Targeted / revenue / growth by / 2020 / Ring-Fenced Bank setup / close to completion / Opportunities and areas of investment / USD / HSBC is positioned for sustainable growth; 14% deposit market share1 and a 7% mortgage market share2 / UK ring-fencing remains on track ahead of the July 2018 legal separation - six months ahead of the regulatory deadline: / On the 21 May 2018, the High Court approved the UK Ring-Fenced Transfer Scheme / More than 95% of technical and IT related transfers have already been successfully completed / Retail banking / Target mortgage growth (high single digit) by embedding controlled intermediary channel expansion3 / Enhancing the multi-brand strategy to drive growth and acquire new customers / Corporate banking / Leverage our unique global access to support commercial customers' trade and overseas banking needs / Improve penetration of mid market segment through additional on-boarding capacity and renewed focus on 'fast growth cities or sectors' / Improve CRM and data analytics to drive better value segmentation of clients (in particular Business Banking) / Digital and customer satisfaction / Target a consistent top 3 position in the UK for customer satisfaction, via journey improvements, digital investment and simplification / Capitalise on AI, Data analytics and Open Banking to develop immersive customer experiences (e.g., Connected Money app) / Grow collaboration opportunities across business lines and brands / 1. Source: CACI Retail Finance Benchmark, 2017 / 2. Source: Council of Mortgage Lenders (CML), 2017 / 3. No change in risk appetite / 19
Visuals: Three grey row boxes (#D7D8D6) in the centre column each hold a black circular-outline icon and a bold label: Retail banking (icon of a hand holding a banknote with a dollar sign), Corporate banking (icon of a building beside a standing businessman with briefcase), Digital and customer satisfaction (icon of a thumbs-up). Right of the centre column, a phone illustration (white handset with rounded corners, red bank logo tile in the centre with the tagline 'Your banks. Your accounts. Together in one place.' and four small coloured app icons above: a blue money bag, a green piggy bank, a red wallet and a purple building) overlaps the lower right of the centre area. Red square markers show the targeted revenue growth: next to Retail banking, 2 filled red squares and 1 empty square; next to Corporate banking, 2 filled red squares and 1 empty square. Legend at top right: 3 filled red squares = >USD1bn; 2 filled and 1 empty = >0.4bn; 1 filled and 2 empty = >0.1bn. Top-right corner shows a dark grey circular logo with white rising bar-chart and arrow icon.
Slide 20
Strategic priorities / Proven ability to grow the business and gain market share; invest / 3 / for growth from our international network / >USD1bn / >0.4bn / >0.1bn / Targeted revenue / growth by 2020 / Investments are delivering / Opportunities and areas of investment / 2015 / 2017 / Global Trade and Receivables Finance / Trade Finance rank1 / #1 / #1 / Hong Kong market share2 / 10.8% / 13.8% / Global Liquidity and Cash Management / Average GLCM balances / c$470bn / c$530bn / Hong Kong market share3 / 22.8% / 26.3% / FX / FX corporates rank4 / #1 / #1 / FX institutional rank4 / #7 / #3 / Securities Services / Assets under custody / $6.2trn / $7.7trn / Market share5 / 5.4% / 5.8% / Asia rank6 / #1 / #1 / Digitise and grow Trade Finance / Transform technology and business model, enabling simpler, safer and faster experiences for clients, and seamless communication with trade ecosystems / Capitalise on growth outlook for structured trade by investing in our channel and product capabilities / Extend No 1 position in both traditional and structured trade / Strengthen global leadership position in GLCM / Drive sustained deposit and transaction growth by leveraging API and cloud to transform payments, liquidity and data propositions / Create new products and revenue streams - new propositions powered by machine learning, offsetting competitive pressures in traditional fees / FX business growth / Grow the business through the continued development of 'FX as a service' engagement model / Utilise technology to deliver efficiencies and digitise the customer experience / Grow Securities Services business / Evolve business by enhancing and develop products and services; invest in digital future / Grow core business with Group clients, focus on asset managers and asset owners / 1. Oliver Wyman / 2. Hong Kong Monetary Authority / 3. Oliver Wyman / 4. Greenwich Survey / 5. Based on AUC of Top 9 providers (BM, SS, JPM, Citi, BP2S, SG, NT, RBC, HSBC) making up c.82% of the market / 6. Assets Under Custody (AUC), EY, based on data provided by HSBC and Tricumen / 20
Visuals: Table on the left with rows grouped by category: Global Trade and Receivables Finance (Trade Finance rank 1: 2015 #1, 2017 #1, green tick; Hong Kong market share 2: 10.8% to 13.8%, green up arrow); Global Liquidity and Cash Management (Average GLCM balances: c$470bn to c$530bn, green up arrow; Hong Kong market share 3: 22.8% to 26.3%, green up arrow); FX (FX corporates rank 4: #1 to #1, green tick; FX institutional rank 4: #7 to #3, green up arrow); Securities Services (Assets under custody: $6.2trn to $7.7trn, green up arrow; Market share 5: 5.4% to 5.8%, green up arrow; Asia rank 6: #1 to #1, green tick). Values sit in white outlined ellipses with thin black outlines. Green icons are #00B050 Wingdings ticks and block arrows. Legend at top right has three rows of three small squares: filled red squares for >USD1bn (three filled), two filled and one white for >0.4bn, one filled and two white for >0.1bn. Right column squares per block in red and white: Digitise and grow Trade Finance three filled? shows two red and one white; Strengthen global leadership shows three red; FX business growth shows one red and two white; Grow Securities Services business shows two red and one white. Top-right corner icon: a dark charcoal circle (about #2B2B2B) with white bar chart and rising arrow. No photographs.
Slide 21
Strategic priorities
4
The US is the single biggest exporter of revenue to the Group and
an important part of HSBC’s proposition as leading international bank
US biggest exporter of client revenue to the Group
Significant for HSBC’s global franchise
Cross-border GB&M and CMB client revenue1, 2017,
USDbn
Outbound client revenue: client revenue booked outside
of the country where client is managed
Client revenue from US-managed
companies booked outside US
Other
32%
USD
68%
USD represents
68% of
payments
volume for
HSBC2
17.1%
16.2%
10.4%
9.4%
9.2%
HSBC top 5
cross-border
USD clearer3
JP
Morgan
Citigroup
Bank of
America
HSBC
BoNY
Mellon
c.19% of
HSBC
custody
assets
denominated
in USD
c.19%
29%
16%
16%
Overall
Hong Kong
Germany
UK
2
1
0
US
UK
China
France
Hong
Kong
% of Group client outbound revenue
24%
13%
9%
6%
6%
1.
Client revenue is sourced from HSBC internal client MI. Client revenue excludes Business Banking and differs from reported revenue
2.
Internal HSBC data and SWIFT
3.
Clearing House Interbank Payments System (CHIPS)
21
Visuals: Three charts and one icon. (1) Left: vertical bar chart titled Cross-border GB&M and CMB client revenue, 2017, USDbn, with a callout 'Client revenue from US-managed companies booked outside US' pointing to the US bar. Y-axis labelled 0, 1, 2 (USDbn, range 0 to about 2.5, no unit label printed on axis). Five categories: US, UK, China, France, Hong Kong. No values printed on the bars; estimates: US about 2.4, UK about 1.2, China about 0.9, France about 0.5, Hong Kong about 0.5. Bars are grey #B4B4B4 except the US bar, which is red #DB0011 and highlighted. Beneath the axis a caption reads '% of Group client outbound revenue' with pill labels 24% (red pill, white bold text, highlighted), 13%, 9%, 6%, 6% (light grey pills #D9D9D9, black text) under US, UK, China, France, Hong Kong. (2) Top right: pie chart with two slices, USD 68% in red #DB0011 with white label, and Other 32% in grey #B4B4B4 with black label; a thin white separator at the 12 o'clock edge; labels 'USD' and 'Other' sit outside the slices. Pie title is the grey box text 'USD represents 68% of payments volume for HSBC'. (3) Middle right: vertical bar chart with values 17.1% JP Morgan, 16.2% Citigroup, 10.4% Bank of America, 9.4% HSBC (red #DB0011, bold label, bold category name), 9.2% BoNY Mellon; all bars grey #B4B4B4 except HSBC; baseline is a thin dark grey line; no y-axis. (4) Bottom right: vertical bar chart with bars Overall c.19% (dark grey #4A4A4A, bold label), Hong Kong 29%, Germany 16%, UK 16%; bars grey #B4B4B4 except Overall; baseline thin dark grey line; no y-axis. (5) Top right corner: circular black icon with a white dollar sign inside and two curved black arrows forming a cycle around it.
Slides 22 to 32 continue in the full text file.
Download this deck
The hosted PDF of every library deck is free for readers of the SlideDeck Co newsletter. Join with your email and the viewer and download appear here.
Preparing a strategy presentation of your own? The SlideDeck Co Consulting Deck is a slide library with a statement of work and a worked client case.