
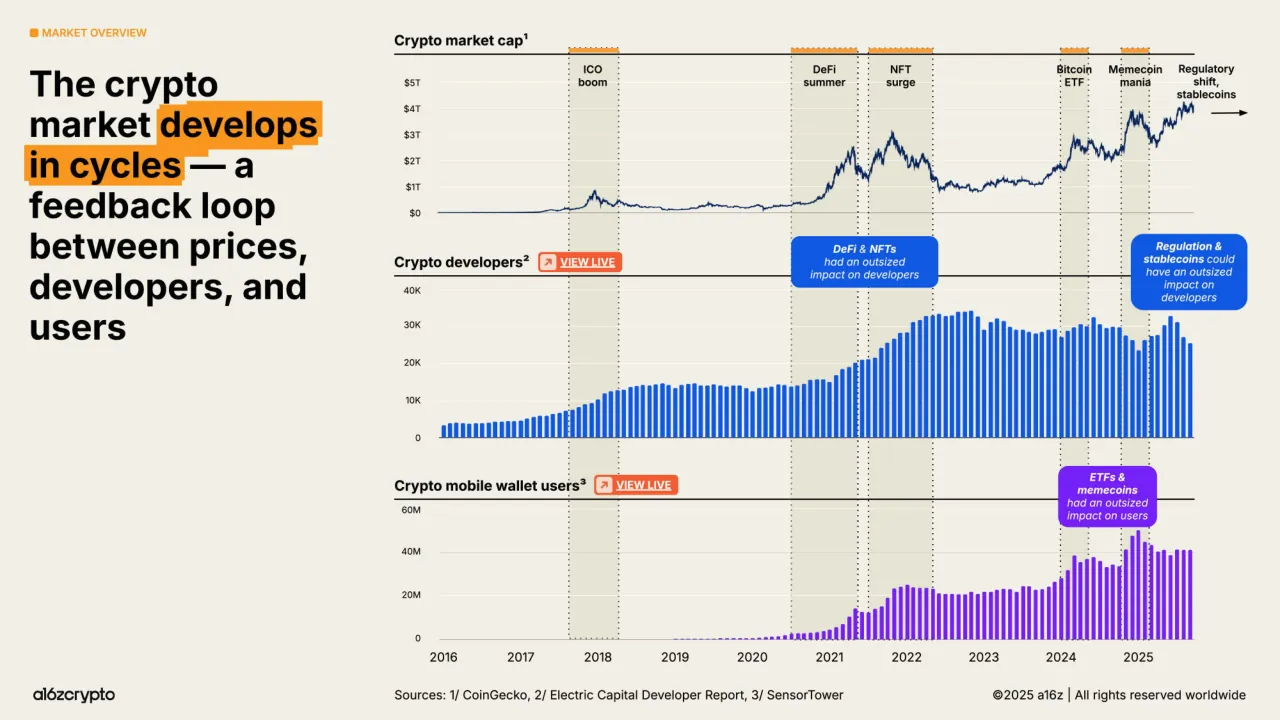
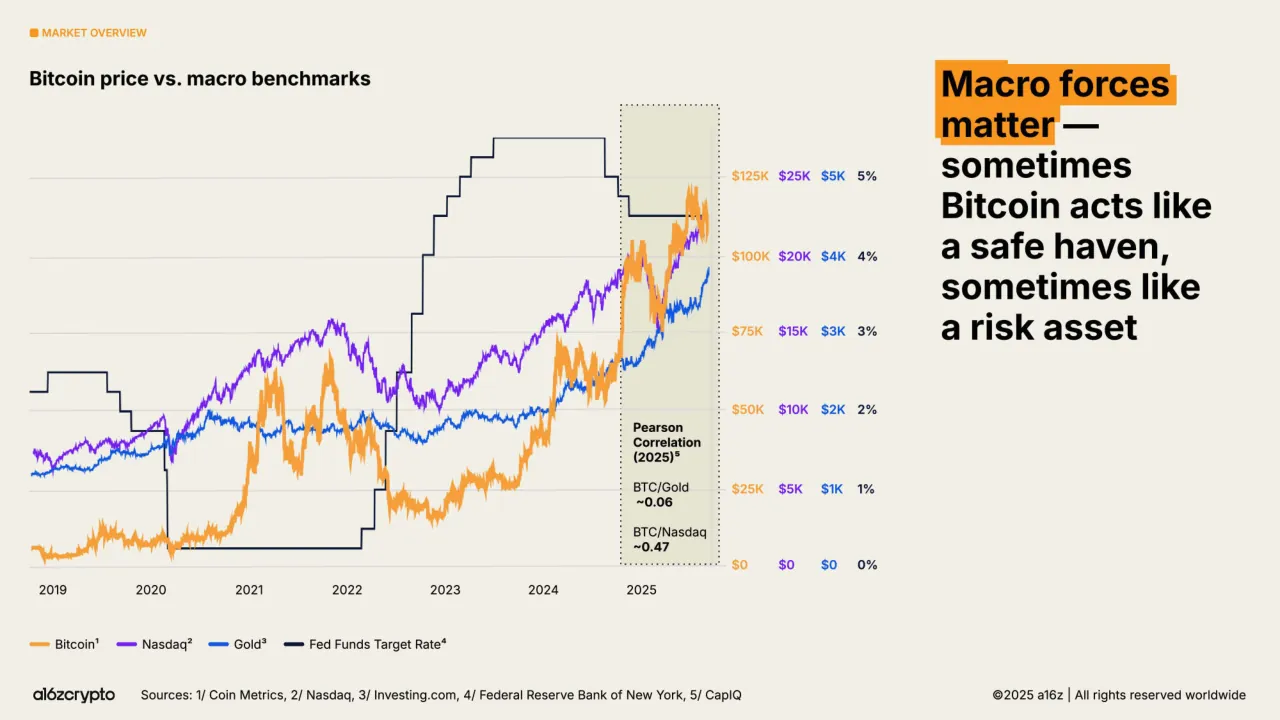
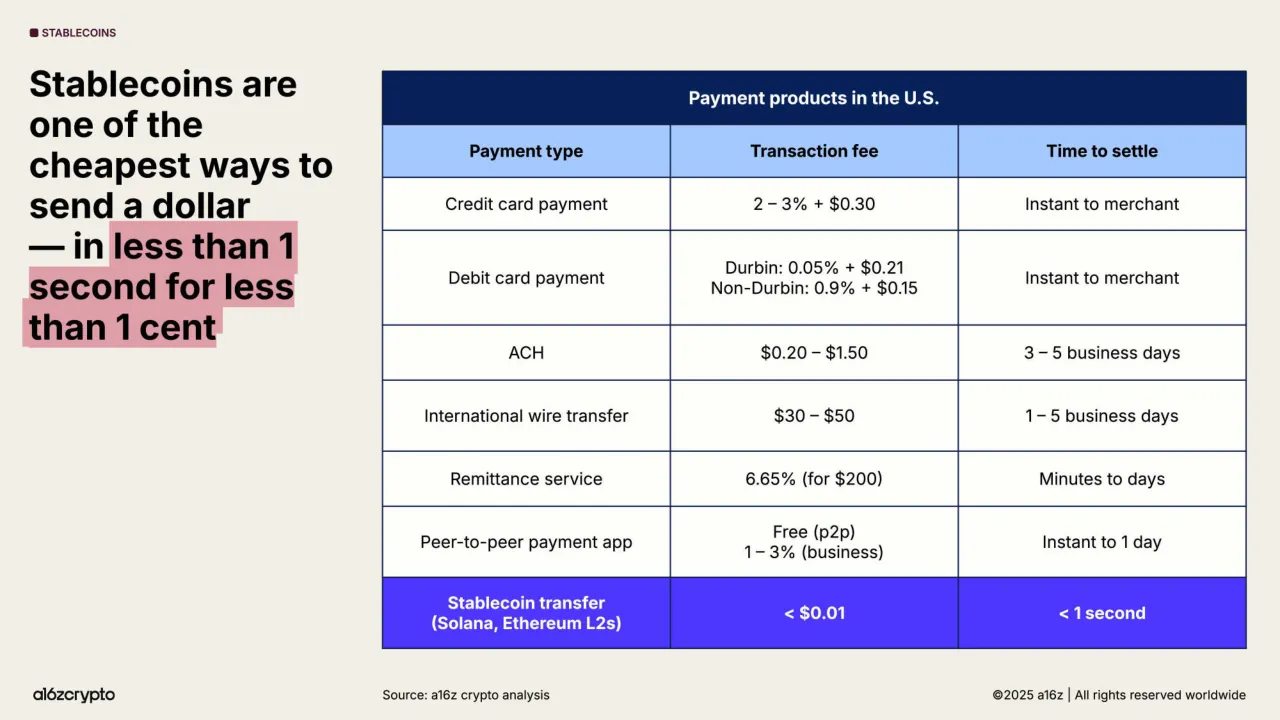
The deck opens with a title slide, a full-page disclosures slide, and a contents page listing nine sections. It moves through the crypto market's size and cycles, institutional adoption by banks, asset managers and payment firms, the growth of stablecoins, applications such as decentralized exchanges, real-world assets and prediction markets, blockchain infrastructure and throughput, the convergence of crypto with AI, the US regulatory environment, and a preview of a live dashboard. Each section opens with a numbered divider slide, and most content slides pair a headline-style claim with a single chart or table. The closing sections give a list of nine forecasts for 2025 and beyond, followed by a call-to-action slide linking to the podcast, newsletter and social channels. Slides worth studying include the market cycle chart on slide 5, which annotates events directly on the data, the stablecoin payment comparison on slide 19, and the Bitcoin versus macro benchmarks chart on slide 8, where a highlighted correlation box carries the takeaway.
Slides worth studying
Questions about this deck
What does the a16z crypto State of Crypto 2025 deck say about the cost and speed of stablecoin payments compared with other U.S. payment products?
Slide 19 says stablecoins are one of the cheapest ways to send a dollar, with a stablecoin transfer on Solana or Ethereum L2s costing less than $0.01 and settling in less than 1 second. By comparison, the slide lists an ACH transfer at $0.20 to $1.50 settling in 3 to 5 business days.
How many slides does the a16z crypto State of Crypto 2025 deck have, and how is it structured?
The deck has 54 pages. Slide 3 is the contents page, listing nine sections from the crypto market's size through to what is next for crypto.
What does the a16z crypto State of Crypto 2025 deck say about stablecoin supply and its projected growth?
Slide 23 gives stablecoin supply today as $326 billion, citing Allium as of 9/30/2025. It also shows a projected stablecoin supply by 2030 of $1.6 to $3.7 trillion, attributed to Citi.
What does the a16z crypto State of Crypto 2025 deck say about institutional capital in Bitcoin and Ethereum ETFs?
Slide 14 states that Bitcoin and Ethereum ETFs hold over $175 billion in onchain assets. The slide breaks this down as $150 billion in Bitcoin ETF holdings and $28 billion in Ethereum ETF holdings.
Details
- Company: a16z crypto
- Year: 2025
- Type: Report-style deck
- Industry: Crypto and blockchain
- Pages: 54
More from a16z crypto
All a16z crypto decks in the library
Review score: 8 out of 10, Strong
Presentation quality, judged with the SlideDeck Co review heuristic. Ask, evidence and idea merit are not rated here.
The deck has a clear route: nine numbered sections with colour-coded dividers, a contents page, and a closing forecasts slide and call to action. Most content slides pair a claim headline with one chart, and highlighted key phrases make each takeaway easy to find, as on slides 5, 8 and 19. The system is applied consistently across 54 pages, with annotated charts, a highlighted row on the table in slide 19, and direct labels. Weaknesses are a title slide where a purple and blue block overlaps the word STATE, a disclosures page of tiny text, and several dense or tiny-text slides (9, 38, 39, 40, 48) that need a reading setting rather than a live room.
Worth keeping: Keep the claim-headline plus single-chart pattern, the highlighter emphasis on key phrases, and the annotated charts on slides 5, 8 and 19, which carry the takeaway visually.
Most useful repair: Fix the overlapping block that obscures the word STATE on slide 1, and enlarge or split the tiny-text slides, especially the ZK timeline on slide 39, the privacy slide 38 and the legal slide 48.
What would change the score: I would cut the long disclosures text on slide 2 to a short notice with a link, and simplify the multi-panel slides (9, 21, 45) so each carries one chart.
Confidence high. 54 of 54 pages inspected on contact sheets, 4 at readable size. Reviewed 2026-11-08. Model-assisted review (claude-sonnet-5-5).
Full text of the slides (54 slides)
Every slide's words and a description of its charts and images, so the deck can be searched and rebuilt. Also available as Markdown.
Slide 1
STATE Of CRYPTO / 2025 / a16zcrypto / ©2025 a16z | All rights reserved worldwide
Visuals: A green stepped (notched) band shape spanning the slide width behind the title, with a light periwinkle rounded rectangle and a violet/purple rectangle overlapping the 'TATE' letters of the title at upper-left of the title block, forming a blue-violet overlay. The a16zcrypto wordmark logo at bottom-left in black. The title is set in a condensed black heavy grotesque with the word 'Of' in a black high-contrast italic serif. The stepped green band has square-cornered notches with small rounded corners.
Slide 2
STATE OF CRYPTO 2025
IMPORTANT DISCLOSURES
The views expressed here are those of the individual AH Capital Management, L.L.C. ("a16z") personnel quoted and are not the views of a16z or its affiliates. Certain information contained in here has been obtained from third-party sources, including from portfolio companies of funds managed by a16z. While taken from sources believed to be reliable, a16z has not independently verified such information and makes no representations about the enduring accuracy of the information or its appropriateness for a given situation.
This content is provided for informational purposes only, and should not be relied upon as security, legal, business, investment, or tax advice, nor as an endorsement of any such practices, products or services. There can be no guarantees or assurances that the views expressed here will be applicable for any particular facts or circumstances, and they should accordingly not be relied upon in any manner. You should consult your own advisers as to those matters. References to any securities, digital assets, tokens, and/or cryptocurrencies are for illustrative purposes only and do not constitute a recommendation to invest in any such instrument nor do such references constitute an offer to provide investment advisory services. Furthermore, this content is not directed at nor intended for use by any investors or prospective investors, and may not under any circumstances be relied upon when making a decision to invest in any fund managed by a16z. (An offering to invest in an a16z fund will be made only by the private placement memorandum, subscription agreement, and other relevant documentation of any such fund and should be read in their entirety.) Any investments or portfolio companies mentioned, referred to, or described are not representative of all investments in vehicles managed by a16z, and there can be no assurance that the investments will be profitable or that other investments made in the future will have similar characteristics or results. A list of investments made by funds managed by Andreessen Horowitz (excluding investments for which the issuer has not provided permission for a16z to disclose publicly as well as unannounced investments in publicly traded digital assets) is available at https://a16z.com/investments/.
Charts and graphs provided within are for informational purposes solely and should not be relied upon when making any investment decision. Past performance is not indicative of future results. The content speaks only as of the date indicated; all figures are as of September 30, 2025, unless otherwise noted. Any projections, estimates, forecasts, targets, prospects, and/or opinions expressed in these materials are subject to change without notice and may differ or be contrary to opinions expressed by others. Please see https://a16z.com/disclosures for additional important information.
a16zcrypto
©2025 a16z | All rights reserved worldwide
Visuals: One logo: the a16zcrypto wordmark in black lowercase sans-serif, bottom-left, about 6.4% of slide width. No charts, photographs or illustrations. The body contains three inline hyperlinks (https://a16z.com/investments/ and https://a16z.com/disclosures) rendered in purple-blue underlined text.
Slide 3
STATE OF CRYPTO 2025 / CONTENTS / 01 / THE CRYPTO MARKET IS BIG (AND GROWING) / 02 / 2025: THE YEAR OF INSTITUTIONAL ADOPTION / 03 / STABLECOINS HAVE GONE MAINSTREAM / 04 / THE WORLD IS COMING ONCHAIN / 05 / INFRASTRUCTURE IS (ALMOST) READY FOR PRIME TIME / 06 / AI AND CRYPTO ARE CONVERGING / 07 / THE CRYPTO INDUSTRY IN AMERICA IS STRONGER THAN EVER / 08 / INTRODUCING: THE NEW STATE OF CRYPTO DASHBOARD / 09 / WHAT’S NEXT FOR CRYPTO? / a16zcrypto / ©2025 a16z | All rights reserved worldwide
Visuals: One decorative visual: a stepped green block mass (flat #52DB8E, rounded inner corners) occupying the left side from the slide edge to about 37% width and from about 10% to 61% height, sitting behind the title, with the lower letters of CONTENTS overlapping it. There are nine small rounded colour squares, one per contents row, at the right of each row: 01 orange #F7931E, 02 yellow #F5D06F, 03 dark plum #4A0E2E, 04 peach #FFBFA0, 05 magenta #D6006E, 06 green #52DB8E, 07 lilac #E07BF0, 08 dark plum #4A0E2E, 09 peach #FFBFA0. No photographs, charts or tables.
Slide 4
01 / SECTION 01 / THE CRYPTO / MARKET IS BIG / (AND GROWING) / a16zcrypto / ©2025 a16z | All rights reserved worldwide
Visuals: Two graphic elements. (1) A large numeral '01' in a heavy geometric sans, shown semi-transparent cream, sitting over a blue stepped-outline block. The '0' spans about x 66% to 84% and the '1' about x 86% to 96.5%, both from y 5% to 43%. Where the numerals overlap the navy background they appear tan (#D9CCB7); where they overlap the blue block they appear cream (#F4F1EB), so the numerals are a translucent cream fill of roughly 80% opacity. (2) A flat orange section-tab shape in the top-left with stepped, notched outline and rounded inner and outer corners, carrying the label SECTION 01. The blue block behind the numerals has a stepped top-left and bottom edge with small rounded corners, and the numeral 0 has a navy-blue counter showing through the blue block.
Slide 5
MARKET OVERVIEW
The crypto / market develops / in cycles — a / feedback loop / between prices, / developers, and / users
Crypto market cap¹
$5T / $4T / $3T / $2T / $1T / $0
ICO / boom
DeFi / summer
NFT / surge
Bitcoin / ETF
Memecoin / mania
Regulatory / shift, / stablecoins
Crypto developers²
40K / 30K / 20K / 10K / 0
VIEW LIVE
DeFi & NFTs / had an outsized / impact on developers
Regulation & / stablecoins could / have an outsized / impact on / developers
Crypto mobile wallet users³
60M / 40M / 20M / 0
VIEW LIVE
ETFs & / memecoins / had an outsized / impact on users
2016 2017 2018 2019 2020 2021 2022 2023 2024 2025
Sources: 1/ CoinGecko, 2/ Electric Capital Developer Report, 3/ SensorTower
©2025 a16z | All rights reserved worldwide
Visuals: Three stacked charts sharing an x-axis from 2016 to 2025. (1) Line chart titled Crypto market cap¹, y-axis $0 to $5T with gridlines at $1T steps, dark navy #0B1F3A line that rises from near $0 in 2016 to a peak of about $4.2T at the right edge, with local peaks about $0.9T in early 2018, about $2.5T in late 2021, about $3.1T in early 2022, and about $3.9T in 2025; no legend. Highlighted periods are beige-grey bands (#E4E1CC) with dotted black borders and orange tops labelled ICO boom (2017 to 2018), DeFi summer (2021 to 2021.5), NFT surge (2021.5 to 2022.4), Bitcoin ETF (2024 to 2024.4), Memecoin mania (2025 to 2025.2); a black arrow at the right end points right beyond the 2025 mark. (2) Bar chart titled Crypto developers², y-axis 0 to 40K with gridlines at 10K steps, royal blue #1A5BE0 bars, monthly from 2016 to 2025; values about 3K in 2016 rising to about 8K in 2018, about 14K in 2019, about 14K in 2020, about 20K in 2021, about 33K in 2022 peak, about 28K to 30K in 2023 to 2024, about 25K to 33K in 2025. Highlighted bands repeat from the top chart. (3) Bar chart titled Crypto mobile wallet users³, y-axis 0 to 60M with gridlines at 20M steps, violet #7B2FF7 bars; near 0 until 2020, about 2M in early 2021, about 13M in mid 2021, about 22M in 2022 to 2023, about 25M in 2024, rising to about 45M to 50M in 2025 with a peak near 50M. Two orange-red VIEW LIVE buttons (#F05A28) sit beside the developer and wallet chart titles. Three rounded callout boxes overlay the charts: blue DeFi and NFTs callout, blue Regulation and stablecoins callout, purple ETFs and memecoins callout.
Slide 6
MARKET OVERVIEW
Share of global crypto market capitalization
100%
75%
50%
25%
0%
2014
2016
2018
2020
2022
2024
Other
Dogecoin
Cardano
USDC
Solana
BNB Chain
Tether
Ripple
Ethereum
Bitcoin
Bitcoin still dominates — it continues to represent more than half of crypto's total market cap
a16zcrypto
Source: CoinGecko
©2025 a16z | All rights reserved worldwide
Visuals: Stacked 100% area chart titled 'Share of global crypto market capitalization'. X-axis: years 2014 to 2024 labelled at 2-year intervals, spanning roughly mid-2013 to late 2025. Y-axis: share of total crypto market cap in percent, 0% to 100%, gridlabels at 0%, 25%, 50%, 75%, 100%. Series, back to front from top: Other (grey, top band, about 12% at 2018 and about 10-12% at latest), Dogecoin (yellow), Cardano (dark red), USDC (violet), Solana (navy), BNB Chain (light blue), Tether (pink), Ripple (mint green), Ethereum (blue), Bitcoin (orange, bottom band). Bitcoin band is about 94% at 2014, about 35% at the 2018 low, about 70% at 2020, about 37% at 2022 low, and about 57% at the latest point. Legend: vertical list at lower right with coloured squares in the order Other, Dogecoin, Cardano, USDC, Solana, BNB Chain, Tether, Ripple, Ethereum, Bitcoin. A black circular Bitcoin logo with a white B symbol sits inside the chart at lower right, overlapping the Bitcoin band. No highlighted points.
Slide 7
MARKET OVERVIEW / U.S. tech companies and global commodities like Bitcoin anchor the modern economy / Top assets by market cap / Gold / NVIDIA / Microsoft / Apple / Google / Silver / Amazon / Bitcoin / Gold is 11x bitcoin / Meta / Saudi Aramco / $0 / $10T / $20T / $30T / a16zcrypto / Source: Companiesmarketcap.com (as of 9/30/2025) / ©2025 a16z | All rights reserved worldwide
Visuals: Horizontal bar chart titled 'Top assets by market cap', with no axis titles. The value axis runs from $0 to $30T with labelled gridlines at $0, $10T, $20T and $30T; the vertical gridlines are thin light beige-grey lines. The category axis lists, top to bottom: Gold, NVIDIA, Microsoft, Apple, Google, Silver, Amazon, Bitcoin, Meta, Saudi Aramco. Values are not printed, so estimates are: Gold about $26T; NVIDIA about $4.5T; Microsoft about $3.8T; Apple about $3.8T; Google about $3.0T; Silver about $2.7T; Amazon about $2.4T; Bitcoin about $2.4T; Meta about $1.9T; Saudi Aramco about $1.7T. Bars are solid blue (#1059E3), except Amazon, which is a slightly lighter blue (#2356E0), and Bitcoin, which is highlighted in orange (#F7931E). There is no legend. A pale khaki right-pointing block arrow (#E8E6D4, no outline) runs from just past the Bitcoin bar end at about $2.6T to about $25.5T in the Bitcoin row, with the bold orange label 'Gold is 11x bitcoin' centred on it. The arrow is drawn over the gridlines. No photographs, icons or other graphics appear; the a16zcrypto logo is a black wordmark at bottom left.
Slide 8
MARKET OVERVIEW
Bitcoin price vs. macro benchmarks
$125K / $25K / $5K / 5%
$100K / $20K / $4K / 4%
$75K / $15K / $3K / 3%
$50K / $10K / $2K / 2%
$25K / $5K / $1K / 1%
$0 / $0 / $0 / 0%
2019 2020 2021 2022 2023 2024 2025
Pearson Correlation (2025)5
BTC/Gold ~0.06
BTC/Nasdaq ~0.47
Bitcoin1 Nasdaq2 Gold3 Fed Funds Target Rate4
Macro forces matter — sometimes Bitcoin acts like a safe haven, sometimes like a risk asset
alа16zcrypto
Sources: 1/ Coin Metrics, 2/ Nasdaq, 3/ Investing.com, 4/ Federal Reserve Bank of New York, 5/ CapIQ
©2025 a16z | All rights reserved worldwide
Visuals: Multi-series line chart titled 'Bitcoin price vs. macro benchmarks'. Four series over time from about 2019 to late 2025: Bitcoin (orange, jagged, rising from about $5K-$10K in 2019 to peaks near $70K in 2021, a dip to about $20K in 2022, and a rise to about $110K-$120K in 2025), Nasdaq (purple, rising from about 2019 index-equivalent of $5K-$10K scale to about $20K-$25K scale by 2025, with a peak near 2021 and a dip in 2022), Gold (blue, relatively flat in 2019-2024 then rising to about $4K-$5K scale by 2025), and Fed Funds Target Rate (dark navy stepped line, from about 0% in 2020-2022 to about 5% peak in 2023-2024 and stepping down to about 4.5% in 2025). Left axes are unlabelled in-chart; right-hand value scales read: Bitcoin $0 to $125K in steps of $25K, Nasdaq $0 to $25K, Gold $0 to $5K, Fed rate 0% to 5% in 1% steps. Horizontal light grey gridlines at each step. A shaded olive-beige rectangle with dotted border highlights the 2025 region, containing the Pearson correlation box: 'Pearson Correlation (2025)5', 'BTC/Gold ~0.06', 'BTC/Nasdaq ~0.47'. Legend beneath chart with four entries: orange Bitcoin1, purple Nasdaq2, blue Gold3, navy Fed Funds Target Rate4. No photographs or icons apart from the small logo.
Slide 9
MARKET OVERVIEW
Crypto is global — but onchain activity is growing fastest in developing countries
Mobile wallet usage,1 an indicator of onchain activity, comes largely from developing countries
Token-related web traffic,2 an indicator of interest in tokens, comes largely from developed countries
100%
75%
50%
25%
0%
2018
2020
2022
2024
Other
Peru
Indonesia
Pakistan
Philippines
Thailand
Argentina
Colombia
India
Nigeria
United States
1/ Monthly active mobile crypto wallet users (Source: SensorTower)
Source country / Avg % of web traffic from each country / Country population / % of web traffic per 1 billion people
Australia 1.99% 26,660,000 74.63
South Korea 3.80% 51,710,000 73.48
United Kingdom 4.25% 68,350,000 62.15
Canada 2.42% 40,100,000 60.23
United States 13.85% 340,100,000 40.73
Spain 1.89% 48,350,000 39.12
Germany 3.03% 83,280,000 36.44
France 2.22% 68,290,000 32.55
Vietnam 3.08% 100,400,000 30.66
Russia 3.28% 143,800,000 22.80
Indonesia 5.63% 281,200,000 20.02
Turkey 1.59% 85,330,000 18.61
Nigeria 2.81% 227,900,000 12.33
Brazil 2.09% 211,100,000 9.90
India 6.53% 1,438,000,000 4.54
2/ The % of web traffic coming from each country was calculated across the top 30 tokens on CoinGecko, using the project’s listed website. Bitcoin, stablecoins, and other unconventional tokens were excluded. (Source: SimilarWeb as of 9/30/2025)
©2025 a16z | All rights reserved worldwide
a16zcrypto
Visuals: Left: a 100% stacked area chart titled by its subtitle 'Mobile wallet usage, an indicator of onchain activity, comes largely from developing countries'. Y axis labelled 0%, 25%, 50%, 75%, 100% (share of monthly active mobile crypto wallet users); X axis labelled 2018, 2020, 2022, 2024, running to about 2025 with no unit label. Series from top to bottom of the stack: Other (grey-blue, about 35% to 40% at 2018 rising to about 33% to 40% at the end, the largest band throughout), Peru, Indonesia, Pakistan, Philippines, Thailand, Argentina, Colombia, India, Nigeria, United States (navy, bottom band, about 40% at 2018, dropping to about 12% to 18% in 2020 to 2025, peaking near 30% in 2021). Nigeria (bright blue) is the second band from the bottom, about 10 to 20 points thick in 2020 to 2024. India (orange) is about 5 to 10 points thick in 2021 to 2024. Colombia (yellow) appears from about 2023, about 5 to 8 points. Philippines (magenta) peaks near 10 points around 2021 to 2022. Legend sits to the right of the plot as a vertical list with coloured squares, in the order listed. No highlighted points. Right: a table with four columns and sixteen rows including a header, described in the text field. The last column is shaded on a red-to-green scale, green for the highest values (Australia, South Korea), yellow in the middle (United States, Spain, Germany, France), orange for Vietnam, Russia, Indonesia, Turkey, and red for Nigeria, Brazil, India.
Slide 10
MARKET OVERVIEW
Crypto is multichain, with Ethereum (and its L2s), Solana, and Bitcoin
attracting the most developers
Top blockchains by builder interest¹
VIEW LIVE
Ethereum
Base
Solana
Bitcoin
Polygon
Arbitrum
Optimism
Hyperliquid
Avalanche
TON
0%
5%
10%
15%
20%
Top blockchains by monthly open source developers²
Ethereum
Solana
Bitcoin
Base
Polygon
Cosmos
Polkadot
Arbitrum
Sui
BNB Chain
0
2.5K
5K
7.5K
1/ Builder interest reflects the blockchains that founders tell us they are — or are interested in — building on, based on a16z investment team analysis. Includes companies analyzed over the past year, and may not represent the total builder population. Data is as of 9/30/2025.
2/ Monthly open source developers is based on original code authors in community-tagged public crypto repositories on GitHub, sourced from Electric Capital’s Developer Report. Data is as of 9/30/2025.
a16zcrypto
©2025 a16z | All rights reserved worldwide
Visuals: Two horizontal bar charts with logo badges. Left chart: title 'Top blockchains by builder interest' with superscript 1 and a 'VIEW LIVE' button; value axis 0% to 20% with gridlines at 5% intervals (0%, 5%, 10%, 15%, 20%); single series in blue bars, sorted descending. About values: Ethereum about 23.5%, Base about 17.3%, Solana about 16.9%, Bitcoin about 4.9%, Polygon about 4.9%, Arbitrum about 4.4%, Optimism about 2.6%, Hyperliquid about 2.6%, Avalanche about 2.1%, TON about 2.1%. No values are printed; all are estimates. Each category label has a circular white-outlined chain logo at the bar baseline: Ethereum diamond, Base white square, Solana three stacked bars, Bitcoin B symbol, Polygon chain links, Arbitrum stylised A, Optimism 'OP' text, Hyperliquid wing-like mark, Avalanche triangle, TON diamond-shaped mark. Right chart: title 'Top blockchains by monthly open source developers' with superscript 2; value axis 0 to 7.5K with ticks at 0, 2.5K, 5K, 7.5K; single series in purple bars, sorted descending. About values: Ethereum about 9,100, Solana about 3,850, Bitcoin about 2,500, Base about 1,550, Polygon about 1,480, Cosmos about 1,300, Polkadot about 1,000, Arbitrum about 980, Sui about 750, BNB Chain about 650. No values are printed; all are estimates. Logos: Ethereum diamond, Solana three bars, Bitcoin B, Base square, Polygon links, Cosmos atom-like symbol, Polkadot ring, Arbitrum A, Sui droplet, BNB Chain cube. Light vertical gridlines are drawn behind both charts; the zero axis is a dark vertical line where the logos sit.
Slide 11
MARKET OVERVIEW / We estimate that the number of monthly active crypto users / has grown to 40-70 million / 716M / Global crypto owners¹ / 181M / Monthly active addresses² / 40–70M / Estimated monthly active users³ / ~10 million users added in the last year / 1/ Represents people who own crypto but do not necessarily transact onchain. Source: Crypto.com as of 8/31/2025 / 2/ Represents the number of distinct active (sending) addresses across tracked blockchains. Source: Allium as of 9/30/2025 / 3/ Represents the number of unique people who transact onchain monthly. Source: a16z crypto analysis as of 9/30/2025 / a16zcrypto / ©2025 a16z | All rights reserved worldwide
Visuals: Nested semicircle chart with no axes or legend, three concentric half-discs sharing a flat baseline at about 82% of slide height and centred at about 62.5% of slide width. Outer disc is light blue #A3C8FF, labelled by the rule ending at the 716M row; middle disc is royal blue #2353EB, labelled by the rule ending at the 181M row; innermost disc is orange #F7931E, labelled by the rule ending at the 40–70M row. The orange small square icon before MARKET OVERVIEW is a rounded square. Each stat has a thin black horizontal leader line from the left margin to the matching semicircle edge; the 40–70M leader ends inside the blue disc near the orange disc edge. Superscript numerals 1, 2, 3 mark the footnotes.
Slide 12
SECTION 02
2025: THE YEAR
OF INSTITUTIONAL
ADOPTION
02
a16zcrypto
©2025 a16z | All rights reserved worldwide
Visuals: A large numeral '02' in two overlapping layers, set in a heavy geometric sans. The top layer is cream #F5F3EE and fully opaque where it overlaps the purple block. The part of the numerals that sits above the purple block shows as a translucent beige #D9CDBA, which indicates the cream layer is semi-transparent over the background. Behind the numerals is a purple stepped block #D772FF with rounded inner and outer corners of about 1% of the slide height. The block has a notch on its left side and a notch on its bottom-left. It is not cropped and is boxed within the slide. A yellow tab #F5D06F in the top-left corner has a stepped right edge and a stepped bottom-left edge with small rounded corners. The a16zcrypto wordmark in the bottom-left is the only logo.
Slide 13
INSTITUTIONAL ADOPTION
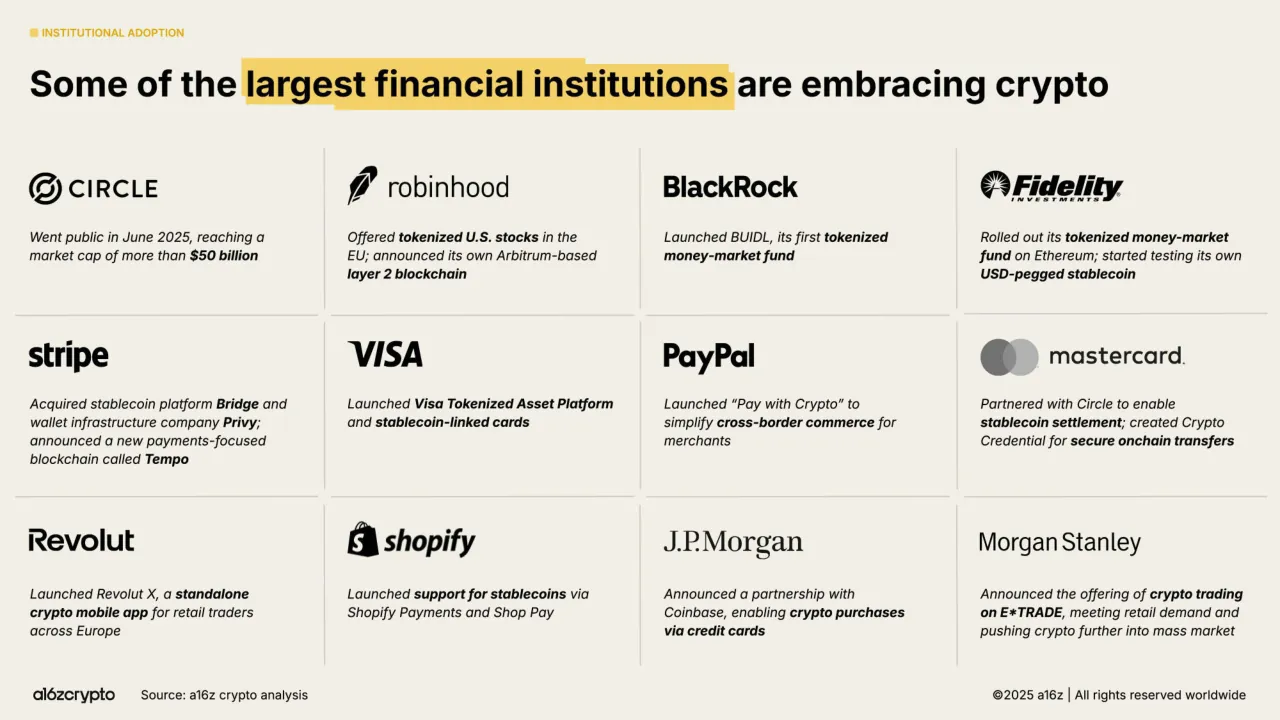
Some of the largest financial institutions are embracing crypto
CIRCLE
Went public in June 2025, reaching a market cap of more than $50 billion
robinhood
Offered tokenized U.S. stocks in the EU; announced its own Arbitrum-based layer 2 blockchain
BlackRock
Launched BUIDL, its first tokenized money-market fund
Fidelity INVESTMENTS
Rolled out its tokenized money-market fund on Ethereum; started testing its own USD-pegged stablecoin
stripe
Acquired stablecoin platform Bridge and wallet infrastructure company Privy; announced a new payments-focused blockchain called Tempo
VISA
Launched Visa Tokenized Asset Platform and stablecoin-linked cards
PayPal
Launched “Pay with Crypto” to simplify cross-border commerce for merchants
mastercard.
Partnered with Circle to enable stablecoin settlement; created Crypto Credential for secure onchain transfers
Revolut
Launched Revolut X, a standalone crypto mobile app for retail traders across Europe
shopify
Launched support for stablecoins via Shopify Payments and Shop Pay
J.P.Morgan
Announced a partnership with Coinbase, enabling crypto purchases via credit cards
Morgan Stanley
Announced the offering of crypto trading on E*TRADE, meeting retail demand and pushing crypto further into mass market
a16zcrypto
Source: a16z crypto analysis
©2025 a16z | All rights reserved worldwide
Visuals: Twelve company logos in black, one per grid cell, in reading order: Circle (wordmark with ring icon), robinhood (feather icon with lowercase wordmark), BlackRock (bold wordmark), Fidelity Investments (circular emblem with bold italic wordmark and small INVESTMENTS line), stripe (bold lowercase wordmark), VISA (bold italic wordmark), PayPal (bold wordmark), mastercard (two overlapping grey circles with lowercase wordmark and dot), Revolut (wordmark with R stylised), shopify (shopping-bag icon with bold italic wordmark), J.P.Morgan (serif wordmark), Morgan Stanley (sans wordmark). Also the a16z crypto logo in the footer. No charts, photos or diagrams. Thin light-grey vertical rules at about x 25%, 50% and 75% and horizontal rules at about y 44% and 69% divide the grid.
Slide 14
INSTITUTIONAL ADOPTION
Institutional capital / is flowing into / crypto — Bitcoin / and Ethereum ETFs / hold over $175 / billion in onchain / assets
Bitcoin and Ethereum ETFs: Weekly net flows (USD)¹ / VIEW LIVE
$4B
$2B
$0
-$2B
-$4B
Bitcoin ETF Holdings / $150 billion
Ethereum ETF Holdings / $28 billion
BlackRock’s iShares Bitcoin Trust (IBIT) was the world’s / fastest ETF to get to $10B, $25B, and $50B in AUM²
Mar 2024
Jun 2024
Sep 2024
Dec 2024
Mar 2025
Jun 2025
Sep 2025
Bitcoin ETFs
Ethereum ETFs
Sources: 1/ Dune (@hildobby), 2/ Financial Times
a16zcrypto
©2025 a16z | All rights reserved worldwide
Note: Though commonly called ETFs (exchange / traded funds), these are actually registered as / ETPs (exchange traded products), using SEC Form / S-1, indicating the underlying portfolios are not / comprised of securities
Net flows exclude flows into preexisting products / like the Grayscale Bitcoin and Ethereum Trusts / which were eventually converted to ETFs
Visuals: Chart: vertical stacked bar chart of weekly net flows in USD billions, titled 'Bitcoin and Ethereum ETFs: Weekly net flows (USD)' with footnote marker 1. Y-axis gridlines labelled $4B, $2B, $0, -$2B and -$4B; the $0 line is a darker black baseline and the other gridlines are light grey. X-axis labels are Mar 2024, Jun 2024, Sep 2024, Dec 2024, Mar 2025, Jun 2025 and Sep 2025, spaced about every three months. Series: Bitcoin ETFs in orange #F7941D as the lower stacked segment and Ethereum ETFs in purple #D16BFF as the upper segment; bars are about 1 percent of width with rounded tops, and values are about read from the bars. Approximate notable values: a tall positive week in about Dec 2024 reaching about +3.6B total, a peak in about Sep 2025 reaching about +3.9B with about +2.9B purple, and a deep negative week in about Mar 2025 reaching about -2.9B with about -0.3B purple. No values are printed on the bars and no highlighted points are marked. Legend below the chart: orange square Bitcoin ETFs, purple square Ethereum ETFs. Two overlaid rounded callout boxes sit over the lower-left chart area: an orange box reading Bitcoin ETF Holdings / $150 billion and a purple box reading Ethereum ETF Holdings / $28 billion, both white bold text. A 'VIEW LIVE' orange-red pill button with a white arrow icon and underlined white bold text sits next to the chart title. The a16z crypto logo is a black wordmark at bottom left.
Slide 15
INSTITUTIONAL ADOPTION
Publicly traded “treasury companies” have burst onto the scene —
now holding billions of dollars in crypto
Crypto treasury companies: Share of total token supply held
4%
3%
2%
1%
0%
Nov 2024
Jan 2025
Mar 2025
May 2025
Jul 2025
Sep 2025
Bitcoin
Ethereum
Solana
Source: Blockworks
a16zcrypto
©2025 a16z | All rights reserved worldwide
BTC holdings
MSTR - $73 billion / SMLR - $573 million
CEP - $5.0 billion / BRR - $565 million
CEPO - $3.4 billion / SQNS - $365 million
NAKA - $657 million
ETH holdings
BMNR - $11 billion / ETHZ - $424 million
SBET - $3.5 billion / BTCS - $290 million
ETHM - $2.1 billion / FGNX - $210 million
BTBT - $502 million / GAME - $65 million
SOL holdings
FORD - $1.4 billion / HSDT - $159 million
DFDV - $428 million / STKE - $93 million
UPXI - $421 million / BTCM - $9 million
STSS - $417 million
Visuals: Line chart titled 'Crypto treasury companies: Share of total token supply held'. Y-axis: 0% to 4% in 1% steps, gridlines at each step. X-axis: time from about Oct 2024 to Sep 2025, labelled Nov 2024, Jan 2025, Mar 2025, May 2025, Jul 2025, Sep 2025, with vertical gridlines at each label. Three series: Bitcoin (orange) rises from about 1.2% in Oct 2024 to about 1.35% by Dec 2024, about 1.9% by Jan 2025, about 2.4% by Mar 2025, about 2.8% by May 2025, about 3.1% by Jul 2025, about 3.4% by Sep 2025, ending about 3.5%. Ethereum (lilac) is about 0% until Jun 2025, about 0.2% by Jul 2025, about 1.3% by late Aug 2025, about 2.7% mid Sep 2025, ending about 3.6%. Solana (dark plum) is about 0% until Apr 2025, about 0.2% by May 2025, about 0.3% by Jul 2025, about 0.6% by Aug 2025, about 1.1% by early Sep 2025, about 2.3% by late Sep 2025. Legend at bottom right: Bitcoin orange line, Ethereum lilac line, Solana plum line. No values printed on the lines. Three rounded cards: BTC card orange #F7931A-like with Bitcoin logo icon in a white circle outline; ETH card lilac #D26BFF-like with Ethereum diamond icon in a white circle outline; SOL card dark plum #4F1632-like with Solana logo icon in a white circle outline. Each card lists its tickers in two columns with values as printed.
Slide 16
INSTITUTIONAL ADOPTION
Stablecoin-related mentions in SEC filings
400
300
200
100
0
2017 / 2018 / 2019 / 2020 / 2021 / 2022 / 2023 / 2024 / 2025
… we see product market fit for stablecoins in two important areas: one, in emerging markets where the local fiat currency is volatile and/or where consumers do not have easy or affordable access to US dollars; and two, in cross-border money movement, both B2B payments and consumer remittances.
Q3 2025 earnings call
… we aim to deliver the benefits of advancements in stablecoin and digital assets to our clients in a safe and sound manner by modernizing our own infrastructure and improving efficiency, transparency and interoperability for our clients.
Q2 2025 earnings call
[Stablecoins are] a pivotal part of our mission to advance global commerce by directly addressing pain points our customers face today.
Q2 2025 earnings call
Stablecoins are / no longer niche — / major public / companies / are actively / evaluating / opportunities
Source: The Block
©2025 a16z | All rights reserved worldwide
Visuals: Vertical bar chart titled Stablecoin-related mentions in SEC filings. Y-axis: number of mentions, 0 to 400, gridlines at 100, 200, 300 and 400, no unit label. X-axis: years 2017 to 2025 labelled at intervals of one year, bars are monthly or quarterly with no printed values. Single series in purple (#D977F5). Bars are near zero through 2018, small from 2019, rising through 2021 (peaks about 14), 2022 (about 62 at its peak), 2023 (about 30), 2024 (peaks about 68), and 2025 with a steep rise: about 89, 129, 111, 89, 115, 241, 298 and a final bar about 316. No legend. No highlighted points. Three quote cards overlay the plot: VISA card with Visa wordmark logo, Citi card with Citi logo, PayPal card with PayPal logo, each with a purple quotation mark, quote text and an italic grey attribution line. Footer logo a16zcrypto wordmark in black.
Slide 17
SECTION 03 / STABLECOINS / HAVE GONE / MAINSTREAM / a16zcrypto / ©2025 a16z | All rights reserved worldwide
Visuals: Decorative graphic at upper right: the numerals '03' in a heavy rounded sans, set large and overlapping. The '0' and '3' are drawn in two solid tones: a bright blue (#4B3BFF) fill and a dark navy (#0B1A3A) fill. Where the two overlap they form a deeper translucent navy (#152A66). The blue and navy shapes are interlocked with stepped, notched rectangular blocks behind the digits, so the mass reads as a stepped blue plinth. No photograph, chart or icon. The only logo is the a16zcrypto wordmark at bottom left.
Slide 18
STABLECOINS / Stablecoins now rival the world's largest payment networks in transaction volume / Total transaction volume, last 12 months / $1.7T / PayPal / $16T / Visa / $46T / Unadjusted / $9T / Adjusted / Stablecoins / $87T / ACH / Sources (left to right): PayPal as of 6/30/2025, Visa as of 6/30/2025, Allium as of 9/30/2025, Nacha as of 6/30/2025 | Note: Adjusted transaction volume is designed to strip out inorganic activity (such as bots or other artificial inflationary practices), providing a clearer picture of genuine user-driven stablecoin activity / a16z crypto / ©2025 a16z | All rights reserved worldwide
Visuals: Bubble chart (area-scaled circles, all bottom-aligned on a thin dark teal baseline) with no axes and no legend. PayPal: about $1.7T, small navy circle. Visa: $16T, navy circle. Stablecoins: large violet circle labelled $46T Unadjusted, with a smaller lighter violet circle nested in its lower part labelled $9T Adjusted (the nested circle overlaps the lower edge of the large circle). ACH: largest navy circle labelled $87T. Highlighted points: none; the pink title highlight is the only accent. Baseline: a thin dark teal line running nearly horizontally from left to right under all bubbles.
Slide 19
STABLECOINS / Stablecoins are / one of the / cheapest ways to / send a dollar / — in less than 1 / second for less / than 1 cent / Payment products in the U.S. / Payment type / Transaction fee / Time to settle / Credit card payment / 2 – 3% + $0.30 / Instant to merchant / Debit card payment / Durbin: 0.05% + $0.21 / Non-Durbin: 0.9% + $0.15 / Instant to merchant / ACH / $0.20 – $1.50 / 3 – 5 business days / International wire transfer / $30 – $50 / 1 – 5 business days / Remittance service / 6.65% (for $200) / Minutes to days / Peer-to-peer payment app / Free (p2p) / 1 – 3% (business) / Instant to 1 day / Stablecoin transfer / (Solana, Ethereum L2s) / < $0.01 / < 1 second / Source: a16z crypto analysis / a16zcrypto / ©2025 a16z | All rights reserved worldwide
Visuals: One table, titled 'Payment products in the U.S.', with 3 columns (Payment type, Transaction fee, Time to settle) and 8 body rows after a navy merged title row. Rows in order: Credit card payment | 2 – 3% + $0.30 | Instant to merchant. Debit card payment | Durbin: 0.05% + $0.21 / Non-Durbin: 0.9% + $0.15 | Instant to merchant. ACH | $0.20 – $1.50 | 3 – 5 business days. International wire transfer | $30 – $50 | 1 – 5 business days. Remittance service | 6.65% (for $200) | Minutes to days. Peer-to-peer payment app | Free (p2p) / 1 – 3% (business) | Instant to 1 day. Highlighted final row, Stablecoin transfer (Solana, Ethereum L2s) | < $0.01 | < 1 second, in white bold text on bright blue. No chart, photo, or logo other than the a16zcrypto wordmark. The pink highlight behind part of the headline is a text highlight, not a visual element. Table cell borders are thin dark navy lines.
Slide 20
STABLECOINS / Stablecoins are already a top 20 holder of U.S. Treasuries, ahead of Saudi Arabia, South Korea, Israel, and Germany / Stablecoins compared to major foreign holders of U.S. Treasuries¹ / Japan / United Kingdom / China / Cayman Islands / Canada / Belgium / Luxembourg / France / Ireland / Switzerland / Taiwan / Singapore / Hong Kong / India / Brazil / Norway / Stablecoins / Saudi Arabia / South Korea / Israel / Germany / $0 / $250B / $500B / $750B / $1T / $1.25T / tether $127 billion held in U.S. Treasuries² / CIRCLE $25 billion held in U.S. Treasuries³ / Sources: 1/ US Department of the Treasury, 2/ Tether, 3/ Circle (all data is as of 6/30/2025) / ©2025 a16z | All rights reserved worldwide / a16zcrypto
Visuals: Horizontal bar chart titled 'Stablecoins compared to major foreign holders of U.S. Treasuries¹'. Y-axis: categories listed top to bottom, no axis title. X-axis: linear, labelled $0, $250B, $500B, $750B, $1T, $1.25T, with vertical light grey gridlines at each labelled tick. Series, values not printed on the bars, so bar lengths are estimates marked about: Japan about $1,147B; United Kingdom about $857B; China about $756B; Cayman Islands about $440B; Canada about $437B; Belgium about $432B; Luxembourg about $404B; France about $375B; Ireland about $317B; Switzerland about $302B; Taiwan about $299B; Singapore about $254B; Hong Kong about $242B; India about $229B; Brazil about $216B; Norway about $195B; Stablecoins about $152B (highlighted in deep blue, bold label); Saudi Arabia about $130B; South Korea about $127B; Israel about $102B; Germany about $102B. Bars are light blue #A8C8FA except the highlighted Stablecoins bar in royal blue #4433F5. A dotted blue connector line with a small hollow circle end runs from the end of the Stablecoins bar to the callout box. Callout box: rounded blue rectangle #4B33FA containing two rows: a tether logo (diamond-shaped Tether mark with wordmark 'tether' in white bold) followed by '$127 billion held in U.S. Treasuries²' with '$127 billion' bold, and a CIRCLE logo (circular ring mark with wordmark 'CIRCLE' in white spaced capitals) followed by '$25 billion held in U.S. Treasuries³' with '$25 billion' bold. The pink highlight behind the headline words 'top 20', 'holder of U.S.' and 'Treasuries' is a visual tint. Logos: tether and CIRCLE in callout; a16zcrypto wordmark in footer.
Slide 21
STABLECOINS
Tether and USDC dominate today’s stablecoin supply, with most
transaction volume settled on Ethereum and Tron
Stablecoin supply by issuer
Adjusted stablecoin volume by blockchain
VIEW LIVE
$400B
$300B
$200B
$100B
$0
2018 2019 2020 2021 2022 2023 2024 2025
Tether USDC Other
$1.25T
$1T
$750B
$500B
$250B
$0
2018 2019 2020 2021 2022 2023 2024 2025
Ethereum Tron Unichain BNB Chain Solana Base
Arbitrum Polygon Aptos Avalanche Other
Source: Allium | Note: Adjusted transaction volume is designed to strip out inorganic activity (such as bots or other artificially inflationary practices), providing a clearer picture of genuine user-driven stablecoin activity
a16zcrypto
©2025 a16z | All rights reserved worldwide
Visuals: Two stacked vertical bar charts. Left chart: title 'Stablecoin supply by issuer'; y-axis in US dollars from $0 to $400B with horizontal gridlines labelled $100B, $200B, $300B, $400B; x-axis yearly labels 2018, 2019, 2020, 2021, 2022, 2023, 2024, 2025. Three stacked series: Tether (navy), USDC (violet-blue), Other (grey). Values are not printed; about $0 before 2019, rising to about $80B total by early 2021 and about $200B in 2022, dipping to about $145B in 2023, then rising to about $340B in the latest bar where Tether is about $220B, USDC about $75B and Other about $45B. Legend below the chart: Tether, USDC, Other. Right chart: title 'Adjusted stablecoin volume by blockchain' followed by an orange outlined button reading VIEW LIVE with an arrow icon; y-axis from $0 to $1.25T with gridlines labelled $250B, $500B, $750B, $1T, $1.25T; x-axis yearly labels 2018 to 2025. Stacked bars with eleven series: Ethereum (navy), Tron (blue), Unichain (orange-red), BNB Chain (purple), Solana (green), Base (dark red), Arbitrum (magenta), Polygon (brown-orange), Aptos (cyan), Avalanche (lime), Other (grey). Values are not printed; the latest bar peaks about $1.2T, with Ethereum about $430B, Tron about $340B, and BNB Chain and Solana making up most of the remainder. Bars are small before 2020 (under $50B), reach about $300B to $500B across 2023 and 2024, and show the largest totals in 2025. Legend below in two rows of six and five entries with coloured square markers. Highlight: the VIEW LIVE button is the only accent shape on the right column.
Slide 22
STABLECOINS
Spot crypto trading volume vs. stablecoin transaction volume (adjusted)
$5T / $4T / $3T / $2T / $1T / $0
$1.25T / $1T / $750B / $500B / $250B / $0
2018 / 2019 / 2020 / 2021 / 2022 / 2023 / 2024 / 2025
Spot crypto trading volume¹
Stablecoin transaction volume (adjusted)²
Sources: 1/ The Block, 2/ Allium | Note: Adjusted transaction volume is designed to strip out inorganic activity (such as bots or other artificially inflationary practices), providing a clearer picture of genuine user-driven stablecoin activity
Stablecoins are breaking their correlation with broader trading volumes — a sign of organic adoption
a16zcrypto
©2025 a16z | All rights reserved worldwide
Visuals: Combo chart. Type: column bars plus line. Title above the plot: Spot crypto trading volume vs. stablecoin transaction volume (adjusted). Left y-axis: Spot crypto trading volume, range $0 to $5T, gridlines at $1T, $2T, $3T, $4T, $5T in light grey. Right y-axis: Stablecoin transaction volume (adjusted), range $0 to $1.25T, labelled $0, $250B, $500B, $750B, $1T, $1.25T. X-axis: years 2018 to 2025 with year labels. Series 1: light blue columns, about $0.2T in late 2017, about $0.6T in early 2018, under $0.1T through 2019, about $0.3T in 2020, rising to about $1.5T in late 2020, peak about $4.1T in mid 2021, about $3.1T in mid 2021, about $1.9T late 2021, about $2.5T early 2022, about $1.3T in 2023, about $2.5T in early 2024, about $2.9T in late 2024 and about $2.3T in early 2025, ending about $1.6T in late 2025. Series 2: solid purple-blue line, about $0.03T in 2019 rising to about $0.1T in 2020, about $0.2T in 2021 peaks near $0.5T in 2021 and dips, about $0.6T in 2022, about $0.35T to $0.5T through 2023, about $0.5T in early 2024, about $0.7T in late 2024, rising to about $1.2T at the final point in late 2025. Legend: beneath the chart, light blue square for Spot crypto trading volume¹ and purple-blue line sample for Stablecoin transaction volume (adjusted)². No highlighted data points. Left axis tick labels are light blue, right axis tick labels are purple-blue.
Slide 23
STABLECOINS
Stablecoins can strengthen dollar dominance as the national debt surges and foreign demand for U.S. Treasuries fades
Foreign central bank reserves and U.S. national debt
80%
60%
40%
20%
0%
$40T
$30T
$20T
$10T
$0
1970
1980
1990
2000
2010
2020
Gold holdings as a % of foreign reserves¹
U.S. national debt²
U.S. Treasuries holdings as a % of foreign reserves¹
0.2%
Percent of stablecoin supply denominated in other currencies
99.8%
Percent of stablecoin supply denominated in USD³
5-11x
$326 billion
Stablecoin supply today⁴
$1.6 – $3.7 trillion
Projected stablecoin supply by 2030 (Citi)
citi
al6zcrypto
Sources: 1/ Bloomberg and Tavi Costa as of 8/27/2025, 2/ FiscalData.treasury.gov, 3/ Artemis as of 9/30/2025, 4/ Allium as of 9/30/2025
©2025 a16z | All rights reserved worldwide
Visuals: Combined chart: line and bar chart. Title: Foreign central bank reserves and U.S. national debt. Left y-axis 0% to 80% in 20% steps (percent of foreign reserves). Right y-axis $0 to $40T in $10T steps (U.S. national debt in trillions of dollars). X-axis years 1970 to about 2025 with labels every 10 years. Series: Gold holdings as a % of foreign reserves (light purple/orchid line) peaks about 74% near 1980, falls to about 5% near 2015 and rises to about 21% by 2025. U.S. Treasuries holdings as a % of foreign reserves (blue line) starts about 13% in 1970, peaks about 29% in 1972, dips to about 2% near 1980, rises to about 28% near 2015 and ends about 18% in 2025. U.S. national debt (pale blue bars) rises from near $0 in 1970 to about $37T in 2025. A dotted black rectangle highlights the 2023-2025 bars at the right edge of the chart. Legend below chart in three entries. Pie-style donut: a single solid blue circle with a thin purple sliver at top representing 0.2% other currencies and 99.8% USD. Two leader lines from labels to the pie. Callout block: $326 billion (white text on blue rounded rectangle) with arrow labelled 5-11x pointing to dotted-outline box reading $1.6 – $3.7 trillion with Citi logo.
Slide 24
SECTION 04 / 04 / THE WORLD IS / COMING ONCHAIN / a16zcrypto / ©2025 a16z | All rights reserved worldwide
Visuals: Decorative stepped green block (about #0BBB52) behind the numeral 04, with notched corners and a square-cornered step profile. A large numeral 04 in a bold geometric sans, overlaid in two tones: a tan #DCCFB8 layer (partly translucent) and an off-white #F5F3EE layer that overlaps it and the green block, so the green shows through the zero's counter and the 4's diagonal. A peach #FFBFA6 stepped tag shape in the top-left corner with rounded inner corners behind the 'SECTION 04' label. The a16zcrypto wordmark logo in off-white bottom-left. No photographs, charts or diagrams.
Slide 25
APPLICATIONS Share of decentralized exchange spot trading volume (%) The DeFi industry is growing — crypto trading is shifting from centralized exchanges (CEXs) to decentralized exchanges (DEXs) 25% 20% 15% 10% 5% 0% 2019 2020 2021 2022 2023 2024 2025 a16zcrypto Source: The Block ©2025 a16z | All rights reserved worldwide
Visuals: Area chart titled 'Share of decentralized exchange spot trading volume (%)'. Y-axis: 0% to 25% in 5% steps, gridlines light grey at each step, no unit label beyond the % signs. X-axis: years 2019 to 2025 labelled at each January, with values sampled roughly monthly. Single series filled solid bright green (about #08BA52) down to the 0% baseline, no outline, no legend, no data labels. Approximate printed-free readings: near 0% through 2019 and 2020, about 1.5% to 2% by early 2020s... rising to about 5.5% in late 2020, about 3% to 2.8% in early 2021, about 6.5% to 8% in mid 2021, about 10% to 11% in early 2022, about 9% to 10% through 2022, about 10.5% to 11% in late 2022, about 14% peak in mid 2023, about 10% to 11% in 2024, about 12% to 13.5% in late 2024, about 18% in early 2025, about 22.7% peak in mid 2025 (highest point), about 16.8% to 19% at the right end. No highlighted points. Peach square icon at top left is a decorative marker beside the kicker. Logo: a16zcrypto wordmark in black lowercase sans-serif.
Slide 26
APPLICATIONS
Perpetual futures trading volume
$1.25T
$1T
$750B
$500B
$250B
$0
2022
2023
2024
2025
Hyperliquid
The leading perps exchange by revenue generates
more than $1 billion in annualized revenue
Perpetual futures became a popular product among crypto speculators — a natural evolution of DeFi
Source: DefiLlama (volume and revenue) as of 9/30/2025
©2025 a16z | All rights reserved worldwide
Visuals: Vertical bar chart titled 'Perpetual futures trading volume'. Y axis: US dollars, linear, range $0 to $1.25T, labelled gridlines at $0, $250B, $500B, $750B, $1T and $1.25T. X axis: years 2022, 2023, 2024, 2025 labelled under every fourth bar position, monthly bars from about mid 2021 to 9/30/2025 (about 53 bars). Single series of green bars with approximate values read from the chart (no printed values): about $0 for the first bar, then about $12B, $50B, $105B, $90B, $57B, $60B, $68B, $70B, $60B, $38B, $26B, $37B, $38B, $33B, $20B, $38B, $20B, $44B, $47B, $60B, $47B, $38B, $72B, $42B, $38B, $30B, $52B, $83B, $113B, $128B, $202B, $295B, $277B, $220B, $187B, $233B, $197B, $130B, $140B, $266B, $342B, $365B, $317B, $306B, $352B, $408B, $423B, $569B, $765B and a final bar of about $1.14T. No legend. The final bar is the highest point and is not separately highlighted. Callout box overlaid on the upper-left of the chart (white logo and text on dark green) covers the gridlines between $1T and $1.25T and part of the $750B gridline area. Horizontal gridlines are thin light grey lines across the plot. Logo: white Hyperliquid mark (two-lobed shape) and 'Hyperliquid' wordmark in the callout, and a16z crypto wordmark in the footer.
Slide 27
APPLICATIONS
Real-world assets are bridging traditional finance and crypto, with
$30 billion already onchain
Total Real-World Asset (RWA) value
Top RWA blockchains
Top RWA issuers
$40B
$30B
$20B
$10B
$0
2018
2020
2022
2024
Corporate bonds
Actively managed strategies
Non-US government debt
Stocks
Institutional alternative funds
Commodities
U.S. Treasury debt
Private credit
Network
RWA Count
Total Value
Ethereum
431
$9,655.0M
ZKsync Era
41
$2,454.3M
Polygon
272
$1,139.2M
Arbitrum
110
$919.3M
Avalanche
40
$742.9M
Aptos
14
$720.1M
Solana
83
$673.2M
BNB Chain
3
$519.7M
Stellar
20
$504.5M
XRP Ledger
11
$360.8M
Network
Total Value
BlackRock
$2,640.3M
Anemoy
$1,135.2M
Paxos
$1,134.0M
Tether Holdings
$944.0M
Exodus
$787.1M
Ondo I
$728.7M
Franklin Templeton
$717.5M
Superstate
$705.3M
Ondo USDY
$689.5M
ChinaAMC
$663.8M
a16zcrypto
Source: rwa.xyz (excludes stablecoins) as of 9/30/2025. Data may vary by source and methodology across data providers.
©2025 a16z | All rights reserved worldwide
Visuals: Chart (left): stacked area chart titled Total Real-World Asset (RWA) value. Y axis labelled $0, $10B, $20B, $30B, $40B (range 0 to 40 billion dollars, gridlines at each $10B). X axis labelled 2018, 2020, 2022, 2024, spanning 2018 to about end 2025. Stacked series from bottom to top: Private credit (dark green-black, about $17.5B at the top of its band at the end, about 0 before 2021, about $4B by late 2022, step up at about Q4 2022), U.S. Treasury debt (green, about $7B band at the end), Commodities (yellow, about $1.5B band), Institutional alternative funds (purple, thin), Stocks (blue, thin), Non-US government debt (dark red, thin), Actively managed strategies (magenta, thin), Corporate bonds (grey, thin cap). Total value at the right edge is about $31B, the last point just under the $30B gridline plus a thin top band; no printed values on the series, all values are estimates. Legend: inside the plot at top left, eight swatches with labels listed in visuals text order, each swatch a small filled square. No highlighted points. Table (centre): Top RWA blockchains, columns Network (with a chain logo icon before each name), RWA Count, Total Value; 10 data rows: Ethereum 431 $9,655.0M; ZKsync Era 41 $2,454.3M; Polygon 272 $1,139.2M; Arbitrum 110 $919.3M; Avalanche 40 $742.9M; Aptos 14 $720.1M; Solana 83 $673.2M; BNB Chain 3 $519.7M; Stellar 20 $504.5M; XRP Ledger 11 $360.8M. Table (right): Top RWA issuers, columns Network (with an issuer logo icon before each name) and Total Value; 10 rows: BlackRock $2,640.3M; Anemoy $1,135.2M; Paxos $1,134.0M; Tether Holdings $944.0M; Exodus $787.1M; Ondo I $728.7M; Franklin Templeton $717.5M; Superstate $705.3M; Ondo USDY $689.5M; ChinaAMC $663.8M. Logos: small black or coloured circular icons (Ethereum diamond blue-violet, ZKsync black, Polygon violet, Arbitrum navy, Avalanche red, Aptos black, Solana black, BNB Chain yellow, Stellar black, XRP Ledger black; BlackRock black bar, Anemoy black, Paxos yellow-green ring, Tether teal, Exodus blue-violet, Ondo black concentric, Franklin Templeton black, Superstate black, Ondo USDY black, ChinaAMC black globe). Logo: a16zcrypto wordmark in black at bottom left.
Slide 28
APPLICATIONS
Decentralized physical infrastructure networks (DePIN) are gaining traction, leading to a new generation of user-owned services
Select DePIN projects: Fees generated weekly¹
$600K
$400K
$200K
$0
2023
2024
2025
Dimo
Livepeer
Hivemapper
Akash Network
GEODNET
Helium
helium
Helium's mobile network provides cellular services through a decentralized network of hotspots to provide faster, more affordable coverage around the world
111,906
Active hotspots
1.41M
Daily users
48.06 TB
Daily data transfer²
Sources: 1/ Artemis, 2/ Helium as of 9/30/2025
©2025 a16z | All rights reserved worldwide
Visuals: Stacked vertical bar chart titled 'Select DePIN projects: Fees generated weekly¹'. Y axis: US dollars, $0 to $600K, gridlines at $200K, $400K and $600K. X axis: weekly bars from 2023 to late 2025, labelled 2023, 2024, 2025. Series stacked bottom to top: Helium (green #3DBE5A), GEODNET (yellow #F2CD4E), Akash Network (purple #A855F7), Hivemapper (near-black #0F2A22), Livepeer (orange-red #F0583A), Dimo (blue #2356F0). Values are not printed; estimates: 2023 bars about $5K to $10K total; early 2024 peaks about $150K; mid 2024 about $120K to $130K; early 2025 about $250K to $300K with Dimo spikes to about $310K; the final bars in Sept 2025 reach about $565K, with Helium about $365K and GEODNET about $170K. Legend box at top-left of the chart, fill #E8E4D2, rounded corners, swatches listed Dimo, Livepeer, Hivemapper, Akash Network, GEODNET, Helium. Right panel: photo of two hotspot devices, a silver/white rectangular unit tilted left and a black disc-shaped unit overlapping it at right, shown on a transparent background with soft grey shadows, light from upper left, full colour, boxed by no frame. Small green arrow pointing right (#3DBE5A, thin stroke) sits between chart and panel. Helium logo: black circle #0E0E0E with white link icon, followed by wordmark 'helium' in black sans. a16z crypto logo bottom-left in black.
Slide 29
APPLICATIONS / Over 13 million memecoins have been launched in the past year — a symptom of crypto’s lack of regulated market frameworks / Tokens deployed daily via memecoin launchpads / 80K / 60K / 40K / 20K / 0 / Oct 2024 / Jan 2025 / Apr 2025 / Jul 2025 / Jup Studio / Bags / Wavebreak / Boop / Believeapp / LaunchLabs / Moon it / Moonshot / Heaven / LetsBonk / Pumpdotfun / a16zcrypto / Source: Dune (@adam_tehc) / ©2025 a16z | All rights reserved worldwide
Visuals: Chart: vertical bar chart, stacked histogram of tokens deployed daily via memecoin launchpads. Title: 'Tokens deployed daily via memecoin launchpads'. Y axis: number of tokens per day, 0 to 80K, gridlines and labels at 0, 20K, 40K, 60K, 80K. X axis: time, labelled Oct 2024, Jan 2025, Apr 2025, Jul 2025, spanning roughly late Sep 2024 to late Aug 2025 with daily bars. Series stacked per day, colours as in legend: Jup Studio, Bags, Wavebreak, Boop, Believeapp, LaunchLabs, Moon it, Moonshot, Heaven, LetsBonk, Pumpdotfun. Pumpdotfun (green) dominates nearly all bars. Values printed on the slide: none; estimates: about 7K to 9K at late Sep 2024, about 17K in early Oct 2024, about 70K peak near late Nov 2024 (Pumpdotfun), about 60K to 67K peaks in Jan 2025, about 20K to 25K trough near Mar 2025, about 30K to 43K in Apr to Jun 2025, about 35K to 47K peaks in May 2025, LetsBonk yellow band about 25K to 37K in Jul 2025, dropping to about 4K to 5K in Aug 2025, and about 20K to 24K at the final bar. Legend: rounded box on the upper right of the chart listing the 11 launchpads with colour swatches, Jup Studio dark green-black, Bags pale blue, Wavebreak grey-teal, Boop amber-brown, Believeapp magenta, LaunchLabs dark red, Moon it blue, Moonshot violet, Heaven coral red, LetsBonk yellow, Pumpdotfun green. Highlighted points: none. Photograph or illustration: none. Logo: a16zcrypto wordmark at bottom left.
Slide 30
APPLICATIONS
NFT volume
VIEW LIVE
$20B
$15B
$10B
$5B
$0
2021
2022
2023
2024
2025
NFT monthly active buyers
1M
750K
500K
250K
0
2021
2022
2023
2024
2025
Other
ApeChain
Solana
Ronin
Abstract
Bitcoin
Zora
Polygon
Ethereum
Optimism
Base
a16zcrypto
Source: Allium
The NFT market
appears to be
shifting from
speculating to
collecting —
as new, low-fee
blockchains
expand total
number of
participants
©2025 a16z | All rights reserved worldwide
Visuals: Chart 1, stacked bar chart titled 'NFT volume' with a 'VIEW LIVE' link button. Y axis in US dollars from $0 to $20B, gridlines at $5B intervals. X axis labelled by year 2021, 2022, 2023, 2024, 2025, one bar per month. Series are stacked, mostly Ethereum in green #00B956 with thin dark segments on top (Solana-like, near-black #0B1F1B). Values are not printed; about values: a peak of about $16.5B in early 2022, a second peak of about $11B in early 2022, a late-2022 spike of about $7B, and monthly totals mostly under $3B from 2023 onward. No legend on this chart; highlighted points: none. Chart 2, stacked bar chart titled 'NFT monthly active buyers'. Y axis is a count of buyers from 0 to 1M, gridlines at 250K, 500K, 750K, 1M. X axis by year 2021 to 2025, one bar per month. Series colours from the legend: Ethereum #22C55E green at the base, Bitcoin #F7931A orange, Solana #0B2420 near-black, Polygon #E8457A pink, Base #9B51E0 purple, Abstract #1A5CFF blue, ApeChain #F5C945 yellow, Ronin #137A3B dark green, Optimism #E8382E red, Zora #A9D0FF light blue, Other #9AA3A8 grey. About values: the 2022 peak is about 600K, the 2024 peak near 750K, the 2025 peaks about 940K and about 980K (the tallest bars near mid-2025), the latest bar about 850K. Legend: a three-column grid with colour swatches at the lower right of the slide, in the order Other, Ronin, Zora, Optimism in the first column; ApeChain, Abstract, Polygon, Base in the second column; Solana, Bitcoin, Ethereum in the third column. Highlighted points: none in the charts, but the headline phrase is highlighted (see elements). Logo: 'a16zcrypto' wordmark, black, bottom-left.
Slides 31 to 54 continue in the full text file.
Download this deck
The hosted PDF of every library deck is free for readers of the SlideDeck Co newsletter. Join with your email and the viewer and download appear here.
Preparing a results presentation or business update of your own? The SlideDeck Co Standard Deck is a slide library for business reviews, updates and plans.







