
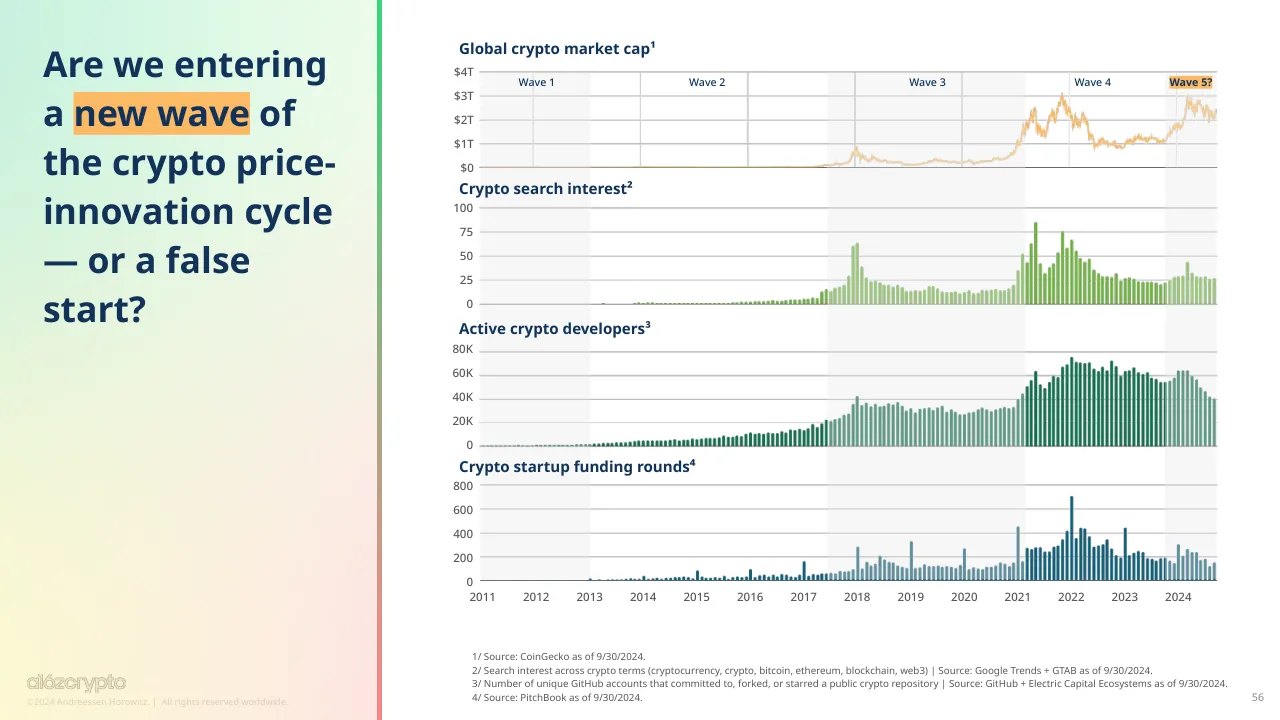
The deck opens with a title slide, a legal disclosures page and a table of contents listing six sections. It then covers them in order: how big crypto is today, including active addresses, mobile wallet growth and an estimate of real users; why crypto has become a political issue, including bipartisan quotes, swing-state search interest, regulation and central bank digital currencies; the maturity of infrastructure, including multichain flows, cheaper Ethereum layer-two fees, account abstraction and zero knowledge proofs; the key applications emerging, including stablecoins, AI, NFTs, DeFi, prediction markets, DePIN, gaming and social; what is known about builders; and finally a look at what comes next. Each section opens with a full-bleed divider slide carrying a numbered label. Most content slides use a headline-style title stating the takeaway, followed by one large chart or a few data callouts with source notes beneath. The deck closes with forward-looking thoughts, a price-cycle chart and a resources page.
Slides worth studying
Questions about this deck
How many slides does the a16z crypto State of Crypto 2024 deck have?
The deck has 58 pages. Its table of contents on slide 3 lists six sections: how big crypto is today, why crypto has become a political issue, infrastructure maturity, key applications, what is known about builders, and what comes next.
What does the a16z crypto State of Crypto 2024 deck say about monthly active crypto addresses?
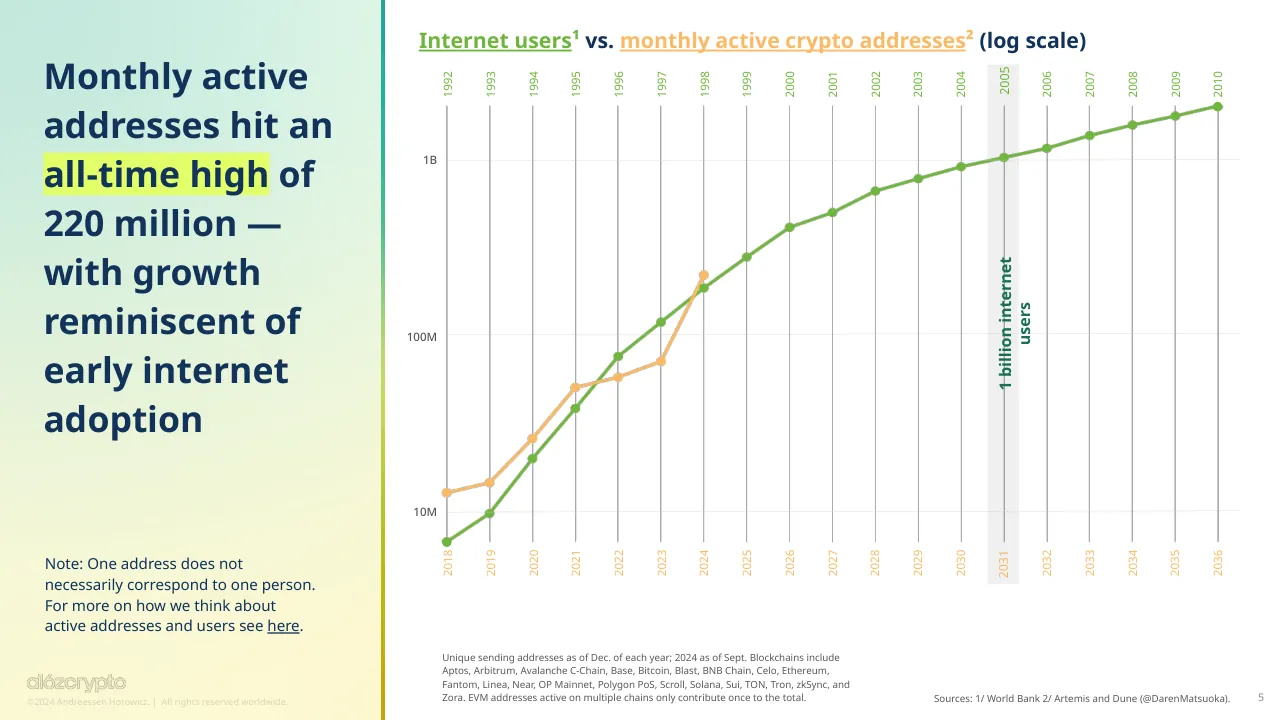
Slide 5 says monthly active addresses hit an all-time high of 220 million. It adds that one address does not necessarily correspond to one person.
What does the a16z crypto deck estimate about the number of active crypto users?
Slide 8 estimates that only 5 to 10% of crypto owners are active users, which it puts at 30 to 60 million estimated monthly active users. It counts 617 million estimated global crypto owners on the same slide.
What does the a16z crypto State of Crypto 2024 deck say about the cost of sending USD internationally?
Slide 24 lists $44 via international wire transfer, $12 via USDC on Ethereum at the 2021 average gas price, $1 via USDC on Ethereum at the September 2024 average gas price, and less than $0.01 via USDC on Base L2 at the September 2024 average gas price. The slide notes that these figures may exclude some onboarding and exit costs.
Details
- Company: a16z crypto
- Year: 2024
- Type: Report-style deck
- Industry: Crypto and blockchain
- Pages: 58
More from a16z crypto
All a16z crypto decks in the library
Review score: 8 out of 10, Strong
Presentation quality, judged with the SlideDeck Co review heuristic. Ask, evidence and idea merit are not rated here.
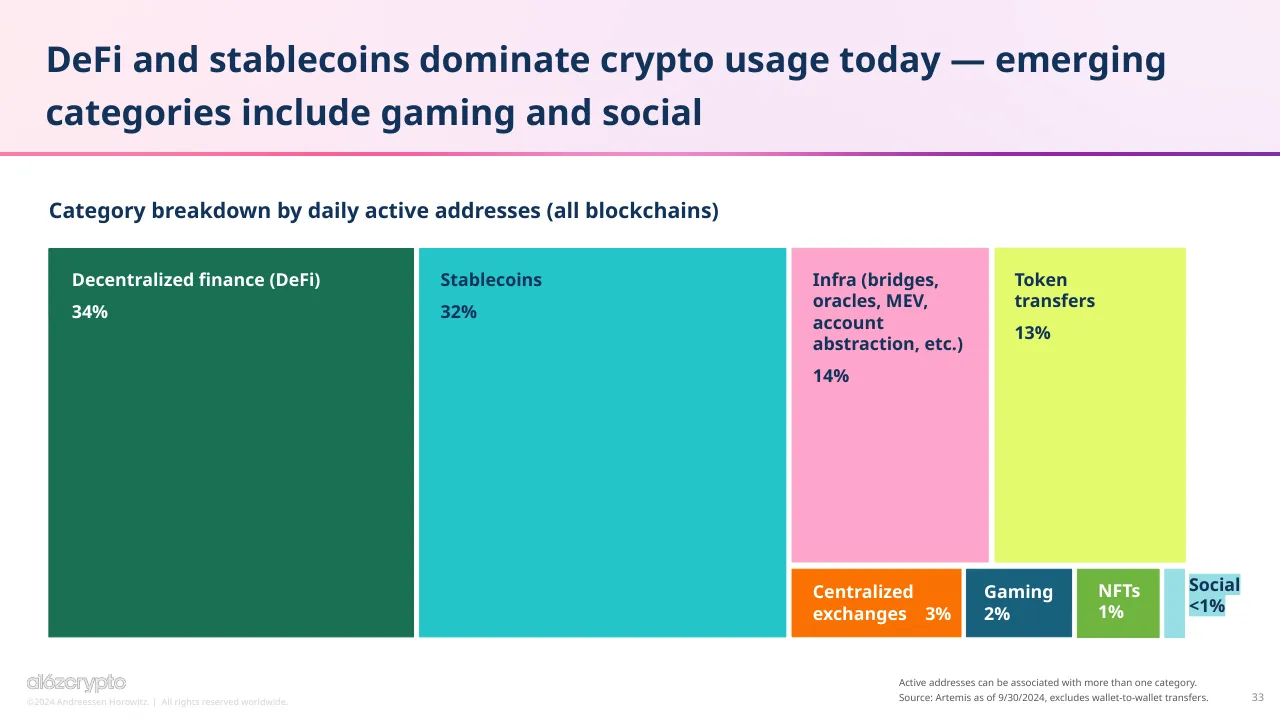
The deck is a disciplined report-style design: a contents page, six numbered full-bleed dividers (4, 9, 21, 32, 49, 55) and a consistent takeaway headline over one main chart on most pages, so the route is easy to follow and each page contributes. Typography, colour-coded highlights and chart treatment are consistent, and slides 10, 33 and 23 read cleanly at size. Weaknesses are real: slide 5 has a mislabelled dual x-axis (1992 to 2036 above, 2018 to 2036 below) and a 'log scale' that is hard to decode, and a few pages (26, 29, 47, 48, 52) carry unreadable or cluttered content, plus 3D pies on 31 and tiny footers throughout.
Worth keeping: Keep the numbered section dividers, the takeaway headline plus single large chart pattern, and the highlighted key phrases that give each page one clear message.
Most useful repair: Fix the slide 5 axis and annotation so the internet-versus-crypto comparison reads at a glance, and redraw the 3D pies on slide 31 as flat charts.
What would change the score: I would cut or simplify the dense pages (47 table, 48 link lists, 52 matrix, 29 logo wall) and enlarge the footnotes and small chart labels that are illegible at normal viewing size.
Confidence high. 58 of 58 pages inspected on contact sheets, 4 at readable size. Reviewed 2026-11-08. Model-assisted review (claude-sonnet-5-5).
Full text of the slides (58 slides)
Every slide's words and a description of its charts and images, so the deck can be searched and rebuilt. Also available as Markdown.
Slide 1
State of / crypto / 2024 / a16zcrypto / ©2024 Andreessen Horowitz. | All rights reserved worldwide.
Visuals: Full-bleed multicolour gradient illustration with a translucent pixel-block grid overlay: a grid of soft rectangles about 5% of the slide width each, in rows across the middle band (roughly y 20% to 81%), tinting the gradient. Behind the grid, the colour runs from green at top left, through pale yellow-green and peach at top centre, to pink at top right; the bottom band runs from yellow at bottom left, through orange and hot pink, to deep purple at bottom right. The centre title 'crypto' is a large white geometric sans wordmark made of six filled white letter shapes (c, r, y, p, t, o), with the letters at x 24.9, 35.3, 40.4, 50.4, 60.0 and 65.8 percent. The bottom-left a16zcrypto logo is a small grey-outlined wordmark, about 7.6% wide, placed at x 2.2, y 93.6, with a light grey tone that stays subdued against the yellow.
Slide 2
a16z crypto / Important Disclosures / The views expressed here are those of the individual AH Capital Management, L.L.C. (“a16z”) personnel quoted and are not the views of a16z or its affiliates. Certain information contained in here has been obtained from third-party sources, including from portfolio companies of funds managed by a16z. While taken from sources believed to be reliable, a16z has not independently verified such information and makes no representations about the enduring accuracy of the information or its appropriateness for a given situation. / This content is provided for informational purposes only, and should not be relied upon as security, legal, business, investment, or tax advice, nor as an endorsement of any such practices, products or services. There can be no guarantees or assurances that the views expressed here will be applicable for any particular facts or circumstances, and they should accordingly not be relied upon in any manner. You should consult your own advisers as to those matters. References to any securities, digital assets, tokens, and/or cryptocurrencies are for illustrative purposes only and do not constitute a recommendation to invest in any such instrument nor do such references constitute an offer to provide investment advisory services. Furthermore, this content is not directed at nor intended for use by any investors or prospective investors, and may not under any circumstances be relied upon when making a decision to invest in any fund managed by a16z. (An offering to invest in an a16z fund will be made only by the private placement memorandum, subscription agreement, and other relevant documentation of any such fund and should be read in their entirety.) Any investments or portfolio companies mentioned, referred to, or described are not representative of all investments in vehicles managed by a16z, and there can be no assurance that the investments will be profitable or that other investments made in the future will have similar characteristics or results. A list of investments made by funds managed by Andreessen Horowitz (excluding investments for which the issuer has not provided permission for a16z to disclose publicly as well as unannounced investments in publicly traded digital assets) is available at https://a16z.com/investments/. / Charts and graphs provided within are for informational purposes solely and should not be relied upon when making any investment decision. Past performance is not indicative of future results. The content speaks only as of the date indicated; all figures are as of September 30, 2024, unless otherwise noted. Any projections, estimates, forecasts, targets, prospects, and/or opinions expressed in these materials are subject to change without notice and may differ or be contrary to opinions expressed by others. Please see https://a16z.com/disclosures for additional important information.
Visuals: None. The slide has no charts, photographs, illustrations, logos or icons; the only non-text items are two hyperlinks rendered in light cyan (#91E0EB) with underlines: https://a16z.com/investments/ and https://a16z.com/disclosures.
Slide 3
Table of contents
State of Crypto 2024
01
How big is crypto today?
4
02
Crypto has become a key political issue
9
03
Infrastructure is maturing
21
04
Key applications are emerging
32
05
What we know about crypto’s builders
49
06
What’s next for crypto?
55
3
Visuals: Decorative elements only, no photographs, charts or logos. (1) Full-bleed gradient background image covering the whole slide, shown as a colour wash from green at the top-left, through pale mint and cream in the centre, to pink, magenta and deep purple at the right and bottom, with yellow at the bottom-left corner. (2) A placed gradient image of 1153 by 648 pixels at x 8.6%, y 0%, w 82.3%, h 52.6%, a soft pale tint blending into the background, not visually distinct. (3) A thin horizontal gradient rule across the top edge, green to mint to pink to purple. (4) A horizontal gradient bar at y 24.6%, from yellow (#E8D81A) on the left, through peach and pink (#F070E0), to purple (#7B1FA2) on the right, with square ends. (5) Six dotted grey leader lines (about #8A8A8A, 0.1% stroke) running from the end of each entry title to its page number: row 1 from x 41.9% to 85.4% at y 38.5%; row 2 from x 56.7% to 85.5% at y 47.3%; row 3 from x 43.4% to 84.5% at y 56.2%; row 4 from x 47.9% to 84.5% at y 65.2%; row 5 from x 55.4% to 84.4% at y 74.0%; row 6 from x 40.4% to 84.4% at y 82.8%.
Slide 4
01 / State of Crypto 2024 /
How big is / crypto today?
©2024 Andreessen Horowitz. | All rights reserved worldwide.
4
Visuals: Full-bleed generative background illustration: a soft blurred gradient moving from green at top-left, through teal and deep teal at top-right, to yellow and golden ochre at the bottom. Over the middle band (about 23% to 78% of slide height) sits a semi-transparent mosaic of rectangular blocks in rows and columns, each block a slightly different tint of green, yellow or teal, so the gradient shows through. No people, objects or photographs. Logo: the a16z crypto wordmark in white, lowercase, bottom-left.
Slide 5
Monthly active / addresses hit an / all-time high of / 220 million — / with growth / reminiscent of / early internet / adoption / Note: One address does not / necessarily correspond to one person. / For more on how we think about / active addresses and users see here. / Internet users¹ vs. monthly active crypto addresses² (log scale) / 2005 / 1992 / 1993 / 1994 / 1995 / 1996 / 1997 / 1998 / 1999 / 2000 / 2001 / 2002 / 2003 / 2004 / 2006 / 2007 / 2008 / 2009 / 2010 / 1B / 100M / 10M / 1 billion internet users / 2031 / 2018 / 2019 / 2020 / 2021 / 2022 / 2023 / 2024 / 2025 / 2026 / 2027 / 2028 / 2029 / 2030 / 2032 / 2033 / 2034 / 2035 / 2036 / Unique sending addresses as of Dec. of each year; 2024 as of Sept. Blockchains include / Aptos, Arbitrum, Avalanche C-Chain, Base, Bitcoin, Blast, BNB Chain, Celo, Ethereum, / Fantom, Linea, Near, OP Mainnet, Polygon PoS, Scroll, Solana, Sui, TON, Tron, zkSync, and / Zora. EVM addresses active on multiple chains only contribute once to the total. / Sources: 1/ World Bank 2/ Artemis and Dune (@DarenMatsuoka). / ©2024 Andreessen Horowitz. | All rights reserved worldwide. / 5
Visuals: One line chart rendered as an image (2000 by 1184 px) at x 34.2 y 14.2, size 62 by 61.7 percent. Type: multi-series line chart with a log-scale y axis and year on the x axis. Title (text above chart): 'Internet users¹ vs. monthly active crypto addresses² (log scale)'. Y axis labels (log scale, no units printed beyond the labels): 10M at bottom, 100M in the middle, 1B near the top; gridlines are light grey horizontal lines at these levels. X axis: calendar years 1992 to 2010 printed in green along the top of the chart and 2018 to 2036 printed in orange along the bottom; vertical light-grey gridlines at each year, with the 2031 column shaded by a grey band. Series 1 (green #6FB63E, labelled 'Internet users¹', markers as filled circles, line about 2.5 px): about 7M in 2018, about 10M in 2019, about 20M in 2020, about 38M in 2021, about 78M in 2022, about 118M in 2023, about 180M in 2024, about 280M in 2025, about 400M in 2026, about 500M in 2027, about 660M in 2028, about 790M in 2029, about 930M in 2030, about 1.0B in 2031, about 1.1B in 2032, about 1.3B in 2033, about 1.5B in 2034, about 1.7B in 2035, about 1.9B in 2036 (values after 2024 are estimated from the plotted positions). Series 2 (orange #FBB966, labelled 'monthly active crypto addresses²', filled circle markers): about 12M in 2018, about 14M in 2019, about 25M in 2020, about 52M in 2021, about 60M in 2022, about 73M in 2023, about 220M in 2024 (2024 as of Sept per footnote; values are estimates, no values printed). Legend: none as a separate box; series are identified by the coloured underlined words in the chart title. Highlighted points: the 2031 column is shaded grey and the annotation '1 billion internet users' (dark green #197152, bold, rotated about 90 degrees, reading upward) sits beside the 2031 point of the green series. The two series cross near 2024. Also present: a fill rectangle highlighting 'all-time high' in the headline and a wordmark logo (alózcrypto) at the bottom-left.
Slide 6
Monthly active crypto addresses / Ethereum Virtual Machine (EVM) chains: 52M / Non-EVM chains: 174M / Addresses are / proliferating / across many / blockchains, / with Base and / Solana as the / most active / Base: 22M / BNB Chain: 10M / Ethereum: 6M / Polygon PoS: 5M / Arbitrum: 3M / OP Mainnet: 1M / Celo: 1M / Linea: 1M / Scroll: 900K / zkSync: 800K / Fantom: 400K / Avalanche C-Chain: 400K / Zora: 300K / Blast: 200K / Solana: 100M / NEAR: 31M / Tron: 14M / Bitcoin: 11M / TON: 10M / Sui: 5M / Aptos: 4M / 220+ million / Monthly active addresses / Note: One address does not / necessarily correspond to one person. / For more on how we think about / active addresses and users see here. / a16z crypto / ©2024 Andreessen Horowitz. | All rights reserved worldwide. / Some of the above are a16z investments. For a full list see a16z.com/investment-list. / This content should not be considered investment advice. / EVM addresses active on multiple chains only contribute once to the total. / Sources: Artemis and Dune (@DarenMatsuoka) as of 9/30/2024. / 6
Visuals: Two horizontal bar charts with logos, no axes or gridlines. Left chart (EVM chains, total 52M, green bars, bar length proportional to value): Base 22M (longest, about 25% of slide width, label inside bar, right-aligned), BNB Chain 10M, Ethereum 6M, Polygon PoS 5M, Arbitrum 3M, OP Mainnet 1M, Celo 1M, Linea 1M, Scroll 900K, zkSync 800K, Fantom 400K, Avalanche C-Chain 400K, Zora 300K, Blast 200K; labels follow bar ends except Base and BNB Chain which sit inside bars. Right chart (Non-EVM chains, total 174M, orange bars): Solana 100M (label inside bar), NEAR 31M (inside), Tron 14M, Bitcoin 11M, TON 10M, Sui 5M, Aptos 4M, with bars shorter in proportion. Each bar has a round or square chain logo at its end: Base (blue circle), BNB Chain (gold cube), Ethereum (grey diamond), Polygon PoS (purple linked hexagons), Arbitrum (blue and white emblem), OP Mainnet (red circle with OP), Celo (yellow circle with C), Linea (black square with L), Scroll (scroll icon), zkSync (black circle with arrows), Fantom (blue hexagon), Avalanche C-Chain (red triangle circle), Zora (dark blue-grey sphere), Blast (black circle with yellow B), Solana (teal and purple stripes), NEAR (black N), Tron (red circle with triangle), Bitcoin (orange circle with B), TON (blue circle with diamond), Sui (light blue drop), Aptos (black and white striped circle). Statistic: 220+ million in heavy black sans text with Monthly active addresses below it. Left panel has a 1920 by 1080 gradient image and a 1152 by 648 full-slide background image. Logo placement: the a16z crypto wordmark is a light grey-white logotype at bottom left.
Slide 7
Mobile wallet use hit record highs, driven by growth in countries / such as Nigeria, India, and Argentina / Monthly active mobile crypto wallet users by country / Total / As percent of total / France / 30M / 100% / Spain / Brazil / Canada / Turkey / Germany / UK / 20M / Indonesia / Pakistan / Philippines / Russia / 50% / Argentina / India / Nigeria / 10M / USA / Other / 0 / 0% / 2018 / 2019 / 2020 / 2021 / 2022 / 2023 / 2024 / 2018 / 2019 / 2020 / 2021 / 2022 / 2023 / 2024 / 7 / Source: Sensor Tower as of 9/30/2024. / ©2024 Andreessen Horowitz. | All rights reserved worldwide.
Visuals: Two stacked area charts sharing one series order and one legend. Left chart: stacked area chart titled 'Total' (subtitle label, no separate chart title), y axis 0 to 30M with labelled ticks 0, 10M, 20M, 30M; x axis years 2018 to 2024 labelled at yearly ticks; values rise slowly from near zero in 2018 to about 8M in 2020, climb steeply through 2021 to about 14M, peak near 2022 at about 25M, dip to about 20M in 2023, then reach about 28M near late 2024 with a sharp spike. Right chart: 100 percent stacked area chart titled 'As percent of total', y axis 0% to 100% labelled 0%, 50%, 100%; x axis years 2018 to 2024; Other (grey) is about 45 percent in 2019 and about 35 percent in 2024; USA (slate blue) is about 40 percent of the total in 2018 to 2019, falling to about 25 percent around 2021 and about 20 percent by 2024; Nigeria, India and Argentina bands widen from 2020 onward, with India (pink) about 15 percent and Nigeria about 10 percent in 2023 to 2024; no numeric values are printed on the right chart, so all these are estimates. Legend (right of the charts, top to bottom): France orange #FF9A5A, Spain slate #5F6B7A, Brazil teal #6A9E8A, Canada yellow #FFE15A, Turkey aqua #8EDBE0, Germany light green #9BD17A, UK lavender #D9A3E8, Indonesia light pink #FFC4D3, Pakistan mauve #9E74B0, Philippines pale cyan #A8EEFA, Russia dark green #4E7F57, Argentina pale yellow-green #E5FA8A, India pink #F772B4, Nigeria peach #FCCF96, USA slate blue #5A8FA3, Other grey #B3B3B3. Highlighted: the phrase 'record highs' in the title sits on a lime highlight block. Logo: outlined grey wordmark 'alózcrypto' at bottom left.
Slide 8
We estimate that only 5–10% of crypto owners are active users — / there’s a big opportunity to re-engage passive holders onchain / 30–60M / Estimated monthly / active users⁴ / How do we estimate crypto users? / 1/ Apply filtering and de-duplication to active / addresses to remove bots and transient addresses. / 2/ Extrapolate using reported wallet users (e.g., / Metamask) and mobile wallet market share data. / For more on how we think about active addresses / and users see here. / 617M / Estimated global / crypto owners³ / 220M / Monthly active / addresses² / 27M / Monthly mobile / wallet users¹ / Sources: / 1/ Sensor Tower as of Sept 2024 / 2/ Artemis and Dune as of Sept 2024 / (EVM addresses active on multiple chains / only contribute once to the total) / 3/ Crypto.com as of June 2024 (refers to / people who own crypto, but are not / necessarily transacting onchain) / 4/ a16zcrypto.com/posts/article/ / estimating-crypto-users/ / 8 / ©2024 Andreessen Horowitz. | All rights reserved worldwide.
Visuals: Concentric semicircular diagram (nested arches) centred at x 50%, base on the bottom edge. Outer arch: pale mint #D2EEE3 with a 21% #22AF78 tint over the lower area, spanning the full width from about y 24% down. Middle arch: muted teal #7CB9A8, spanning x 19.6% to 81.2%, top at y 56.4%. Inner arch: bright yellow-green #E2FF6B ring with a dotted dark outline, spanning x 36.1% to 63.9%, top at y 79%, containing a solid teal #00958B semicircle spanning x 39.2% to 60.8%, top at y 84.6%. Callout 1: a yellow #E2FF6B box with a dotted dark border at x 15.1% to 37.9%, y 35% to 53.1%, holding the figure 30–60M with the caption Estimated monthly active users⁴. Connector: a yellow #E2FF6B line about 3 px wide runs horizontally from the right edge of the callout (x 37.9%, y 40.9%) to x 50%, then straight down to the top of the inner yellow arch at y 79%. Figures in the diagram: 617M in teal #00958B at the outer arch right side, captioned Estimated global crypto owners³; 220M in white on the middle arch, captioned Monthly active addresses²; 27M in white on the inner teal arch, captioned Monthly mobile wallet users¹. No chart axes or legend. Translucent white panel #FFFFFF at 44% opacity behind the left text, x 3.6% to 37.9%, y 53.2% to 86.5%. Logo: the alozcrypto wordmark in light grey outline at bottom-left, x 2.2% to 9.8%, y 93.6% to 96.2%.
Slide 9
02 / State of Crypto 2024 /
Crypto has become a
key political issue
©2024 Andreessen Horowitz. | All rights reserved worldwide.
9
Visuals: A full-bleed abstract background image of soft pink-to-purple blurred gradient blobs at the top and bottom, with a central horizontal band of blocky mosaic-like rectangles in pink, magenta and violet. No charts, photographs of people or diagrams. One logo: the white a16z crypto wordmark at bottom-left, rendered as lowercase text 'a16zcrypto' with a stylised 'a' and 'z'. The band has no outline and the mosaic tiles are semi-transparent over the gradient.
Slide 10
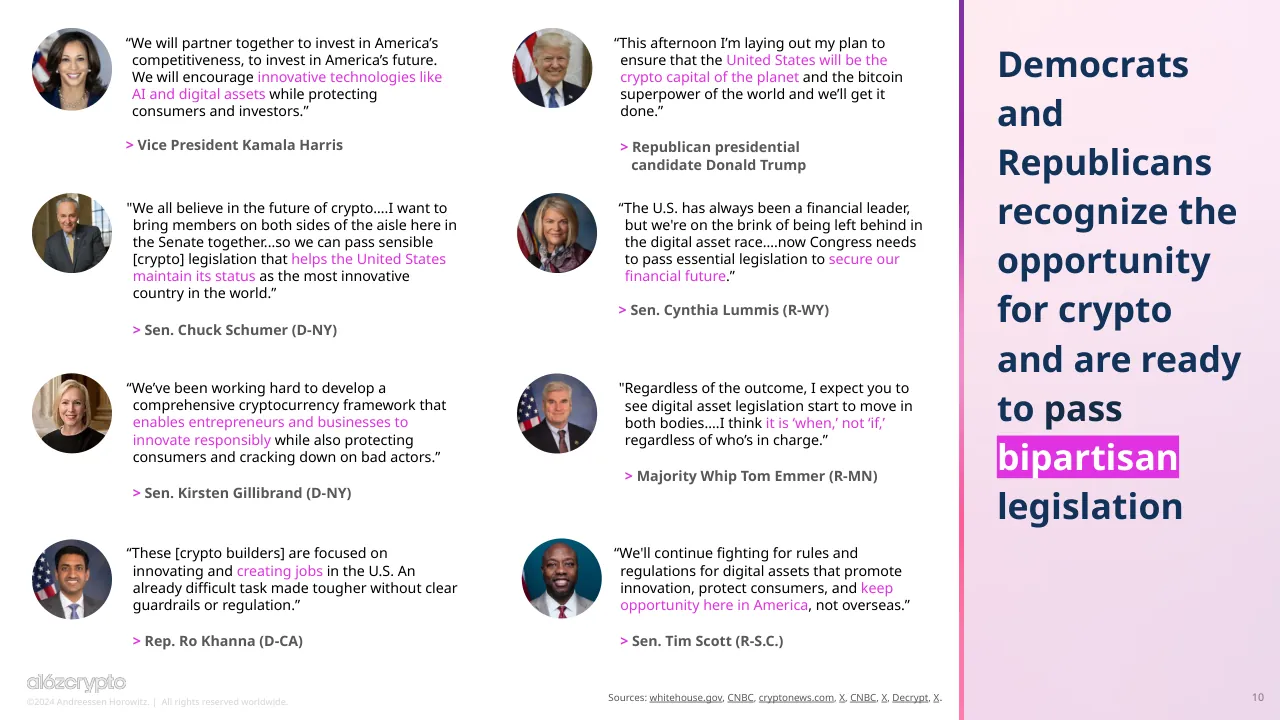
“We will partner together to invest in America’s competitiveness, to invest in America’s future. We will encourage innovative technologies like AI and digital assets while protecting consumers and investors.” / > Vice President Kamala Harris
“This afternoon I’m laying out my plan to ensure that the United States will be the crypto capital of the planet and the bitcoin superpower of the world and we’ll get it done.” / > Republican presidential candidate Donald Trump
"We all believe in the future of crypto….I want to bring members on both sides of the aisle here in the Senate together...so we can pass sensible [crypto] legislation that helps the United States maintain its status as the most innovative country in the world." / > Sen. Chuck Schumer (D-NY)
“The U.S. has always been a financial leader, but we're on the brink of being left behind in the digital asset race….now Congress needs to pass essential legislation to secure our financial future.” / > Sen. Cynthia Lummis (R-WY)
“We’ve been working hard to develop a comprehensive cryptocurrency framework that enables entrepreneurs and businesses to innovate responsibly while also protecting consumers and cracking down on bad actors.” / > Sen. Kirsten Gillibrand (D-NY)
"Regardless of the outcome, I expect you to see digital asset legislation start to move in both bodies....I think it is ‘when,’ not ‘if,’ regardless of who’s in charge.” / > Majority Whip Tom Emmer (R-MN)
“These [crypto builders] are focused on innovating and creating jobs in the U.S. An already difficult task made tougher without clear guardrails or regulation.” / > Rep. Ro Khanna (D-CA)
“We'll continue fighting for rules and regulations for digital assets that promote innovation, protect consumers, and keep opportunity here in America, not overseas.” / > Sen. Tim Scott (R-S.C.)
Democrats / and / Republicans / recognize the / opportunity / for crypto / and are ready / to pass / bipartisan / legislation
Sources: whitehouse.gov, CNBC, cryptonews.com, X, CNBC, X, Decrypt, X
©2024 Andreessen Horowitz. | All rights reserved worldwide.
10
Visuals: Eight circular headshots of US politicians, each cropped to a circle with a thin dark frame, arranged in two columns of four: Kamala Harris (top left, smiling woman with dark hair and pearl necklace, navy background); Donald Trump (top right, man in dark suit, white shirt, blue tie, American flag behind); Chuck Schumer (second row left, man in grey suit and yellow tie, blurred background); Cynthia Lummis (second row right, smiling woman with blonde hair and patterned scarf, flag behind); Kirsten Gillibrand (third row left, smiling woman with blonde hair in black top, dark background); Tom Emmer (third row right, man in dark suit and red tie, flag pin, flag behind); Ro Khanna (bottom left, smiling man in dark suit, flag behind); Tim Scott (bottom right, smiling man in grey suit and red tie, teal background). Photos are head-and-shoulders portraits, soft front lighting, dominant colours navy, grey and white. A small grey outlined al6zcrypto wordmark sits bottom left. A magenta #E032E0 rectangle sits behind the word 'bipartisan' in the title panel, which is set in white text. Hyperlinked source names are underlined.
Slide 11
Crypto interest is rising in several swing states — Pennsylvania
and Wisconsin see Top 5 biggest jumps
Crypto search interest (as a proportion of total searches in each state)
Change in rank from 2020–2024¹
North Dakota
Arkansas
Minnesota
Pennsylvania
Wisconsin
New Hampshire
Oregon
Michigan
Iowa
New Jersey
Florida
Connecticut
Indiana
Oklahoma
Ohio
New York
Rhode Island
Idaho
Texas
South Dakota
Hawaii
Kentucky
Maryland
Kansas
West Virginia
Massachusetts
Georgia
California
+14.3
+4.7
+3.3
+5.3
-2.0
-3.0
+0
Alabama
Louisiana
Colorado
Illinois
Alaska
South Carolina
Vermont
Nebraska
Tennessee
Nevada
Mississippi
Missouri
Montana
Arizona
Washington
Wyoming
Virginia
North Carolina
Utah
Delaware
District of Columbia
Maine
-9.7
New Mexico
9.7 14.3
11
1/ Ranking based on an average across searches for “bitcoin”, “ethereum”, “crypto”. 2024 includes data through 9/30/2024.
Source: Google Trends.
©2024 Andreessen Horowitz. | All rights reserved worldwide.
Visuals: Chart 1: choropleth map of the contiguous United States with Alaska and Hawaii inset at lower left, states filled on a diverging scale from magenta (9.7) through white to dark green (14.3). Highlighted states are extruded in 3D with bright yellow-green #E2FF6B side faces and drop shadows: Nevada (-2.0), Arizona (-3.0), Wisconsin (+4.7), Michigan (+3.3), Pennsylvania (+5.3, extruded at the right-centre Mid-Atlantic position), and Georgia (+0). Legend: horizontal gradient bar with left label 9.7 and right label 14.3. Chart 2: horizontal bar chart titled Change in rank from 2020–2024¹, shown in two stacked panels. Top panel on a light teal #00958B at 20% opacity background: North Dakota, Arkansas, Minnesota, Pennsylvania, Wisconsin, with green bars (+14.3 printed at Arkansas row, the longest bar is North Dakota) and bars continuing down through New Hampshire to California in medium green #7DB36A, shading toward pale green. Bottom panel with a vertical dark grey axis line: Alabama through New Mexico in pink-magenta #E8539A bars, with the longest negative bar New Mexico labelled -9.7. Values for unlabelled bars are not printed; the bars decline in length in list order. Highlighted labels: Pennsylvania, Wisconsin, Michigan, Georgia, Nevada, Arizona with yellow-green #E2FF6B highlight boxes. Logo: al6zcrypto wordmark, light grey-white, bottom left.
Slide 12
40+ million
Americans own
crypto¹ — they
are young,
bipartisan, and
supportive of
pro-crypto
candidates
25% of Americans aged 18–34 own crypto
51% say they’re likely to throw their weight
behind crypto-friendly candidates
In swing states, 41% identify as Democrats, 39%
identify as Republicans, and 20% identify as
Independent or Other
1/ Source: Morning Consult as of April 2024. Reports from Pew Research in 2021, 2022, and 2023 provide a similar estimate, a figure the White House also used in a
2022 fact sheet. However, a 2024 Federal Reserve study based on data from 2023 reports that the number may be slightly lower at 18 million.
All other stats were sourced from the Coinbase State of Crypto Report as of August 2024.
12
©2024 Andreessen Horowitz. | All rights reserved worldwide.
Visuals: Three pie charts, stacked vertically in the right column, none with a title, axis, or legend. Pie 1 (top, about x 33.8 y 4.5 w 8.5 h 13.2 percent): a circle split into a quarter slice in light teal #4FB0BE at the top-right and three quarters in dark teal #295E66; the slice is labelled by the adjacent text 25%. Pie 2 (middle, about x 33.8 y 37 w 8.5 h 13.2): a circle split into a right half in violet #9050D8 and a left portion in dark purple #4B2A70, about 51% and 49%; no printed values beyond 51%. Pie 3 (bottom, about x 33.8 y 74 w 8.5 h 15): a circle with a blue #0044FF wedge of 41% on the upper right, a red #FF0000 wedge of 39% on the lower left, and a grey #999999 wedge of 20% at the upper left; the three wedges correspond to the coloured numbers in the adjacent sentence. Pie wedges have no outlines. Left panel: a pink-to-lavender vertical gradient field with no photograph or pattern, plus a thin magenta-to-violet vertical gradient strip at the column boundary. Logo: the al6zcrypto wordmark in pale grey outline, about 2.2% from left, at y 93.6, w 7.6, h 2.6 (small, low-contrast).
Slide 13
Major crypto policy calls for input
2019 / 2020 / 2021 / 2022 / 2023 / 2024 YTD
48 / 30 / 20 / 5 / 4 / 4
By topic / By authority / By jurisdiction
Market structure & rules (60) / Stablecoins (26) / Illicit finance (12) / DeFi (6) / Tax (5) / Energy & climate (2)
EU Banking Authority (17) / EU Securities & Markets Authority (8) / UK Financial Conduct Authority (6) / UK HM Treasury (5) / Australian Treasury (4) / Other (71)
EU (26) / UK (19) / USA (16) / EU Ntl. Authority (16) / UAE (5) / Other (29)
The EU and UK lead when it comes to public engagement on crypto policy and regulation
Source: a16z crypto analysis as of 9/30/2024.
©2024 Andreessen Horowitz. | All rights reserved worldwide.
13
Visuals: Chart 1: vertical bar chart titled 'Major crypto policy calls for input', six pink bars for 2019, 2020, 2021, 2022, 2023 and 2024 YTD, each with a value label above it: 2019 = 5, 2020 = 4, 2021 = 4, 2022 = 20, 2023 = 48, 2024 YTD = 30. No axis numbers are printed; the category axis is at the bottom with no unit given. Five light grey horizontal gridlines run across the plot at about 20% intervals of the plot height, with the baseline darker. Bars are pink #F9AAC1 with a slightly darker pink #E88FA8 outline. No legend and no highlighted points. Bar panel 'By topic': cyan horizontal bars in #8DEEFA, labelled Market structure & rules (60) (longest), Stablecoins (26), Illicit finance (12), DeFi (6), Tax (5), Energy & climate (2); labels for the first two sit inside the bar end, the rest sit just right of the bar. Bar panel 'By authority': teal #5FCFD6 bars, labelled EU Banking Authority (17), EU Securities & Markets Authority (8), UK Financial Conduct Authority (6), UK HM Treasury (5), Australian Treasury (4), Other (71) (longest, label inside bar end). Bar panel 'By jurisdiction': dark purple #653A7E bars, labelled EU (26), UK (19), USA (16), EU Ntl. Authority (16), UAE (5), Other (29) (longest). Bar lengths are proportional to the values within each panel. Logo: a16z crypto wordmark in light grey outline, bottom-left. Right panel: a soft pink-to-lilac gradient background image with faint decorative shapes at the bottom right.
Slide 14
The crypto industry is on a path toward more regulatory clarity / after some major policy wins in 2024 / Wyoming Decentralized / Unincorporated Nonprofit / Association Act (DUNA) / March 2024 / Signed into law with an effective date / of July 1, 2024 / Recognizes DAOs as legal entities, / enabling blockchain networks to operate / lawfully without compromising their / decentralization / U.S. Financial Innovation / and Technology for the 21st / Century Act (FIT21) / May 2024 / Passed the House with bipartisan / support, including 71 Democrat votes / Provides regulatory clarity for crypto, / protects consumers from bad actors, / and promotes American innovation — / pending Senate approval / EU Markets in / Crypto-Assets Regulation / (MiCA) / December 2024 / Goes fully into effect, after approval / by a large majority in 2023 / The European Union’s first / comprehensive regulatory framework / involving crypto assets and related / service providers / 14 / ©2024 Andreessen Horowitz. | All rights reserved worldwide.
Visuals: Three square icon images, one per column, each about 3.7% wide and 6.5% high. Left column: dark purple (#3B1F5C) block pattern forming an arch-like motif. Middle column: mint green (#6EDBA0) pattern of circles and curved shapes with thin grey outlines. Right column: cyan (#3ED8E6) square tile pattern with octagonal and rounded shapes and white gaps. A small al6zcrypto wordmark logo in light grey outline sits bottom-left. No charts, photographs or tables; the header is a soft pink-to-lavender gradient band and the rule under it runs pink to purple.
Slide 15
The SEC’s Bitcoin / and Ethereum / ETP approvals / have broadened / investor access / to crypto
Bitcoin and Ethereum exchange-traded products (ETPs) daily net flows¹
$2B
Bitcoin ETPs listed January 10th, 2024
$1B
$0
-$1B
-$2B
Feb
Mar
Apr
May
Jun
Jul
Aug
Sep
$58B
Total onchain holdings
$200M
Ethereum ETPs listed July 24th, 2024
$100M
$0
-$100M
-$200M
$7B
Total onchain holdings
Note: Though commonly called ETFs, these / are actually registered as ETPs using SEC / Form S-1, indicating the underlying / portfolios are not comprised of securities.
1/ Net flows exclude flows into pre-existing products like the Grayscale Bitcoin and Ethereum / Trusts which were eventually converted to ETPs.
Source: Dune (@hildobby) as of 9/30/2024.
15
©2024 Andreessen Horowitz. | All rights reserved worldwide.
Visuals: Two stacked vertical bar charts of daily net flows. Top chart: Bitcoin and Ethereum exchange-traded products (ETPs) daily net flows, bars in green (#7AB648-like), y axis in US dollars from -$2B to $2B with gridlines at $2B, $1B, $0, -$1B, -$2B; x axis labelled by months Feb, Mar, Apr, May, Jun, Jul, Aug, Sep (no unit labels). Series label box 'Bitcoin ETPs listed January 10th, 2024' with green fill. Highest bar about +$1.6B in early August; lowest bar about -$1.5B in late July/early August; a prominent spike about +$1.1B in March and about +$0.9B in June. Legend: none beyond the series label. Highlighted: the Aug spike and its negative counterpart. Bottom chart: Ethereum ETPs daily net flows, bars in orchid purple (#C86FD6-like), y axis from -$200M to $200M with gridlines at $200M, $100M, $0, -$100M, -$200M; no x axis labels; series label 'Ethereum ETPs listed July 24th, 2024' with magenta-purple fill. Bars begin around late July with largest about +$110M and lowest about -$155M; a late positive about +$70M near end of series. Total callouts: $58B in green for Bitcoin and $7B in purple for Ethereum, each followed by 'Total onchain holdings'.
Slide 16
The U.S. dollar faces competition from foreign sovereign digital / currencies / Status of worldwide central bank digital currencies (CBDCs)¹ / CBDC developments / between banks have / doubled since Russia’s / invasion of Ukraine and / resulting sanctions.² / There are now 13 cross-border / projects between banks, / including mBridge, which / connects Thailand, China, Hong / Kong, UAE, Saudi Arabia, and / others. / Cancelled / Research / Proof of concept / Pilot / Launched / 16 / Sources: 1/ cbdctracker.org as of 9/30/2024 2/ Atlantic Council CBDC Tracker as of 9/30/2024. / ©2024 Andreessen Horowitz. | All rights reserved worldwide.
Visuals: Choropleth world map of CBDC status by country, equirectangular projection with Antarctica absent. Countries coloured by status: Cancelled in coral red (#E8828A-ish) for Ecuador-area and Kenya-area countries; Research in pale mint green (#A8DCCB-ish) for Mexico, much of Africa, Central Asia, Argentina, Chile, Pakistan-area, Korea-area; Proof of concept in lavender purple (#A896D6-ish) for Canada, USA, Alaska, Norway, Ukraine, Brazil, Australia, Thailand, Indonesia, Japan-area and New Zealand; Pilot in peach tan (#EBC9A4-ish) for Russia, Western Europe, Saudi Arabia, India, Mongolia and China; Launched in bright blue (#5FA8F0-ish) for Nigeria and Bahamas-area Zambia-area country near southern Africa. Greenland and unclassified countries shown in very pale grey-blue (#F3F6FB-ish). Legend: five square swatches with labels Cancelled, Research, Proof of concept, Pilot, Launched. Map has no highlighted points beyond the highlighted word; no axes, no photograph, no logos inside the map.
Slide 17
Stablecoins can strengthen the U.S. dollar’s position as its global / reserve currency status slips / Currency share in the global economy¹ ² / US dollar / Japanese yen / Other / Euro / Chinese renminbi / 58% USD / Foreign exchange reserves / 65% / 60% / 55% / 2016 / 2017 / 2018 / 2019 / 2020 / 2021 / 2022 / 2023 / 2024 / 64% USD / International debt / 52% USD / International loans / 48% USD / International payments (SWIFT) / Currency share of stablecoins³ / >99% USD / 0.20% / Euro / 0.007% / Yen / 0.002% / Renminbi / 0.04% / Other / Sources: 1/ Stablecoin report by Castle Island Ventures, Brevan Howard Digital, / and Artemis (Sept 2024) 2/ IMF as of 6/30/2024 3/ CoinGecko as of 9/30/2024. / 17 / ©2024 Andreessen Horowitz. | All rights reserved worldwide.
Visuals: Chart 1 (top-left): pie chart titled Currency share in the global economy¹ ² with a caption Foreign exchange reserves beneath it. Pie about 58% US dollar (purple, label 58% USD), with slices for Euro (light cyan, about 15%), Japanese yen (light yellow-green, about 5%), Chinese renminbi (red-orange, about 2%) and Other (light grey, about 10%). A translucent purple-to-lavender wedge connects the pie to Chart 1b. Chart 1b: filled area chart of the US dollar share, y-axis 55% to 65% with gridlabels at 55%, 60%, 65%, x-axis years 2016 to 2024. Values about: 2016 about 65.5%, 2017 about 65%, 2018 about 63%, 2019 about 62%, 2020 about 61%, 2021 about 59%, 2022 about 59%, 2023 about 59%, 2024 about 58%. Area fill dark purple #633A7E, no outline. Legend box (navy #12335A outline, thin 1px border, white fill) with entries US dollar (purple square), Japanese yen (yellow-green square), Other (light grey square), Euro (cyan square), Chinese renminbi (red-orange square). Row of three pies beneath: International debt pie 64% USD (purple), Euro about 15%, Yen about 3%, Renminbi about 2%, Other about 16%; International loans pie 52% USD, Other about 22%, Yen about 3%, Euro about 17%; International payments (SWIFT) pie 48% USD, Euro about 25%, Yen about 5%, Renminbi about 3%, Other about 12%. Each pie has its USD label in white bold inside the purple slice, and a caption below in navy. Right panel: large pie titled Currency share of stablecoins³ with label >99% USD in white centred on a purple slice filling nearly the whole pie; a very thin cyan sliver at the top for Euro. Legend beneath the pie: cyan square 0.20% Euro, yellow-green square 0.007% Yen, red square 0.002% Renminbi, light grey square 0.04% Other. Logo: a16z crypto wordmark in pale grey outline at bottom-left.
Slide 18
Stablecoins are only a decade old — now they’re a Top 20 and / rising holder of U.S. debt / Stablecoins compared to major foreign holders of U.S. Treasury securities / Japan / China / United Kingdom / Luxembourg / Canada / Cayman Islands / Belgium / Ireland / France / Switzerland / Taiwan / India / Brazil / Hong Kong / Singapore / Norway / Saudi Arabia / South Korea / Mexico / Stablecoins / Germany / $250B / $500B / $1T / $1.5T / $2T / Tether / $81 billion / held in U.S. Treasuries / Launched in 2014 / USDC / $11 billion / held in U.S. Treasuries / Launched in 2018 / Sources: U.S. Department of the Treasury and latest statements from Tether and Circle as of 6/30/2024. / ©2024 Andreessen Horowitz. | All rights reserved worldwide. / 18
Visuals: Horizontal bar chart titled 'Stablecoins compared to major foreign holders of U.S. Treasury securities'. Categories top to bottom with bars in purple (#6B3A7D approx.) except Stablecoins in green (#6FB540 approx.): Japan about $1.7T, China about $1.1T, United Kingdom about $0.98T, Luxembourg about $0.38T, Canada about $0.37T, Cayman Islands about $0.31T, Belgium about $0.31T, Ireland about $0.30T, France about $0.30T, Switzerland about $0.27T, Taiwan about $0.26T, India about $0.25T, Brazil about $0.24T, Hong Kong about $0.24T, Singapore about $0.24T, Norway about $0.19T, Saudi Arabia about $0.18T, South Korea about $0.17T, Mexico about $0.15T, Stablecoins about $0.14T (about $81B plus $11B, green), Germany about $0.14T. Value axis along the bottom labelled $250B, $500B, $1T, $1.5T, $2T with light grey vertical gridlines; no axis unit title; values are not printed on the bars, so bar lengths are estimates. No legend. A pale green-to-white gradient wedge fans from the Stablecoins bar toward the right edge of the chart. Tether logo: teal-green circle (#52AD8F approx.) with white Tether T mark. USDC logo: blue circle (#2775CA approx.) with white dollar-sign coin mark. Thin dark navy vertical rule at x about 69.5% separates chart from cards.
Slide 19
In countries
with rampant
inflation, people
turn to
stablecoins to
protect their
assets
Argentine peso (ARS) purchasing power in USD vs. stablecoin trading value with ARS on Bitso
$0.008
$0.006
$0.004
$0.002
$0.000
$80M
$60M
$40M
$20M
$0
>10,000% increase in stablecoin
trading value since Nov 2022
82% decrease in USD purchasing
power since Nov 2022
Dec 2022
Jun 2023
Dec 2023
Jun 2024
Retail-sized stablecoin value (i.e. transactions under $10,000) received in Argentina is
growing at a faster rate than value received in any other crypto asset, including BTC,
ETH, and altcoins. Bitso is a leading regional exchange in Latin America.
Source: Chainalysis Geography of Cryptocurrency
Report (Oct 2024). Data is through 6/30/2024.
19
alózcrypto
©2024 Andreessen Horowitz. | All rights reserved worldwide.
Visuals: One combination chart with two series sharing a time x-axis. Title: 'Argentine peso (ARS) purchasing power in USD vs. stablecoin trading value with ARS on Bitso'. Left y-axis: 'purchasing power' in USD per ARS, linear, $0.000 to $0.008 with gridlines at $0.002 steps. Right y-axis: stablecoin trading value in USD millions, $0 to $80M with ticks at $20M steps. X-axis: time, labelled Dec 2022, Jun 2023, Dec 2023, Jun 2024, about 20 monthly points. Series 1 (line, magenta-purple #C86BD6, about 2.5 px stroke): purchasing power, starting about $0.0064 in Dec 2022, falling steadily to about $0.0030 by Dec 2023 and about $0.0011 by Jun 2024; no printed values. Series 2 (teal #5FD0D8 bars, about 20 bars): trading value, about $0.2M, $0.6M, $0.0M, $0.2M, $0.9M, $0.9M, $0.9M, $0.9M, $1.3M, $2.4M, $4.5M, $8.7M, $7.6M, $9.2M, $11.7M, $28.7M, $63.6M, $62.1M, $61.2M, $50.7M (estimates; the slide prints no bar values). Highlights: callout '>10,000% increase' with its phrase highlighted in lime #DDF55A; callout '82% decrease' with its phrase on red #E8452C fill and white text. No legend. Callouts are white rounded rectangles with thin grey #B8B8B8 outlines, placed over the plot area.
Slide 20
As finance and tech consolidate power in Big Banks and Big Tech,
there’s a growing need for decentralization
Number of FDIC-insured banks¹
5
banks control nearly half of all assets in
the U.S. as the number of banks shrinks
By assets²
CHASE
BANK OF AMERICA
WELLS FARGO
citibank
usbank
All
Other
Banks
20K
15K
10K
5K
0
1992
1996
2000
2004
2008
2012
2016
2020
2024
Market cap of the Nasdaq 100³
6
Tech companies make up more
than half the Nasdaq 100’s value
All other
companies
100%
50%
0%
2008
2010
2012
2014
2016
2018
2020
2022
2024
NVIDIA.
Microsoft
a16zcrypto
Some of the above are a16z investments. For a full list see a16z.com/investment-list. This content should not
be considered investment advice.
Sources: 1/ FDIC as of 6/30/2024 2/ Federal Reserve as of 6/30/2024 3/ CapIQ and YCharts as of 9/30/2024.
©2024 Andreessen Horowitz. | All rights reserved worldwide.
20
Visuals: Left chart: vertical bar chart titled 'Number of FDIC-insured banks¹', solid black bars (#000000) on a white plot with light grey horizontal gridlines at 5K intervals. Y axis: number of banks, 0 to 20K, labels 0, 5K, 10K, 15K, 20K. X axis: years, labelled every four years 1992, 1996, 2000, 2004, 2008, 2012, 2016, 2020, 2024; bars run from about 1990 to 2024 (about 35 bars). No bar has printed values; estimates: first bar (1990) about 15,100, 1992 about 13,900, 1996 about 11,400, 2000 about 9,800, 2004 about 8,900, 2008 about 8,000, 2012 about 6,800, 2016 about 5,700, 2020 about 4,800, 2024 about 4,500 banks. No bars are highlighted. Overlaid callout box reads '5' (teal numeral) with 'banks control nearly half of all assets in the U.S. as the number of banks shrinks'. Inset donut chart titled 'By assets²' (source footnote 2 Federal Reserve as of 6/30/2024): ring with a light grey segment labelled 'All Other Banks' covering the left and upper-left of the ring, and an orange (#F2B76B) segment covering the right side with logos inside it top to bottom: CHASE (octagon mark), Bank of America (flag mark with BANK OF AMERICA wordmark), WELLS FARGO (black square badge), citibank (wordmark), usbank (wordmark with red-and-white mark). The donut hole is white. A grey gradient wedge runs from the bottom of the orange segment down-right to the top of the 2024 bar. Right chart: stacked area chart titled 'Market cap of the Nasdaq 100³' (source footnote 3 CapIQ and YCharts as of 9/30/2024), 2008 to about 2025 on the x axis with labels 2008, 2010, 2012, 2014, 2016, 2018, 2020, 2022, 2024; y axis 0% to 100% with labels 0%, 50%, 100%. Series from bottom to top, all estimates: dark teal #2E6F8E (Apple) about 5% in 2008 rising to about 16% in 2024; green #7DBA52 (Microsoft) above it, about 8% thick in 2008 and about 10% by 2024; purple #6F4B8F (Amazon) about 3% to 7%; light blue #9BEBF8 (Facebook) thin band; pink #F8B0C6 (Alphabet) about 5% to 15%; pale yellow-green #E2F57A (NVIDIA) top band, about 1% in 2008 and about 8% in 2024; light grey #EBEBEB region above all series is 'All other companies', about 80% in 2008 and about 37% in 2024. Callout box reads '6' (teal numeral) with 'Tech companies make up more than half the Nasdaq 100’s value'. Right-edge logo column stacked top to bottom: NVIDIA wordmark, Google G, Facebook circle f, Amazon smile logo, Microsoft four-square logo with word Microsoft, Apple logo, all in black. Bottom-left: a16z crypto wordmark in outline grey type.
Slide 21
03 / State of Crypto 2024 /
Infrastructure
is maturing
21
a16z crypto
©2024 Andreessen Horowitz. | All rights reserved worldwide.
Visuals: Full-slide background illustration: a blurred colour-gradient field overlaid with a grid of semi-transparent square tiles. The top band is teal and green, fading to deep teal at top right, with a pale mint glow at upper left. The middle band is a tiled mosaic of squares, yellow at left shifting through lime to green and deep teal at right, in horizontal rows of about 85 px. The bottom is a darker mustard-to-ochre gradient. The image is full-bleed and covers the whole slide. Its duplicate placement is recorded once here. No charts, photographs or diagrams. One white a16z crypto logo in the bottom left.
Slide 22
Crypto is multichain — with value flowing between increasingly / interoperable blockchains / USD flows between various blockchains over last 12 months / $34B outflows / $28B inflows / $13B / Ethereum / Ethereum / $11B / $4.9B / $5.7B / $3.9B / $2.9B / $2.4B / $3.6B / $3.6B / $1.4B / $1.9B / $2.3B / $3.6B / $1.1B / 22 / Some of the above are a16z investments. For a full list see a16z.com/investment-list. This content should not be considered investment advice. / Source: Artemis as of 9/30/2024. / ©2024 Andreessen Horowitz. | All rights reserved worldwide.
Visuals: Sankey flow diagram titled 'USD flows between various blockchains over last 12 months', with values in USD billions. Left column of nodes, top to bottom: Ethereum (grey-blue box with Ethereum diamond logo and label 'Ethereum'), then a blue hexagonal Arbitrum-style logo, a black circular logo with two white arrows, a blue-and-white circular logo, a purple circular logo, a light-blue droplet logo, a red circular OP logo, a green Solana-style logo, a red triangular Avalanche-style logo, a yellow circular logo, a black N-shaped logo, a teal striped circular logo, and a yellow box with black C logo at the bottom. Right column of nodes, top to bottom: blue hexagonal logo with value $13B above, Ethereum node (grey box with Ethereum logo and label 'Ethereum', no value printed), black circular logo ($4.9B), blue-and-white circular logo ($3.9B), droplet logo ($2.4B), red OP logo ($3.6B), green Solana logo ($2.3B), purple circular logo ($3.6B), red Avalanche logo, yellow circular logo, black N logo, teal striped logo and yellow C logo, with no values printed for the last five. Left values, top to bottom: Ethereum total labelled '$34B outflows' with an arrow beneath pointing right; blue hexagon $11B; black circle $5.7B; blue circle $2.9B; purple circle $3.6B; droplet $1.4B; OP $1.9B; Solana $1.1B; the remaining left nodes have no printed value. Ribbons: thick ribbons flow from Ethereum on the left (grey, about 3 to 4 grey ribbons) to the right column in a fan; coloured ribbons from each left node (blue, violet, light purple, red, green, yellow) curve up or down to the matching right-column nodes; many faint thin ribbons in pale tints cross the middle. Ribbons are semi-transparent, about 40 to 60% opacity. A dark navy label box reading '$28B inflows' with a short arrow beneath pointing right sits above the right column, with white text. Each node is a rounded-corner-free rectangle with a pastel tinted fill (blue #A9CFFA, lavender #C2B5F5, mint #9EF5C9, salmon #F79A9A, yellow #F5D27A) and a darker inner strip. The a16z wordmark is a grey outlined logo bottom-left. No photographs.
Slide 23
A significant
portion of
Ethereum
activity is
moving to L2s,
drastically
reducing costs
for users
Fees paid by L2s on Ethereum (% of all L1 fees, rolling 30d avg)¹
before and after EIP-4844
Before
After
ETH-denominated
value on L2s²
Ξ 20M
20%
In March 2024, Ethereum
implemented an upgrade (proto-
danksharding, or EIP-4844), which
significantly reduced fees for L2s.
Ξ 15M
15%
Ξ 10M
10%
Ξ 5M
5%
Ξ 0
0%
2021
2022
2023
2024
EIP-4844 is an Ethereum upgrade designed to reduce fees for layer twos (L2s),
networks designed to increase capacity and lower onchain transaction costs. This
may exclude some onboarding and exit costs.
Sources: 1/ Dune (@funnyking) as of 9/30/2024 2/ L2Beat as of 9/30/2024.
23
©2024 Andreessen Horowitz. | All rights reserved worldwide.
Visuals: One chart, a combined area and line chart titled 'Fees paid by L2s on Ethereum (% of all L1 fees, rolling 30d avg)' with superscript 1, subtitled 'before and after EIP-4844'. Left y-axis labelled in ETH units from 0 to 20M, with tick labels Ξ 0, Ξ 5M, Ξ 10M, Ξ 15M, Ξ 20M, in navy label boxes with white text. Right y-axis in percent from 0% to 20%, with tick labels 0%, 5%, 10%, 15%, 20% in pale cyan label boxes with navy text. X-axis years 2021, 2022, 2023, 2024 in grey, spanning roughly mid-2020 to late 2024. Horizontal gridlines in light grey at each left-axis tick. Series 1, a filled light teal area (fees paid by L2s as % of L1 fees, right axis) that rises from near 0% in 2020 to a peak of about 12.5% in early 2023, a drop to about 10% then about 13% through 2023, a sharp peak of about 17% in mid-2024 with values near 10 to 15% through late 2024, and then a steep fall after March 2024 to about 1% by late 2024. Series 2, a thin dark navy line (ETH-denominated value on L2s, left axis) that rises from about 0 in 2020 to about 5M ETH by early 2023 and about 10M to 15M ETH through 2024; values are estimates marked about. A vertical divider at the March 2024 upgrade splits the chart into Before and After regions; the After region is shaded with a translucent teal tint. Arrows under the words Before and After are thin navy lines pointing left and right respectively. An annotation label reading ETH-denominated value on L2s² in white on a navy box sits above the right end, with a thin navy leader line dropping to the dark navy line near 2024. Highlighted points: none marked beyond the shaded After region and the annotation. Legend: none. The chart is not cropped and sits in an unboxed white area.
Slide 24
Cost to send USD internationally
$44
via international wire transfer
$12
via USDC on Ethereum (2021 avg gas price)
$1
via USDC on Ethereum (Sept 2024 avg gas price)
<$0.01
via USDC on Base L2 (Sept 2024 avg gas price)
USDC is a popular stablecoin. Base is a layer two (L2) network. Gas price refers to the cost to perform a transaction. The figures above may exclude some onboarding and exit costs.
Some of the above are a16z investments. For a full list see a16z.com/investment-list. This content should not be considered investment advice.
Sources: Bankrate, Etherscan, Basescan, and CoinGecko as of 9/30/2024.
©2024 Andreessen Horowitz. | All rights reserved worldwide.
24
Ethereum scaling efforts have slashed onchain transaction costs by over 99%
Visuals: Diagram: a vertical cost ladder of four stacked horizontal pill-shaped rows, each row a rounded rectangle with a fully rounded left and right end, connected by short vertical teal lines. Row 1 (top) is a pill with a dashed light-grey outline containing the value about $44 in bold teal and the label via international wire transfer. Row 2 is a pill with a thin solid grey outline containing $12 in bold teal and the label via USDC on Ethereum (2021 avg gas price), with 2021 underlined. Row 3 is a pill with a thin solid grey outline containing $1 in bold teal and the label via USDC on Ethereum (Sept 2024 avg gas price), with Sept 2024 underlined. Row 4 (bottom) is a pill with a thin solid grey outline containing <$0.01 in bold teal and the label via USDC on Base L2 (Sept 2024 avg gas price), with Sept 2024 underlined. Each row's value is a large bold teal number (#24C5C9) and each label is regular dark grey text. Connectors: short teal vertical lines (#24C5C9, about 1 px) join the bottom of each pill to the top of the next, centred horizontally at about 37 percent of slide width. A column of eleven lime-green filled circles (about 1.7 percent of width each) runs down the left edge at about 7 percent x, overlapping the left ends of the pills. A lime-green downward-pointing triangle sits at the left end of the bottom row. No photographs, charts with values, or logos other than the a16z wordmark. Values are printed on the slide, so no estimates are needed.
Slide 25
While Ethereum is committed to L2 scaling, other high-throughput
blockchains are gaining traction
Total value locked in non-EVM blockchains¹
NEAR
Combined daily active addresses²
TON
Aptos
9.4 million
Sui
Solana
$15B
7.5M
$10B
5.0M
$5B
2.5M
$0
0
2023
2024
25
Some of the above are a16z investments. For a full list see a16z.com/investment-list.
Non-EVM layer 1 blockchains are Ethereum Virtual Machine (EVM) incompatible.
This content should not be considered investment advice.
Sources: 1/ DefiLlama as of 9/30/2024 2/ Artemis as of 9/30/2024.
©2024 Andreessen Horowitz. | All rights reserved worldwide.
Visuals: Chart: stacked area chart with a combined line overlay, titled 'Total value locked in non-EVM blockchains¹' with a superscript 1 footnote marker. Left y-axis labelled in US dollars from $0 to $15B with gridlines at $5B, $10B and $15B; the plot rises to about $17B at the right edge, the top of the range being unlabelled. Right y-axis labelled 0, 2.5M, 5.0M and 7.5M, with a grey callout box reading 9.4 million at the top right end of the line. X-axis labels 2023 (left edge) and 2024 (about one-third of the way from the right), with light grey vertical gridlines at about the 2023 mid-year, at 2024 and at about late 2024. Series stacked from bottom to top: Solana (purple, about $12-13B by the end of the period, about $1B at start of 2023), Sui (light cyan, about $1-2B at the end), Aptos (dark teal, about $1-2B at the end), TON (light orange, about $1-2B at the end) and NEAR (light green, top band). Total stack peaks near $17B at the far right and shows a sharp dip to about $9B in late 2024 for Solana. Combined daily active addresses is a dark grey line (about 1.5M at start, about 2.5M in mid-2023, about 4.3M at start of 2024, about 6M at late 2024 peak, climbing to 9.4 million in the last point) on the right axis. Legend at upper left: NEAR (green square), TON (orange square), Aptos (dark teal square), Sui (light cyan square), Solana (purple square), listed top to bottom, plus a dark line swatch labelled Combined daily active addresses² to the right of NEAR. No values are printed on the series other than the 9.4 million callout. Logo: a16z crypto wordmark in outlined grey lettering at bottom left.
Slide 26
Blockchains now process 50x as many transactions per second as / they did just four years ago / Number of blockchain transactions processed per second / Bitcoin / Ethereum L1 / Tron / Ethereum L2s / Solana / January 1st, 2020 / September 30th, 2024 / 1 Second / 1 Second / 26 / One dot represents one transaction. / Some of the above are a16z investments. For a full list see a16z.com/investment-list. This content should not be considered investment advice. / Sources: L2Beat and Chainspect as of 9/30/2024. / ©2024 Andreessen Horowitz. | All rights reserved worldwide.
Visuals: Hexagon dot chart (a unit-of-measure diagram, not a conventional axis chart). Each hexagon is one blockchain transaction processed in one second. Title: Number of blockchain transactions processed per second. Legend in header row, left to right: dark rust hexagon Bitcoin, lime-green hexagon Ethereum L1, orange hexagon Tron, teal hexagon Ethereum L2s, lavender-purple hexagon Solana. Left panel labelled January 1st, 2020: three small faded clusters of hexagons (about 1 second each) with the dots in the same colours but very pale; the middle cluster is the most saturated, showing a few rust, lime and orange hexagons. A bracket-style label 1 Second sits below it. Right panel labelled September 30th, 2024: one dense grid of about 1 second of transactions, arranged in vertical colour bands from left to right: a column of about 8 rust Bitcoin hexagons at top then lime Ethereum L1 hexagons below, then an orange Tron band about 4 hexagons wide, a teal Ethereum L2s band about 13 hexagons wide, and a lavender Solana block filling the rest to the right edge. A thin navy horizontal line with end ticks crosses the grid at about 74% height, labelled 1 Second in a white-backed box. Faded edge columns of pale hexagons at x 90.9% (rust, orange, pale green, pale teal tints) and at far left of the 2020 panel show the continuing grid. Hexagons are flat-top with white gaps; no axes, no units beyond per second.
Slides 27 to 58 continue in the full text file.
Download this deck
The hosted PDF of every library deck is free for readers of the SlideDeck Co newsletter. Join with your email and the viewer and download appear here.
Preparing a results presentation or business update of your own? The SlideDeck Co Standard Deck is a slide library for business reviews, updates and plans.







