
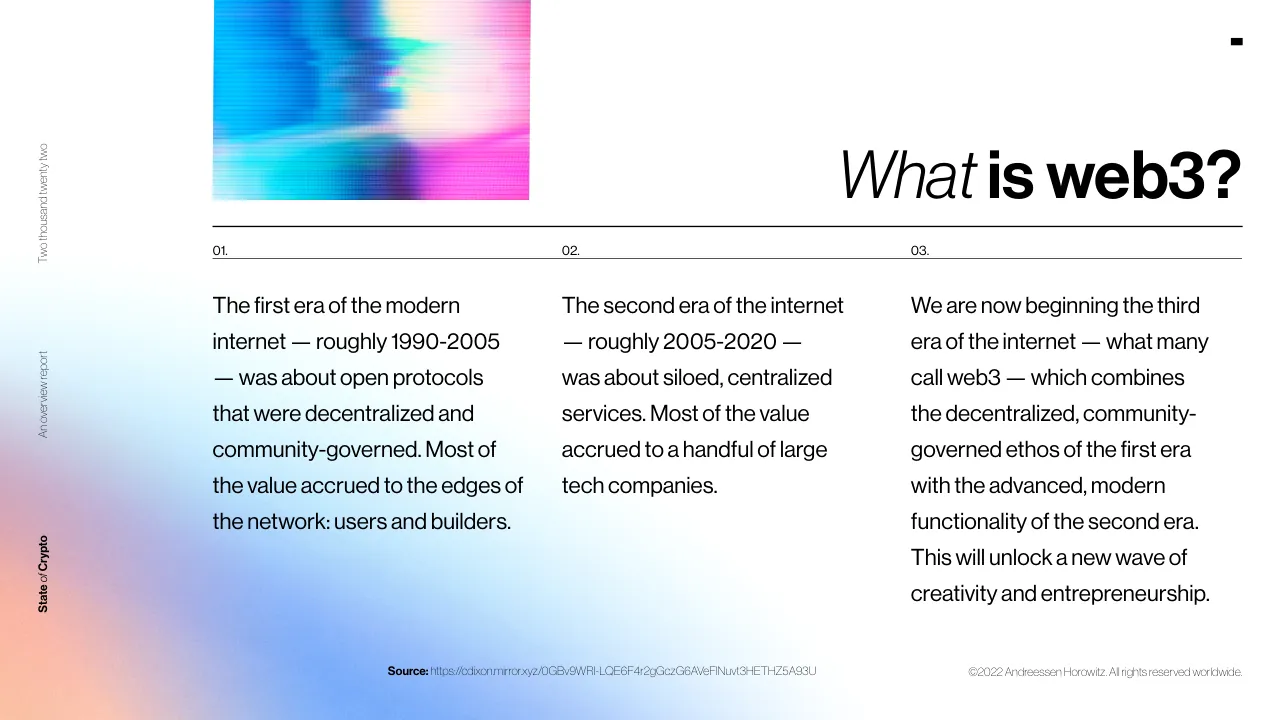
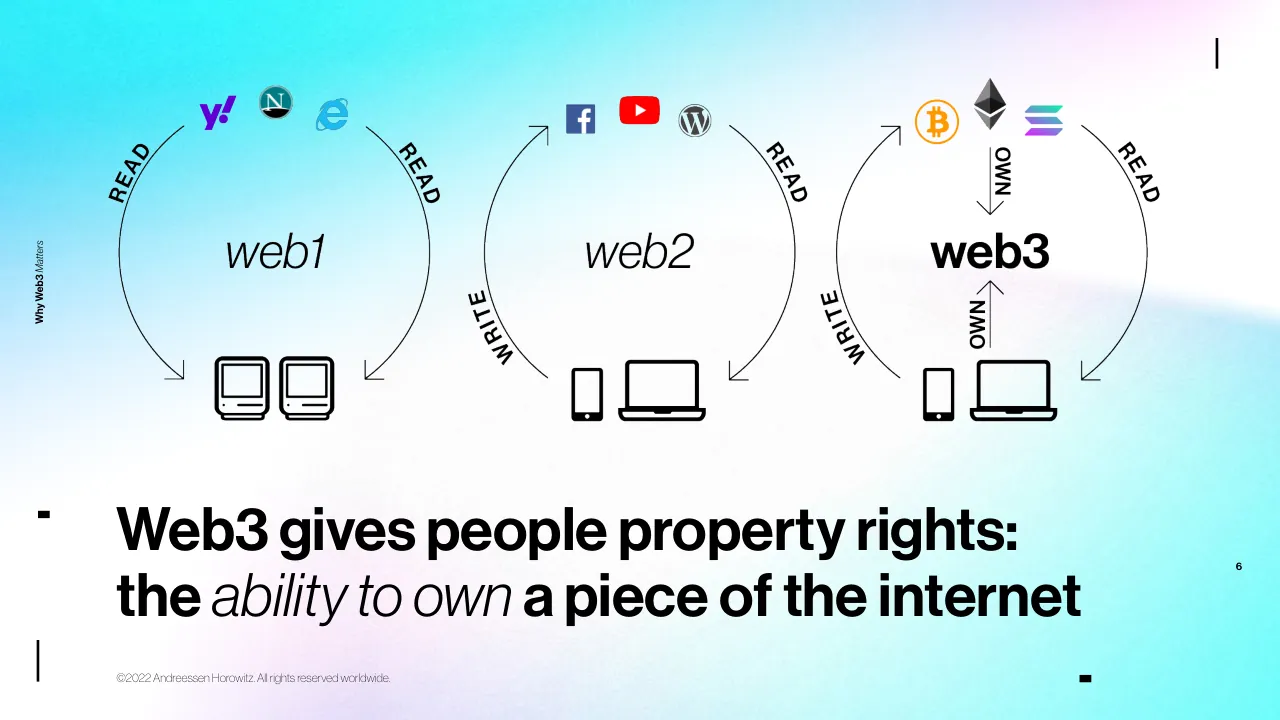
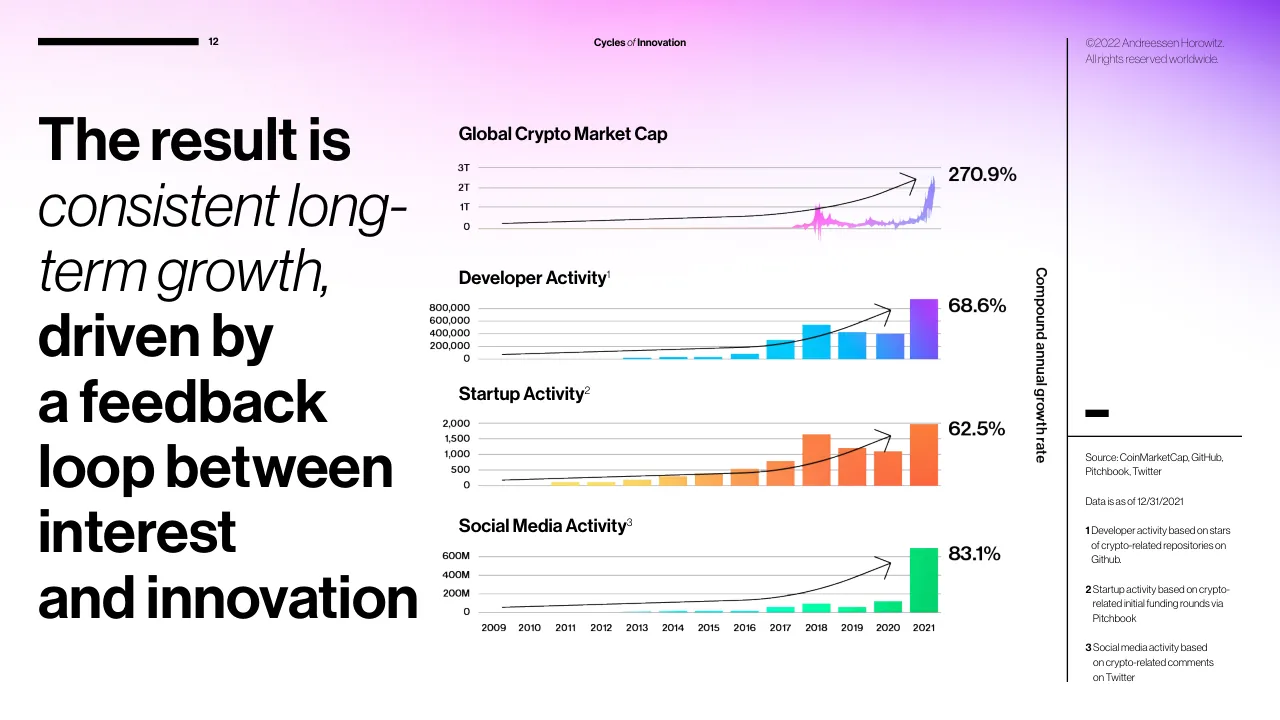
The deck opens with a title slide and frames web3 as the third era of the internet, contrasting it with the open protocols of the first era and the siloed platforms of the second. It then explains why web3 matters, covering the flaws of today's internet, the extractive behaviour of web2 companies, property rights, and value alignment across network participants. A section on cycles of innovation follows, showing how price, interest, new ideas and startups feed one another. The main body surveys layer 1 blockchains, layer 2 scaling, DeFi, stablecoins, NFTs, web3 gaming and DAOs, each with its own divider slide and a run of data charts. The closing section lists real-world projects and predictions for the coming year, and the deck ends with a long disclosure page. Notable slides include the opening frame defining web3 in three numbered columns, the value-share slide that pairs one line of type with a simple graphic, and the cycles slide with three stacked charts and one short headline.
Slides worth studying
Questions about this deck
How many slides does the a16z crypto State of Crypto 2022 deck have?
The deck has 56 pages in total. Slide 1 is the title slide, which reads web3 State of Crypto 2022, an overview report.
What does the a16z crypto State of Crypto 2022 deck say about total value locked in DeFi?
Slide 26 states that DeFi has grown from nearly zero to over $100 billion in less than two years.
What does the a16z crypto State of Crypto 2022 deck say about stablecoin velocity?
Slide 34 says the on-chain velocity for today's top stablecoins varies drastically, with Dai at 110.74, USDC at 60.38 and Tether at 2.52.
How does the a16z crypto State of Crypto 2022 deck describe web3 as the third era of the internet?
Slide 2 says the third era, which many call web3, combines the decentralized, community-governed ethos of the first era with the advanced, modern functionality of the second era.
Details
- Company: a16z crypto
- Year: 2022
- Type: Report-style deck
- Industry: Crypto and web3
- Pages: 56
More from a16z crypto
All a16z crypto decks in the library
Review score: 8 out of 10, Strong
Presentation quality, judged with the SlideDeck Co review heuristic. Ask, evidence and idea merit are not rated here.
The deck has a clear route: era framing (2), why it matters (4 to 8), cycles (10 to 12), then a divider and a run of charts for each sector, closing with predictions (55). Nearly every content slide pairs a full-sentence headline with one chart or diagram, and the italic and bold type contrast shows where to look, so the argument can be followed without a presenter. A consistent gradient, line-grid and type system gives strong identity and rhythm. Consequential weaknesses remain: some charts have very small labels and notes (18, 30, 40, 46), a few headline columns are long and narrow (11, 12, 14), and the text-only slides (2, 55) and disclosures (56) are small and dense.
Worth keeping: Keep the headline-plus-single-visual pattern, the bold and italic emphasis in titles, the colour-coded charts and the consistent divider and gradient system.
Most useful repair: Enlarge or cut the tiny labels and footnotes on slides 18, 30, 40 and 46 and highlight the key series so the takeaway is readable at a glance.
What would change the score: Widen the stacked left-column headlines on slides 11, 12 and 14 into fewer lines, and give the closing predictions on slide 55 larger type or more visual structure.
Confidence high. 56 of 56 pages inspected on contact sheets, 4 at readable size. Reviewed 2026-11-08. Model-assisted review (claude-sonnet-5-5).
Full text of the slides (56 slides)
Every slide's words and a description of its charts and images, so the deck can be searched and rebuilt. Also available as Markdown.
Slide 1
web3
Two thousand
twenty two
State of
Crypto
An overview report
©2022 Andreessen Horowitz. All rights reserved worldwide.
gradients so based
a16z crypto
Visuals: Full-bleed pastel gradient mesh photograph covering the entire slide, with fine film grain. Colours: near-white grey #F3F4F6 at top-left, light mint #E6FBF7 at centre, saturated cyan #2EE6D6 and turquoise #3FD8E0 across the lower-left and bottom-centre, sky blue #5DB8EE at left-middle, violet #8B5CF6 and lavender #B9B6F4 at bottom-right, pale blue #A9CBF5 at far bottom-right, bright cyan #3DF0E0 at top-right. Soft blurred blends, no distinct subjects. Thin black hairline rules (about 0.2% of slide height stroke, #000000): one vertical at x about 15.1% from y 5.3% to 94.7%; one horizontal at y about 20.1% from x 3.0% to 77.8%; one vertical at x about 71.2% from y 5.3% to 94.7%; one horizontal at y about 81.6% from x 71.2% to 97.0%. Small solid black marks: a short vertical tick at x 3.0%, y 31.5%, about 0.4% wide by 1.5% tall; a vertical bar at x 3.0%, y 90.7%, about 0.3% wide by 4.2% tall; a short horizontal bar at bottom-right, x 95.2%, y 93.8%, about 1.8% wide by 1.2% tall, filled #000000. Logo: a16z crypto wordmark in black, 'a16z' in heavy geometric sans and 'crypto' in light sans, no box.
Slide 2
What is web3?
01.
The first era of the modern / internet — roughly 1990-2005 / — was about open protocols / that were decentralized and / community-governed. Most of / the value accrued to the edges of / the network: users and builders.
02.
The second era of the internet / — roughly 2005-2020 — / was about siloed, centralized / services. Most of the value / accrued to a handful of large / tech companies.
03.
We are now beginning the third / era of the internet — what many / call web3 — which combines / the decentralized, community- / governed ethos of the first era / with the advanced, modern / functionality of the second era. / This will unlock a new wave of / creativity and entrepreneurship.
Two thousand twenty two
An overview report
State of Crypto
Source: https://cdixon.mirror.xyz/0GBv9WRI-LQE6F4r2gGczG6AVeFlNuvt3HETHZ5A93U
©2022 Andreessen Horowitz. All rights reserved worldwide.
Visuals: One blurred abstract image in the top-left: a horizontally streaked, glitch-like colour field with blue on the left, cyan and teal in the centre, cream and pale pink at the upper right, and saturated magenta at the lower right, cropped at the top edge of the slide and boxed with hard rectangular edges. Behind the background, a soft pastel gradient fills the lower left: peach/coral at the bottom-left corner, mauve and lavender, light blue and cyan toward the centre, fading to white toward the upper right. A small solid black rectangle sits at the top right corner. Horizontal rules: a black line across the content width under the title and a thin grey line under the column numbers.
Slide 3
web3
State of
Crypto
Why Web3
Matters
2022
3
©2022 Andreessen Horowitz. All rights reserved worldwide.
a16z crypto
Visuals: Full-bleed abstract photographic gradient, blurred purple-magenta to violet with a soft white glow: the lightest area is a broad, luminous white blob in the lower-middle to lower-left of the slide, sweeping up toward the right. Magenta (#FF00FF-like) at top-centre, deep violet (#6A00E8-like) at top-right and bottom-right, pale lilac/pink at left edge. Subtle grain texture across the gradient. Decorative elements: black hairline vertical and horizontal rules (about 2 px); a small solid black dash at top-right (about 3.5% wide, 1% high) at x 95.2%, y 5%; a short thick black vertical bar at left x 2.9%, y 28.5%, about 0.5% wide and 1.5% high; a thick black vertical bar at bottom-left x 2.9%, y 91%, about 0.3% wide and 4% high. The a16z crypto logo is a black wordmark: 'a16z' in a bold geometric heavy sans with a stylised 'a' and '16' ligature-like form, followed by 'crypto' in a light sans, both black, at bottom-right about x 85%, y 91.5%, width 15%, height 3%.
Slide 4
Digital
Authoritarianism
Big Tech
Oligopoly
The internet as we
know it is flawed
Why Web3 Matters
4
©2022 Andreessen Horowitz. All rights reserved worldwide.
Visuals: Two line-icon globes drawn in black stroke with a flag on a black pole planted on each. Left: a red Chinese flag (#E8202A) with one large and four small yellow stars (#FFD700), on a black pole, above a black-outlined globe; three red speech bubbles with white x marks (#E8202A) placed around the globe at left, and two amber warning triangles with white exclamation marks (#F9B233) at the globe's upper-right and lower-right. Right: a light-grey flag (#E5E5E5) on a black pole, carrying a Facebook 'f' logo (blue #1877F2), an Amazon smile arrow (orange #FF9900), an Apple logo (black), a YouTube play logo (red #FF0000) and a multicolour Google G logo; above a black-outlined globe; four green dollar coins (#8BC34A) with white dollar signs and two blue check-mark circles (#29A9E0) with white checkmarks placed around it. Flat vector style, no shadows.
Slide 5
After friendly beginnings, web2 / companies have become more / extractive and less cooperative / Why Web3 / Matters / GROWTH / TIME / Attract / Extract / GROWTH / TIME / Cooperate / Compete / ©2022 Andreessen Horowitz. / All rights reserved worldwide. / Charts for illustrative purposes only / 5
Visuals: Two identical line charts drawn as S-shaped growth curves, with no gridlines, no tick values and no numeric data. Each chart has a vertical arrow-tipped y-axis labelled GROWTH in bold capitals rotated 90 degrees, and a horizontal arrow-tipped x-axis labelled TIME in bold capitals centred beneath it. The left chart's x-axis endpoints are labelled Attract (left) and Extract (right). The right chart's x-axis endpoints are labelled Cooperate (left) and Compete (right). Each curve is a thick rounded stroke, about 2.5% of slide height wide, with a gradient running from blue #0060C8 at the origin through teal #0F7F80 and a pink #E8407A band at the midpoint to peach #FCC89A and orange #F5876A at the upper-right end, where the curve flattens with a rounded cap. Left curve spans about x 12.9 to 40 and y 43 to 84; right curve spans about x 53 to 82 and y 43 to 84. Axes are thin black lines, about 0.1% of slide width, with open chevron arrowheads. No legend and no highlighted data points.
Slide 6
Why Web3 Matters / web1 / web2 / web3 / READ / WRITE / OWN / READ / READ / WRITE / OWN / READ / 6 / Web3 gives people property rights: / the ability to own a piece of the internet / ©2022 Andreessen Horowitz. All rights reserved worldwide.
Visuals: Diagram of three cycle loops, each a black thin curved arrow with an arrowhead, forming a circle of two arcs. Loop 1 (left) labelled web1 in italic, with READ on both outer arcs, with a Yahoo y! logo, a Netscape Navigator N logo and an Internet Explorer e logo above it, and two black outline Macintosh-style desktop computer icons below it. Loop 2 (middle) labelled web2 in italic, with READ on the right arc and WRITE on the left arc, with a Facebook f logo, a YouTube logo and a WordPress W logo above, and a black outline smartphone icon and a black outline laptop icon below. Loop 3 (right) labelled web3 in bold, with READ on the right arc and WRITE on the left arc, with a vertical arrow labelled OWN pointing down from a Bitcoin logo (orange) on the left and Ethereum logo (grey) and Solana logo (purple gradient) above the label; a second vertical arrow labelled OWN points up from the laptop and phone icons below to web3. Below web3 are a black outline smartphone icon and a black outline laptop icon. Arrowheads are open chevrons at the ends of each arc.
Slide 7
Why Web3 Matters
Web3 aligns network
participants to work
together toward a
common goal — the
growth of the network
Charts for illustrative purposes only
Web2's VALUE SHARE
Investors
Builders
Creators
Users
VALUE
TOKEN
VALUE
Users
Creators
Builders
Investors
Web3's VALUE SHARE
7
©2022 Andreessen Horowitz. All rights reserved worldwide.
Visuals: Two bar charts and one token icon. Top chart: Web2's VALUE SHARE, vertical bars with an upward y-axis arrow labelled VALUE (no units or numeric scale printed) and a horizontal x-axis baseline; categories left to right Users, Creators, Builders, Investors; bars are about: Users very small (about 1% of axis height, cyan #1FD8F0), Creators small (about 12% height, sky blue #0AA0F0), Builders about 62% height (cyan-to-blue vertical gradient #00C8F8 to #1E90F0), Investors full height about 100% (gradient from red #FF3B3B at top through magenta #F020F0 to blue #1E6BF0 at base). Chart title 'Web2's VALUE SHARE' sits below the x-axis in bold sans-serif. Bottom chart: Web3's VALUE SHARE, same axes and VALUE label, four equal-height bars about 88% of axis height, categories Users, Creators, Builders, Investors; fills are vertical gradients: Users deep indigo #2A1BD0 to violet #5A1AB8 at top, Creators #2E2EF0 to purple #8A1AE0 at top, Builders #3A3CF0 to magenta-violet #B020F0 at top, Investors #3CB8F0 cyan at base to magenta #F020F0 at top. Bracket connectors in black stroke from each category label area join up to a central magenta token icon (ring with a diamond inside and a small sparkle at top right), with the word TOKEN in black bold capitals to its right. Token icon is magenta #F020F0 line art on white.
Slide 8
Web3 empowers a collective / owned future over a corporate / or government owned future / Why Web3 Matters / Source: RAND / Single points / of failure & / control / Resilient, / equitable & / participatory / 8 / ©2022 Andreessen Horowitz. All rights reserved worldwide.
Visuals: Three line-and-node network diagrams, all on a white/gradient field, read left to right. (1) Lime-green #93C031 radial star: roughly 50 straight spokes radiate from one central hub at about x 41%, y 65% to small round end-nodes around the rim, forming a dense burst; a single hub, no ring. (2) Teal #3D97A6 branching tree: about eight hub nodes, each with 3 to 6 short spokes ending in dots, linked by longer teal lines into one connected cluster; the hubs at upper-left (x 36%, y 52%), upper-right (x 44%, y 46%), centre (x 39%, y 65%), and lower-middle (x 37%, y 75%) are the most connected; a main trunk runs from top-right to bottom-right. (3) Purple #5D3A9C mesh: an irregular lattice of thin purple lines forming many closed quadrilaterals and triangles with dots at each vertex, filling a roughly rectangular area with no single hub. Callouts: a black left-pointing triangle at x 49%, y 50.5% precedes 'Single points of failure & control'; a black right-pointing triangle at x 71.5%, y 70.7% follows 'Resilient, equitable & participatory'. No axes, legend or photographs.
Slide 9
web3
State of
Crypto
Cycles of
Innovation
2022
9
©2022 Andreessen Horowitz. All rights reserved worldwide.
a16z crypto
Visuals: Blurred mesh-gradient photograph-like background with soft yellow (#FFD15C) at top-left, orange (#FFA64D) across top, coral red (#FF4D5E) across the centre and lower right, white at far left edge and bottom-left, pale peach (#FFD9C2) at right edge. Thin black vertical and horizontal rules (about 0.2% of slide width) form a grid. Small black filled rectangle at top right (x about 95%, y about 5%, width about 3%, height about 1%). Small black vertical bar at left (x about 3%, y about 31%, width about 0.5%, height about 2.5%). Small black vertical bar at bottom left (x about 3%, y about 91%, width about 0.5%, height about 4%). a16z crypto logo in black at bottom right (x about 85%, y about 91%, width about 13%, height about 4%): 'a16z' in bold geometric sans with 'crypto' in light weight.
Slide 10
The crypto market / develops in cycles / Price / Interest / New Ideas / Startups & / Projects / Cycles of Innovation / 10 / ©2022 Andreessen Horowitz. All rights reserved worldwide.
Visuals: Diagram: four filled circles in a row, labelled Price, Interest, New Ideas and Startups & Projects, each with a thin black outer arc around it that forms a loop. Adjacent outer arcs are joined by small S-shaped connectors at the gaps between circles. A single continuous black line leaves the bottom of the Startups circle arc, runs down and along the bottom as a rounded rectangle path to the left, and rises at the left edge into an upward-pointing open chevron arrowhead that points to the Price circle. Circle fills are soft gradients: Price peach #F9B08A at top fading to pale beige #E9D6B5 at bottom; Interest orange-pink #F5A8A0 at top through lilac #C4A8F0 to periwinkle #A9C4F5 at bottom; New Ideas lavender #A9A3F5 at top to sky blue #7FD2F5 at bottom; Startups & Projects cyan #6FD9F5 at top to bright aqua #3DF7F7 at bottom. No photographs or logos. A soft purple glow gradient fills the lower-left corner of the slide, brightest in the bottom-left corner around #B57BF0 and fading to white toward the centre.
Slide 11
These
cycles
appear
chaotic
from the
outside
but have an
underlying
order
Global Crypto Market Cap
Developer Activity 1
Startup Activity 2
Social Media Activity 3
Cycles of Innovation
Source: CoinMarketCap, GitHub, Pitchbook, Twitter
Data is as of 5/12/2022
1 Developer activity based on stars of crypto-related repositories on Github.
2 Startup activity based on crypto-related initial funding rounds via Pitchbook
3 Social media activity based on crypto-related comments on Twitter
©2022 Andreessen Horowitz. All rights reserved worldwide.
Visuals: Chart: a stacked set of four time-series charts sharing one x-axis of years 2011 to 2022 (labels at the bottom: 2011, 2012, 2013, 2014, 2015, 2016, 2017, 2018, 2019, 2020, 2021, 2022). Panel 1 'Global Crypto Market Cap' is an area chart, y-axis 0 to 3T with gridlines at 0, 1T, 2T and 3T; it is about 0 from 2011 to 2017, rises to about 0.7T around 2018, dips to about 0.3T in 2019, stays low, then climbs steeply in 2021 and 2022 to about 2.7T at its peak near late 2021 and about 2.3T at the end. Panel 2 'Developer Activity' is a bar chart with y-axis 0, 50,000 and 100,000 (gridlines); bars are blue in 2017 to 2020 and purple in 2021 to 2022, rising from near 0 in 2014 to about 60,000 in late 2018, about 55,000 in mid 2019, and about 90,000 at the 2022 peak. Panel 3 'Startup Activity' is a bar chart with y-axis 0, 100, 200 and 300; bars are yellow near 2013 and shift through orange to red by 2022, with a tall bar of about 235 in 2018 and bars of about 190 in 2019 and about 195 in 2021 to 2022. Panel 4 'Social Media Activity' is a filled area chart with y-axis 0, 2M, 4M and 6M; it is green, near 0 before 2017, about 0.3M in 2018, about 0.2M in 2019, rising to about 1M in 2021 and about 5.9M at the end of 2022. Two grey vertical bands span all panels: Wave 2 from about 2013.4 to 2016.6 and Wave 4 from about 2020.6 to 2022.5. Wave labels are printed above the top panel: 'Wave 1' over 2011 to 2013, 'Wave 2' over the first grey band, 'Wave 3' over 2018 to 2020, and 'Wave 4' over the second grey band. Superscripts 1, 2 and 3 mark the panel titles. No legend; colour is the only series key. No highlighted points.
Slide 12
The result is
consistent long-
term growth,
driven by
a feedback
loop between
interest
and innovation
12
Cycles of Innovation
©2022 Andreessen Horowitz.
All rights reserved worldwide.
Global Crypto Market Cap
3T
2T
1T
0
270.9%
Developer Activity1
800,000
600,000
400,000
200,000
0
68.6%
Startup Activity2
2,000
1,500
1,000
500
0
62.5%
Social Media Activity3
600M
400M
200M
0
83.1%
2009 2010 2011 2012 2013 2014 2015 2016 2017 2018 2019 2020 2021
Compound annual growth rate
Source: CoinMarketCap, GitHub,
Pitchbook, Twitter
Data is as of 12/31/2021
1 Developer activity based on stars
of crypto-related repositories on
Github.
2 Startup activity based on crypto-
related initial funding rounds via
Pitchbook
3 Social media activity based
on crypto-related comments
on Twitter
Visuals: Four stacked charts sharing a common 2009 to 2021 x-axis. (1) Global Crypto Market Cap: area chart with a pink #F03FD0 fill for the earlier spiky volatility and a violet #9B8BF0 fill for the 2021 spike, axis labelled 0, 1T, 2T, 3T (value axis in US dollars, range 0 to 3 trillion), grey #B0B0B0 horizontal gridlines at each label; a black curved trend line starts near 0.3T in 2009 and rises to about 2.6T with an open arrowhead at its end; annotation 270.9% at the right end. (2) Developer Activity (footnote 1): vertical bars, axis 0 to 800,000 labelled 0, 200,000, 400,000, 600,000, 800,000 in count of developers, grey gridlines; bars for 2013 to 2016 are small, about 10,000 to 70,000; 2017 about 300,000; 2018 about 550,000; 2019 about 420,000; 2020 about 400,000; 2021 the tallest, about 800,000 or more, in violet #9B4DF0 while 2017 to 2020 are cyan #1EC8F5 to blue #3D8BF0; black trend curve with open arrowhead to the 2020 point; annotation 68.6%. (3) Startup Activity (footnote 2): bars axis 0 to 2,000 labelled 0, 500, 1,000, 1,500, 2,000 (count of funding rounds); bars run from pale yellow #F7D66A in 2011 through orange #FBA04A to red-orange #F26B3A in 2021; approximate values 2011 about 120, 2013 about 180, 2015 about 340, 2016 about 540, 2017 about 790, 2018 about 1,650, 2019 about 1,200, 2020 about 1,100, 2021 about 1,980; black trend arrow; annotation 62.5%. (4) Social Media Activity (footnote 3): bars axis 0 to 600M labelled 0, 200M, 400M, 600M (count of posts); 2009 to 2016 bars are near zero, about 5M; 2017 about 60M, 2018 about 90M, 2019 about 55M, 2020 about 115M, all in green #1FD67F to #10C978; 2021 about 680M in bright green #06C96B; black trend arrow; annotation 83.1%. Charts have no legend; the vertical text Compound annual growth rate is the only axis-style label on the right of the charts. No logos, photographs or icons.
Slide 13
web3 / State of / Crypto / Layer 1 / Blockchains / 2022 / 13 / ©2022 Andreessen Horowitz. All rights reserved worldwide. / a16z crypto
Visuals: One non-text visual: a full-bleed, blurred and grainy gradient illustration covering the whole slide, with no photograph or subject. Violet-blue #3300FF fills the top-left corner and the left edge. A soft white glow forms a large curved shape from the top centre down through the middle, and it sweeps to the lower right. Purple #A100F5 and magenta-violet tones fill the lower right and bottom edge, and a dark purple #7A00D1 appears at the left-middle edge. The gradient has a fine noise texture. Thin black rules: vertical rule at x 15.8% from y 5.3% to 94% (about 0.1% wide); horizontal rule at y 20.2% from x 3% to 81% (about 0.1% high); vertical rule at x 74% from y 5.3% to 94.5%; horizontal rule at y 81.7% from x 74% to 100%. Small solid black bar at x 3%, y 31.5%, about 0.5% wide by 1.7% high. Solid black rectangle at top right, x 98.9%, y 5.4%, 2.8% wide by 1.2% high. Solid black vertical bar at bottom left, x 2.9%, y 93.8%, 0.4% wide by 4.5% high. The a16z crypto logo in black: 'a16z' in a heavy geometric wordmark, followed by 'crypto' in a light geometric lowercase.
Slide 14
Blockchain / computers are / composed of / nodes: physical / computers, like / PCs, joined together / via a consensus / mechanism / ©2022 Andreessen Horowitz. / All rights reserved worldwide. / 14 / Layer / Blockchains / This is a computer with the special feature / of provable trust guarantees / Processor / “Virtual Machine” / Memory / “Blocks” / Consensus / & Compute / Nodes
Visuals: One line diagram (drawn as a 605 by 830 px image placed at x 55.4%, y 15.9%, 31.5% by 76.8% of the slide). Shapes from top to bottom: (1) a caption, 'This is a computer with the special feature of provable trust guarantees', in two centred lines above the diagram. (2) A thin black rounded outline box, about x 58.4%, y 28.0%, 25.8% by 9.7%, containing two orange rounded rectangles side by side: 'Processor' in bold white with '“Virtual Machine”' in regular white beneath (left, about x 59.3%, y 29.9%, 9.9% by 5.9%) and 'Memory' in bold white with '“Blocks”' beneath (right, about x 73.3%, y 29.9%, 9.9% by 5.9%). A short diagonal black connector runs between the two boxes at their lower edge. (3) A green circle with a white check mark, outlined in black, sits centred on the top edge of the outer box at about x 69.3%, y 25.2%, 3.3% by 5.9%. (4) Two black arrows point up from the circle toward the bottom edge of the outer box. (5) A large circle, about x 62.3%, y 40.6%, 17.8% by 31.6%, filled with thin light grey lines forming a dense random network, with small light blue #5BB8E8 dots concentrated toward the centre; it has the label 'Consensus / & Compute' in bold black, centred. (6) Two long black bracket-shaped outlines, one on the left (about x 56.2%, y 24.6%, 6.2% by 63.4%) and one on the right (about x 80.0%, y 24.6%, 6.0% by 63.4%), curving inward into the circle at mid-height and descending to the bottom. (7) Seven black arrows, each curving up from a node to the underside of the circle. (8) Seven solid filled circles in a row at about y 80%, each about 1.7% wide, in the order blue #1F4FBF, teal #3A9AA8, purple #9575CD, blue, purple, teal, blue. (9) Small scattered dots in blue, teal and purple around the row. (10) The bold black label 'Nodes' centred below the row at about y 84.5%. No photographs, logos or icons.
Slide 15
Web3 is multi-chain; developers
have many options when it comes
to building on blockchains
Layer /Blockchains
Ethereum
Solana
Polygon
BNB Chain
Avalanche
Fantom
5.5M
15.4M
2.6M
9.4M
609K
308K
Active Addresses
1.1M
15.3M
3.4M
5.0M
832K
743K
Daily Transactions
©2022 Andreessen Horowitz.
All rights reserved worldwide.
Source: Nansen; Active addresses is measured over a 30-day period as of 5/12/2022; Daily transactions
is represented by a 30-day average as of 5/12/2022.
15
Visuals: Six logo marks in a row, each above its own rule: an Ethereum diamond logo in grey greyscale (about #3C3C3D to #9A9A9A) at x 9.6% y 39.1% size 5.8 by 10.4%; a Solana logo of three stacked slanted bars with teal-to-purple gradient (about #3DD0B0 to #8E5BC4) at x 24.6% y 41.3%, 43.7% and 46.2%, each 4.8 by 1.8%; a Polygon logo of two interlocked purple hexagonal rings in #7258A5 at x 38.0% y 40.4% size 5.2 by 8.2%; a BNB Chain logo of a gold diamond lattice in #F3BA2F at x 52.2% y 39.1% size 5.2 by 10.4%; an Avalanche logo of a white triangle mark inside a red circle #E84142 at x 65.2% y 39.1% size 5.8 by 10.4%; a Fantom logo of a white hexagonal cube mark inside a sky-blue circle (about #13B5EC) at x 78.9% y 39.1% size 5.8 by 10.4%. Six thin black horizontal rules at y 51.7%, each 12.2% wide, starting at x 10.65%, 24.3%, 37.95%, 51.6%, 65.2% and 78.85%. Two full-width black rules: one at y 71.1% from x 21.0% to 91.1% (behind the Active Addresses label), one at y 85.6% from x 21.3% to 91.1% (behind the Daily Transactions label). A short black dash at top left at x 3.0% y 5.3% width 2.35% height about 0.3%. A small black rectangle at top right at x 96.7% y 5.3%, 0.35 by 1.2%. A black vertical bar at x 90.9% y 89.2%, 0.35 by 5.5%.
Slide 16
Layer / Blockchains
While other smart contract platforms
rival Ethereum in users and usage, the
demand for block space is unmatched
Transaction Fees Paid
by Users (7D Average)
$20M
$15M
$10M
$5M
$0M
$15,249,254
$1,304,470
$821,128
$192,604
$93,890
$62,041
Ethereum
BNB Chain
Avalanche
Fantom
Polygon
Solana
Source: https://cryptofees.info; Data is as of 5/12/2022.
©2022 Andreessen Horowitz.
All rights reserved worldwide.
16
Visuals: Bar chart (placed raster image) titled 'Transaction Fees Paid by Users (7D Average)' with the title set top-right of the plot area in light sans-serif. Vertical axis labelled in dollars from $0M to $20M in $5M steps, with light grey horizontal gridlines at each step. Horizontal axis lists categories: Ethereum, BNB Chain, Avalanche, Fantom, Polygon, Solana. Single series of 7-day average transaction fees paid by users, with printed values: Ethereum $15,249,254; BNB Chain $1,304,470; Avalanche $821,128; Fantom $192,604; Polygon $93,890; Solana $62,041. Ethereum bar is the tallest, about $15.2M, filled with a vertical gradient from magenta #D10F5E at upper part to orange #F97B3F at base; all other bars are flat orange #F77A3C, about $1.3M, $0.8M, $0.2M, $0.1M and $0.1M in height. No legend. No highlighted points beyond the Ethereum bar. Bars have thin darker outlines at the baseline. Value labels sit just above each bar in bold black sans-serif. Background gradient image is a soft coral-to-peach blur in the top-right corner fading to white; no photograph.
Slide 17
With Ethereum L1 as the hub, / a significant amount of value is / being deposited into bridges / 17 / Top Ethereum Bridges by Total Volume In / Top Ethereum Bridges by Total Depositors / Avalanche / Polygon PoS / Fantom / Ronin: Axie Infinity / Wormhole / dYdX / Near / Synapse / Arbitrum / Sollet: Solana / 0 / $10B / $20B / $30B / Polygon Plasma / Polygon PoS / Axie Infinity: Ronin / Avalanche / Fantom / dYdX / Multichain / xDai / zkSync / Loopring / 0 / 50,000 / 100,000 / 150,000 / Layer / Blockchains / ©2022 Andreessen Horowitz. All rights reserved worldwide. / Source: Nansen; Includes bridges with > 10k depositors; Data is as of 5/12/2022.
Visuals: Two horizontal bar charts, both rendered as one raster image (1809 by 562 px) spanning x 2.9 to 97.1 percent and y 33.2 to 85.2 percent. Left chart: bar chart titled 'Top Ethereum Bridges by Total Volume In'; value axis 0 to $30B with ticks at 0, $10B, $20B, $30B; vertical gridlines at each tick; no axis title; bars sorted descending. Series values (all estimates, as no values are printed): Avalanche about $28.5B; Polygon PoS about $25.0B; Fantom about $17.5B; Ronin: Axie Infinity about $16.1B; Wormhole about $7.0B; dYdX about $4.0B; Near about $2.4B; Synapse about $1.9B; Arbitrum about $1.7B; Sollet: Solana about $1.7B. Right chart: bar chart titled 'Top Ethereum Bridges by Total Depositors'; value axis 0 to 150,000 ticks at 0, 50,000, 100,000, 150,000 with vertical gridlines; bars sorted descending. Values (all estimates, none printed): Polygon Plasma about 156,000; Polygon PoS about 149,000; Axie Infinity: Ronin about 112,000; Avalanche about 97,000; Fantom about 58,000; dYdX about 48,000; Multichain about 46,000; xDai about 35,000; zkSync about 23,000; Loopring about 20,000. Bar fill is a horizontal gradient from light blue #8EC5F5 at the left end to violet #7F00FF at the right end on every bar. No legend. No highlighted points. Category labels right-aligned in black to the left of each bar; axis labels bold small black below the plot. A purple gradient glow fills the top-right of the slide behind the headline (see background).
Slide 18
Ethereum continues to attract the most / developers, but several emerging / ecosystems are on a similar trajectory / Layer / Blockchains / Monthly Active Developers / Since Launch / 4,000 / 3,500 / 3,000 / 2,500 / 2,000 / 1,500 / 1,000 / 500 / 0 / 0 / 400 / 800 / 1,200 / 1,600 / 2,000 / 2,400 / 2,800 / 3,200 / 3,600 / 4,000 / Monthly Active Developers (y-axis) / Days Since First Commit (x-axis) / Ethereum / Avalanche / Bitcoin / Binance Smart Chain (BSC) / Cardano / Celo / Fantom / Flow / Internet Computer / NEAR / Polygon / Solana / Stacks / Terra / Tezos / BSC / Avalanche / NEAR / Polygon / Cardano / Tezos / Terra / Flow / Celo / Stacks / Fantom / Internet Computer / Solana / Ethereum / Bitcoin / Source: / Electric Capital 2021 Developer Report / Data is as of 12/31/2021 / Note: / Some projects were omitted due to / unclear, unavailable, or imprecise data. / ©2022 Andreessen Horowitz. All rights reserved worldwide. / 18
Visuals: Line chart titled 'Monthly Active Developers' with subtitle 'Since Launch' printed inside the plot at top left. Y-axis labelled 'Monthly Active Developers' (vertical, units: developers per month), range 0 to 4,000 with gridlines every 500 (labels 0, 500, 1,000, 1,500, 2,000, 2,500, 3,000, 3,500, 4,000). X-axis labelled 'Days Since First Commit' (units: days), range 0 to 4,000 with labels every 400 (0, 400, 800, 1,200, 1,600, 2,000, 2,400, 2,800, 3,200, 3,600, 4,000). Series with end labels: Ethereum (dark blue #2B4FC7) rises from near 0 to about 3,950 at about day 2,900, the highest point on the chart, with dips to about 2,750 near day 2,570 and a peak near 3,600 around day 2,800; Solana (pink #E0559A) peaks at about 950 near day 1,370 then stops; Bitcoin (orange #F07C2A) rises slowly to about 450 at about day 3,600, the only series reaching past day 3,300 besides Ethereum; Avalanche (teal #3AA6B9) peaks about 400 near day 500; Cardano (lilac #A77BD9) and Polygon and Tezos and Celo and Fantom and Internet Computer and NEAR and BSC and Terra and Flow and Stacks lie between 0 and about 400 with labels placed on the lines near days 600 to 1,900; Internet Computer (dark green #2E6B3A) and Stacks trail just above 0 to about 200. Legend at right lists in order with line-sample colours: Ethereum, Avalanche, Bitcoin, Binance Smart Chain (BSC), Cardano, Celo, Fantom, Flow, Internet Computer, NEAR, Polygon, Solana, Stacks, Terra, Tezos. Highlighted end-point labels are set in plain black text next to the series ends: Ethereum at top (about 3,950), Bitcoin at right (about 450), Solana, Avalanche, NEAR, Polygon, Cardano, Tezos, Celo, Flow, Terra, Stacks, Fantom and Internet Computer clustered lower. Gridlines are light grey horizontal lines at each 500 interval; no vertical gridlines.
Slide 19
web3
State of
Crypto
Layer 2
Scaling
2022
19
©2022 Andreessen Horowitz. All rights reserved worldwide.
a16z crypto
Visuals: A full-bleed blurred mesh gradient covers the lower-right two-thirds of the slide: pale lavender near the top centre, saturated blue (about #0A6CFF) at the right-centre, bright cyan (about #00F0FF) along the bottom centre, and magenta-violet (about #E070FF) at the right edge; the top-left and left areas fade to white. Thin black hairline rules (about 0.2% of slide height) form a grid over the gradient. A short black horizontal bar sits at the top right. A short black vertical bar sits at the left edge near 31% height and another near the bottom left beside the copyright line. The a16z crypto wordmark is black, with 'a16z' in a bold geometric face and 'crypto' in a light sans-serif. No photographs.
Slide 20
A layer 2 / is a separate / blockchain / that extends / the base layer / and inherits / its security / guarantees / Optimistic Rollups / Transactions are assumed to be valid, but / can be challenged if necessary / • More production-ready / • Correctness relies on game-theoretical / incentives / • Finality on L1 depends on a 1-week / challenge period / • Easier to program / • EIP-4844 (proto-danksharding) can make / these rollups very cheap for users / Zero-Knowledge Rollups / State transitions are computationally / verified off-chain using validity proofs / • Less production-ready / • Correctness is mathematically guaranteed / • Finality on L1 is instant / • Harder to program / • Proofs can be computationally expensive, / though this is rapidly improving / Layer 2 Scaling / 20 / ©2022 Andreessen Horowitz. / All rights reserved worldwide.
Visuals: Ethereum diamond logo centred above the right column: a faceted octahedron-like diamond made of four grey and black triangular facets (top half lighter grey, bottom half darker, with a thin white horizontal band across the middle), about 4.7 by 13.2 percent of the slide, centred on x about 63.6. Below each column heading are logos. Left column: Optimism logo (red #FF0420 circle containing white italic OP, followed by black italic wordmark Optimism) at x 38.8 y 79.4 w 13.7 h 6.0; Arbitrum logo (dark blue-grey hexagon with a blue and white stylised A mark, followed by the wordmark ARBITRUM in widely letter-spaced dark navy #1F2D4D capitals) at x 38.9 y 88.3 w 14.3 h 5.1. Right column: zkSync logo (two overlapping lavender and indigo arrow shapes, lavender #8C8DFC left and indigo #4E529A right, followed by lowercase zkSync wordmark in black) at x 66.4 y 74.5 w 13.2 h 4.8; Starknet logo (dark navy #26286B circle with orange and white swoosh, followed by STARKNET wordmark in navy #2B2F7A, STARK in regular and NET in bold) at x 66.4 y 80.9 w 13.7 h 6.2; Aztec logo (violet #6B5CF6 rounded diamond with white inner diamond, followed by black Aztec wordmark) at x 66.3 y 88.1 w 11.5 h 6.2. No photographs. Thin black rules are drawn as lines.
Slide 21
Optimistic rollups are the most / popular L2 tech today, but ZK rollups / are just beginning to come online / Total Value / Locked on / Ethereum / Layer 2s / Plasma / Validium / ZK Rollups / Optimistic Rollups / $8B / $6B / $4B / $2B / $0B / 2020.01.01 / 2021.01.01 / 2021.07.01 / 2022.01.01 / 2020.07.01 / Source: https:// / l2beat.com/ / Data is as of / 5/12/2022. / Layer / 2 / Scaling / ©2022 Andreessen Horowitz. All rights reserved worldwide. / 21
Visuals: One stacked area chart of Total Value Locked on Ethereum Layer 2s. Chart type: stacked area chart with four series. Title printed beside the chart: 'Total Value Locked on Ethereum Layer 2s'. Y-axis: total value in US dollars, labelled $0B, $2B, $4B, $6B and $8B, gridlines at each label, range $0B to about $8B. X-axis: dates labelled 2020.01.01, 2020.07.01, 2021.01.01, 2021.07.01 and 2022.01.01, spanning about 2020.01 to about 2022.05. Legend across the top of the chart, left to right: Plasma (dark green square), Validium (light blue square), ZK Rollups (yellow square), Optimistic Rollups (purple square). Series values are not printed; estimates: all series are near $0B from 2020.01.01 to about 2020.10. Between about 2021.01 and 2021.06 the stacked total reaches about $1.7B, with Optimistic Rollups a thin band under $0.3B. From about 2021.10 the total rises steeply; Optimistic Rollups reaches about $3B by 2022.01 and peaks near $5.5B; the total peaks near $7.5B in about 2022.03. Optimistic Rollups is the bottom purple band. ZK Rollups is the yellow band above it, Validium is a thin light blue sliver, and Plasma is a thin dark green cap on top. No highlighted points. Chart is not boxed and has no border; it sits on the white part of the slide.
Slide 22
L2 rollups pay for / Ethereum’s security / 22 / Today, L2 rollups / contribute to / ~1.5% / of all fees paid / on Ethereum / L2 Rollups / One Day Security Costs / zkSync $17,883 / 4.1% / Loopring $18,471 / 4.3% / Starkware $21,041 / 4.8% / Optimism $70,823 / 16.2% / dYdX $111,447 / 25.4% / $194,866 Arbitrum / 44.5% / Source: https://l2fees.info/; Data is as of 5/12/2022. / ©2022 Andreessen Horowitz. / All rights reserved worldwide. / Layer / 2 / Scaling
Visuals: One donut chart, rendered as an image. Type: donut (ring) chart. Title printed in the hole: 'L2 Rollups' (bold) over 'One Day Security Costs' (light). Units: US dollars for one-day security costs; percentages of total. Series, with labelled values: Arbitrum $194,866 (44.5%) purple segment; dYdX $111,447 (25.4%) light grey segment; Optimism $70,823 (16.2%) light blue segment; Starkware $21,041 (4.8%) teal segment; Loopring $18,471 (4.3%) blue segment; zkSync $17,883 (4.1%) green segment; one very thin yellow-green sliver with no label (about 0.5%, estimated). Segments run clockwise from 12 o'clock: Arbitrum ends about 4:30, then dYdX, Optimism, Starkware, Loopring, zkSync, and the thin sliver last. Labels sit at left and right of the ring with thin dark grey leader lines ending in small dots on each segment; Arbitrum's leader runs horizontally right of the ring, dYdX's leader runs horizontally left, and zkSync, Loopring and Starkware leaders run diagonally up-left to their segments. No legend. No highlighted points. A second small visual is the '~1.5%' figure in a blue-to-cyan gradient fill. The left-side stat text is not a chart.
Slide 23
Layer 2 Scaling
L2 rollups are
competing
hard against
each other to
bring transaction
fees down
Name
Send ETH
Swap Tokens
Metis Network
$0.01
$0.07
Loopring
$0.20
$0.48
zkSync
$0.22
$0.54
Polygon Hermez
$0.25
-
Boba Network
$0.72
$0.94
Optimism
$0.88
$1.30
Arbitrum One
$2.27
$3.15
Aztec Network
$3.09
-
Ethereum
$4.48
$22.41
Source: https://l2fees.info/
Data is as of 5/12/2022.
©2022 Andreessen Horowitz All rights reserved worldwide.
23
Visuals: Comparison table with three columns (Name, Send ETH, Swap Tokens) and nine data rows, each row separated by a thin light-grey horizontal rule. Column values in USD: Metis Network logo with $0.01 and $0.07; Loopring logo with $0.20 and $0.48; zkSync logo with $0.22 and $0.54; Polygon Hermez logo with $0.25 and a dash for Swap Tokens; Boba Network logo with $0.72 and $0.94; Optimism logo with $0.88 and $1.30; Arbitrum One logo with $2.27 and $3.15; Aztec Network logo with $3.09 and a dash for Swap Tokens; Ethereum logo with $4.48 and $22.41. Ethereum row sits below a heavier black rule, its values set larger and bolder than the other rows. Logos (left of each name): Metis, a teal circle with a leaf-like mark; Loopring, a blue angular sail-like mark; zkSync, a pair of purple-blue arrows pointing opposite ways; Polygon Hermez, a purple hexagonal outline with a block mark; Boba Network, a lime-green stem with a circle of dots; Optimism, a solid red circle with white italic 'OP'; Arbitrum One, a dark navy and steel-blue angular mark; Aztec Network, a violet-blue rotated square outline with a diamond inside; Ethereum, a grey and black faceted diamond. Left side: a soft gradient field of cyan (#00E5FF-ish) fading to deep blue at the bottom left and to lavender-white toward the centre, occupying the left ~47% of the slide as a full-height image with the headline over it. Small black rectangle top-left, short black dash top-right, and short black bar bottom-left at about 3-15% of width.
Slide 24
web3
State of Crypto
DeFi
2022
24
©2022 Andreessen Horowitz. All rights reserved worldwide.
a16z crypto
Visuals: Background gradient: a warm radial glow with yellow (#FFC24A) at the left edge, saturated red-orange (#FF4A35) near the top centre, fading to white toward the lower right and bottom. Black thin lines: vertical rule at about 18.9% x (approx 1.2 px to 2 px wide, black #000000) from about 5% to 90% height; horizontal rule at about 20% y from about 3% to 78% width; vertical rule at about 71% x from about 5% to 94% height; short horizontal rule at about 81% y from about 71% to 97% width. A small solid black bar at top right near (95%, 5.5%), about 3% wide by 1% tall. A short vertical black bar at left near (3%, 30%), about 0.5% wide by 1.5% tall, beside the title area. A thin black vertical bar at bottom left near (3%, 91%), about 0.4% wide by 4% tall. The a16z crypto logo at bottom right: 'a16z' in a bold black geometric wordmark followed by lighter 'crypto' in black lowercase, spanning about 85% to 97% x and 91% to 95% y.
Slide 25
DeFi / A huge part / of the world / is underserved / by existing / financial / institutions / Bank / Accounts / 1.7 billion people do not / have access to a bank / account / Remittance / Payments / $650B in global remittances / annually, with an average cost / of 6% / Digital / Payments / 48% of adults have not sent / or received digital payments / in the past year / Mobile / + Internet / Of the unbanked, 1 billion have / access to a mobile phone and / 480 million have internet / Sources: / The Global Findex Database, 2017 Report; / The World Bank (2020 and 2021 data) / ©2022 Andreessen Horowitz. / All rights reserved worldwide. / 25
Visuals: One illustration: a stylised blue-green glowing globe with black continent outlines (Americas and Africa visible, with Europe and Asia at top right) and two thin black elliptical orbit lines crossing it. Four small circular nodes with a dot centre sit on the orbits, one at top left of the globe, one at top right, one at lower right and one at bottom left, each marking one callout. The globe is lit from the lower left, brightest in aqua green around the South American area and shading to deep violet at the lower right edge. A soft teal-to-blue radial glow surrounds the globe with no hard edge. The illustration has no frame and is not cropped. Left of the slide a soft gradient blob runs from peach at the top left through lavender to pale blue, fading to white at the bottom. No charts, tables, photographs or logos.
Slide 26
DeFi has grown from nearly zero to over / $100 billion in less than two years / Total Value / Locked / in DeFi / DeFi / $300B / $200B / $100B / $0B / 1 Jan 2019 / 1 Jan 2020 / 1 Jan 2021 / 1 Jan 2022 / 26 / ©2022 Andreessen Horowitz. All rights reserved worldwide. / Source: Defi Llama; Data is as of 5/12/2022.
Visuals: Chart: filled area chart of Total Value Locked in DeFi, showing values in US dollars billions. Y axis labelled $0B, $100B, $200B, $300B with horizontal light grey gridlines at each labelled value; range 0 to 300 billion. X axis labelled 1 Jan 2019, 1 Jan 2020, 1 Jan 2021, 1 Jan 2022, with no tick labels between them. Single series filled with a vertical gradient from bright cyan at the top edge (about #00C8FF) to medium blue at the base (about #3B8BEB), with a cyan top edge line. No printed values on the data points; estimates: about $0B through most of 2019, about $5B to $10B by early 2020, about $30B by late 2020, a local peak about $150B around March 2021, a dip to about $100B shortly after, a rise to a peak of about $260B around late 2021, a trough near $190B in early 2022, and a final value of about $140B at the right edge, around 12 May 2022. No legend, no highlighted points. Background gradient image is a full-bleed blur behind everything: magenta (about #FF00E5) at the lower-left, pale pink and lavender in the middle, and pale orange (about #FFB86B) at the top-right corner, faded to white.
Slide 27
Newer blockchains are trying to replicate
the success of DeFi on Ethereum
27
DeFi
DeFi
Market
Share
(TVL) by
Blockchain
Source: Defi Llama;
Data is as of 5/12/2022.
100%
75%
50%
25%
0%
1 Oct 2020
1 Jan 2021
1 Apr 2021
1 Jul 2021
1 Oct 2021
1 Jan 2022
1 Apr 2022
Other
Fantom
Terra
Polygon
Solana
Avalanche
BNB Chain
Ethereum
©2022 Andreessen Horowitz.
All rights reserved worldwide.
Visuals: One stacked 100% area chart. Title: none printed on the chart. X axis: dates, labelled 1 Oct 2020, 1 Jan 2021, 1 Apr 2021, 1 Jul 2021, 1 Oct 2021, 1 Jan 2022, 1 Apr 2022, with faint vertical gridlines at each label; axis runs from about Sep 2020 to about May 2022. Y axis: percent share of total value locked, labelled 0%, 25%, 50%, 75%, 100%, with light horizontal gridlines at 100% and the axis baseline at 0%. Series, stacked from bottom to top, each a band whose values are not printed, so estimates are marked about: Ethereum (dark blue #1F5BB8), about 94% of the total in Oct 2020 falling to about 55% by Apr 2022; BNB Chain (yellow #E8BE4A), about 0% in Oct 2020, about 5% to 10% from Apr 2021, and about 5% to 8% by Apr 2022; Avalanche (light grey #C9CBD3), thin, about 1% to 5%; Solana (teal #4A9CA8), thin, about 2% to 6%; Polygon (light blue #7CC0EA), about 0% in 2020 rising to about 4% to 6% in mid 2021 and about 2% to 5% in 2022, spiking near 80% to 85% cumulative at the last point; Terra (purple #6A4AA8), about 0% until early 2021, about 5% to 10% in late 2021, rising to about 13% to 15% by Apr 2022; Fantom (green #9CC443), thin, about 1% to 4%; Other (white with grey outline), about 0%. Legend: vertical list at the right of the plot, each entry a small filled square followed by its label, ordered top to bottom Other, Fantom, Terra, Polygon, Solana, Avalanche, BNB Chain, Ethereum. Highlighted points: none.
Slide 28
Token exchange and lending protocols are / the most popular DeFi use cases today / DeFi / Trading Volume on Decentralized Exchanges / Borrowing Volume on Decentralized Lending Protocols / $400B / $300B / $200B / $100B / $0B / $30B / $20B / $10B / $0B / Jan 20 Feb 20 Mar 20 Apr 20 May 20 Jun 20 Jul 20 Aug 20 Sep 20 Oct 20 Nov 20 Dec 20 Jan 21 Feb 21 Mar 21 Apr 21 May 21 Jun 21 Jul 21 Aug 021 Sep 21 Oct 21 Nov 21 Dec 21 Jan 22 Feb 22 Mar 22 Apr 22 / 0x / Trader Joe / SpookySwap / SushiSwap / Curve / PancakeSwap / dYdX / Uniswap / Reflexer / Alpha Finance / Liquity / Maple Finance / BENQI / Compound / Aave / MakerDAO / 28 / Source: Token Terminal / Data is through April 2022. / ©2022 Andreessen Horowitz. / All rights reserved worldwide.
Visuals: Two stacked-column bar charts, both monthly, both stacked by protocol, with colored segments and no data labels printed. Left chart: Trading Volume on Decentralized Exchanges, y axis in US dollars billions from $0B to $400B with gridlines at $100B, $200B, $300B and $400B; x axis is months Jan 20 to Apr 22 (28 columns, printed rotated 90 degrees under the bars). Series in legend order: 0x (teal #3F9FB0), Trader Joe (lime #9BC93F), SpookySwap (dark green #3B8A4A), SushiSwap (light grey #CFD2D8), Curve (light blue #7CC4EE), PancakeSwap (purple #9B6FD0), dYdX (blue #1F5BC4), Uniswap (yellow #EDC04A). Estimated values, not printed: Uniswap about $0B for Jan 20 to Apr 20, about $80B in May 21, about $110B in Nov 21, about $48B in Apr 22; dYdX stacks about $90B in Nov 21 and the total column peaks at about $305B in Nov 21; the May 21 column tops out about $212B. Right chart: Borrowing Volume on Decentralized Lending Protocols, y axis from $0B to $30B with gridlines at $10B, $20B and $30B; same 28 monthly x labels except Aug 21 printed as Aug 021 on the left chart. Series in legend order: Reflexer (teal #3F9FB0), Alpha Finance (lime #9BC93F), Liquity (dark green #3B8A4A), Maple Finance (light grey #CFD2D8), BENQI (light blue #7CC4EE), Compound (purple #9B6FD0), Aave (blue #1F5BC4), MakerDAO (yellow #EDC04A). Estimated values, not printed: MakerDAO about $9B in Apr 22 and about $9.2B in Dec 21; Aave about $7B in Apr 22; Compound about $6.5B in Apr 22; total column about $21.5B in Apr 22 and peaks about $28.5B in Dec 21. Legends sit below each chart as two rows of four swatches (square-ish chips about 1.5 percent of width). No highlighted points. The image layer is a raster of both charts, not text.
Slide 29
29 / Proof-of-stake / is / coming to Ethereum / Source: Nansen / Data is as of 5/12/2022. / DeFi / 12.6M ETH / Total ETH Deposited / 73K / Unique Depositors / 392K / Unique Validators / Total ETH Staked to Beacon Chain / 15,000,000 / 10,000,000 / 5,000,000 / 0 / 1/1/21 / 4/1/21 / 7/1/21 / 10/1/21 / 1/1/22 / 4/1/22 / Top ETH 2 Deposit Addresses / Lido / Kraken: Address 1 / Staked.us / Stakefish / Kraken: Address 2 / Bitcoin Suisse / Unknown / Figment / Unknown / Unknown / 0 / 1,000,000 / 2,000,000 / 3,000,000 / 4,000,000 / ©2022 Andreessen Horowitz. / All rights reserved worldwide.
Visuals: Raster image (1656 by 747 px) placed at x 14.3, y 28.5, w 85.7, h 68.8 containing the gradient stat banner, the two chart titles, both charts and the bar labels. Gradient banner: a full-width horizontal bar from x about 15.6% to the right edge (bleeds off the right edge), y 32.4 to 45.5, with a left-to-right gradient from light orange (about #F9A55A) through coral red (about #F0604F) and muted maroon (about #6E3F5A) to deep blue (about #1A2BB8) and magenta (about #D050C0) at the far right, with a grainy texture. Three white stat blocks are centred in three equal sections: '12.6M ETH' with 'Total ETH Deposited', '73K' with 'Unique Depositors', '392K' with 'Unique Validators'. Two thin black vertical dividers, about 0.2% wide, run from y about 30.9 to 46.9 at x about 44.3% and 69.6%. Area chart: titled 'Total ETH Staked to Beacon Chain', y axis 0 to 15,000,000 with gridlines at 5,000,000, 10,000,000 and 15,000,000, no unit label; x axis dates 1/1/21 to 4/1/22 at quarterly ticks (1/1/21, 4/1/21, 7/1/21, 10/1/21, 1/1/22, 4/1/22). Single series rising from near 0 at about 1/1/21 to about 12,600,000 at about 5/2022 (the banner reports 12.6M), values between ticks are about estimates; the series is filled from baseline to curve with a vertical gradient from pale pink at the bottom left through pale yellow near the baseline to orange-peach at the top right; no legend, no highlighted points. Bar chart: titled 'Top ETH 2 Deposit Addresses', horizontal bars, x axis 0 to 4,000,000 with ticks at 0, 1,000,000, 2,000,000, 3,000,000, 4,000,000 and light vertical gridlines; categories top to bottom with about values: Lido about 4,100,000 (teal-to-blue gradient bar, longest); Kraken: Address 1 about 780,000; Staked.us about 400,000; Stakefish about 280,000; Kraken: Address 2 about 270,000; Bitcoin Suisse about 170,000; Unknown about 170,000; Figment about 150,000; Unknown about 110,000; Unknown about 110,000. Bars are teal-blue #0E7FA8 except the Lido bar. No legend, no highlighted points beyond Lido's gradient.
Slide 30
DeFi would
represent the
31st largest US
bank by total
assets under
management
30
DeFi
JPMorgan Chase
Bank of America
Wells Fargo
Citigroup
U.S. Bancorp
PNC Financial Services Group
Truist Bank
Goldman Sachs Group
TD Group US Holdings
Capital One Financial
Bank of New York Mellon
State Street
Fifth Third Bank
Silicon Valley Bank
Morgan Stanley
Citizens Bank
HSBC Bank
Keybank
Northern Trust
First Republic Bank
Huntington NB
Ally Financial
BMO Harris Bank
Regions Bank
Morgan Stanley Private Bank
Manufacturers and Traders TC
MUFG Union Bank
American Express
Capital One Bank
Signature Bank
DeFi - Total Value Locked
$0T
$1T
$2T
$3T
Source:
Defi Llama, https://www.federalreserve.gov/releases/lbr/current/;
Bank AUM data is as of 12/31/2022
DeFi TVL data is as of 5/12/2022.
©2022 Andreessen Horowitz.
All rights reserved worldwide.
Visuals: Horizontal bar chart with no chart title. Categories, top to bottom, are JPMorgan Chase, Bank of America, Wells Fargo, Citigroup, U.S. Bancorp, PNC Financial Services Group, Truist Bank, Goldman Sachs Group, TD Group US Holdings, Capital One Financial, Bank of New York Mellon, State Street, Fifth Third Bank, Silicon Valley Bank, Morgan Stanley, Citizens Bank, HSBC Bank, Keybank, Northern Trust, First Republic Bank, Huntington NB, Ally Financial, BMO Harris Bank, Regions Bank, Morgan Stanley Private Bank, Manufacturers and Traders TC, MUFG Union Bank, American Express, Capital One Bank, Signature Bank, and DeFi - Total Value Locked. X axis labelled $0T, $1T, $2T, $3T with vertical light grey gridlines at each tick; values are not printed on the bars, so bar lengths are about: JPMorgan Chase about $3.3T, Bank of America about $2.5T, Wells Fargo about $1.8T, Citigroup about $1.6T, U.S. Bancorp about $0.6T, PNC about $0.6T, Truist about $0.55T, Goldman Sachs about $0.45T, TD about $0.45T, Capital One Financial about $0.4T, Bank of New York Mellon about $0.4T, State Street about $0.35T, Fifth Third about $0.2T, Silicon Valley Bank about $0.2T, and the remaining banks about $0.1T to $0.2T, with DeFi - Total Value Locked about $0.1T in a single solid yellow-orange bar (#FFC066 approximate). Bars for banks use a left-to-right gradient from light blue (#8EC5FF approx) at the axis to violet (#7A00FF approx) at the bar end. Bars are thin, about 60% of row pitch, with square ends. Axis line is black, horizontal at the top beneath the header, with a vertical black axis line at the zero point. Header text '30' and 'DeFi' sits above the axis. No legend and no highlighted points beyond the yellow DeFi bar. Background includes a soft orange-to-white gradient glow across the top of the slide, behind the headline and chart header, with orange near #F97F4F at top centre fading to white.
Slide 31
web3 / State of / Crypto / Stablecoins / 2022 / 31 / ©2022 Andreessen Horowitz. All rights reserved worldwide. / a16z crypto
Visuals: No photograph or chart. Background is an abstract soft-focus gradient in cyan, aqua, lavender and white with a fine grain texture: saturated cyan #22F5FA at top-centre, lavender-purple #B99BF0 at top-right, pale blue #7EC8F5 on the left edge, cyan-aqua #7FF2EE at bottom-right, and white across the centre and lower-middle. Thin black rules (about 0.2% of slide height stroke, #000000) form the grid described in layout. Logos: 'a16z crypto' wordmark in black at bottom-right, where 'a16z' is a bold geometric wordmark and 'crypto' is a light weight lowercase sans. No other icons.
Slide 32
Stablecoins / There are three primary categories of stablecoins, though the lines between them are blurry / 32 / Fiat Backed / Backed by fiat currencies, cash equivalents, or other assets / Crypto Backed / Backed by crypto assets held in smart contracts / Algorithmic / Algorithmically balances supply and demand / Decentralization / Stability / Capital Efficiency / ©2022 Andreessen Horowitz. / All rights reserved worldwide.
Visuals: Diagram: a three-row by three-column matrix of pill-shaped connector nodes. Column headings are Fiat Backed, Crypto Backed and Algorithmic. Rows are labelled Decentralization (top), Stability (middle) and Capital Efficiency (bottom). Each row has a thin black horizontal line running from x about 17.8% to the right vertical rule at x 77.3%. Each node is a circle about 3.8% of slide width with a small solid black dot at its centre and a black outline about 0.2% thick, filled peach #FBC4A0, joined to a partner node in the same row by a pinched black double-curve (a waist-shaped ribbon). Row Decentralization: node in Crypto Backed column at about x 47.0% y 67.0%, node in Algorithmic column at about x 68.5% y 67.0%, joined by a pinched ribbon. Row Stability: node in Fiat Backed column at about x 25.5% y 75.0%, node in Crypto Backed column at about x 47.0% y 75.0%, joined by a pinched ribbon. Row Capital Efficiency: node in Fiat Backed column at about x 25.5% y 84.0%, node in Algorithmic column at about x 68.5% y 84.0%, joined by a long pinched ribbon crossing the middle column. Behind the diagram on the left is a solid red-orange #FF5F3F wedge starting at x 19.0% (y 60% to 84%) that tapers and fades to peach #FFD2A8 toward the right, with blurred edges. No photographs, logos or icons.
Slide 33
Increasing use of stablecoins demonstrates / demand for a digital dollar / Stablecoins / Total / Stablecoin / Supply / $200B / $150B / $100B / $50B / $0B / DAI / BUSD / USDC / USDT / 1 Jan 2020 / 1 Jul 2020 / 1 Jan 2021 / 1 Jul 2021 / 1 Jan 2022 / Source: CoinGecko / Data is as of 5/12/2022. / Only includes stablecoins that are / believed to be fully collateralized. / 33 / ©2022 Andreessen Horowitz. All rights reserved worldwide.
Visuals: One chart: a stacked area chart titled Total Stablecoin Supply (side label reads Stablecoins above the legend). Y-axis: stablecoin supply in US dollars billions, labelled $0B to $200B in $50B steps with light grey horizontal gridlines at each step. X-axis: dates labelled 1 Jan 2020, 1 Jul 2020, 1 Jan 2021, 1 Jul 2021, 1 Jan 2022, with faint vertical gridlines at those dates; the series runs from about Jan 2020 to about May 2022. Series stacked bottom to top: USDT (pale yellow to pale orange gradient, left to right), USDC (light blue), BUSD (purple), DAI (teal). Printed values: none; estimates: USDT top about $3B in Jan 2020, about $22B at 1 Jan 2021, about $62B at 1 Jul 2021, about $83B at the right edge; total about $5B in Jan 2020, about $30B at 1 Jan 2021, about $100B at 1 Jul 2021, about $160B peak near early 2022 and about $155B at the right edge. Legend: horizontal row above the plot at top right with square swatches in order DAI, BUSD, USDC, USDT. No highlighted points.
Slides 34 to 56 continue in the full text file.
Download this deck
The hosted PDF of every library deck is free for readers of the SlideDeck Co newsletter. Join with your email and the viewer and download appear here.
Preparing a results presentation or business update of your own? The SlideDeck Co Standard Deck is a slide library for business reviews, updates and plans.







