
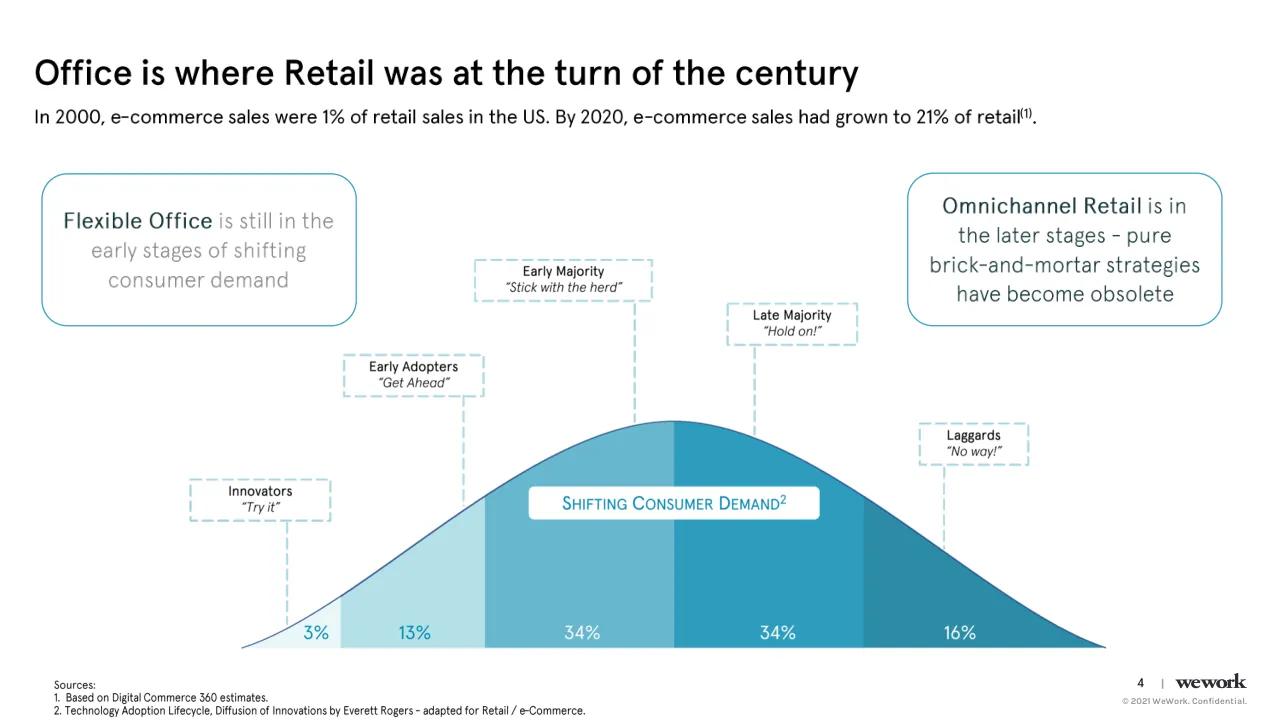
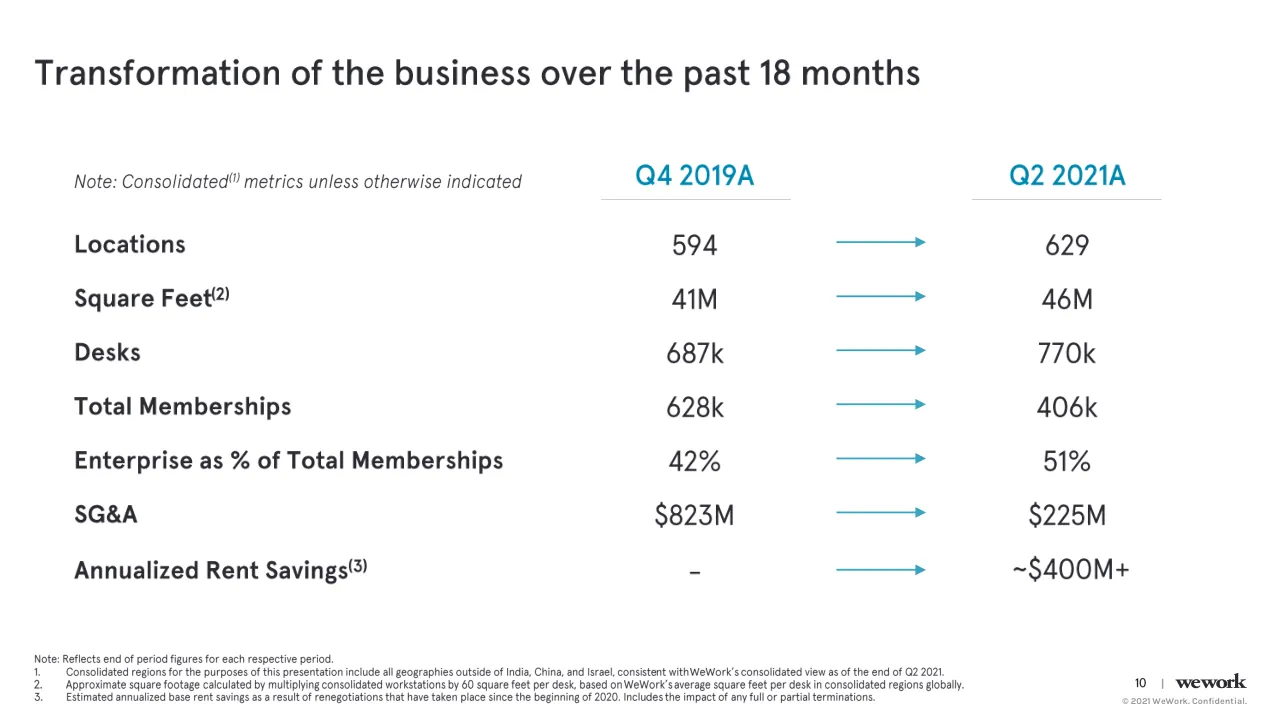
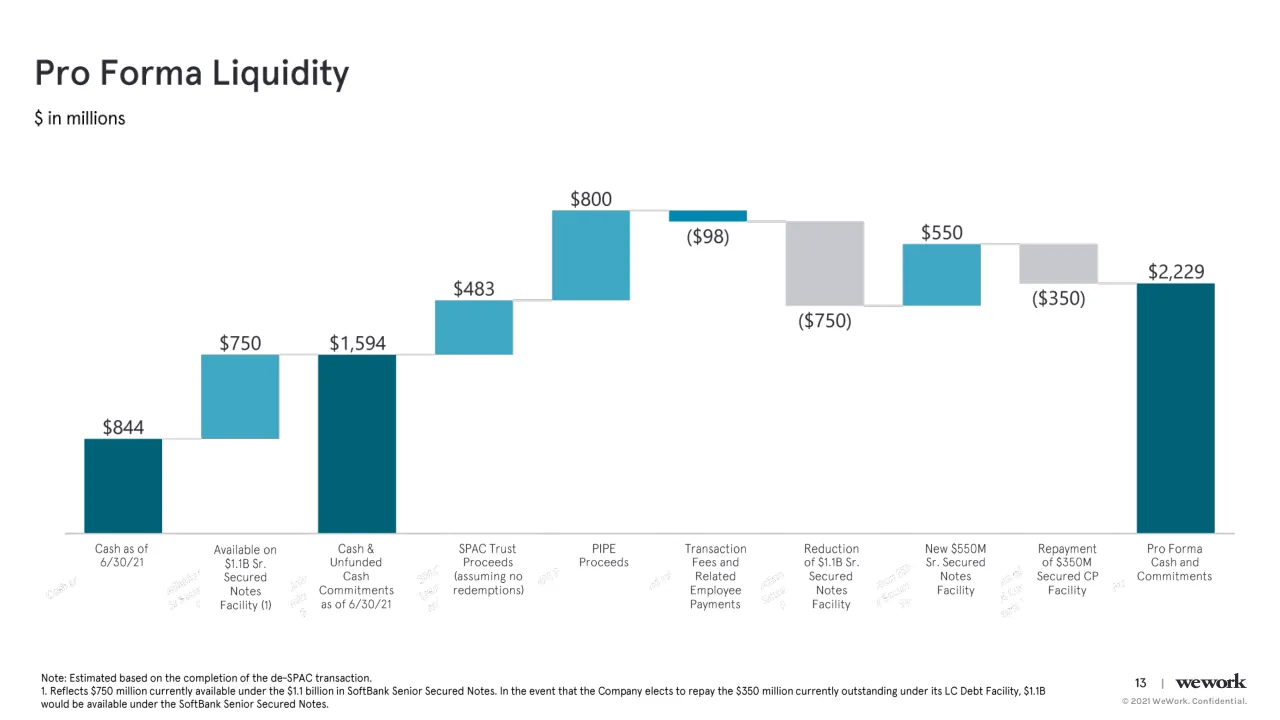
The deck opens with a long disclaimer covering forward-looking statements, non-GAAP measures and the proposed business combination with BowX Acquisition Corp, then moves to the Q2 2021 results title slide. The main body runs in order: WeWork's network footprint of locations, members and desks; market context comparing flexible office adoption to e-commerce in retail; Q2 sales performance and the All Access product; a partnership with Cushman & Wakefield; the business transformation over the past 18 months; Q2 revenue and financial results; pro forma liquidity; management projections for memberships, occupancy, revenue and Adjusted EBITDA; market share by city; and finally methodology, non-GAAP definitions and additional information. Slides that repay study include the network overview, the market context slide that frames the argument with a clear analogy, the 18-month transformation comparison and the pro forma liquidity bridge. The closing is mostly legal and reference material rather than a call to action.
Slides worth studying
Questions about this deck
How many slides does the WeWork Q2 2021 results deck have?
The WeWork Q2 2021 results deck has 19 slides. Slide 1 is the Q2 2021 RESULTS title slide, and slide 2 begins the disclaimer.
What does the WeWork deck say about its network of locations, desks and memberships?
Slide 4 reports 763 locations, 937k desks and 517k memberships globally. For consolidated operations, it reports 629 locations, 770k desks and 406k memberships as of the end of Q2 2021.
What revenue does the WeWork deck report for Q2 2021?
Slide 12 states revenue of $593 million in Q2 2021, with monthly revenue of $187m in April, $197m in May and $209m in June. It shows $215m for July as preliminary and says the company is on pace to achieve $650 to 700 million in Q3 2021.
What does the WeWork deck say about the Cushman & Wakefield partnership?
Slide 10 describes a partnership covering portfolio management, a platform for corporate clients, and facilities management services in select regions. It says Cushman & Wakefield would provide up to $150M in a backstop equity facility in potential discussions, and that the material terms are non-binding and subject to final documentation.
Details
- Company: WeWork
- Year: 2021
- Type: Investor presentation
- Industry: Flexible workspace
- Pages: 19
More from WeWork
All WeWork decks in the library
Review score: 6 out of 10, Needs substantial work
Presentation quality, judged with the SlideDeck Co review heuristic. Ask, evidence and idea merit are not rated here.
The core story is recoverable and several slides are well made: the retail analogy on slide 5, the before and after table on slide 11, and the clean KPI tiles on slide 7. But the deck is a filing-style earnings document, and the two full-page disclaimers (slides 2 and 3) sit before any content, in type too small to read. Slide titles are mostly topic labels rather than findings, and slide 14 has ghosted, garbled duplicate axis labels under the waterfall that look like a rendering fault. The closing is legal text with no summary or takeaway, and slide 11 shows memberships falling from 628k to 406k without any framing on the page.
Worth keeping: Keep the retail adoption analogy on slide 5, the large-number KPI tiles on slides 7 and 12, and the consistent teal palette and footer system.
Most useful repair: Remove the ghost text under the waterfall on slide 14, move the disclaimers to the back, and rewrite topic titles on slides 7, 9, 13 and 14 as the finding each page should leave.
What would change the score: I would add a summary slide of the key numbers and next step after slide 17, and cut slide 10's weak logo layout and the dense small text on slides 2, 3, 18 and 19 to an appendix.
Confidence medium. 19 of 19 pages inspected on contact sheets, 4 at readable size. Reviewed 2026-11-08. Model-assisted review (claude-sonnet-5-5).
Full text of the slides (19 slides)
Every slide's words and a description of its charts and images, so the deck can be searched and rebuilt. Also available as Markdown.
Slide 1
Q2 2021 RESULTS
wework
© 2021 WeWork. Confidential.
Visuals: Photograph: a coworking lounge interior in one-point perspective, shown full-bleed on the right 61.7% of the slide and not cropped at top or bottom. Foreground: two pairs of deep blue upholstered armchairs with blue cushions, a grey-brown herringbone throw draped over the left chair, and a light oak rectangular coffee table on a tan woven rug holding a glass vase of orange tulips and stacked books. Midground: a long light oak table with cane-backed chairs with black seats, and a row of black bar stools at a light wooden counter on the left with a glass drink dispenser. Background: tall arched white windows with black iron balconies, a large broad-leaf green plant on the right and a smaller potted plant in the centre. Ceiling: raw grey concrete with exposed silver ductwork, a perforated metal cable tray and pendant cylinder lights. Lighting: soft, even daylight from the windows with warm interior fill. Dominant colours: blue #2F4F7F, tan #B89B7A, white #F2F2F0, concrete grey #BDBDBA and green #3E7A3A. Overlay or tint: none. Logo: the wework wordmark in a dark charcoal #2B2B33 heavy serif lowercase, centred in the left panel. Hairlines: two thin vertical light grey #E0E0E0 rules, about 1 px wide, at x about 19.2%, from y 0 to 8.5%, y 21.5 to 39.3% and y 58.2 to 100%.
Slide 2
Disclaimer
Confidentiality and Disclosures
This presentation has been prepared for use by WeWork Inc. ("WeWork" or the "Company") and BowX Acquisition Corp. ("BowX") in connection with their proposed business combination. This presentation is for information purposes only and is being provided to you solely in your capacity as a potential investor in considering an investment in BowX and may not be reproduced or redistributed, in whole or in part, without the prior written consent of WeWork and BowX. Neither WeWork nor BowX makes any representation or warranty as to the accuracy or completeness of the information contained in this presentation. The information in this presentation and any oral statements made in connection with this presentation is subject to change and is not intended to be all-inclusive or to contain all the information that a person may desire in considering an investment in BowX and is not intended to form the basis of any investments decision in BowX. This presentation does not constitute either advice or a recommendation regarding any securities. You should consult your own legal, regulatory, tax, business, financial and accounting advisors to the extent you deem necessary, and must make your own decisions and perform your own independent investment and analysis of an investment in BowX and the transactions contemplated in this presentation.
No Offer
This presentation and any oral statements made in connection with this presentation shall neither constitute an offer to sell nor the solicitation of an offer to buy any securities, or the solicitation of any proxy, vote, consent or approval in any jurisdiction in connection with the proposed business combination, nor shall there be any sale of securities in any jurisdiction in which the offer, solicitation or sale would be unlawful prior to the registration or qualification under the securities laws of any such jurisdictions. Investment in any securities described herein has not been approved or disapproved by the SEC or any other regulatory authority nor has any authority passed upon or endorsed the merits of the offering or the accuracy or adequacy of the information contained herein. This communication is restricted by law; it is not intended for distribution to, or use by any person in, any jurisdiction where such distribution or use would be contrary to local law or regulation.
Forward-Looking Statements
This presentation supersedes and supplements any prior presentation and any oral or written communication with respect to WeWork and its business. This presentation contains "forward-looking statements", including statements about estimated and projected business, operational and financial metrics (including profitability, liquidity and cash flow), plans (including WeWork's five-year strategic and financial plan), goals, targets, objectives and other information for future or recently completed periods. These statements are often, but not always, made through the use of words or phrases such as "may", "should", "could", "predict", "potential", "believe", "will likely result", "expect", "continue", "will", "anticipate", "become", "seek", "estimate", "intend", "aim," "plan", "projection", "would," "outlook" and "goal", or the negative version of those words or phrases or other comparable words or phrases of a future or forward-looking nature. These forward-looking statements are not historical facts, and are based on current expectations, estimates and projections about WeWork's industry as well as certain assumptions, whether or not identified in this presentation, made by management of WeWork and BowX, many of which, by their nature, are inherently uncertain and beyond our control and are not predictions of actual performance. These forward-looking statements are provided for illustrative purposes only and are not intended to serve as, and must not be relied on by any investor as, a guarantee, an assurance, a prediction or a definitive statement of fact or probability. It is not possible for WeWork and BowX to predict all risks, nor can WeWork and BowX assess the impact of all factors on the business or the extent to which any factor, or combination of factors, including but not limited to the impact of the COVID pandemic, may cause actual results to differ materially from those contained in any forward-looking statements made. You should carefully consider the risks and uncertainties described in the "Risk Factors" section of BowX's registration statement on Form S-1, the proxy statement/prospectus on Form S-4 (the "Proxy Statement") relating to the business combination, which as filed by BowX with the Securities and Exchange Commission (the "SEC") and other documents filed by BowX from time to time with the SEC. These filings identify and address other important risks and uncertainties that could cause actual events and results to differ materially from those contained in the forward-looking statements. In light of these risks, uncertainties and assumptions, the future events, estimates, projections, goals, targets, plans and trends discussed in this presentation, and our future levels of activity and performance, may not occur and actual results could differ materially and adversely from those anticipated or implied in the forward-looking statements. Any forward-looking statement speaks only as of the date on which it is made, and neither WeWork nor BowX undertake any obligation to publicly update or revise any forward-looking statement, whether as a result of new information, future developments or otherwise, except as required by law. Neither WeWork nor BowX gives any assurance that either WeWork or BowX will achieve its expectations.
Use of Data
This presentation contains information concerning WeWork's solutions and WeWork's industry, including market size and growth rates of the markets in which WeWork participates, that are based on industry surveys and publications or other publicly available information, other third-party survey data and research reports commissioned by WeWork and its internal sources. This information involves many assumptions and limitations, there can be no guarantee as to the accuracy or reliability of such assumptions and you are cautioned not to give undue weight to this information. Further, no representation is made as to the reasonableness of the assumptions made within or the accuracy or completeness of any projections or modeling or any other information contained herein. Any data on past performance or modeling contained herein is not an indication as to future performance. Neither WeWork nor BowX have independently verified this third-party information. Similarly, other third-party survey data and research reports commissioned by WeWork or BowX, while believed by to be reliable, are based on limited sample sizes and have not been independently verified by WeWork or BowX. In addition, projections, assumptions, estimates, goals, targets, plans and trends of the future performance of the industry in which WeWork operates, and its future performance, are necessarily subject to uncertainty and risk due to a variety of factors, including those described above. These and other factors could cause results to differ materially from those expressed in the estimates made by independent parties and by WeWork and BowX. WeWork and BowX assume no obligation to update the information in this presentation.
Investors and security holders of BowX and WeWork are urged to read the proxy statement/prospectus and other relevant documents that have been and will be filed with the SEC carefully and in their entirety as and when they become available because they contain important information about the proposed business combination.
Investors and security holders will be able to obtain free copies of the Proxy Statement and other documents containing important information about BowX and WeWork through the website maintained by the SEC at www.sec.gov. Copies of the documents filed with the SEC by BowX can be obtained free of charge by directing a written request to BowX at Murray Rode ([email protected]) 2400 Sand Hill Rd Suite 200, Menlo Park, CA 94025.
1
|
wework
© 2021 WeWork. Confidential.
Visuals: none. The thin grey rules in the measurement list are text-line artefacts of the body copy, not graphic elements; there are no photographs, charts, icons or logos other than the small wework wordmark in the footer, which is a logo in dark grey (#3A3A3A) letterforms.
Slide 3
Disclaimer (cont’d)
Company Projections / All projections, estimates, goals, targets, plans, trends or other statements with respect to future results or future events in this presentation are forward-looking statements that are based on WeWork's management estimates and assumptions (including, without limitation regarding average occupancy, estimated expenses, estimated revenues and satisfaction of financing condition), that are inherently subject to significant uncertainties and contingencies, some of which may not materialize or may change, and are subject to risks and uncertainties over which WeWork and BowX have no control or ability to predict. Unanticipated events may occur that could affect the outcome of such projections, estimates, goals, targets, plans, trends and other statements. You must make your own determinations as to the reasonableness of these projections, estimates, goals, targets, plans, trends and other statements and should also note that if one or more estimates change, or one or more assumptions are not met, or one or more unexpected events occur, the performance and results set forth in such projections, estimates, goals, targets, plans, trends and other statements may not be achieved. We can give no assurance as to future operations, performance, results or events. The inclusion of financial projections, estimates and targets in this presentation should not be regarded as an indication that WeWork and BowX, or their representatives, considered or consider the financial projections, estimates and targets to be a reliable prediction of future events.
Use of Non-GAAP Financial Metrics / This presentation includes certain financial measures not presented in accordance with generally accepted accounting principles in the United States ("GAAP"), including Adjusted EBITDA and Adjusted EBITDA margin (including on a forward-looking basis). These financial measures are not measures of financial performance in accordance with GAAP and may exclude items that are significant in understanding and assessing our financial results. Therefore, these measures should not be considered in isolation or as an alternative to net loss or other measures of profitability, liquidity or performance under GAAP. You should be aware that our presentation of these measures may not be comparable to similarly titled measures used by other companies, which may be defined and calculated differently. WeWork believes that these non-GAAP measures of financial results (including on a forward-looking basis) provide useful supplemental information to investors about WeWork. WeWork's management uses forward-looking non-GAAP measures to evaluate WeWork's projected financials and operating performance. / Reconciliations of historical non-GAAP measures to their most directly comparable GAAP counterparts are included in the Appendix to this presentation. Additionally, to the extent that forward-looking non-GAAP financial measures are provided, they are presented on a non-GAAP basis without reconciliations of such forward-looking non-GAAP measures due to the inherent difficulty in forecasting and quantifying certain amounts that are necessary for such reconciliations.
Preliminary Financial Information / This presentation includes certain preliminary unaudited financial information for the month of July that is based solely on WeWork's management's estimates, reflecting currently available preliminary information, and remains subject to WeWork's consideration of subsequent events. WeWork's independent registered public accounting firm has not audited or reviewed, and does not express an opinion with respect to, this financial information. WeWork's final consolidated financial results for the three months ended September 30, 2021, may materially differ from the estimates and the interim balances set forth in this presentation. Such estimates constitute forward-looking statements and are subject to risks and uncertainties, including those described under "Forward-Looking Statements."
China, India, and Israel / In some instances, this presentation includes operating metrics (including number of locations or workstations) relating to WeWork's investments and operations in China, India, and Israel. However, the results of WeWork's operations in China, India, and Israel are not reflected in the WeWork financial statements and projections set forth in this presentation, as such operations are not conducted through consolidated subsidiaries or controlling interests of WeWork. Unless otherwise explicitly specified in this presentation, China, India, and Israel related metrics are excluded from all calculations.
Participation in Solicitation / WeWork and BowX and their respective directors and executive officers, under SEC rules, may be deemed to be participants in the solicitation of proxies of BowX's shareholders in connection with the proposed business combination. Investors and security holders may obtain more detailed information regarding the names and interests in the proposed business combination of BowX's directors and officers in BowX's filings with the SEC, including BowX's registration statement on Form S-1, which was originally filed with the SEC on July 17, 2020. To the extent that holdings of BowX's securities have changed from the amounts reported in BowX's registration statement on Form S-1, such changes have been or will be reflected on Statements of Change in Ownership on Form 4 filed with the SEC. Information regarding the persons who may, under SEC rules, be deemed participants in the solicitation of proxies to BowX's shareholders in connection with the proposed business combination is set forth in the Proxy Statement/prospectus on Form S-4 for the proposed business combination, as filed by BowX with the SEC.
Trademarks / This presentation contains trademarks, service marks, trade names and copyrights of WeWork and other companies, which are the property of their respective owners.
2
© 2021 WeWork. Confidential.
Slide 4
WeWork’s network today
Leading brand-name flexible workplace provider with global infrastructure in-place to scale as occupancy rebounds
GLOBAL
763
LOCATIONS
937k
DESKS
517k
MEMBERSHIPS
CONSOLIDATED(1)
629
LOCATIONS
770k
DESKS
406k
MEMBERSHIPS
Global Customer Base
amazon
MERCK
Microsoft
salesforce
accenture
BANK OF AMERICA
Global Landlord Partners
CUSHMAN & WAKEFIELD
Brookfield Properties
FUNO
bxp Boston Properties
CIM
STARWOOD CAPITAL GROUP
vanke
Ivanhoé Cambridge
The Blackstone Group
TISHMAN SPEYER
3
wework
© 2021 WeWork. Confidential.
1. As of the end of Q2 2021, “consolidated” regions include all geographies with WeWork locations outside of China, India, and Israel.
Visuals: Photograph-free infographic. (1) Map: a flat light-blue world map (continents only, no borders) with about 40 translucent teal circular bubbles of varying diameters marking cities, densest over North America, Western Europe, East Asia and Australia; no legend or axis. (2) Six stat boxes in two rows and three columns, each a white rounded rectangle with a 1 pt teal outline containing a large teal number over a small grey uppercase label: row 1 (GLOBAL) 763 LOCATIONS, 937k DESKS, 517k MEMBERSHIPS; row 2 (CONSOLIDATED(1)) 629 LOCATIONS, 770k DESKS, 406k MEMBERSHIPS. (3) Global Customer Base logo grid, 3 columns by 3 rows, grey monochrome logos: amazon wordmark with smile arrow; FACEBOOK wordmark; Google wordmark; MERCK wordmark with symbol; Microsoft wordmark with four-square symbol; Pinterest round P icon; salesforce cloud logo; accenture wordmark with chevron; Bank of America wordmark with flag-like stripes. (4) Global Landlord Partners logo grid, 4 columns by 3 rows, grey logos: Cushman & Wakefield with building-skyline mark; Brookfield Properties; FUNO letterspaced in a grey box; bxp Boston Properties; CIM; Starwood Capital Group grey square badge with star; vanke; Ivanhoé Cambridge roundel; The Blackstone Group with black bar; TISHMAN SPEYER. (5) wework wordmark, black lowercase bold.
Slide 5
Office is where Retail was at the turn of the century
In 2000, e-commerce sales were 1% of retail sales in the US. By 2020, e-commerce sales had grown to 21% of retail(1).
Flexible Office is still in the / early stages of shifting / consumer demand
Omnichannel Retail is in / the later stages - pure / brick-and-mortar strategies / have become obsolete
Innovators / “Try it”
Early Adopters / “Get Ahead”
Early Majority / “Stick with the herd”
Late Majority / “Hold on!”
Laggards / “No way!”
SHIFTING CONSUMER DEMAND(2)
3%
13%
34%
34%
16%
Sources:
1. Based on Digital Commerce 360 estimates.
2. Technology Adoption Lifecycle, Diffusion of Innovations by Everett Rogers - adapted for Retail / e-Commerce.
4
|
wework
© 2021 WeWork. Confidential.
Visuals: Diagram: a Technology Adoption Lifecycle bell curve, filled as five adjacent segments, with no axes or numeric scale. Segments left to right: 3% (very pale teal, far left tail), 13% (light teal), 34% (medium teal, labelled Early Majority region), 34% (brighter teal), 16% (dark teal tail on right). Each segment carries its percentage in white-outlined teal numerals near the baseline, centred in the segment (about 88% from the top). A thin dark blue-grey outline (#3A5A8C, about 1 px) traces the curve over the top of the segments. Five dashed callout boxes (pale teal #A8DDE6 dashed border, about 1 px, white fill, sharp corners) sit above the curve, each joined by a vertical dashed pale teal leader line down to the curve: Innovators 'Try it' (leader to the 3% tail), Early Adopters 'Get Ahead' (leader to the 13% boundary), Early Majority 'Stick with the herd' (leader to curve crest above 34% segment), Late Majority 'Hold on!' (leader to right of crest), Laggards 'No way!' (leader down to the 16% tail). Central label: white rounded rectangle with teal SHIFTING CONSUMER DEMAND superscript 2, sitting across the boundary between the two middle segments. Two rounded-rectangle text callouts with teal outlines are not part of the diagram. Photographs: none. Logos: wework wordmark, bottom right, black.
Slide 6
Flexible office space was expected to reach critical mass over the next
decade; COVID-19 accelerated those expectations
U.S. Flexible Workspace Penetration(1)
As a percentage of all 3.5B office supply RSF
30.0%2
22.2%1
13.3%1
6.5%1
2.0%1
30%
20%
10%
0
2010
2015
2020
2025
2030
Pre-Covid (Low) Pre-Covid (Mid) Pre-Covid (High) Post-Covid
1. CBRE “Let’s Talk About Flex” (2019), growth is in terms of US RSF from 2019 (actual) to 2030 (expected)
2. JLL “Covid The impact of COVID-19 on flexible space” (2020)
5 | wework
© 2021 WeWork. Confidential.
Visuals: Chart: line chart titled 'U.S. Flexible Workspace Penetration(1)' with subtitle 'As a percentage of all 3.5B office supply RSF'. Y-axis: 0 to 30%, gridlines absent, tick labels 0, 10%, 20%, 30%. X-axis: years 2010 to 2030, tick labels 2010, 2015, 2020, 2025, 2030. Four series: Pre-Covid (Low) light steel blue, ends at 6.5% in 2030; Pre-Covid (Mid) medium blue, ends at 13.3% in 2030; Pre-Covid (High) dark navy blue, ends at 22.2% in 2030; Post-Covid orange, starts at 2.0% in 2020 and rises steeply to about 24% by 2026 then flattens, ending at 30.0% in 2030 with superscript 2. All pre-Covid series start near 0 in 2010 and converge at about 2.0% in 2020 (value at 2020 labelled 2.0% with superscript 1). Post-Covid is the highlighted series in orange; the others are blues. Legend below the x-axis in one row: Pre-Covid (Low), Pre-Covid (Mid), Pre-Covid (High), Post-Covid, each with a short line swatch. Superscripts 1 and 2 denote footnote references. Chart has no photographs.
Slide 7
Q2 Sales performance
Consolidated operations
98k
new desk sales
5.9m
square feet sold(1)
22 mo.
average commitment length(2)
51%
enterprise as a % of total memberships
52%
total occupancy(3)
57%
total occupancy including “signed not occupied” memberships(4)
1. Assuming 60 square feet per desk sold
2. Commitment length represents base contract terms, excluding the impact of any extension and / or termination options. The commitment lengths disclosed may include periods for which members have an option to / terminate their commitments with a less than 10% penalty.
3. Including physical memberships and All Access memberships
4. Includes an incremental 40k net memberships that are already contracted to move in by year end as of August 12, bringing total sold memberships to date of 446k.
6 | wework
© 2021 WeWork. Confidential.
Visuals: Six flat pale-aqua rectangles (#E9F7F9), no border, no shadow, square corners, acting as KPI cards. Each card holds a large teal bold numeric figure with a label below. Card 1 (top-left): '98k' over 'new desk sales'. Card 2 (top-middle): '5.9m' over 'square feet sold(1)'. Card 3 (top-right): '22 mo.' over 'average commitment length(2)'. Card 4 (bottom-left): '51%' over 'enterprise as a % of total memberships'. Card 5 (bottom-middle): '52%' over 'total occupancy(3)'. Card 6 (bottom-right): '57%' over 'total occupancy including “signed not occupied” memberships(4)'. No charts, photos or icons; the only logo is the wework wordmark at bottom-right in black serif-style lettering.
Slide 8
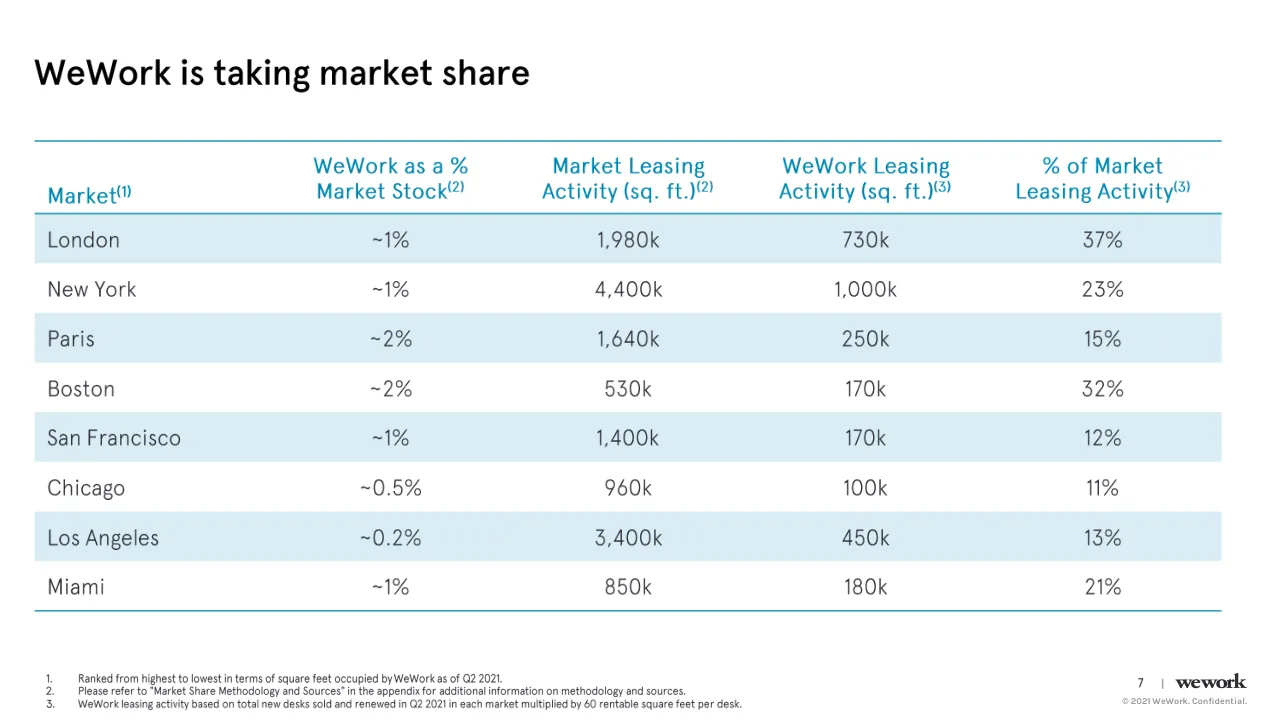
WeWork is taking market share
Market(1) / WeWork as a % Market Stock(2) / Market Leasing Activity (sq. ft.)(2) / WeWork Leasing Activity (sq. ft.)(3) / % of Market Leasing Activity(3)
London / ~1% / 1,980k / 730k / 37%
New York / ~1% / 4,400k / 1,000k / 23%
Paris / ~2% / 1,640k / 250k / 15%
Boston / ~2% / 530k / 170k / 32%
San Francisco / ~1% / 1,400k / 170k / 12%
Chicago / ~0.5% / 960k / 100k / 11%
Los Angeles / ~0.2% / 3,400k / 450k / 13%
Miami / ~1% / 850k / 180k / 21%
1. Ranked from highest to lowest in terms of square feet occupied by WeWork as of Q2 2021.
2. Please refer to "Market Share Methodology and Sources" in the appendix for additional information on methodology and sources.
3. WeWork leasing activity based on total new desks sold and renewed in Q2 2021 in each market multiplied by 60 rentable square feet per desk.
7 | wework
© 2021 WeWork. Confidential.
Visuals: One table, no photographs, charts or icons. Columns: Market(1) (left-aligned, row labels); WeWork as a % Market Stock(2) (centred); Market Leasing Activity (sq. ft.)(2) (centred); WeWork Leasing Activity (sq. ft.)(3) (centred); % of Market Leasing Activity(3) (centred). Rows in order: London, ~1%, 1,980k, 730k, 37%; New York, ~1%, 4,400k, 1,000k, 23%; Paris, ~2%, 1,640k, 250k, 15%; Boston, ~2%, 530k, 170k, 32%; San Francisco, ~1%, 1,400k, 170k, 12%; Chicago, ~0.5%, 960k, 100k, 11%; Los Angeles, ~0.2%, 3,400k, 450k, 13%; Miami, ~1%, 850k, 180k, 21%. Alternate rows London, Paris, San Francisco and Los Angeles carry a pale blue band (#3FA7C3 at 20% opacity, rendering about #D9EDF3); New York, Boston, Chicago and Miami are white. No highlighted points.
Slide 9
All Access
All Access offers a proven value proposition that has already seen strong adoption from major Enterprise clients and SMBs alike
Proven Demand
20k +
All Access & Virtual
Memberships as of
June 2021
Compelling Value Proposition
Ultimate Flexibility
On Demand (pay-as-you-go) or monthly
subscription that provides access to
global network of locations
Drives Occupancy
Allows WeWork to drive occupancy
beyond physical capacity levels across
portfolio based on utilization
projections
High Margins
Significant incremental margins given
subscription-based model on top of
traditional leased business
Distributors & Affinity Partners
8
|
wework
© 2021 WeWork. Confidential.
Visuals: Icons: three thin cyan line icons in the middle column. (1) A globe inside a circular arrow with a small dot, beside 'Ultimate Flexibility'. (2) Three ascending stepped arrows with an upward arrow at the top right, beside 'Drives Occupancy'. (3) A dollar sign in a square frame with a bracket-like outline, beside 'High Margins'. All icons are outlined in #1B9AD6 with stroke about 2px, no fill, no shadow. Logos: (a) American Express logo, a solid blue #006FCF square with white upper-case text 'AMERICAN EXPRESS' stacked on two lines, placed in the top-left of the right grid. (b) Y Combinator logo, an orange #F26522 square with a white 'Y' next to orange 'Combinator' wordmark in lowercase sans, top-right of the grid. (c) Uber wordmark in solid black #000000 bold sans lowercase, middle-left of the grid. (d) Vensure Employer Services logo: a stylised dark grey X-shaped mark with a red #E0412B dot above, 'Vensure' in dark grey #3A3A3A and 'Employer Services' in red beneath, middle-right of the grid. (e) Brex logo: a black geometric bracket mark followed by black 'Brex' wordmark, bottom centre of the grid. (f) WeWork wordmark in black serif-like lowercase bold, bottom right footer. No photographs, charts or tables.
Slide 10
Cushman & Wakefield transaction
CUSHMAN & WAKEFIELD logo
X
wework logo
The partnership underscores the confidence from / the market in both WeWork’s business and / brand, while adding incremental value to the / WeWork balance sheet and providing a new sales / channel to drive additional revenue.
Portfolio Management: Will enable WeWork to take and operate incremental space from C&W’s corporate clients and landlord partners in attractive markets driving additional revenue.
Platform: Will enable C&W corporate clients to access WeWork’s proprietary platform of workplace management software.
Facilities Management Services: C&W to become WeWork's facilities management provider in select regions
Strategic Investment: In discussions regarding a potential transaction where C&W would provide up to $150M in a backstop equity facility
Note: The material terms of the partnership are non-binding and subject to finalization of definitive documentation.
© 2021 WeWork. Confidential.
Visuals: Two logos and one separator. (1) Cushman & Wakefield logo: a red (#E4002B-like) stepped building-skyline mark of vertical bars rising to a tall block at the right, followed by the words CUSHMAN & WAKEFIELD in widely letter-spaced uppercase grey (#6D6E71-like) sans-serif, stacked on two lines. (2) A bold dark letter X in dark slate (#2B2D3A-like), centred between the logos. (3) WeWork wordmark: lowercase 'wework' in heavy black (#000000) high-contrast serif-style lettering, centred beneath the X. No photographs, charts or diagrams. The logos are not cropped and sit on the white background with no overlay.
Slide 11
Transformation of the business over the past 18 months
Note: Consolidated(1) metrics unless otherwise indicated
Q4 2019A
Q2 2021A
Locations
594
629
Square Feet(2)
41M
46M
Desks
687k
770k
Total Memberships
628k
406k
Enterprise as % of Total Memberships
42%
51%
SG&A
$823M
$225M
Annualized Rent Savings(3)
-
~$400M+
Note: Reflects end of period figures for each respective period.
1. Consolidated regions for the purposes of this presentation include all geographies outside of India, China, and Israel, consistent with WeWork's consolidated view as of the end of Q2 2021.
2. Approximate square footage calculated by multiplying consolidated workstations by 60 square feet per desk, based on WeWork's average square feet per desk in consolidated regions globally.
3. Estimated annualized base rent savings as a result of renegotiations that have taken place since the beginning of 2020. Includes the impact of any full or partial terminations.
10 | wework
© 2021 WeWork. Confidential.
Visuals: Seven plain horizontal arrows, one per metric row, each a thin line with a solid triangular arrowhead pointing right, running from about 65.4% to 72.3% of slide width at the vertical centre of each row, in teal-blue #1A9CC6. The arrows connect the Q4 2019A value to the Q2 2021A value on the same row. Two thin grey horizontal rules, one beneath each column header (Q4 2019A and Q2 2021A), in light grey #BDBDBD, about 0.1% of slide height thick. No photographs, charts or logos other than the small wework wordmark in the footer.
Slide 12
Q2 Revenue continues steady upward trajectory
$187m
April Revenue
$197m
May Revenue
$209m
June Revenue
$215m
July Revenue
(preliminary)
Revenue of $593 million in Q2 2021
On pace to achieve $650–700 million in Q3 2021
11
|
wework
© 2021 WeWork. Confidential.
Visuals: Four pale-teal rectangular KPI cards in a row, each with a large numeric value and a caption beneath: card 1 reads $187m with caption April Revenue; card 2 reads $197m with caption May Revenue; card 3 reads $209m with caption June Revenue; card 4 reads $215m with caption July Revenue (preliminary) and is highlighted by a dashed teal outline (about 3px dash, #007394) around the card. The cards are flat with square corners and no shadow. The wework wordmark is a small black serif logotype at bottom-right. No charts, photographs or icons.
Slide 13
Q2 Financial Results / 2Q 2021A / 2Q 2020A / Revenue / $593M / $882M / Adj EBITDA / ($449M) / ($438M) / Net Loss / ($923M) / ($1.1B) / Free Cash Flow / ($649M) / ($671M) / Cash & Cash Equivalents / $1.6B(1) / $4.1B(2) / Note: Please see “Non-GAAP Supplemental Measures” for more detailed discussion and explanations of the various non-GAAP financial measures cited in this release. / 1. Represents cash & cash equivalents as of 6/30/2021. Includes $844 million of available cash on hand and $750 million currently available under WeWork’s Senior Secured Notes facility. / 2. Represents cash & cash equivalents as of 6/30/2020. Includes approximately $700 million of available cash on hand, $100 million in cash commitments to JapanCo, as well as $2.2 billion in available Senior Unsecured notes and $1.1 billion in available Senior Secured notes facilities. / 12 / wework / © 2021 WeWork. Confidential.
Visuals: Table with 3 columns and 5 data rows plus a header row. Column 1 holds row labels: Revenue, Adj EBITDA, Net Loss, Free Cash Flow, Cash & Cash Equivalents, in blue. Column 2 is headed 2Q 2021A and holds $593M, ($449M), ($923M), ($649M), $1.6B(1). Column 3 is headed 2Q 2020A and holds $882M, ($438M), ($1.1B), ($671M), $4.1B(2). Superscript (1) and (2) are footnote markers. Values are negatives shown in parentheses. Each header has a thin grey underline beneath it. Horizontal grey hairline rules separate the rows, with a rule under the last row. No chart, photograph or icon. The wework logo is a small black lowercase wordmark at bottom right.
Slide 14
Pro Forma Liquidity / $ in millions / $844 / $750 / $1,594 / $483 / $800 / ($98) / ($750) / $550 / ($350) / $2,229 / Cash as of / 6/30/21 / Available on / $1.1B Sr. / Secured / Notes / Facility (1) / Cash & / Unfunded / Cash / Commitments / as of 6/30/21 / SPAC Trust / Proceeds / (assuming no / redemptions) / PIPE / Proceeds / Transaction / Fees and / Related / Employee / Payments / Reduction / of $1.1B Sr. / Secured / Notes / Facility / New $550M / Sr. Secured / Notes / Facility / Repayment / of $350M / Secured CP / Facility / Pro Forma / Cash and / Commitments / Note: Estimated based on the completion of the de-SPAC transaction. / 1. Reflects $750 million currently available under the $1.1 billion in SoftBank Senior Secured Notes. In the event that the Company elects to repay the $350 million currently outstanding under its LC Debt Facility, $1.1B / would be available under the SoftBank Senior Secured Notes. / 13 / | / wework / © 2021 WeWork. Confidential.
Visuals: Vertical waterfall chart, no chart title, no visible axes or gridlines, with a horizontal baseline in light grey #BFBFBF running across the chart at about 74% of the height. Ten columns, left to right, with printed values: Cash as of 6/30/21 $844 (dark teal #035F78, starts at zero); Available on $1.1B Sr. Secured Notes Facility (1) $750 (light blue #3FA7C4, floats from $844 to $1,594); Cash & Unfunded Cash Commitments as of 6/30/21 $1,594 (dark teal #035F78, total from zero); SPAC Trust Proceeds (assuming no redemptions) $483 (light blue #3FA7C4, floats from $1,594 to $2,077); PIPE Proceeds $800 (light blue #3FA7C4, floats from $2,077 to $2,877); Transaction Fees and Related Employee Payments ($98) (deeper blue #0A7FA8, floats down from $2,877 to $2,779); Reduction of $1.1B Sr. Secured Notes Facility ($750) (light grey #C4C5CC, floats from $2,779 to $2,029); New $550M Sr. Secured Notes Facility $550 (light blue #3FA7C4, floats from $2,029 to $2,579); Repayment of $350M Secured CP Facility ($350) (light grey #C4C5CC, floats from $2,579 to $2,229); Pro Forma Cash and Commitments $2,229 (dark teal #035F78, total from zero). Values are printed above positive bars and below negative bars. Thin grey connector lines (#BFBFBF, about 1 px) join the top or bottom edge of each column to the next. No legend. No highlighted points beyond the colour difference between the dark totals, light increases, grey decreases and the deeper blue transaction-fee bar. Faint ghosted text fragments, which are not legible, sit behind some category labels.
Slide 15
Company Projections: Memberships and Workstation Assumptions
Physical Memberships
All Access Memberships
Core + New Leased ARPM
973k
907k
772k
591k
516k
$510
$494
$463
$494
$528
$547
134k
131k
67k
50k
7k
839k
776k
706k
541k
380k
516k
2019A
2020A
2021E
2022E
2023E
2024E
Physical Workstations: 697k 865k 730k 823k 894k 971k
Physical Occupancy: 74% 44% 74% 86% 87% 86%
Total Occupancy: 74% 45% 81% 94% 101% 100%
Source: Membership, workstation, occupancy, and ARPM assumptions set forth above were used as inputs in Management Projections filed 8/13/21. Metrics presented are for consolidated operations (all geographies with WeWork locations outside of China, India, and Israel) only.
14
|
wework
© 2021 WeWork. Confidential.
Visuals: Chart: stacked column chart combined with a dashed line, titled none on the slide (the rotated hidden axis title reads Memberships and Workstations (in Thousands) but is white on white and not visible). Categories on the x axis: 2019A, 2020A, 2021E, 2022E, 2023E, 2024E. No visible y-axis numbers or ranges; the hidden white axis labels run 0 to 1000 in steps of 100 on the left (in thousands) and $350 to $650 in steps of $50 on the right (ARPM). Series 1, Physical Memberships (teal #00889D, bottom segment): 2019A 516k, 2020A 380k, 2021E 541k, 2022E 706k, 2023E 776k, 2024E 839k. Series 2, All Access Memberships (light blue #4EA6F6, top segment): 2019A none shown, 2020A 7k, 2021E 50k, 2022E 67k, 2023E 131k, 2024E 134k. Total labels above bars: 2019A 516k, 2020A none printed, 2021E 591k, 2022E 772k, 2023E 907k, 2024E 973k. Line series, Core + New Leased ARPM (black dashed line, about 4px stroke, evenly spaced dashes): 2019A $510, 2020A $494, 2021E $463, 2022E $494, 2023E $528, 2024E $547, with each value printed as a black label above the line point. Legend: top-left, three entries stacked vertically: teal swatch with Physical Memberships, light blue swatch with All Access Memberships, black dashed line sample with Core + New Leased ARPM. Highlighted points: none. Baseline: thin light grey horizontal axis line at the bottom of the bars. Table below chart: columns are the row labels (left) and the six years (2019A to 2024E). Rows: Physical Workstations: 697k, 865k, 730k, 823k, 894k, 971k. Physical Occupancy: 74%, 44%, 74%, 86%, 87%, 86%. Total Occupancy: 74%, 45%, 81%, 94%, 101%, 100%. No photographs, logos other than the wework wordmark at bottom right, or icons.
Slide 16
Company Projections: Total Revenue and Adj. EBITDA
$ in millions
Total Revenue
$3,230
$3,210
$1,191
$1,464
$4,348
$5,650
$6,785
2019A
2020A
1H 2021A
2H 2021E
2022E
2023E
2024E
Adj. EBITDA
$1,996
$1,256
$243
($568)
($895)
($1,754)
($1,943)
2019A
2020A
1H 2021A
2H 2021E
2022E
2023E
2024E
Source: Management Projections as filed 8/13/21.
15
|
wework
© 2021 WeWork. Confidential.
Visuals: Two vertical bar charts side by side. Left chart: Total Revenue, $ in millions, seven grey bars (#8E8EA0) with printed value labels, categories 2019A, 2020A, 1H 2021A, 2H 2021E, 2022E, 2023E, 2024E, values $3,230, $3,210, $1,191, $1,464, $4,348, $5,650, $6,785; baseline is a thin grey horizontal axis line at about 78.9% height; no y-axis, no gridlines, no legend, no highlighted points; bars rise from the baseline and are heights proportional to value (2024E tallest). Right chart: Adj. EBITDA, $ in millions, seven teal bars (#3FA7C3) on a zero line (thin grey horizontal line at about 54.6% height) with printed labels, categories 2019A, 2020A, 1H 2021A, 2H 2021E, 2022E, 2023E, 2024E, values ($1,943), ($1,754), ($895), ($568), $243, $1,256, $1,996; negative bars hang below the zero line, positive bars rise above it; no y-axis, no legend, no highlighted points. Actual vs estimate distinguished only by the category suffix A or E. Logo: the 'wework' wordmark in bold black lowercase at bottom-right. No photographs or icons.
Slide 17
Market Share Methodology and Sources
Market / % Market Stock Source as of Q2 2021 / Market Leasing Activity in Q2 2021 Source
London / Total London commercial office square footage of 276m per Cushman & Wakefield estimate / London leasing activity of 1.98m square feet per DeVono Cresa Estimate
New York / Total Manhattan CBD commercial office square footage of 460m per Jones Lang LaSalle, published July 2021 / Manhattan leasing activity of 4.4m square feet in Q2 2021 per CoStar
Paris / Total Paris CBD commercial office square footage of 80m per Cushman estimate / Paris CBD estimated take-up of 1,640k square feet per Cushman & Wakefield Estimate
Boston / Total Boston commercial office square footage of 72m per Lincoln Property Company, published July 2021 / Boston CBD leasing activity of 528k square feet per Jones Lang LaSalle estimate
San Francisco / Total San Francisco commercial office square footage of 80m per Jones Lang LaSalle estimate / San Francisco estimated leasing activity of 1.4m square feet per Jones Lang LaSalle estimate
Chicago / Total Chicago CBD commercial office inventory of 140m square feet per Cushman & Wakefield Marketbeat Insights, published July 2021 / Chicago CBD leasing activity of 961k square feet per Cushman & Wakefield Marketbeat Insights, published July 2021
Los Angeles / Total Los Angeles commercial office square footage of 190m per Jones Lang LaSalle estimate / Los Angeles estimated leasing activity of 3.4m square feet per Jones Lang LaSalle estimate
Miami / Total Miami area commercial office inventory of 38.6m square feet per Blanca Commercial Real Estate estimate / Miami leasing activity of 852k square feet per Blanca Commercial Real Estate estimate
16 | wework
© 2021 WeWork. Confidential.
Visuals: A table with three columns and eight rows (one header row and seven data rows). Columns: Market; % Market Stock Source as of Q2 2021; Market Leasing Activity in Q2 2021 Source. Rows in order: London (276m per Cushman & Wakefield estimate; 1.98m leasing per DeVono Cresa Estimate); New York (460m per Jones Lang LaSalle, published July 2021; 4.4m leasing in Q2 2021 per CoStar); Paris (80m per Cushman estimate; 1,640k take-up per Cushman & Wakefield Estimate); Boston (72m per Lincoln Property Company, published July 2021; 528k leasing per Jones Lang LaSalle estimate); San Francisco (80m per Jones Lang LaSalle estimate; 1.4m leasing per Jones Lang LaSalle estimate); Chicago (140m square feet per Cushman & Wakefield Marketbeat Insights, published July 2021; 961k leasing per Cushman & Wakefield Marketbeat Insights, published July 2021); Los Angeles (190m per Jones Lang LaSalle estimate; 3.4m leasing per Jones Lang LaSalle estimate); Miami (38.6m square feet per Blanca Commercial Real Estate estimate; 852k leasing per Blanca Commercial Real Estate estimate). Shaded rows are London, Paris, San Francisco and Los Angeles; the other rows are white. Only the words Marketbeat Insights in the Chicago row are italic. No charts, photographs or logos appear apart from the wework wordmark in the footer.
Slide 18
Use of Non-GAAP Financial Measures
This presentation includes certain financial measures not presented in accordance with generally accepted accounting principles in the United States (“GAAP”), including Adjusted EBITDA, / Free Cash Flow (including on a forward-looking basis). These financial measures are not measures of financial performance in accordance with GAAP and may exclude items that are / significant in understanding and assessing our financial results. Therefore, these measures should not be considered in isolation or as an alternative to net loss or other measures of / profitability, liquidity or performance under GAAP. You should be aware that WeWork’s presentation of these measures may not be comparable to similarly titled measures used by other / companies, which may be defined and calculated differently. WeWork believes that these non-GAAP measures of financial results (including on a forward-looking basis) provide useful / supplemental information to investors about WeWork. WeWork’s management uses forward-looking non-GAAP measures to evaluate WeWork’s projected financials and operating / performance. Additionally, to the extent that forward-looking non-GAAP financial measures are provided, they are presented on a non-GAAP basis without reconciliations of such forward- / looking non-GAAP measures due to the inherent difficulty in forecasting and quantifying certain amounts that are necessary for such reconciliations.
Non-GAAP Financial Definitions
Adjusted Earnings Before Interest Expense, Income Tax, Depreciation, and Amortization (“Adjusted EBITDA”)
We supplement our GAAP results by evaluating Adjusted EBITDA, a non-GAAP measure. We define "Adjusted EBITDA" as net loss before income tax (benefit) provision, interest and other / (income) expense, depreciation and amortization expense, stock-based compensation expense, expense related to stock-based payments for services rendered by consultants, income or / expense relating to the changes in fair value of assets and liabilities remeasured to fair value on a recurring basis, expense related to costs associated with mergers, acquisitions, / divestitures and capital raising activities, legal, tax and regulatory reserves or settlements, significant legal costs incurred by the Company in connection with regulatory investigations and / litigation regarding the Company’s 2019 withdrawn initial public offering and the related execution of the SoftBank Transactions, as defined in Note 1 of the Notes to the Condensed / Consolidated Financial Statements included in our Quarterly Report, net of any insurance or other recoveries, significant non-ordinary course asset impairment charges and, to the extent / applicable, any impact of discontinued operations, restructuring charges, and other gains and losses on operating assets.
Free Cash Flow
Because of the limitations of Adjusted EBITDA, as noted above, we also supplement our GAAP results by evaluating Free Cash Flow, a non-GAAP measure. Free Cash Flow is defined as cash / flow from operating activities less cash purchases of property and equipment, each as presented in the Company's Condensed Consolidated Statements of Cash Flows calculated in / accordance with GAAP. Free Cash Flow is both a performance measure and a liquidity measure that provides useful information to management and investors about the amount of cash / generated by or used in the business. Free Cash Flow is also a key metric used internally by our management to develop internal budgets, forecasts and performance targets.
17
wework
© 2021 WeWork. Confidential.
Visuals: none apart from the small wework wordmark logo in the bottom-right corner, drawn in black bold lowercase serif lettering.
Slide 19
Other Information / Additional Information and Where to Find It / This communication relates to a proposed transaction between the WeWork Inc. (the “Company”) and BowX Acquisition Corp. (“BowX”). This communication is not a proxy statement or / solicitation of a proxy, consent or authorization with respect to any securities or in respect of the potential transaction and shall not constitute an offer to sell or a solicitation of an offer to / buy the securities of the Company, the combined company or BowX, nor shall there be any sale of any such securities in any state or jurisdiction in which such offer, solicitation, or sale / would be unlawful prior to registration or qualification under the securities laws of such state or jurisdiction. / No offer of securities shall be made except by means of a prospectus meeting the requirements of the Securities Act of 1933, as amended. BowX has filed a registration statement on Form / S-4 (the “S-4 registration statement”) with the Securities and Exchange Commission (the “SEC”), which includes a document that serves as a preliminary prospectus and proxy statement of / BowX, referred to as a proxy statement/prospectus. After the S-4 registration statement has been declared effective, a proxy statement/prospectus will be sent to all BowX shareholders. / BowX also will file other documents regarding the proposed transaction with the SEC. Before making any voting decision, investors and security holders of BowX are urged to read the S-4 / registration statement, the proxy statement/prospectus and all other relevant documents filed or that will be filed with the SEC in connection with the proposed transaction as they / become available because they will contain important information about the proposed transaction. Investors and security holders will be able to obtain free copies of the S-4 registration / statement, the proxy statement/prospectus and all other relevant documents filed or that will be filed with the SEC by BowX through the website maintained by the SEC at www.sec.gov. / Participants in Solicitation / BowX and its directors and executive officers may be deemed to be participants in the solicitation of proxies from BowX’s shareholders in connection with the proposed transaction. A list / of the names of the directors and executive officers of BowX and information regarding their interests in the business combination is set forth in BowX’s registration statement on Form S-1 / (Registration No. 333-239941) originally filed with the SEC on July 17, 2020. Additional information regarding the interests of such persons and other persons who may be deemed / participants in the solicitation are contained in the S-4 registration statement and the proxy statement/prospectus. You may obtain free copies of these documents as described in the / preceding paragraph. / 18 / © 2021 WeWork. Confidential.
Download this deck
The hosted PDF of every library deck is free for readers of the SlideDeck Co newsletter. Join with your email and the viewer and download appear here.
Preparing a results presentation or business update of your own? The SlideDeck Co Standard Deck is a slide library for business reviews, updates and plans.







